KFF designs, conducts and analyzes original public opinion and survey research on Americans’ attitudes, knowledge, and experiences with the health care system to help amplify the public’s voice in major national debates.
On April 2nd, the Supreme Court of the United States will hear oral arguments in Medina v. Planned Parenthood South Atlantic. The case addresses whether Medicaid beneficiaries can seek relief in federal court to enforce Medicaid’s “free-choice of provider provision,” which allows Medicaid beneficiaries to seek care from any provider that is qualified and willing to participate in the program. While the case focuses on this specific question, it has its origins in broader efforts by anti-abortion policymakers to exclude Planned Parenthood clinics from the Medicaid program and, ultimately, eliminate all federal payments to Planned Parenthood centers. In this brief, we describe the case, the Medicaid policies underlying it, and potential implications for Medicaid beneficiaries’ access to reproductive health services.
What is the case in front of the Supreme Court about?
The Supreme Court’s review of this case is limited to one question: Can a Medicaid beneficiary bring a civil action to enforce the Medicaid Act’s free choice of provider? This question is similar to one that the Court decided in 2023 (Health and Hospital Corp of Marion County v. Talevski ) when it ruled (7-2) that patients do have a private right of action to enforce certain conditions that federal Medicaid law imposes on states and health care providers. However, the current case involves a different provision of federal law relating to free choice of provider under the Medicaid Act. Planned Parenthood and the individual beneficiary who has brought this case take the position that Medicaid beneficiaries meet the requirements to sue in order to enforce the free choice of provider provision. The Trump administration has weighed in on the side of South Carolina, contending that Medicaid beneficiaries should not be permitted to bring an action to enforce this provision.
In 2018, South Carolina’s Governor McMaster (R) issued an executive order prohibiting any clinic that provides abortion care from participating in the state’s Medicaid program. The order states that the state funds used to reimburse providers could be used to indirectly subsidize abortion care even though Medicaid only pays for non-abortion family planning services. The executive order had a direct impact on the Planned Parenthood clinics that offer abortion services in the state (South Carolina limits abortion to up to six weeks of pregnancy) but also offer enrollees other Medicaid-covered services including contraceptive care and STI screening and treatment. The state has historically reimbursed these providers for the non-abortion medical care they provide to Medicaid enrollees just like it pays for all other medical care. The federal Hyde Amendment bans the use of federal funds (including Medicaid) from being used to pay for abortions unless the pregnancy is a result of rape or incest or endangers the life of the pregnant person.
States operate Medicaid programs under federal guidance, and one of the federal provisions of the Medicaid law is known as free choice of provider. This provision states that “A State plan for medical assistance must… provide that any individual eligible for medical assistance… may obtain such assistance from any institution, agency, community pharmacy, or person, qualified to perform the service or services required… who undertakes to provide him such services.” Additionally, because many states require Medicaid beneficiaries to enroll in managed care, limiting their care to a defined network of providers, federal law states that beneficiaries may seek care from any Medicaid provider for family planning services specifically, even those outside the plan network.
The larger context for this case involves how a state determines who is a qualified provider, even though the Supreme Court is more narrowly focusing on private right of action. The statute does not define the word “qualified,” but longstanding federal regulations, recognize states’ authority to “set reasonable standards relating to the qualifications of providers.” The final lines of the regulation say that States need not provide payments to providers with certain felony convictions. The regulations and a separate provision contemplate that “[i]n addition to any other authority, a State may exclude” any provider from Medicaid for certain reasons “for which the Secretary could exclude” the provider from participating in Medicaid.
In 2016, in a “Dear Medicaid Director letter” issued during the Obama administration, CMS wrote that states have the authority to set standards that providers must meet, but to disqualify a willing provider, the state must have a legitimate reason such as concerns about the fitness of the provider to meet the standards or evidence of fraud. It went on to say that states cannot target a specific provider and “The failure of a state to apply otherwise reasonable standards in an evenhanded manner may suggest such targeting.” CMS went on to say that “states may not deny qualification to family planning providers…solely because they separately provide…abortion or another service that the state does not approve of.” This letter was rescinded by the Trump administration in 2018. Whether it be through the Courts or through administrative actions, this issue will likely continue to be debated and legally challenged for the foreseeable future.
The Supreme Court, however, is only considering whether Medicaid beneficiaries have the right to bring a case to enforce their right to choose their provider. The Court is not considering whether South Carolina acted properly when it excluded Planned Parenthood from its Medicaid program, deeming them “unqualified” because they provide abortion services as well as other reproductive health care services. If the Supreme Court finds that Medicaid beneficiaries have the right to bring an action to enforce their right to choose any provider, the case will then go back down to the district court to determine whether South Carolina acted within its authority to exclude Planned Parenthood as a nonqualified provider. If the Supreme Court rules that Medicaid beneficiaries do not have a private right of action, then Planned Parenthood itself could appeal South Carolina’s decision that found them to be an unqualified provider.
How have courts ruled about private right of action for Medicaid beneficiaries in other cases?
A civil rights statute, Section 1983, has long provided a mechanism for individuals to enforce the rights provided to them under federal programs, including Medicaid. There is a long history of litigation related to private enforcement of the Medicaid Act. While courts have affirmed the authority for individuals to use Section 1983 to protect Medicaid rights, the Supreme Court has issued decisions that have narrowed this authority. Currently there is a three-pronged test (pursuant to the cases Blessing v Freestone (1997), Gonzaga University v. Doe (2002), and Health & Hosp. Corp of Marion County v. Talevski (2023)) based on legal precedent that courts use to evaluate whether a federal law establishes an enforceable right:
whether the plaintiff is an intended beneficiary of the statute;
whether the plaintiff’s asserted interests are specific enough to be enforced; and
whether the statute imposes a binding obligation on the State.
In Talevski, the most recent Supreme Court case to consider this right, the high court reaffirmed the holdings in Gonzaga that a statutory provision is enforceable under Section 1983 when the provision is “phrased in terms of the persons benefits” and contains “right-creating individual centric language with an unmistakable focus on the benefited class.”
Federal circuit courts havegenerally upheld private enforcement of rights for Medicaid enrollees. Before the Supreme Court Talevski ruling in 2023, there was a split among circuit court rulings. In 2019 there were four circuit court opinions that all ruled in favor of beneficiaries’ right to enforce Medicaid provisions. However, in 2020, three of four circuit court decisions did not rule in favor of Medicaid enrollees, including one decision from the 5th Circuit Court of Appeals which ruled in favor of Texas’ decision to exclude Planned Parenthood. Until the Medina case, the Supreme Court had previously refused to review multiple cases in which Planned Parenthood patients were found to have an enforceable right. An earlier version of the Medina case, Planned Parenthood South Atlantic v. Baker, went up to the Supreme Court but was denied review. This is the first time the current configuration of the Supreme Court will hear a case involving Planned Parenthood.
While this case is narrowly focused on whether Medicaid beneficiaries have the right to sue to enforce their right to choose any willing, qualified provider, the Supreme Court’s decision will have implications for the many states wishing to exclude providers, such as Planned Parenthood, based on abortion politics and not based on clinical qualifications to provide medical services. If Medicaid beneficiaries cannot bring an action to enforce the free choice of provider provision, then states will have greater latitude to exclude providers, such as Planned Parenthood, based on political objections.
What does this case mean for Medicaid beneficiaries?
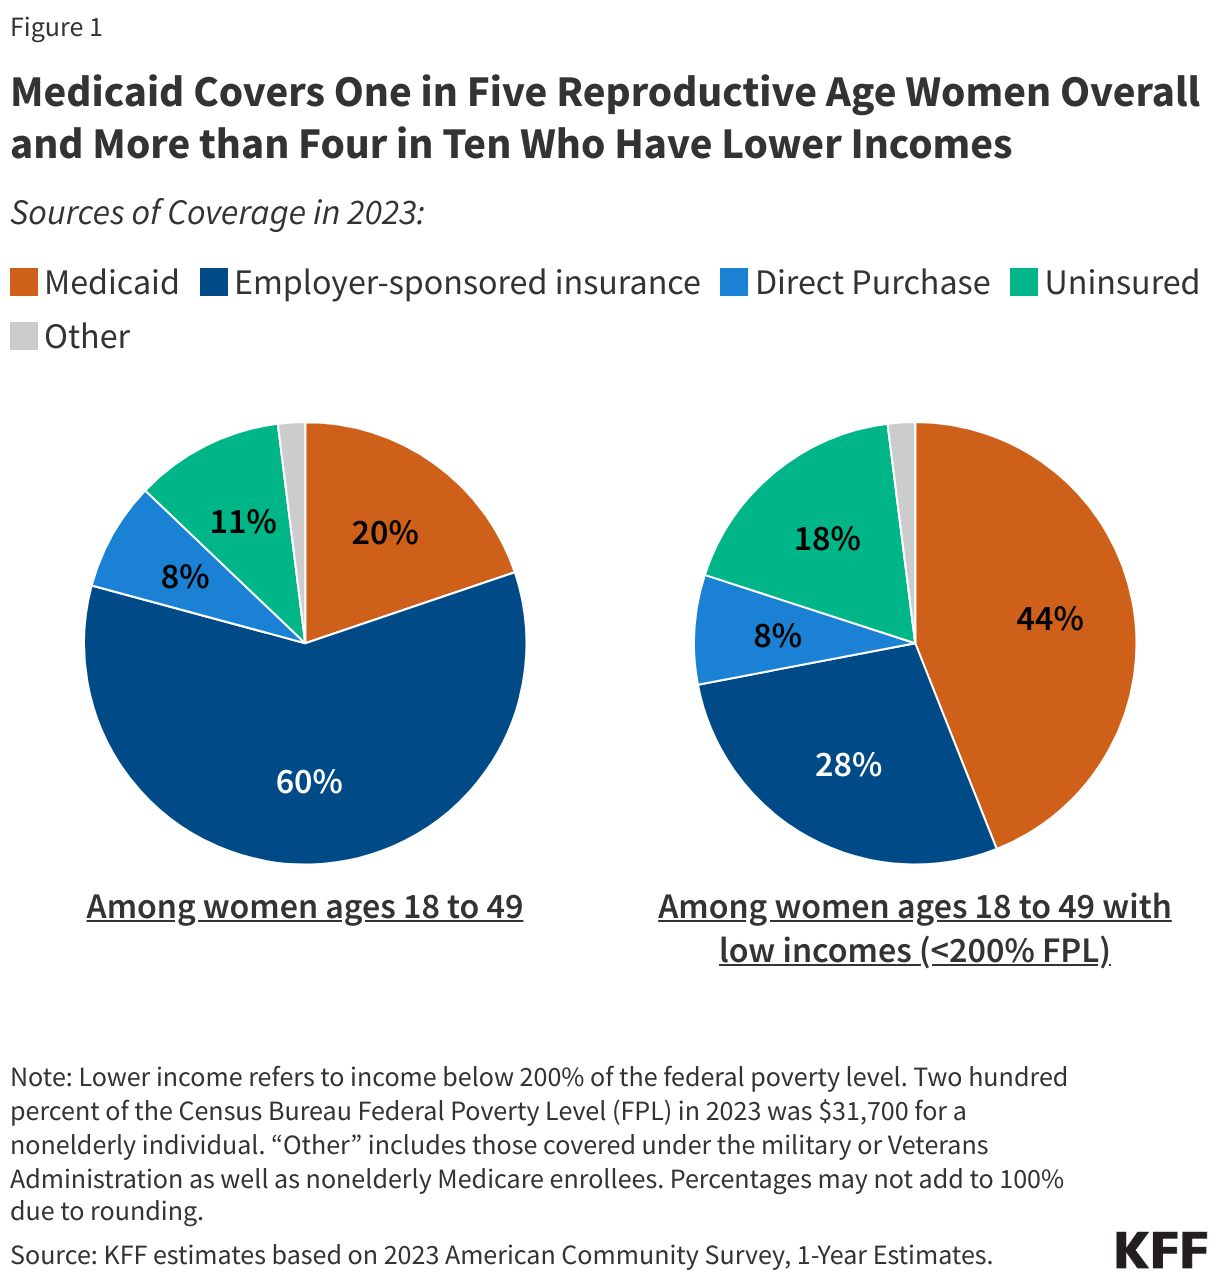
This case has the potential to curtail low-income individuals’ access to preventive reproductive health care in South Carolina and potentially in many states in the nation. The Medicaid program covers one in five reproductive age women and is the largest source of coverage for women with low incomes, covering over four in ten (Figure 1). All state Medicaid programs must cover family planning services, which includes contraceptive care plus a range of related services such as physical exams, cancer screenings, pregnancy testing and counseling, and screenings for other conditions. Medicaid is an essential source of financing for safety-net clinics and is widely considered to be the largest single public payer of family planning services. KFF research has found that specialty reproductive health care clinics such as Planned Parenthood centers offer a broader range of services to their patients compared to non-specialized clinics.
Other states are likely to follow suit if the Court rules in South Carolina’s favor. In fact, several other states, such as Texas, Arkansas, Indiana, and Missouri have tried to keep Planned Parenthood clinics out of their Medicaid networks, and while some of these efforts were blocked by CMS and courts because they violate the free choice of provider requirements, there have been exceptions. Federal courts upheld Arkansas and Texas decisions excluding Planned Parenthood from their Medicaid programs. South Carolina filed a waiver application to CMS during the first Trump Administration to exclude Planned Parenthood clinics from their Medicaid program, and Tennessee also has a similar waiver pending. No action has been taken to date on these waivers.
Blocking Planned Parenthood from receiving Medicaid reimbursements or other public funds has been shown to reduce low-income women’s access to contraceptives. In 2013, Texas replaced its Medicaid family planning program with a 100% state funded program that excluded Planned Parenthood as a participating provider. Following the policy change, there was a sizable drop in Medicaid claims for long-acting contraceptives such as IUDs or implants, and injectable contraceptives and an increase in Medicaid-funded births.
What is next?
The federal Solicitor General was granted approval to participate in oral arguments and has taken the position of South Carolina in this case. The Supreme Court will hear oral arguments on April 2nd and is expected to issue a ruling by the end of the term in June 2025.
Medicaid is the primary source of insurance coverage for people with HIV, playing a key role in financing HIV care and prevention efforts. Despite the importance of Medicaid for people with HIV, they represent a very small share of program enrollees overall (less than one-half of a percent). Most Medicaid enrollees with HIV qualify for the program through the Affordable Care Act (ACA)’s Medicaid expansion and disability-related pathways.
Policy proposals being considered by Congress to reduce federal spending for the Medicaid program could have negative implications for people with HIV and those at risk. It is unclear what specific policies might be implemented to achieve federal reductions and a range of options are being considered, but reductions in federal Medicaid funding would shift costs to states and could result in coverage losses, reduction in benefits, cost-shifting to HIV safety-net programs, and/or reductions in payment rates to providers, if states do not offset federal dollars. Policies imposing Medicaid work requirements, which could happen through the Congressional budget process or via waiver approvals, would impact people with HIV as well, likely leading to coverage losses. Coverage losses among people with HIV would likely increase demand on the nation’s HIV safety-net program, the Ryan White Program (which could also face cuts in Congress though the program’s funding has already not kept pace with inflation or growing need). Loss of Medicaid coverage could result in interruptions in HIV care and treatment, which could lead to increased morbidity and mortality as well as HIV transmission.
1. Medicaid is the primary source of insurance coverage for people with HIV.
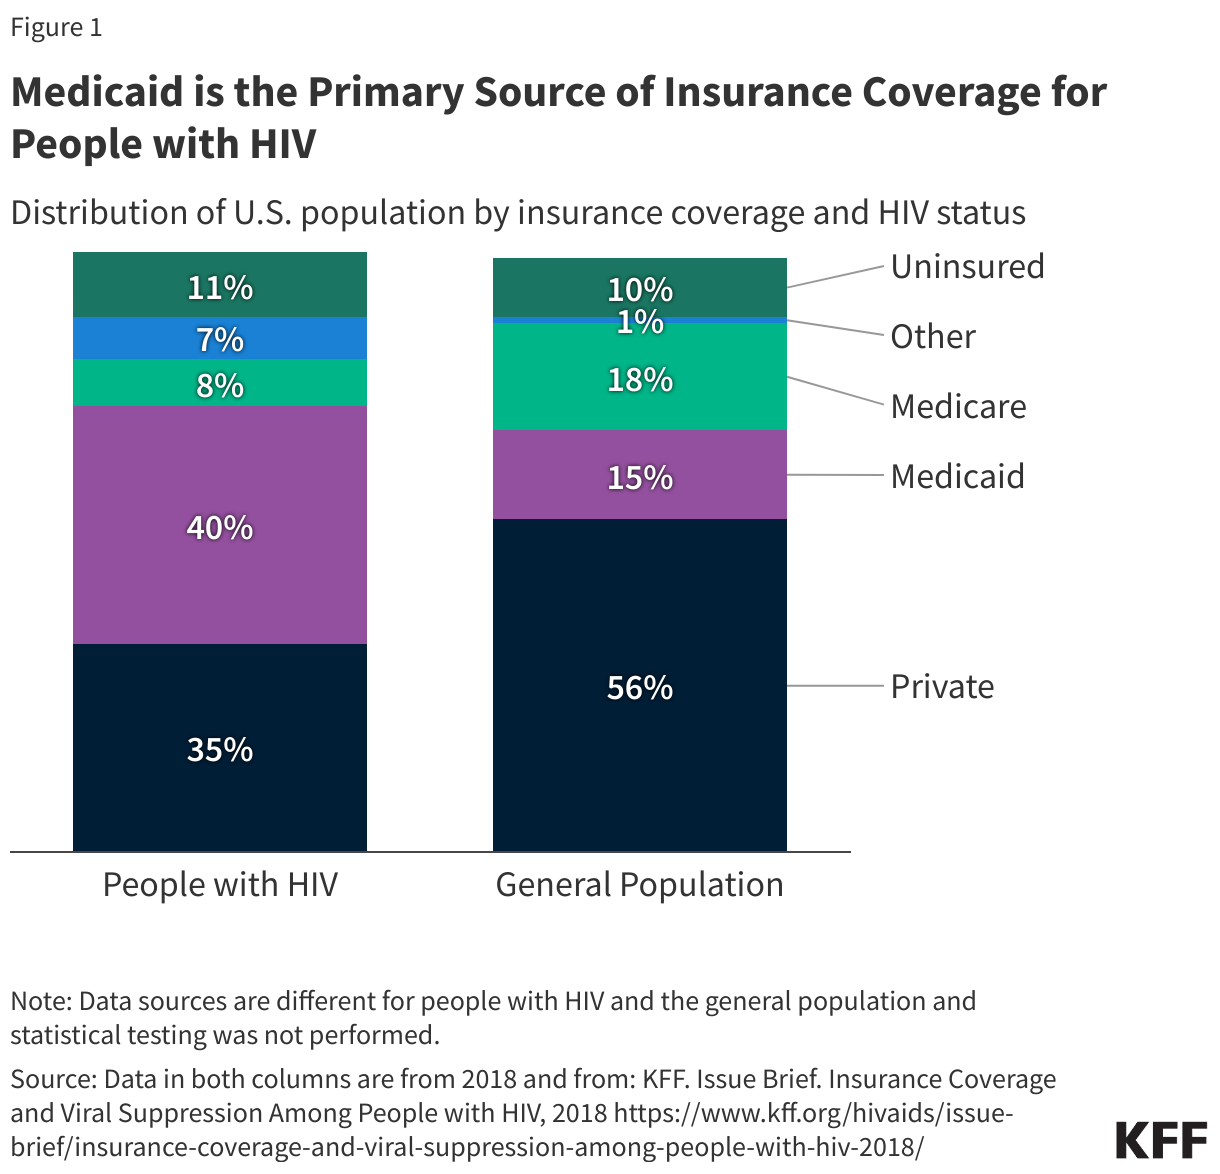
Medicaid is the single largest source of coverage for adults with HIV in the U.S., with four in ten estimated to be covered by the program (40%). By comparison, only 15% of adults in the general population have Medicaid coverage (Figure 1). Medicaid has helped to provide HIV care since the HIV epidemic began in the early 1980s. Coverage and benefits have grown over time as people with HIV are living longer, new infections continue to occur, and due to the Medicaid program’s expansion under the Affordable Care Act (ACA). Higher rates of Medicaid coverage reflect the fact that people with HIV have lower-incomes (33% of adults with HIV have incomes below 100% FPL compared to 11% of adults overall). Additionally, a large share of people with HIV have a disability (42%) and one in four (25%) people with HIV on Medicaid are dually eligible for Medicare, compared to 14% of enrollees without HIV.
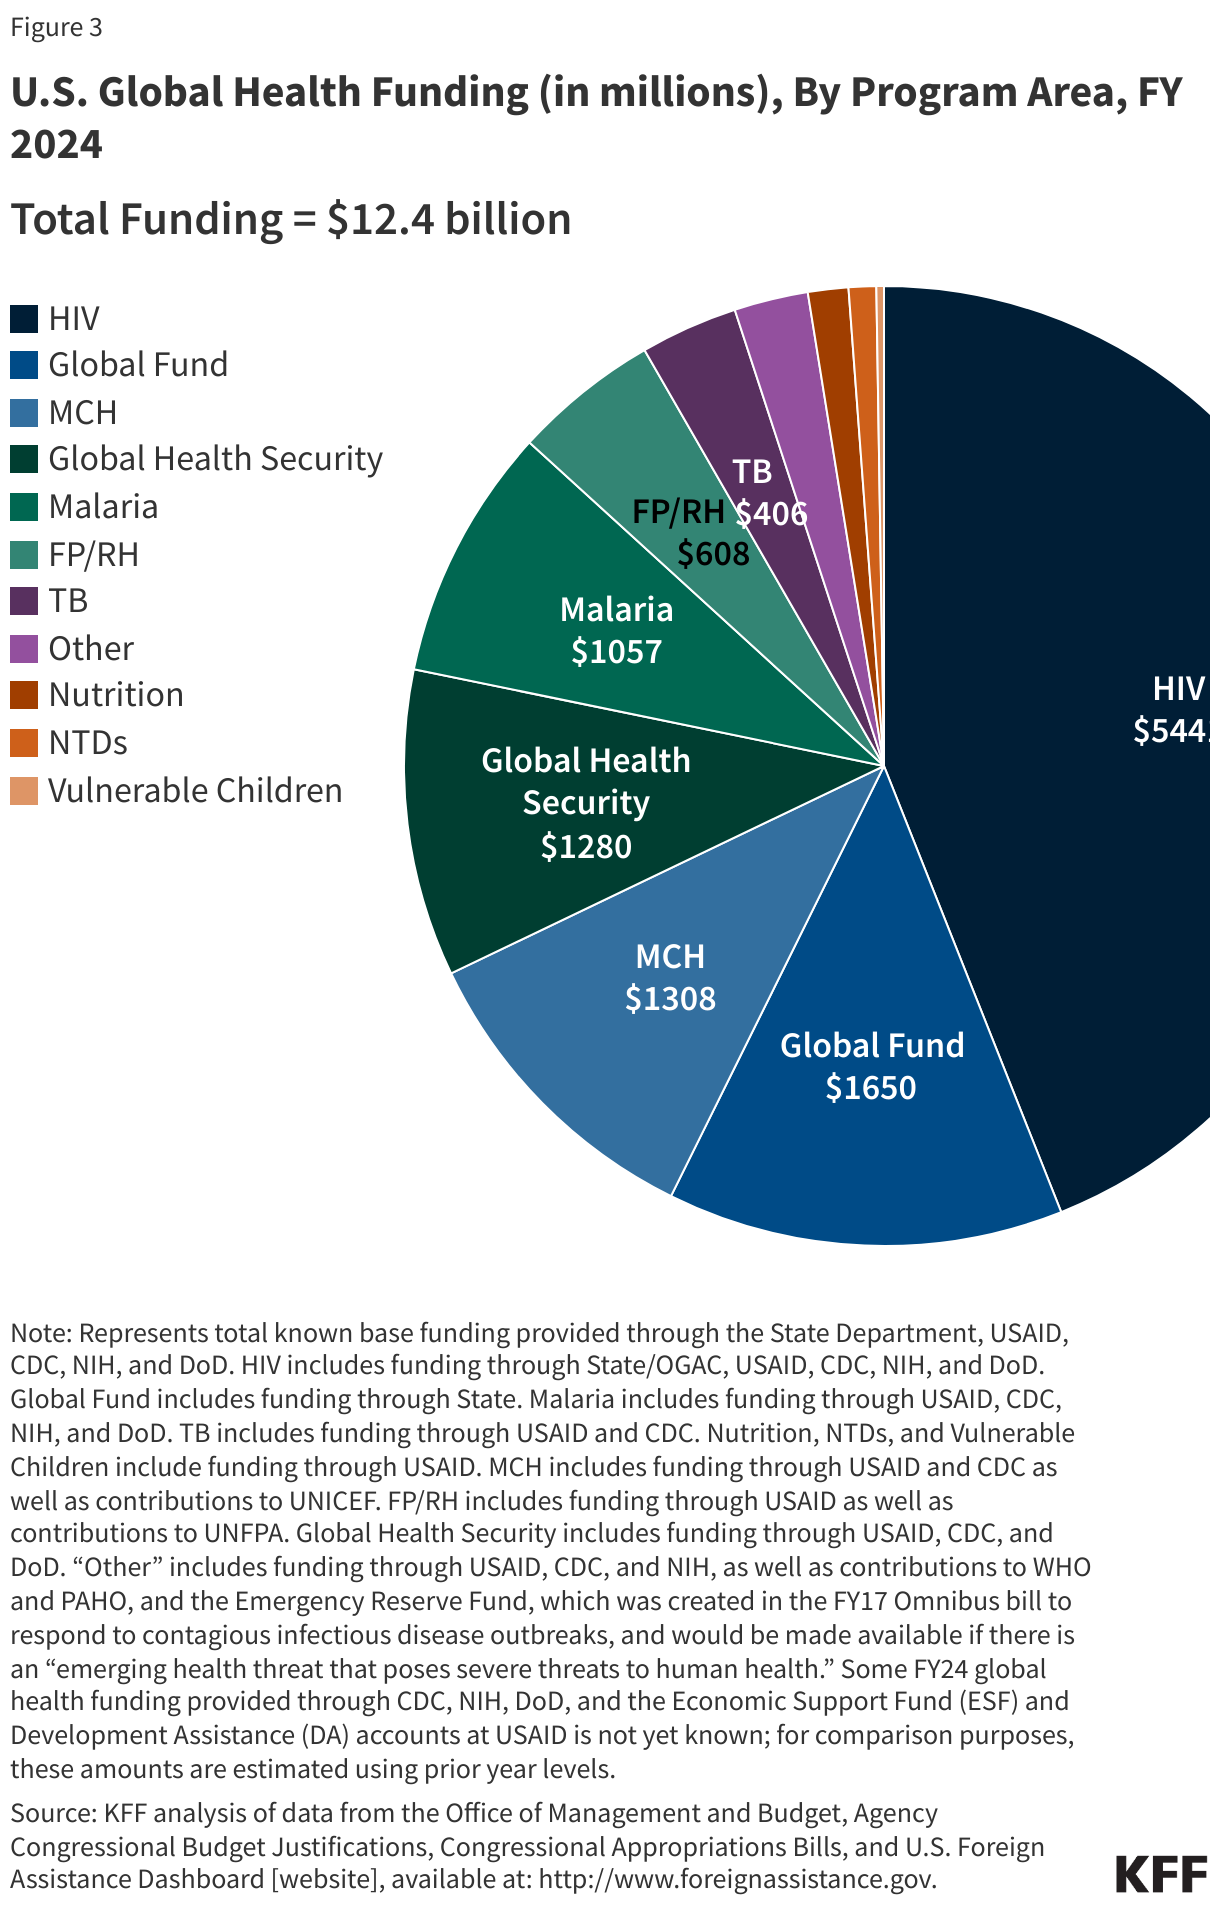
2. Medicaid is the primary payer for HIV care and treatment
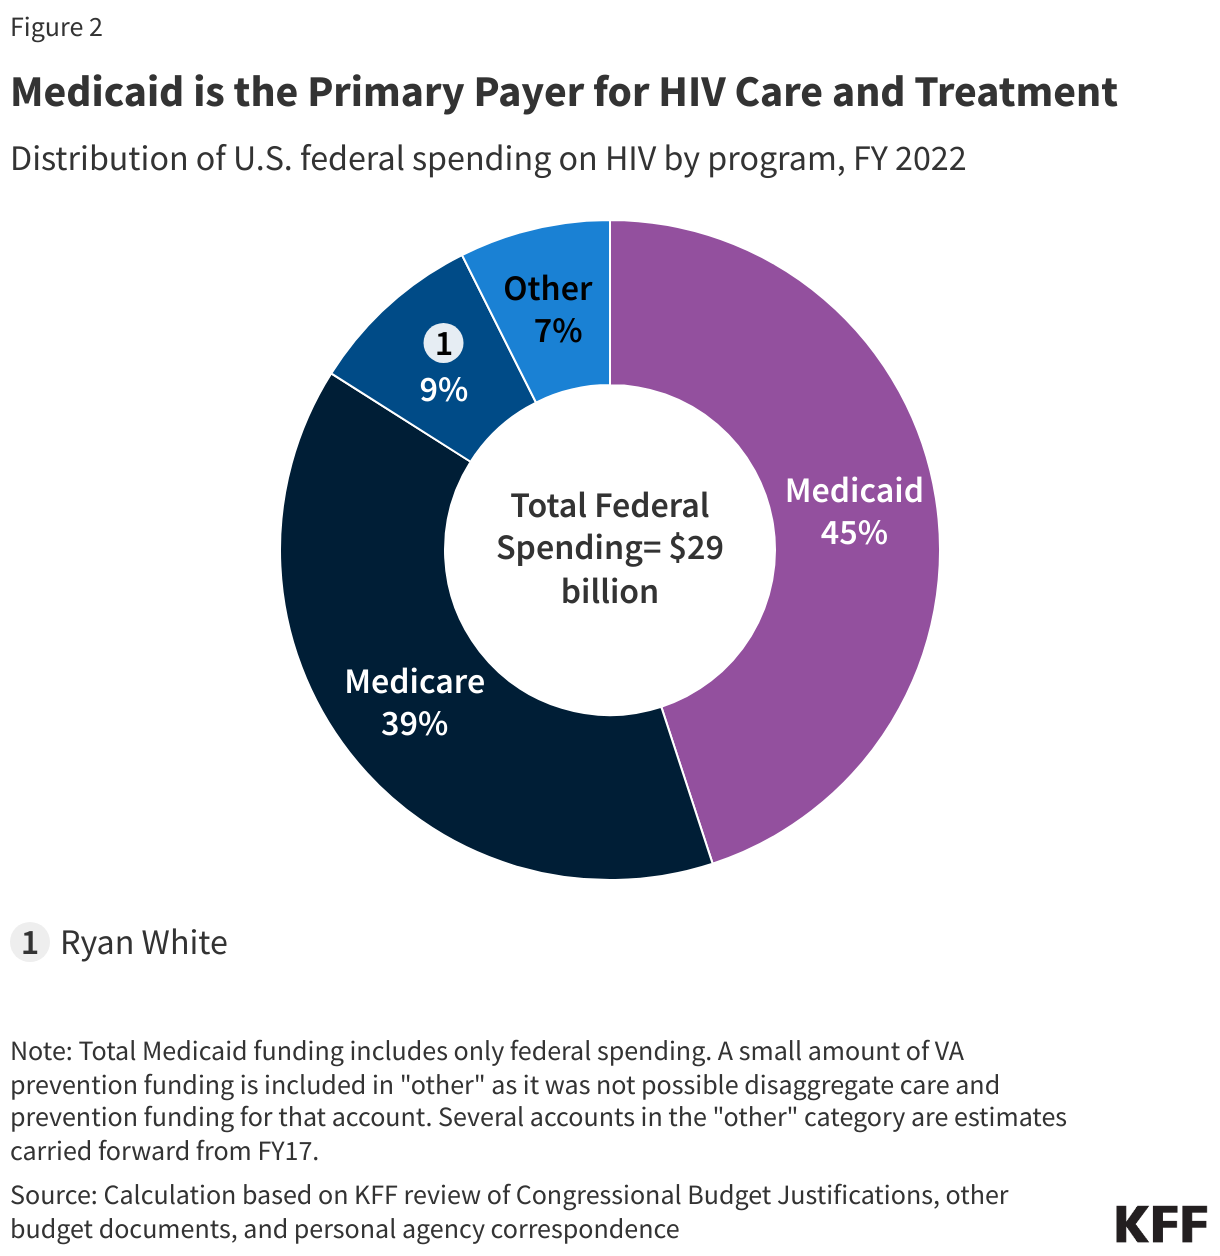
While Medicaid spending on people with HIV is a small share of all Medicaid spending, it accounts for an estimated 45% of all federal spending on HIV care and is the largest source of public financing for HIV care in the U.S, followed by Medicare. Still, in FY 2022, CMS estimates federal Medicaid spending on HIV represented less than 2% of total federal Medicaid spending. In addition, states also contribute to Medicaid spending on HIV (Medicaid is jointly financed by state and federal governments). Medicaid spending on HIV has increased over time, reflecting growing numbers of enrollees with HIV and the rising costs of care and treatment. In this way, it differs from the Ryan White Program, which is dependent on Congressional appropriations and funding levels do not automatically adjust to meet the needs of a growing population and increasing medical costs.
3. Medicaid expansion is the most common pathway to program eligibility for people with HIV.
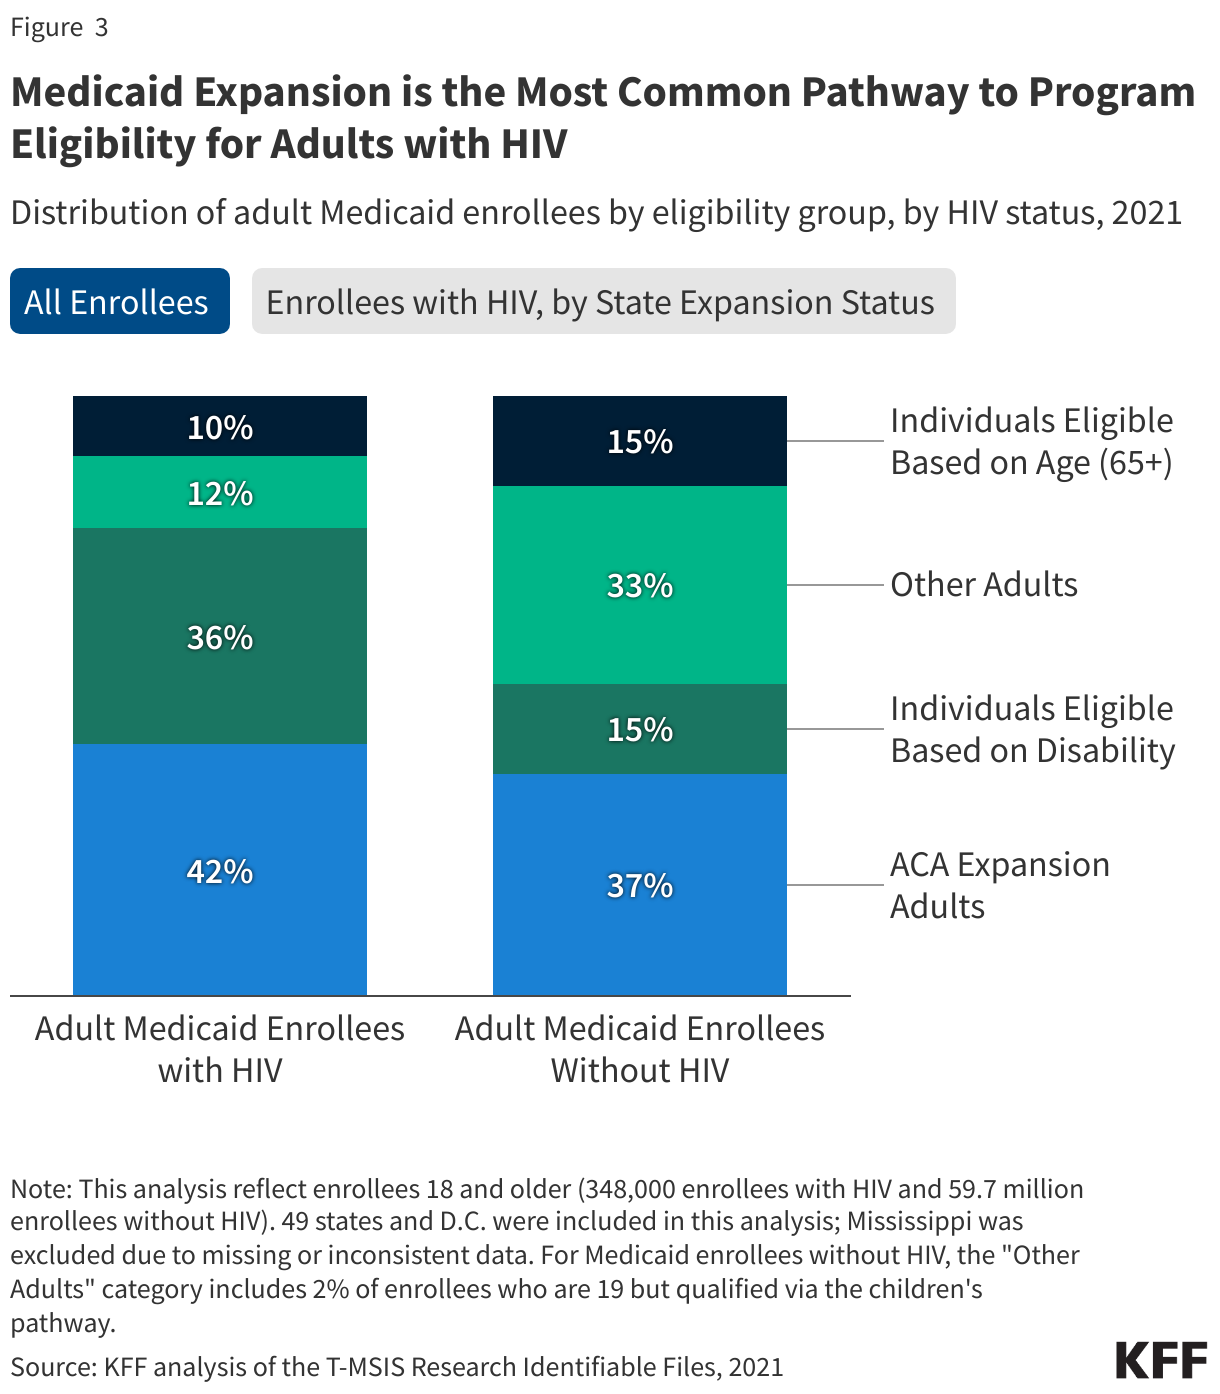
Over four in ten (42%) Medicaid enrollees with HIV have coverage through the ACA’s Medicaid expansion, making it the primary pathway to Medicaid eligibility for this population. In Medicaid expansion states, over half (51%) of adults with HIV have coverage through the expansion. This pathway was created under the ACA to provide coverage to low-income adults on the basis of income without other categorical requirements like disability or pregnancy. Individuals with HIV who qualify through the expansion pathway may be able to access early treatment that could help stave off disability and significantly improve health outcomes. However, not all states offer the expansion pathway and today over one-third (35%) of people with HIV live in one of ten states that has not opted to expand Medicaid. Medicaid enrollees with HIV continue to enroll through the disability pathway at much higher rates than those without HIV (36% v 15%) and it remains the primary entry point to coverage for adults with HIV in non-expansion states, two-thirds (66%) of whom have disability- related coverage (compared to 30% in expansion states).
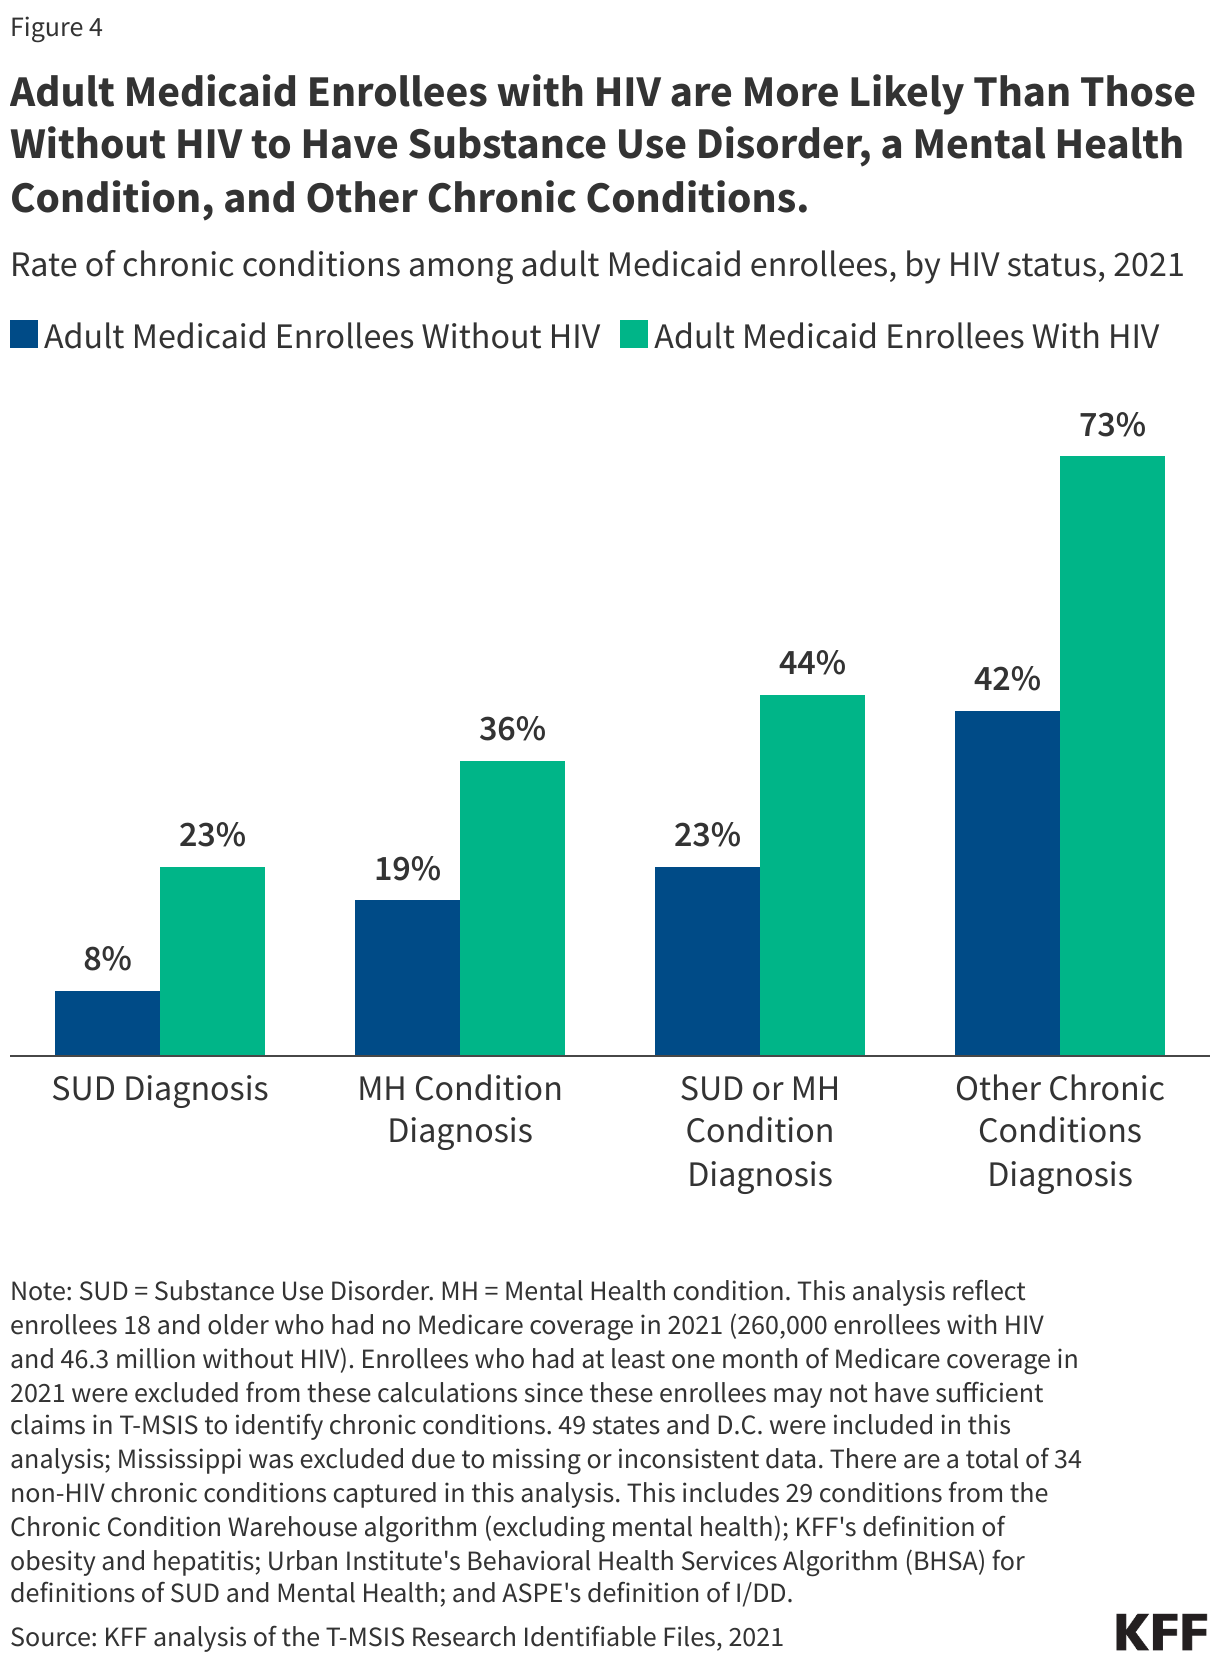
4. Medicaid enrollees with HIV are more likely to have substance use disorders, mental health conditions, and other chronic conditions relative to those without HIV.
Medicaid enrollees with HIV experience comorbidities at higher rates than those without HIV, including those related to mental health and substance use disorders. Nearly three-quarters (73%) of Medicaid enrollees with HIV have one of 34 other chronic conditions, compared to 42% of enrollees without HIV (see Figure 4 notes for details). Enrollees with HIV are more than twice as likely to be medically complex than enrollees without HIV, with about one-third (32%) having three or more chronic conditions in addition to HIV, compared to 13% of enrollees without HIV (data not shown). Adult enrollees with HIV are also twice as likely to have either a substance use disorder or mental health condition diagnosis (44% v 23%) compared to those without HIV. Enrollees with HIV are nearly ten times more likely than enrollees without HIV to have a hepatitis diagnosis. However, likely reflecting curative treatments now available, that share has declined from 14% of enrollees in 2013 to 6% in 2021 (data not shown). These differences between enrollees with HIV and without HIV likely reflect a range of both medical and social factors that combine to increase the risk and prevalence of these co-occurring conditions.
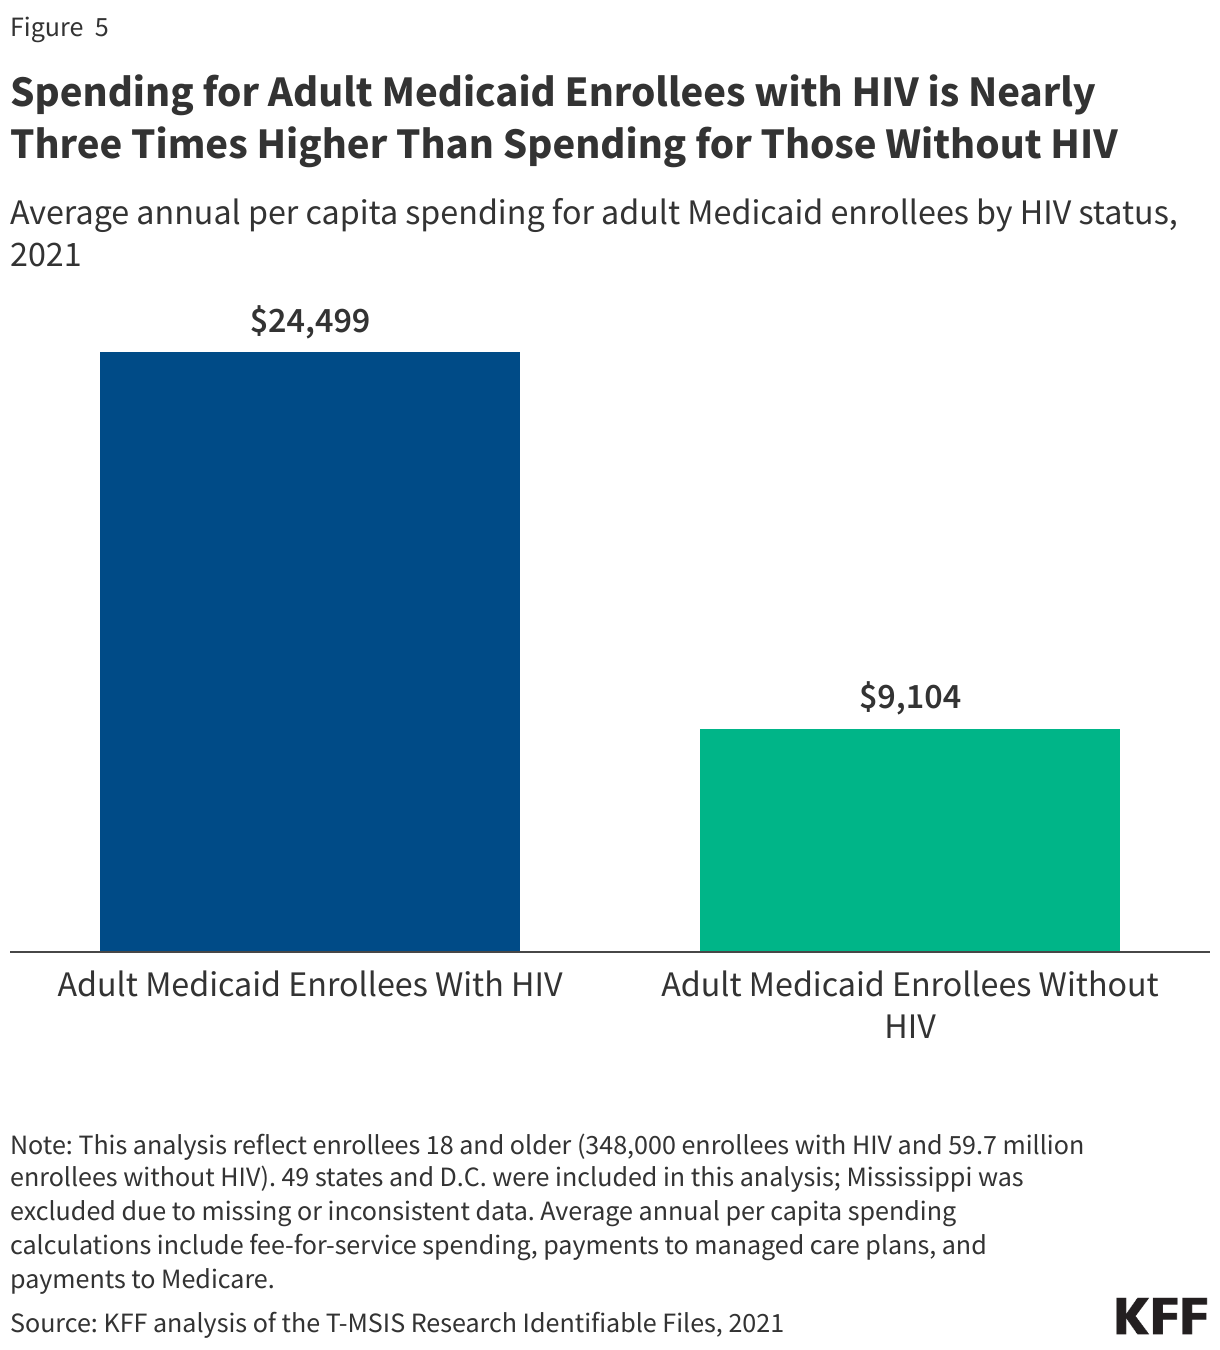
5. Spending for Medicaid enrollees with HIV is nearly three times higher than spending for those without HIV.
Spending on people with HIV enrolled in Medicaid is substantially higher than on those without HIV, reflecting higher health needs and costs of care. Average Medicaid spending per adult enrollee with HIV was about $24,000 in 2021, nearly three times that of adult Medicaid enrollees without HIV (about $9,000 per enrollee). While spending on enrollees with HIV was higher across all spending categories, the difference was especially marked in the drug/treatment category reflecting the relatively high cost of HIV medications (though notably, the drug spending data reflects pre-rebate amounts). Still, because people with HIV represent less than one-half of a percent of Medicaid enrollees overall, the net impact on Medicaid spending is small (less than 2%, see point 2 above).
Methods
Medicaid Claims Data: Figures 3-5 in this analysis use the 2021 T-MSIS Research Identifiable Demographic-Eligibility and Claims Files (T-MSIS data) to identify Medicaid enrollees with HIV.
Identifying HIV in Medicaid Claims Data: Enrollees with HIV were flagged if they had a relevant ICD 9 or ICD 10 code, any drug claims for a single tablet regiment (STR), or two or more other non-STR ARVs. A list of diagnosis and drug codes that were used for this analysis are available upon request.
Enrollee Inclusion Criteria: Enrollees were included if they were ages 18 or older and had at least one month of Medicaid coverage. Figure 4, which identifies rates of chronic conditions among those with and without HIV, also excludes those who had at least one month of Medicare coverage. These enrollees were excluded from these calculations since they may not have had sufficient claims in T-MSIS to identify chronic conditions.
State Inclusion Criteria in Medicaid Claims Data: To assess the usability of states’ data, the analysis examined quality assessments from the DQ Atlas for service users in the “Other Services” and Drug files for 2021. 49 states and D.C. were included in this analysis. Mississippi was excluded since it received an “Unusable” rating on these measures.
Defining Chronic Conditions (Figure 4): This analysis used the CCW algorithm for identifying chronic conditions (updated in 2020), excluding its definition for mental illness, which was pulled from a different source. This analysis also included in its definition of chronic conditions substance use disorder, mental illness, obesity, hepatitis C, and intellectual and developmental disabilities (ASPE definition).
Calculating Spending (Figure 5): Average annual per capita spending calculations include fee-for-service spending, payments to managed care plans, and payments to Medicare.Spending was calculated by summing the total spending of all claims per enrollee in the T-MSIS claims files and manually adds Medicare premiums for those who are also enrolled in Medicare. Estimates here do not include prescription drug rebates and most supplemental payments to providers.
Medicare, the federal health insurance program for people ages 65 and older and people under 65 with long-term disabilities, covers 68 million people and represents 15% of all federal spending – nearly $1 trillion dollars in 2024. The Medicare program has more than 1.4 million providers and more than 20 different payment systems. Due to the complexity and size of the program, Medicare faces risk of improper payments and some vulnerability to fraud, waste, and abuse, though many actions have been taken over the years to reduce improper payments in the program and to root out fraud.
Strengthening program integrity and tackling fraud, waste, and abuse in Medicare, as well as in other government programs, has been a priority across prior administrations. During President Obama’s administration, President Trump’s first term and during President Biden’s administration, the Department of Health and Human Services (HHS) budgets included proposals to improve program integrity, including for Medicare and Medicaid, reduce improper payments for these and other programs, and provide additional funding to combat fraud, waste, and abuse.
CMS, primarily through the Center for Program Integrity (CPI), plays a key role in efforts to promote program integrity in Medicare. In addition, the HHS Office of Inspector General (HHS OIG), often in collaboration with the Department of Justice (DOJ) and other agencies, monitors and combats fraud, waste, and abuse to improve the efficiency of Medicare by conducting audits, evaluations, and investigations, and carrying out enforcement actions, which in some instances have resulted in criminal or civil penalties. Despite the HHS Inspector General playing a key role in providing oversight of program integrity efforts for Medicare and other HHS programs, President Trump fired the HHS Inspector General and several other Inspectors General just days after taking office for his second term.
This brief explains fraud, waste, abuse, and improper payments in Medicare and describes actions to ensure Medicare program integrity.
Fraud, waste, abuse, and improper payments are often used interchangeably but have distinct meanings in the context of Medicare.
Improper payments. Improper payments are defined in law as “any payment that should not have been made or that was made in an incorrect amount, including an overpayment or underpayment, under a statutory, contractual, administrative, or other legally applicable requirement; and includes: any payment to an ineligible recipient; any payment for an ineligible good or service; any duplicate payment; any payment for a good or service not received, except for those payments where authorized by law; and any payment that does not account for credit for applicable discounts.”
Improper payments in the Medicare program, both overpayments and underpayments, can result from fraud, waste, and abuse as well as errors. For example, improper payments can be due to documentation mistakes or omissions, such as missing signatures, which may occur with otherwise appropriate claims and payments.
Fraud. According to CMS, Medicare fraud occurs when a provider knowingly submits false information to the federal government to receive Medicare payments. Medicare fraud can include knowingly billing for a higher level of complexity of services than the level that was actually provided, knowingly billing for services not provided, including falsifying records of providing such services, and knowingly ordering medically unnecessary items or services. Committing Medicare fraud is illegal and may lead to imprisonment, fines, and penalties. There are no estimates of how much Medicare specifically loses to fraud.
One recent example of Medicare fraud involved a $17 million Medicare hospice fraud committed against the federal government, in which an individual plead guilty to health care fraud, aggravated identity theft, and money laundering. In this case, the individual engaged in a scheme to operate a series of sham hospice companies and submitted fraudulent claims to Medicare for services that were not medically necessary and not provided, including for people who were not terminally ill and those who never received care from those sham hospices. Another example is a provider who was found guilty of health care fraud and other charges, who submitted over $24 million in fraudulent claims to Medicare, involving kickbacks and bribes for authorizing medically unnecessary cancer genetic lab tests, lengthy office visits that were never provided to patients, and medically unnecessary orthotic braces.
Abuse. According to CMS, abuse occurs when providers or suppliers perform actions that directly or indirectly result in unnecessary costs to the Medicare program. Abuse includes any practice that does not meet professionally recognized standards. Examples of abuse are billing for unnecessary medical services, charging excessively for services or supplies, or upcoding claims, which is when a provider uses an inaccurate billing code for a medical procedure that increases reimbursement. As CMS explains, “the difference between “fraud” and “abuse” depends on specific facts, circumstances, intent, and knowledge,” but fraudulent activity can be characterized by its intentional nature leading to some “unauthorized benefit.” Ultimately, CMS notes that providers who engage in abusive billing practices, like upcoding, or fraudulent activity, like charging for services that were not delivered, can be subject to civil and criminal penalties.
Waste. CMS defines waste as the overuse or misuse of resources that directly or indirectly result in unnecessary costs to the Medicare program. Examples of waste include conducting excessive office visits, prescribing more medications than necessary, and ordering excessive or duplicative laboratory tests. As one recent example, Medicare spending on expensive “skin substitute” products used for wound care increased from $1.6 billion in 2022 to over $10 billion in 2024, although according to research conducted for CMS, the efficacy of many of these products has not been studied. While the distinction between waste and abuse is not always clear, both result in unnecessary costs to the Medicare program.
CMS’s formal definition of waste differs from other views of waste, which may include value judgements of how the government should or should not be spending taxpayer money. As one example of this, MedPAC, an independent agency that advises Congress about Medicare payment, estimates the federal government pays insurers 20% more for Medicare Advantage enrollees than it pays for similar people in traditional Medicare, which amounts to $84 billion in additional annual spending in 2025 alone. Some might argue that this extra spending is wasteful while others might argue it adds value to the Medicare program by providing extra benefits to Medicare Advantage enrollees.
The vast majority of Medicare payments are made properly, although improper payments are an ongoing concern.
The Trump administration recently cited an estimate of $140 billion in improper payments made by CMS in 2024, but based on the amounts derived from each part of Medicare (as described below), improper payments for the Medicare program totaled substantially less – $54.3 billion in 2024, according to GAO. Even across all CMS programs – Medicare, Medicaid, CHIP, and the Affordable Care Act Health Insurance Exchange Advance Payments of the Premium Tax Credit (APTC) programs, the total amount of improper payments is less than the total cited by the administration – totaling $87.1 billion in 2024, according to CMS. Government-wide, 16 federal agencies across 68 programs, reported improper payments of $162 billion in 2024, a decrease of $74 billion from 2023, according to GAO. Again, estimates of improper payments described here are not the same as estimates of fraud.
CMS relies on three approaches to measure improper payments for traditional Medicare, Medicare Advantage, and Medicare Part D using different statistical methods for each:
The Comprehensive Error Rate Testing (CERT) program measures the improper payment rate in traditional Medicare. To determine if claims were paid properly, the CERT program reviews a random sample of traditional Medicare claims – approximately 37,500 claims in 2024.
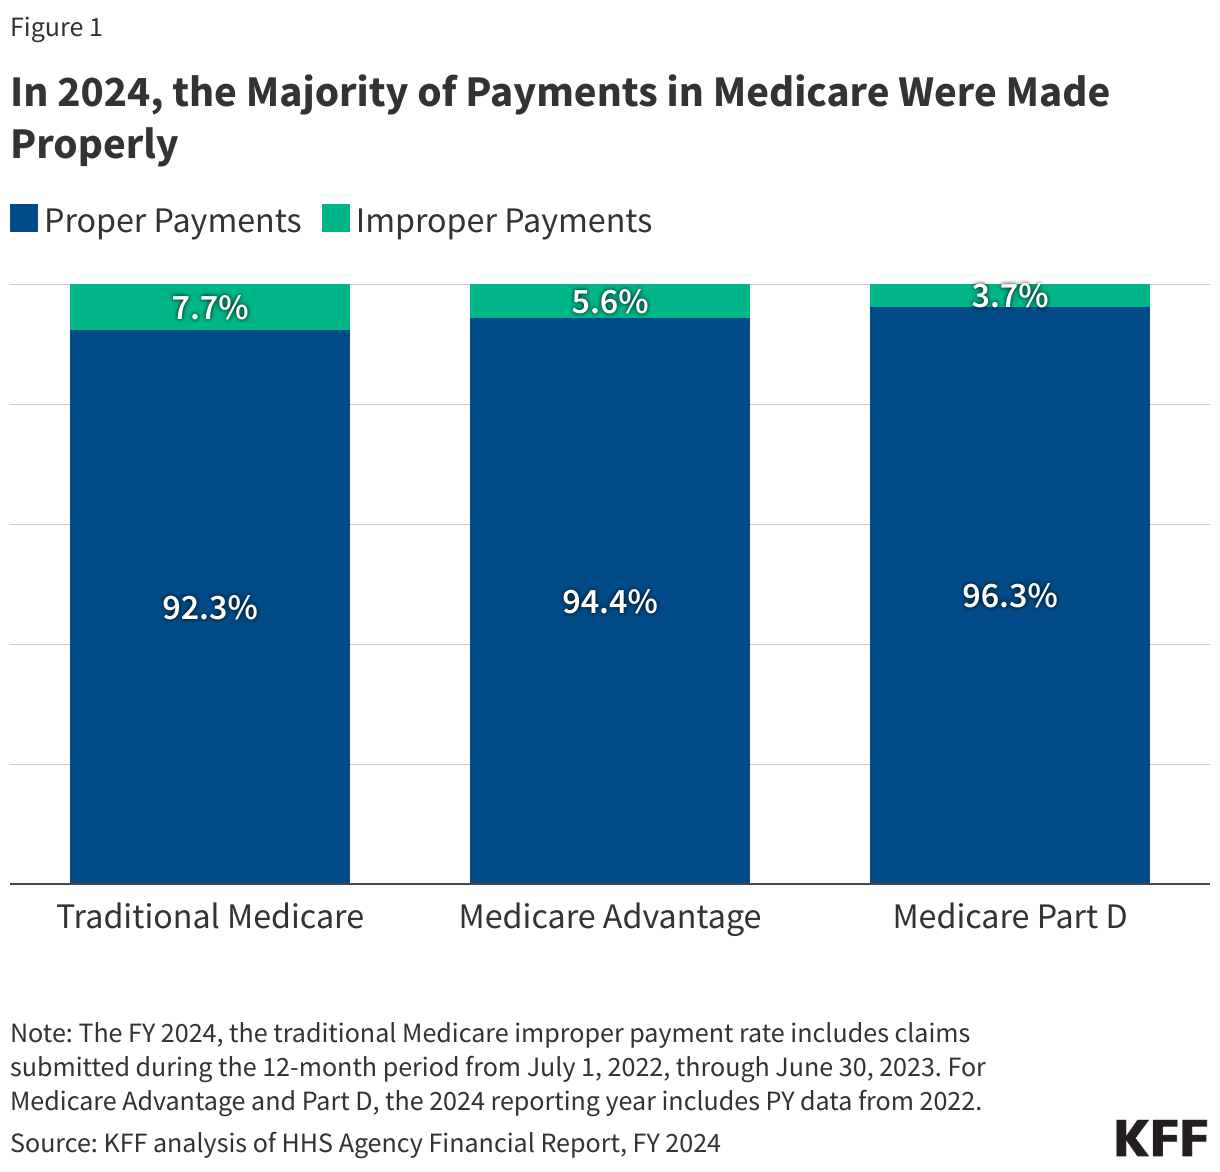
In 2024, traditional Medicare paid an estimated 92.34% of claims properly, representing $382.02 billion in proper federal payments. The traditional Medicare improper payment rate was 7.66% (or $31.70 billion in federal payments) in 2024.
In 2024, Medicare Advantage paid an estimated 94.39% of claims properly, representing $320.87 billion in proper federal payments. The Medicare Advantage improper payment rate was 5.61% (or $19.07 billion in federal payments) in 2024. (These estimates of improper payments in Medicare Advantage do not include estimates of higher spending in Medicare Advantage compared to traditional Medicare for similar beneficiaries as discussed above, which are often referred to as “overpayments”).
In 2024, Medicare Part D paid an estimated 96.30% of claims properly, representing $92.95 billion in proper federal payments. The Medicare Part D improper payment rate was 3.70% (or $3.58 billion in federal payments) in 2024.
The rate of improper payments for traditional Medicare has decreased over time from 12.7% in FY2014 to 7.66% in FY2024. (Similar trends are not included for Medicare Advantage and Part D due to methodological changes in the calculation of the estimates over time.) While improper payment rates for traditional Medicare have generally declined, the overall amount of improper payments have increased as Medicare spending has increased over this period. Improper payments both negatively impact beneficiaries and reduce the solvency of the Medicare Hospital Insurance (Part A) Trust Fund, which is projected to be depleted in 2036.
The primary reason for improper payments differs for traditional Medicare, Medicare Part D and Medicare Advantage.
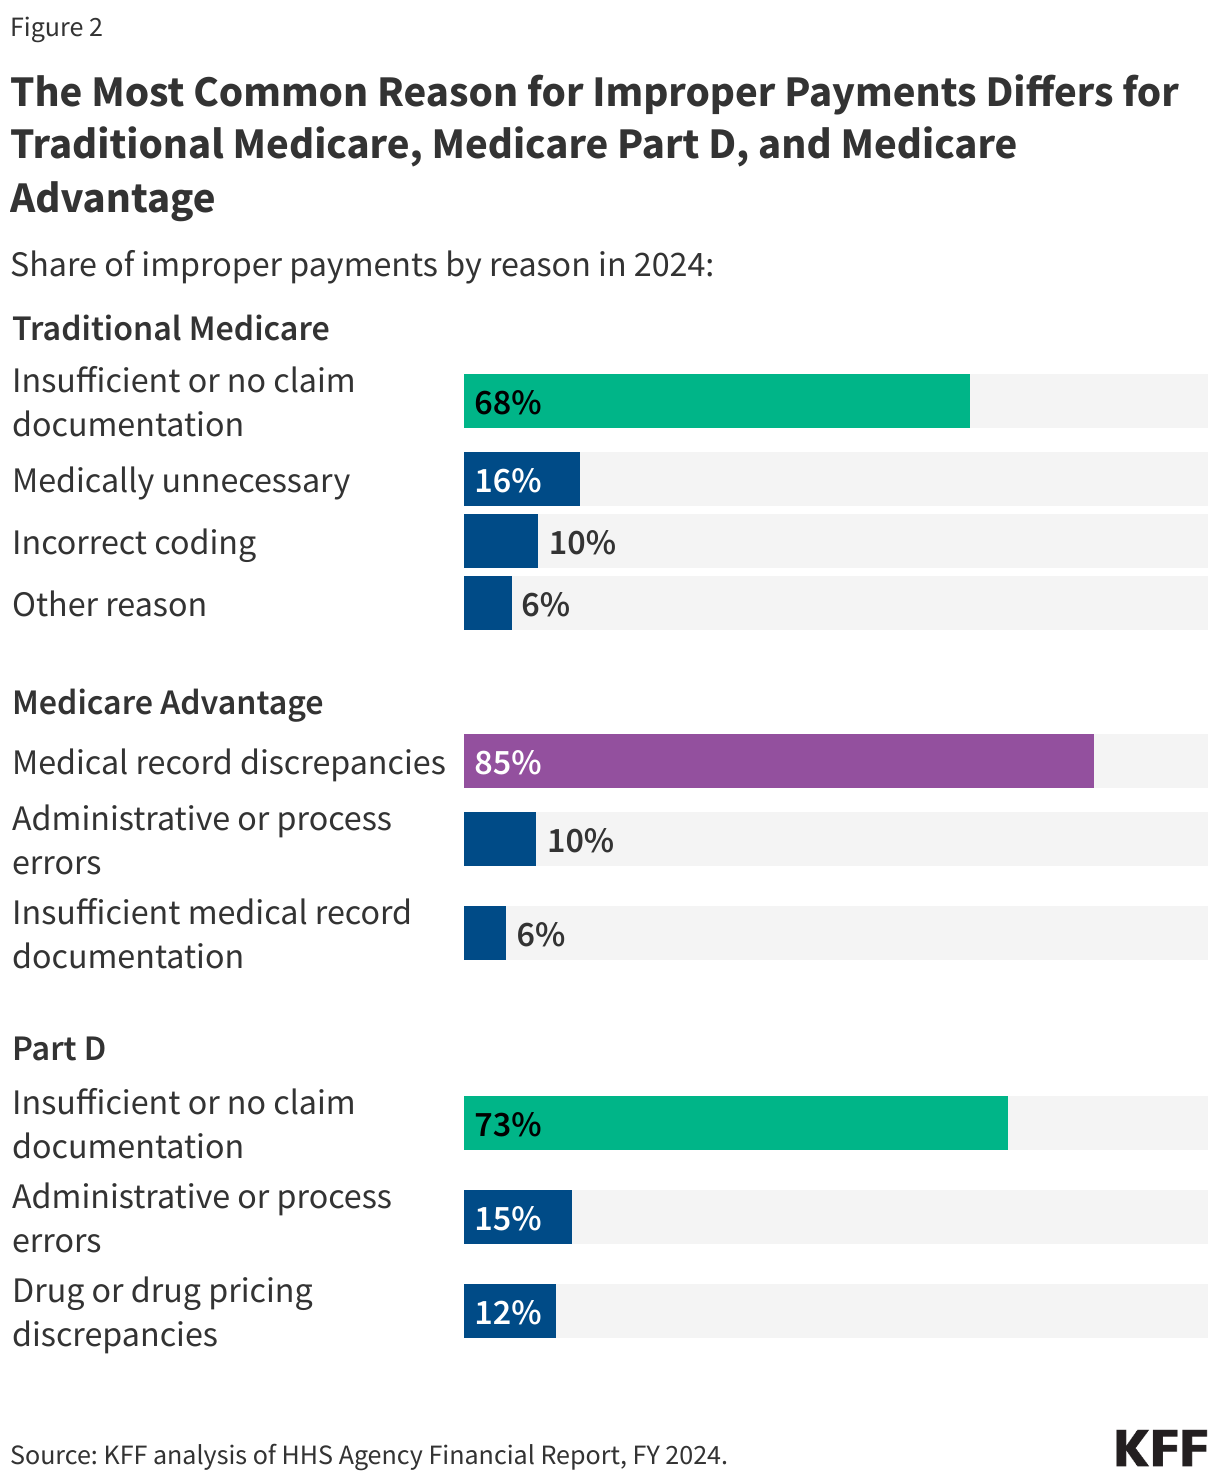
In traditional Medicare, insufficient or no documentation was the most common reason for improper payments, accounting for 68% of improper payments, similar to Medicare Part D (73%), while for Medicare Advantage, medical record discrepancies accounted for 85% of all improper payments (Figure 2).
In 2024, the most common reason for improper payments in traditional Medicare was insufficient or no documentation (68%), followed by claims being medically unnecessary (16%), incorrect coding (10%), and other reasons (6%). Similarly, for Medicare Part D, insufficient or no documentation (73%) was the main reason for improper payments, followed by administrative or process errors (15%) and drug or drug pricing discrepancies (12%). The primary reason for Medicare Advantage improper payments is medical record discrepancies, accounting for 85% of all improper payments, followed by administrative or process errors (10%) and insufficient documentation (6%). According to CMS, improper payments due to medical record discrepancies result when medical record documentation submitted by a Medicare Advantage plan does not support payments received by the plan.
The differences in the main drivers of improper payments in traditional Medicare, Medicare Part D and Medicare Advantage reflect in part how improper payments are calculated – for traditional Medicare, CERT evaluates claims submitted by providers, and for Part D, the Part D IPM evaluates errors in payments for prescription drug claims, while for Medicare Advantage, the Part C IPM evaluates whether submitted diagnoses codes for which Medicare Advantage plans received payment are supported by enrollees’ medical records. Improper payments can result in either overpayments (monetary loss) or underpayments (non-monetary loss).
CMS is responsible for many program integrity activities, including conducting audits to identify and recover Medicare improper payments.
The CMS Center for Program Integrity (CPI) primarily implements the Medicare Integrity Program, which is responsible for helping to protect Medicare against fraud, waste, and abuse for various parts of the Medicare program. Program integrity activities within CMS resulted in estimated Medicare savings of $14.9 billion in FY 2023 and produced a substantial return on investment (ROI) – for every $1 spent on program integrity efforts, Medicare saved $8.30.
Among the many program integrity activities conducted by CMS to root out fraud, waste, abuse, and address improper payments in traditional Medicare and Medicare Advantage, audits are an important tool, including the Medicare Fee for Service Recovery Audit Program and the Medicare Advantage Risk Adjustment Data Validation audits.
The Medicare Fee for Service Recovery Audit Program. The Medicare Fee for Service (FFS) Recovery Audit Program’s mission is to identify and correct Medicare improper payments made on claims of health care services provided to traditional Medicare beneficiaries and recover those improper payments. In FY 2023, Recovery Audit Contractors (RACs) identified $353 million in overpayments and recovered $273 million. Recovery audits are distinct from CERT audits in that they seek to both identify and recover improper payments, while the CERT audits provide a national estimate of improper payments in traditional Medicare.
Medicare Advantage Risk Adjustment Data Validation (RADV) audits. Medicare Advantage RADV audits have similar objectives to the Medicare Fee for Service Recovery Audit Program and are the primary way CMS identifies and collects improper payments in Medicare Advantage. As part of RADV audits, CMS confirms that diagnoses submitted by Medicare Advantage organizations for risk adjustment are supported by enrollees’ medical records. Medicare Advantage organizations are held financially accountable when data submitted for risk adjustment purposes do not align with program rules. If Medicare Advantage organizations do not agree with the audit results, they may appeal these medical record review determinations. RADV audits, conducted by the CPI, seek to both identify and recover improper payments from Medicare Advantage plans, while Part C IPM audits provide a national estimate of improper payments in Medicare Advantage.
In 2023, the Biden Administration finalized a rule, which was proposed in 2018 during the first Trump administration, to make adjustments to the RADV program. One of the major elements of the finalized rule was the decision to extrapolate payments, which is a technique widely used in traditional Medicare and other audits, to estimate values, such as overpayments, based on a statistically random sample that would apply to the entire Medicare Advantage contract. The final rule extrapolates contract-level findings for audits starting in payment year 2018. In September 2023, Humana sued the government over its methodology and a federal judge denied dismissal of the case in June 2024, but the final outcome of the case is still pending.
The HHS OIG, DOJ, and other agencies play a major role in combatting Medicare fraud, waste, abuse and improper payments.
The HHS OIG, established through legislation in 1976, has played a major role in monitoring and combating fraud, waste and abuse to improve the efficiency of Medicare and other HHS programs, with the majority of its resources going to oversight of Medicare and Medicaid. The HHS OIG has a variety of responsibilities including conducting and supervising audits, investigations, and evaluations relating to HHS programs; identifying systemic weaknesses that give rise to opportunities for fraud and abuse and making recommendations to prevent them from reoccurring; leading and coordinating activities to prevent and detect fraud and abuse; and imposing administrative sanctions against providers of health care under Medicare and Medicaid who commit certain prohibited acts. The HHS OIG also operates a fraud hotline where it accepts tips and complaints related to potential fraud, waste, and abuse in HHS programs.
As the number of beneficiaries enrolled in Medicare Advantage has increased, the HHS OIG has focused more of its efforts on addressing the risks of fraud, waste, and abuse in Medicare Advantage and has developed a strategic plan for its oversight. One of its main priorities is ensuring that payments to Medicare Advantage plans are accurate. Similar to the RADV audits mentioned above that are conducted by CMS, the HHS OIG regularly audits Medicare Advantage organizations to review the accuracy of diagnosis codes since some diagnoses are at higher risk of being miscoded, resulting in overpayments to these organizations. For example, two of OIG’s recentaudits released in December 2024, found that Medicare Advantage plans had submitted diagnosis codes that did not comply with federal requirements, resulting in millions of dollars in estimated overpayments, though both plans disputed OIG’s findings and recommendations. HHS OIG audits do not represent final determinations and CMS officials ultimately determine whether the agency will seek to recoup overpayments in these instances.
The HHS OIG has also examined the use of health risk assessments (HRAs) and chart reviews in Medicare Advantage, producingmultiplereports on how these activities can increase risk scores and drive billions of dollars in additional payments to Medicare Advantage plans. As mentioned above, MedPAC estimates the federal government pays more for Medicare Advantage enrollees than it pays for similar people in traditional Medicare, at a cost of $84 billion in 2025 – $40 billion of which can be attributed to coding differences that increase payments to Medicare Advantage plans.
The HHS OIG often collaborates with the DOJ to fulfill its duties. OIG works with DOJ, under the joint direction of the Attorney General and the Secretary of Health and Human Services (HHS), to operate the Health Care Fraud and Abuse Control (HCFAC) Program, which was established in 1996 as part of the Health Insurance Portability and Accountability Act of 1996 (HIPAA) by the Clinton administration. The Program is tasked with coordinating federal, state, and local law enforcement efforts relating to health care fraud for Medicare, Medicaid, and other health care programs, conducting investigations and audits relating to the delivery of and payment for health care, and enforcing remedies for fraud.
The DOJ and U.S. Attorneys carry out enforcement actions against those suspected of engaging in Medicare fraud, including bringing criminal and civil cases to stop ongoing fraud, deter future fraud, and recover funds wrongfully taken through fraud and false claims. In FY 2023, 476 defendants were convicted of health care fraud-related crimes, which includes but is not limited to Medicare. In its annual report on the Health Care Fraud and Abuse Control Program, the OIG highlighted significant criminal and civil investigations for Medicare and other federal health care programs including in the areas of ambulances, diagnostic testing, durable medical equipment, home health providers, hospice, and medical devices, among others.
The DOJ has also been involved in civil cases regarding Medicare Advantage insurers, often in relation to allegations of false diagnosis codes submitted to inflate Medicare payments to plans through the risk adjustment system. For example, the Justice Department is litigating actions against UnitedHealthGroup, Elevance Health, and KaiserPermanente regarding the accuracy of their diagnosis data used for risk adjustment. In September 2023, Cigna paid $172 million dollars to the federal government in order to resolve False Claims Act allegations that it provided inaccurate data on patients’ diagnoses to inflate payments, though there was no determination of liability.
During FY 2023, efforts by the Health Care Fraud and Abuse Control Program for Medicare, Medicaid, and other government programs resulted in recoveries of $3.4 billion, of which the Medicare Trust Funds received close to $1 billion. The ROI for the HCFAC program from 2021 to 2023 is $2.80 returned for every $1.00 expended toward addressing fraud and abuse.
The GAO, which examines how taxpayer dollars are spent and provides Congress and federal agencies with information to help the government save money and work more efficiently, has undertaken a series of studies looking at these issues in the Medicare and Medicaid programs. A recent report from GAO found that while CMS has implemented numerous GAO recommendations to reduce improper payments in Medicare (as well as Medicaid), there are additional opportunities to improve program integrity in these programs and save billions of dollars. GAO also annually publishes a high-risk series that identifies government operations vulnerable to fraud, waste, and abuse, and Medicare has been on this list since 1990 due to the size and complexity of the program. In addition, in 2015, GAO established a framework to manage fraud frisk in federal programs, which CMS uses for implementing its Medicare integrity programs.
This work was supported in part by Arnold Ventures. KFF maintains full editorial control over all of its policy analysis, polling, and journalism activities.
From understanding health insurance terminology like “deductibles” and “copays” to deciphering the contents of a bill, consumers can face various barriers when trying to understand the costs associated with their health insurance coverage. This lack of understanding may contribute to frustration and cost-related problems and can have far-reaching effects on consumer health and finances. The KFF 2023 Survey of Consumer Experiences with Health Insurance (“KFF Consumer Survey”) found that 27% of insured adults reported that their health insurance paid less than they expected for a bill they received from a doctor, hospital, or lab in the past twelve months, the biggest cost-related problem consumers reported experiencing. Efforts to make cost information more readily available and easy to understand could help reduce some of these problems.
The first brief of this two-part series on navigating health insurance complexities and consumer protections focused on how consumers understand what their health insurance covers, what they do when coverage is denied, and what federal protections exist to ensure that the information available to them and coverage determinations are fair, accurate, and timely. This second brief focuses on KFF Consumer Survey findings about consumers’ understanding of health insurance costs and examines existing federal protections that seek to address barriers to understanding the cost of coverage and care, such as price transparency, self-service price estimator tools, and simplifying cost-sharing designs.
KFF Consumer Survey Findings: Consumer Understanding of Costs Associated With Health Coverage
The KFF Consumer Survey included a nationally representative sample of 3,605 U.S. adults ages 18 and older with health insurance. The survey asked consumers how well they understand costs associated with their health coverage, cost-related health insurance terminology, and the difficulty level of comparing cost-related insurance options such as premiums and deductibles.
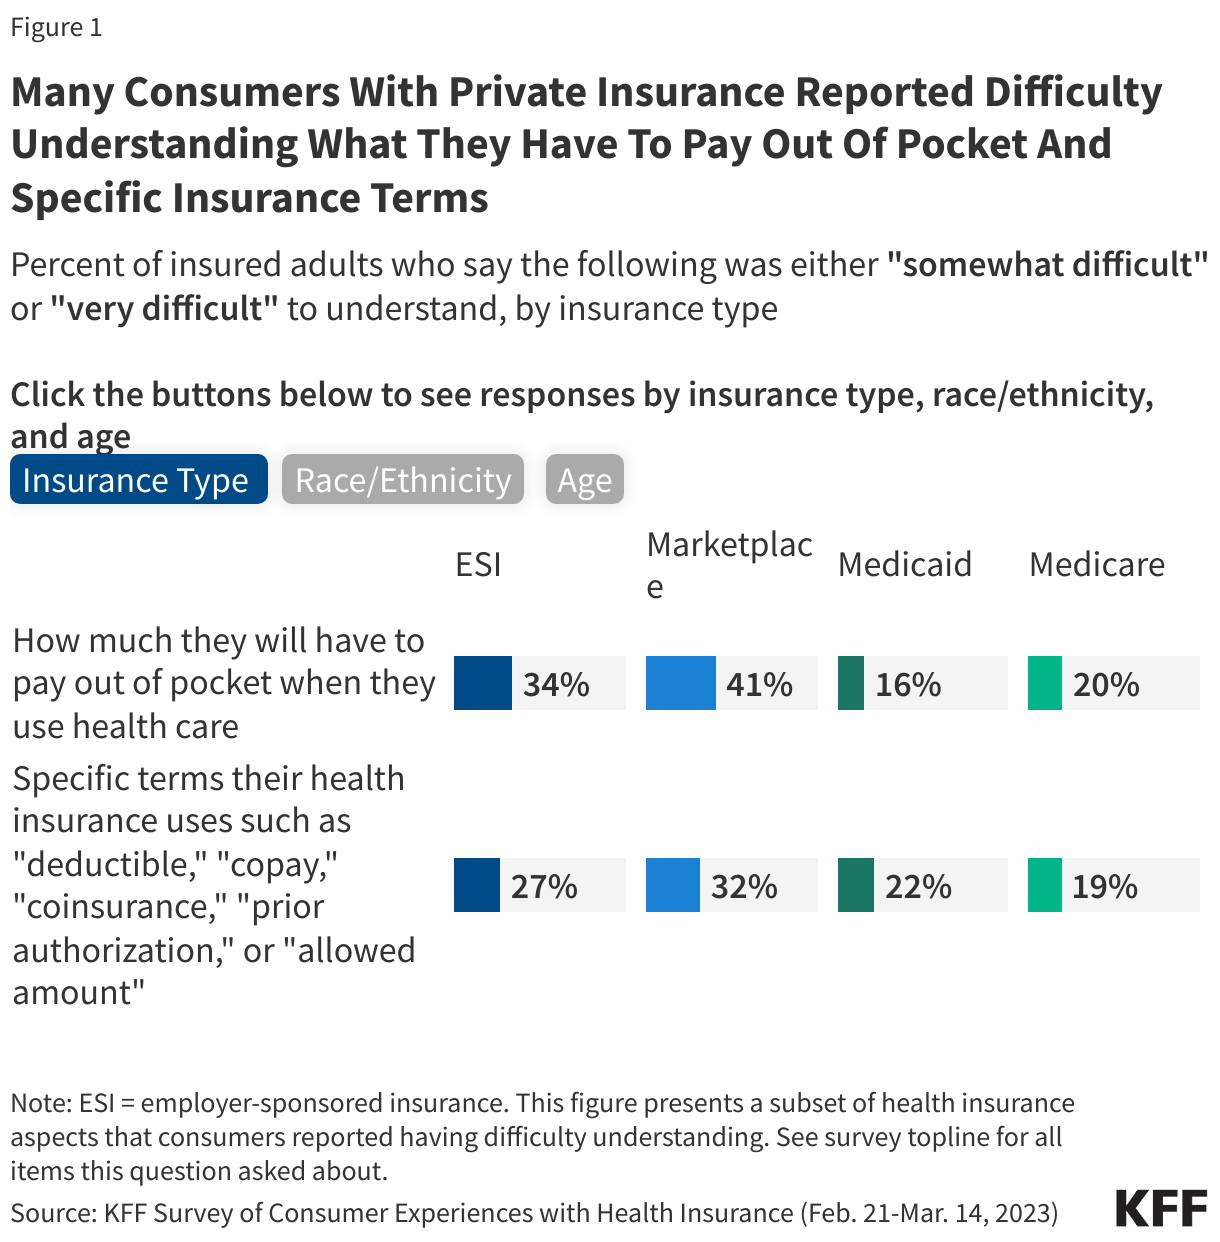
Three out of ten adults (30%) said that it was somewhat or very difficult to understand how much they would have to pay out-of-pocket when they use their health insurance. Marketplace (41%) and ESI (34%) enrollees were more likely to report this difficulty compared to Medicaid (16%) and Medicare (20%) enrollees (Figure 1). Insured White (30%) and Hispanic (32%) adults were more likely to report that it was somewhat or very difficult to understand how much they will have to pay out of pocket when they use health insurance compared to Black adults (23%). Additionally, insured adults ages 18-29 (35%), 30-49 (35%) and 50-64 (30%) were all more likely to report that it was somewhat or very difficult to know how much they will have to pay out of pocket when they use health insurance compared to those ages 65 and older (18%).
One-quarter (25%) of insured adults said that it was somewhat or very difficult to understand specific terms that their health insurance uses such as “deductible,” “copay,” “coinsurance,” “prior authorization,” or “allowed amount.” Those with Marketplace coverage (32%) and ESI (27%) were more likely to report that it was somewhat or very difficult to understand these terms compared to those with Medicaid (22%) and Medicare (19%) (Figure 1). Furthermore, Hispanic adults (31%) were also more likely to report difficulty in understanding these terms compared to White (23%) or Black (22%) adults. Insured adults between the ages of 18-29 (29%), 30-49 (30%), and 50-64 (25%) were all more likely to report difficulty in understanding these insurance terms compared to those ages 65 and older (17%).
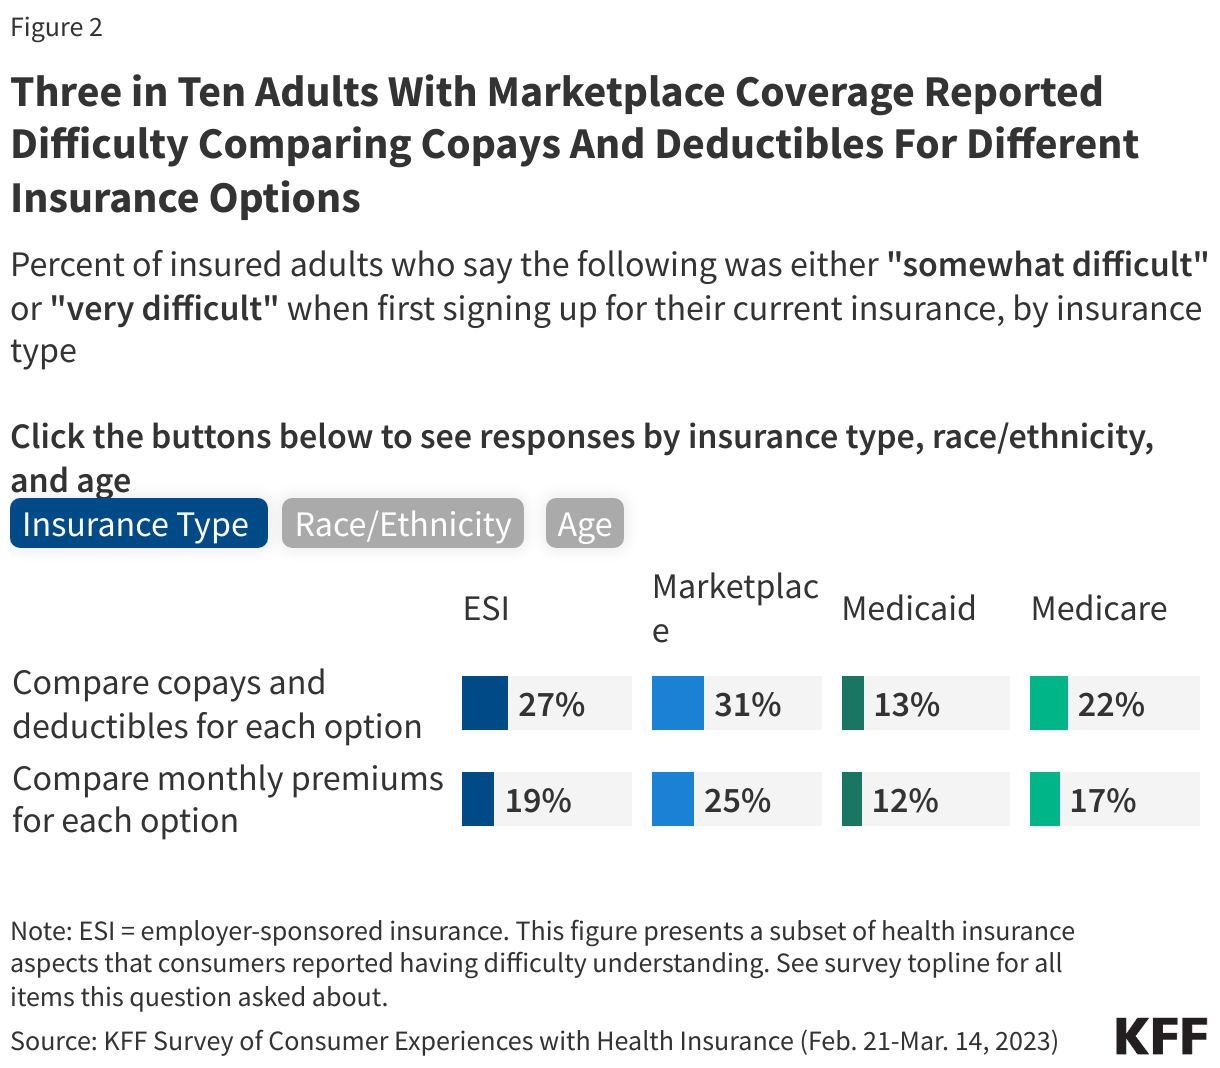
One in four (25%) insured adults reported that it was somewhat or very difficult to compare the copays and deductibles for each plan option. Those with ESI (27%) and Marketplace (31%) coverage were more likely to report having this problem compared to those with Medicaid (13%) or Medicare (22%) (Figure 2). A larger share of insured White (24%) and Hispanic (27%) adults reported difficulty comparing the copays and deductibles for each option than Black (19%) adults. Additionally, insured adults ages 18-29 (28%) and those ages 30-49 (27%) were more likely to report that it was somewhat or very difficult to compare the copays and deductibles for each option compared to those ages 65 and older (21%).
About one in five (19%) insured adults reported that it was somewhat or very difficult to compare the monthly premiums for each coverage option. Those with Marketplace coverage (25%) were more likely to report having this issue compared to those with ESI (19%), Medicaid (12%), or Medicare (17%) (Figure 2). Insured Hispanic adults (22%) were more likely to report difficulty comparing the plan premiums than White (17%) adults. Insured adults ages 18-29 (24%), 30-49 (20%), and 50-64 (19%) were all more likely to report that it was somewhat or very difficult to compare the monthly premium for each option compared to those ages 65 and older (13%).
Federal Consumer Protections that Seek to Address Barriers to Understanding the Cost of Coverage and Care
The KFF Consumer Survey indicates that many consumers have gaps in understanding what they will have to pay for the services they need before they receive care. Federal reforms related to health insurance costs aim to simplify and standardize cost sharing, set guidelines for the coverage of certain health benefits, and promote price transparency. Some of these changes may enable consumers with private coverage to better understand their coverage options and out-of-pocket obligations for covered benefits. This section focuses primarily on federal protections for individuals with private health insurance (individual and employer-sponsored), though public programs like Medicare and Medicaid have established many consumer protections as well.
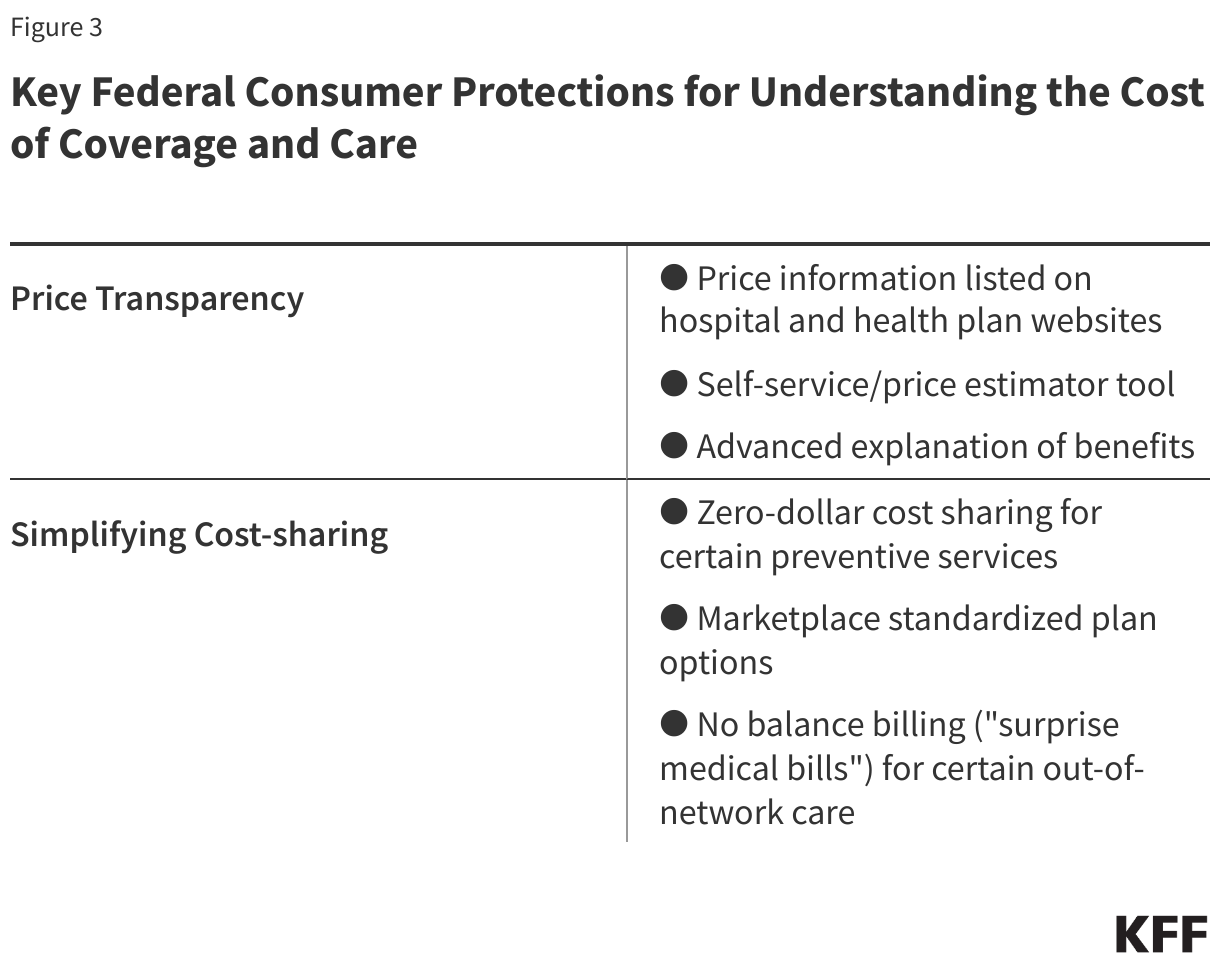
Providing Consumers with Cost Specific Information: Price Transparency
Federal reforms to private insurance aim to increase price transparency and promote competition among hospitals and among insurers, reduce health care costs, encourage patients to price-shop at different facilities by providing an estimate of patient out-of-pocket costs for a health care service or prescription drug, and help consumers make better plan selections. Reforms would allow consumers to look for price information about a service in at least three ways:
Search listed pricing information available on hospital and plan websites: Most hospitals in the U.S. are required to establish, update annually, and make public on the internet a comprehensive machine-readable file containing a list of their “standard charges” for all items and services that they provide. Standard charges are the regular rates established by hospitals for items and services. Standard charges alone are generally of less value to insured consumers when determining their out-of-pocket costs than the “allowed amount,” which is the maximum amount a specific health plan will pay for a covered benefit. This hospital price transparency requirement was included in the Affordable Care Act (ACA), with more extensive federal regulations (incorporating additional forms of pricing, including allowed amounts) issued in 2019 and effective in 2021. Separate federal price transparency standards require employer-sponsored plans and insurers to post on a publicly accessible internet site three machine-readable files disclosing different forms of pricing information specific to each plan: in-network provider-negotiated rates, historical out-of-network allowed amounts (the maximum amount a plan will pay for a covered health service received from an out-of-network provider), and prescription drug rates. Health plans and insurers must update these machine-readable files at least monthly and clearly state when it was last updated. This “Transparency in Coverage” requirement was created by 2020 regulations interpreting a provision in the ACA related to consumer transparency. These postings have been required since 2022, although full implementation of the prescription drug reporting was delayed.
The information posted to date under these two requirements is anything but consumer-friendly, as experts have noted their own problems evaluating the data. Data scientists and other researchers have reported finding this information overwhelming and sometimes inaccurate and difficult to decipher. As third-party entities aggregate this data to assist employer plans to make purchasing decisions and public policy researchers to evaluate costs, consumers themselves likely have limited ability to use the raw data on their own. There are few studies of the consumer experience with this machine-readabledata, especially whether they know it is available, and their ability to understand and use it.
Use a self-service or price estimator tool: In an effort to alleviate the complexity and possible confusion that was perhaps anticipated by policymakers when requiring the posting of large amounts of data in digital files, federal rules also require that more “consumer-friendly” tools be available so that consumers can obtain information about out-of-pocket costs before they get a service or drug. Under the hospital transparency regulation, hospitals must also compile and display online a “consumer-friendly” list of at least 300 “shoppable” services (e.g., having a baby, getting a hip replacement), including 70 services specified by the Centers for Medicare & Medicaid Services (CMS) and any additional procedures chosen by the hospital. The list must include a plain language description of each procedure, discounted cash prices, payer-specific (i.e., private insurers, Medicare, Medicaid) negotiated prices, and de-identified minimum and maximum negotiated prices for all third-party payers for an item or service. As an alternative to this “consumer-friendly” list, a hospital can instead create and maintain an online price estimator tool that:
Provides estimates for at least 300 shoppable services (including the 70 CMS-required services).
Is displayed on the hospital website for easy access (i.e., does not require payment or the creation of an account to use the estimator tool); and
Allows consumers to obtain an estimate of the amount they will be expected to pay the hospital for the shoppable service before they receive it.
The Transparency in Coverage regulation requires plans and insurers to provide cost-sharing information via an internet self-service tool that consumers can use to obtain personalized out-of-pocket estimates for in- and out-of-network health care items and services (including prescription drugs and medical equipment). Plans and insurers must make other information—such as the negotiated rate for a service, and whether the service is subject to prior authorization—available through a billing code or service description search. This rule was fully effective in 2024.
In addition, in 2020 Congress passed and President Trump signed the Consolidated Appropriations Act (CAA), which required plans and insurers to make a “price comparison tool” available on the internet, in paper form, and by telephone. Since this tool is similar to the Transparency in Coverage self-service tool, federal agencies state in guidance that they have deferred enforcement of this CAA price comparison tool requirement.
Review an Explanation of Benefits before care is received (Advanced Explanation of Benefits (AEOB)): In addition to the transparency initiatives above, Congress also included in the CAA another transparency-related protection—the Advanced Explanation of Benefits—to help consumers better understand their expected out-of-pocket cost for a service before they receive it so they can budget and/or compare cost to other providers. This was part of the No Surprises Act, a group of consumer protections included as part of the CAA.
When scheduling care or upon request health care providers and facilities must provide a personalized good faith estimate of the provider’s expected charges to the consumer’s employer plan or insurer. The plan or insurer must then use this information to create an Advanced Explanation of Benefits for the consumer that includes standard Explanation of Benefits information such as the provider’s expected charge, what the plan expects to pay, and the amount the consumer is expected to pay.
Implementation of this provision of the law has been challenging, according to CMS, as it will require coordination between providers and plans, and likely the development and testing of a single industry-wide electronic interchange standard. The agencies involved had convened an industry working group as well as consumer testing with prototype Advanced Explanation of Benefits. The rule’s 2022 effective date has been delayed.
Although the Advanced Explanation of Benefits has not yet been implemented, providers and facilities must provide a good faith estimate to uninsured and self-pay patients upon request or in advance of a scheduled service, within a specified timeframe. If the final bill is $400 or more above the good faith estimate, consumers may be able to dispute the bill through a patient-provider dispute resolution process. Eligible consumers may submit a complaint to CMS if the provider did not give the patient a good faith estimate or if the provider does not honor a dispute resolution in the patient’s favor.
Simplifying Cost Sharing and Other Consumer Out-of-Pocket Payments to Limit Cost and Address Complexity
The ACA ushered in new federal requirements to limit out-of-pocket spending for consumers with private insurance, with protections that set parameters for the design of certain health plan options and limited cost sharing so that it is the same whether the consumer has employer coverage or other private coverage on- or off- Marketplace. Marketplace plans have gone further through standardized plan options. The No Surprises Act’s reforms address balanced billing, eliminating it for certain services. All look to make costs more understandable and predictable for patients. These protections include:
Maximum out-of-pocket limit: All non-grandfathered private plans are required to set an annual cap on cost sharing for essential health benefits received in-network. These dollar limits are adjusted each year. For the 2025 plan year, the maximum out-of-pocket limit is $9,200 for self-only coverage and $18,400 for family coverage. Once a consumer reaches the maximum out-of-pocket limit, the insurer is required to cover 100% of the cost of essential health benefit services received in-network for the remainder of the plan year.
Ban on annual and lifetime dollar limits: All private plans, including grandfathered plans, are prohibited from imposing annual or lifetime dollar limits on coverage for essential health benefits, whether for in-network or out-of-network services. An annual dollar limit refers to the maximum amount an insurer would pay for covered benefits within a given year, whereas a lifetime dollar limit is the total dollar amount that a health plan would pay for as long as a consumer was enrolled in the plan. Prior to the passage of the ACA, an estimated 70 million people in large employer plans, 25 million in small employer plans, and 10 million with individual coverage had lifetime limits on their health coverage.
Zero-dollar cost sharing for certainpreventive services: Under the ACA, all private, non-grandfathered plans must cover a range of preventive services and not apply cost sharing, including:
Evidence-based screenings and counseling for adults recommended by the U.S. Preventive Services Task Force (USPSTF) with an “A” or “B” rating such as cancer screenings, prenatal care, and medications that help prevent heart disease
Routine immunizations for adults and children recommended by the Centers for Disease Control and Prevention’s Advisory Committee on Immunization Practices such as influenza, measles, and COVID-19
Preventive care for infants, children, and adolescents recommended by Health Resources and Services Administration’s (HRSA) Bright Futures Program such as well-child visits, autism screening, and fluoride supplements
Additional preventive services for women as recommended by HRSA’s Women’s Preventive Services Initiative such as contraception, breast cancer screening, and breastfeeding supplies and support
Marketplace standardized plan options: Plans in the Marketplace are separated into categories — Bronze, Silver, Gold, or Platinum — based on the amount of cost sharing they require. In general, plans with lower cost sharing have higher premiums, and vice versa. For example, Bronze plans have the highest cost sharing but lower premiums, and Platinum plans have the lowest cost sharing but higher premiums. There can be substantial variation in plan details, even within the same insurer (e.g., premiums, provider networks, covered benefits, plan network types).
Standardized plan designs (also known as “easy pricing”) were created to simplify and streamline plan comparison and selection offered on the federally facilitated Marketplace (FFM), state-based exchanges using the federal platform (SBE-FPs), and some state-based Marketplaces (SBMs) by applying the same deductibles, copays, coinsurance, and out-of-pocket maximums to each category of essential health benefits across all Easy Price plans in the same metal level. For example, in 2025, the annual deductible for covered services under all Gold level Easy Price plans is $1,500, regardless of insurer. By contrast, other non-standardized Gold level plans might have different deductible and copay amounts.
Standardized plan design options were also designed to improve affordability by covering certain services before the deductible is met. All Easy Price plans must waive the deductible and instead apply a fixed dollar copay (e.g., $30 for a Gold Easy Price plan) for the following items and services: primary care and specialist office visits, urgent care visits, outpatient visits for mental health and substance use disorder treatment, physical therapy visits, and generic and preferred-brand drugs.
Not all Marketplace plans are standardized, though Marketplace plans must offer a standardized plan option at every product network type, metal level, and throughout each service area where they offer non-standardized plan options. Insurers can still choose to offer non-standardized plan options in the individual market but are limited to two plan options per product network type (i.e., HMO, PPO, EPO, POS) for plan year 2025.
Research has shown that having too many choices can confuse consumers and lead to them choosing suboptimal coverage. As implemented to date, HealthCare.gov’s requirement to offer standardized plan options may have increased, not decreased, the number of plan choices consumers face. Though consumers in most areas will continue to have a large number of plan choices for the foreseeable future, over time, that number may become more manageable.
Prohibition on balance billing for certain out-of-network care: Also known as “surprise medical bills,” balance billing can occur in medical emergencies, when insured patients are not necessarily able to choose an in-network hospital or provider as well as in non-emergencies when patients inadvertently receive care from an out-of-network provider at an in-network facility. In these cases, patients can be liable for the balance bill from the provider plus any cost sharing under their health plan. As of 2022, many of these types of balance bills are now prohibited under the No Surprises Act. The No Surprises Act generally protects patients with individual and employer-sponsored insurance by:
Requiring private health plans to cover these out-of-network claims and apply in-network cost sharing for certain covered benefits.
Prohibiting out-of-network providers, facilities, and providers of air ambulance services from billing patients more than in-network cost sharing for certain out-of-network care.
Requiring providers and facilities to provide patients with written notice explaining surprise billing protections, who to contact for concerns about potential violations, and how they can waive billing protections if they choose to do so.
Looking Forward
Consumer understanding of their coverage costs can play a significant role in seeking needed health care. One study found that lower health literacy scores were associated with consumers delaying or forgoing preventive care due to perceived health care costs. While better consumer education and outreach can help, the inherently complicated and profit-driven insurance and health care system includes few incentives to provide consumers with individualized and impartial assistance. However, several existing consumer protections, if implemented and enforced, as well as a broader health policy focus on how to improve the consumer experience, could make a difference.
Focus on price transparency: Despite a deregulatory agenda and recent cuts to agency staff, the Trump administration has directed the agencies to better enforce price transparency regulations. However, these machine-readable files with lists of prices and procedure codes currently have limited value to help consumers directly without an impartial analysis of the data and user-friendly vehicles to describe the information. Price estimators, also required as part of the Transparency in Coverage rule, have the potential to have more value to patients. However, while consumers may want an estimate of their expected out-of-pocket costs for a covered benefit, their awareness of the existence of these estimator tools and the likelihood of using them will influence how effective the regulation is at achieving its aims. Research conducted before and after its implementation showed mixed results on the consumer experience using these tools and their effectiveness in lowering out-of-pocket costs and health care costs overall. There is also concern that consumers will conflate high-cost with high-value care when price estimator tools do not incorporate quality metrics, potentially leading to higher health care spending. In an era of rapid developments in digital technology and artificial intelligence, ways to improve, consumer test, and standardize these tools and encourage their use may be one area of future focus.
Spotlight on cost-sharing protections: Getting renewed attention in the coming months and years are standardized cost-sharing designs that have or have the potential to provide more transparency and predictability about out-of-pocket costs for consumers. The U.S. Supreme Court will decide a case that could end free coverage of certain preventive care services recommended by the U.S. Preventive Services Task Force. A decision in that case is expected later this year. Consumers also await implementation of the Advanced Explanation of Benefits, as a key tool for patients to get cost information upfront. The coordination between plans and providers required for this initiative could go a long way to help patients often caught in the middle between plans and providers not working with each other in the best interest of consumers.
Finally, look for more attention to prescription drug costs and a cost-sharing protection that has been in place across all private insurance for over a decade, the maximum out-of-pocket limit, or cost-sharing limit. Many people who take certain high-cost medications receive financial assistance from drug manufacturers to offset their out-of-pocket costs. In recent years, private plans (excluding those offered to federal workers) have increasingly applied copay accumulators and copay maximizers when an enrollee receives this manufacturer assistance. Under these types of adjustment programs, the amount of financial assistance an enrollee receives does not count toward an enrollee’s out-of-pocket obligations, including the maximum out-of-pocket limit. Research has found that there is little transparency in how these programs operate and research has demonstrated that consumers are not always aware that their health plan contains these features. After a court challenge and a recent change in essential health benefit regulations, the federal government might be poised to confirm and clarify that cost sharing includes amounts received from pharmacy financial assistance programs and that plans must count those amounts toward the maximum out-of-pocket limit.
Continuing state-level initiatives to improve cost transparency: State-level initiatives that aim to improve cost transparency and help prevent medical debt could play a larger role if federal enforcement and regulations concerning consumer protections are stalled. New York, for example, enacted a bill in 2024 that bans a common provider practice, requiring patients to agree to cover the costs of a bill that their insurer does not cover before services are rendered (referred to as a “consent-to-bill” form) and requiring providers have a discussion with their patients about costs of services before signing this form. Although the state has indefinitely delayed full implementation of this law, the requirement for providers to discuss costs with the patient before asking them to sign the consent-to-bill form would still apply.
States continue wide-ranging activity to address high prescription drug costs in private insurance as public concern about high prescription drug costscontinues to mount. For example, pharmacy benefit manager (PBM) practices have been criticized for driving up prices and for being shrouded in secrecy. In response, many states have passed laws that aim to improve PBM transparency and reporting requirements, prohibit PBM policies that prevent pharmacists from telling patients when a lower-cost option might be available, and prohibit PBMs from steering enrollees to PBM-owned pharmacies, among others. Whether these laws apply to all private insurance, including self-insured private employer plans, is an open question.
This work was supported in part by a grant from the Robert Wood Johnson Foundation. The views and analysis contained here do not necessarily reflect the views of the Foundation. KFF maintains full editorial control over all of its policy analysis, polling, and journalism.
This volume features findings on beliefs about bird flu from KFF’s latest Tracking Poll on Health Information and Trust, as well as the false promotion of vitamin A as a preventative for measles. The Monitor also shares developments in content moderation on social media and how a study about mental health after gender-affirming care is misrepresented to make false claims about health care for transgender and non-binary people. Additionally, this volume explores when people prefer to use an AI chatbot, instead of a person, for health information.
Featured: Latest KFF Poll Finds Many Are Unaware of Current Public Health Recommendations on Bird Flu
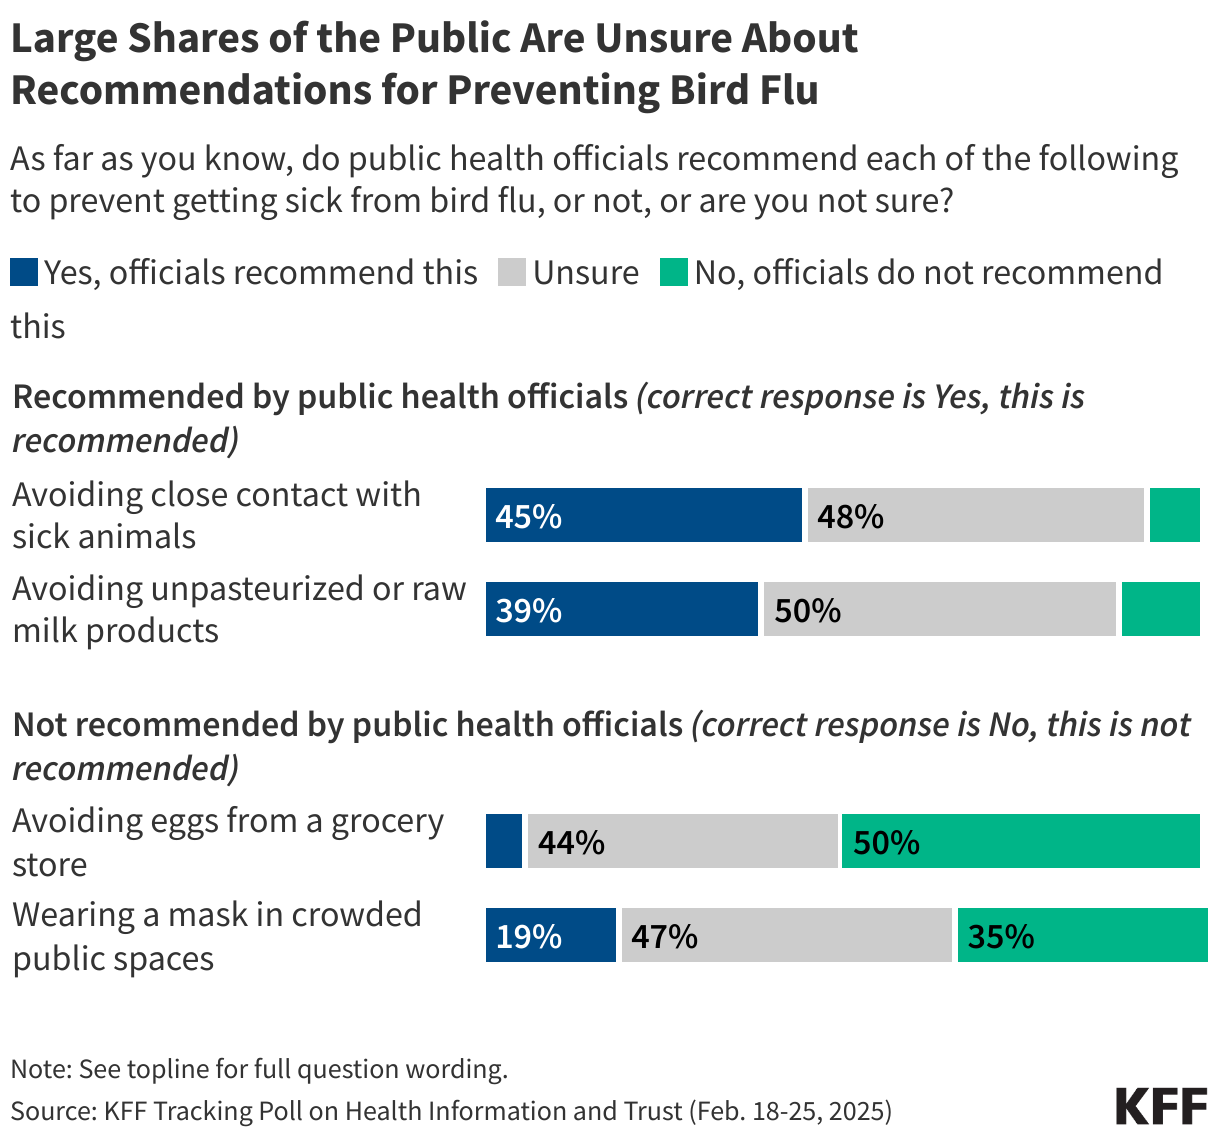
KFF’s latest Tracking Poll on Health Information and Trust finds that large shares of the public are unaware or unsure of what precautions are currently recommended by the CDC to protect individuals from bird flu. Fewer than half of adults are aware that public health officials recommend avoiding close contact with sick animals (45%) and avoiding unpasteurized or raw milk products (39%), with most adults saying they are either unsure or incorrectly saying these actions are not currently recommended. Half of the public is aware that public health agencies are not recommending avoiding eggs from a grocery store for bird flu prevention, while about one-third (35%) are aware that wearing a mask in crowded spaces is not currently recommended for bird flu prevention.
The survey also found notable partisan gaps when it comes to trust in the CDC for bird flu information. Fewer than half of Republicans (42%) say they trust the CDC at least a “fair amount” to provide reliable information about bird flu, compared to larger shares of independents (61%) and Democrats (72%) who expressed trust. This partisan divide on trust in the CDC is consistent with KFF’s past polling showing divisions in trust in the agency on health issues in recent years, but represents a shift from the start of the COVID-19 pandemic when at least eight in ten adults across partisans expressed trust in the CDC to provide information on coronavirus.
Recent Developments
False Claims about Vitamin A for Measles Prevention as Outbreak Grows
Natalya Maisheva / Getty Images
A measles outbreak in Texas and other states continues to grow, with cases quickly rising and multiple deaths reported. According to the Centers for Disease Control (CDC), two doses of the measles, mumps, and rubella (MMR) vaccine are 97% effective in preventing measles. However, growing concerns about vaccine safety have contributed to declining vaccination rates, exacerbating the outbreak. According to the Texas Department of State Health Services, only five patients diagnosed with measles in the current outbreak are known to have received at least one dose of the vaccine, although the department notes that some patients may have been vaccinated after exposure to reduce the risk of severe illness.
Alongside growing vaccine hesitancy, some are turning to nutrition as an alternative prevention method. One emerging narrative promotes vitamin A and other nutritional supplements as an effective way to prevent and treat measles. On March 4, a prominent organization that spreads false claims about vaccine safety shared a post on X stating that the CDC’s website now recommends vitamin A treatment for children who are hospitalized with severe measles. While the CDC has updated its measles guidance, it recommends vitamin A treatment only in a hospital setting and under a doctor’s supervision. Some comments advocated for the MMR vaccine and correctly warned that too much vitamin A without medical supervision may cause both short-term and long-term health complications, others falsely suggested that giving children high doses of vitamin A is a safe and effective way to prevent measles.
Vaccine opponents who promote this claim often cite research showing that vitamin A deficiency—which is rare in the U.S.—can increase the risk of death from measles and other infections to falsely suggest that vitamin A prevents measles. The World Health Organization recommends vitamin A along with vaccination for children at risk of vitamin A deficiency in countries where vitamin A deficiency is common, but it cannot prevent measles infection and long-term, repeated use can carry risks, including liver damage. Even a single large dose of vitamin A can cause nausea, vomiting, blurred vision, and dizziness.
The claims gained traction when Department of Health and Human Services (HHS) Secretary Robert F. Kennedy Jr. published an op-ed for Fox News where he acknowledged that vaccines prevent measles, but also wrote that “good nutrition remains a best defense against most chronic and infectious illnesses.” In an interview with Fox News, Kennedy said that doctors in Texas were giving cod liver oil, which is high in vitamin A, to their patients and “getting very, very good results.” He has since falsely claimed that the MMR vaccine causes the measles-like illnesses, including encephalitis, and leads to deaths every year. However, there are only three published reports of encephalitis among those who are vaccinated, and a study from the CDC’s Immunization Safety Office found no causal link between the MMR vaccine and death.
Social Media Health Content Moderation Under Scrutiny While FTC Launches Investigation
KFF / Unsplash
Meta is facing renewed criticism for restricting posts about abortion pills on Instagram and Facebook, with some accounts becoming undiscoverable in search results (“shadow banned”) or suspended entirely. Meta told The New York Times that it may have removed these posts or accounts if they violate the company’s policies on pharmaceutical sales, but reproductive health groups argue that these actions limit access to health information following the Supreme Court’s decision to overturn Roe v. Wade. Meta has recently pledged to scale back its fact-checking in an effort to uphold free speech, but these recent actions have led some, including U.S. Senator Ruben Gallego, to question whether Meta’s commitment to free speech applies equally to all issues.
Recent policy actions may further shape how health information is moderated online. In February, the Federal Trade Commission (FTC) launched an investigation into potential censorship by technology platforms, inviting public comments from users who have been “banned, shadow banned, demonetized, or otherwise censored.” As of March 11, more than 1,200 comments had been submitted, with some users reporting past removals of COVID-19 posts. In 2024, the Supreme Court reviewed the Biden administration’s role in moderating social media content on topics like COVID-19 and vaccines, but ruled that the plaintiffs did not have standing to bring the case. The FTC investigation follows an executive order from the Trump administration aimed at ending federal involvement in content moderation, while examining past efforts to curb health misinformation. While the executive order opposes censorship, other actions by the Trump administration have been accused of promoting it, including efforts to restrict information on gender equity.
Study on Transgender Mental Health Misrepresented to Discredit Gender-Affirming Care
A new study on the mental health of transgender people after gender-affirming surgery is being misrepresented to claim that gender-affirming care causes poor health outcomes. The retrospective study, published in the Journal of Sexual Medicine, found that transgender adults who had gender-affirming surgery were more likely to report negative mental health outcomes than transgender adults who did not have surgery. However, the authors do not attribute this effect to the surgery, stating instead that these findings may reflect: that individuals receiving gender-affirming surgery experience higher levels of baseline psychological distress compared to those who do not, provider charting practices that are more likely to record gender dysphoria prior to surgery and other mental health diagnoses after surgery, or that those individuals receiving surgery interact with the health care system more often and therefore have more opportunities for mental health diagnoses to be charted.
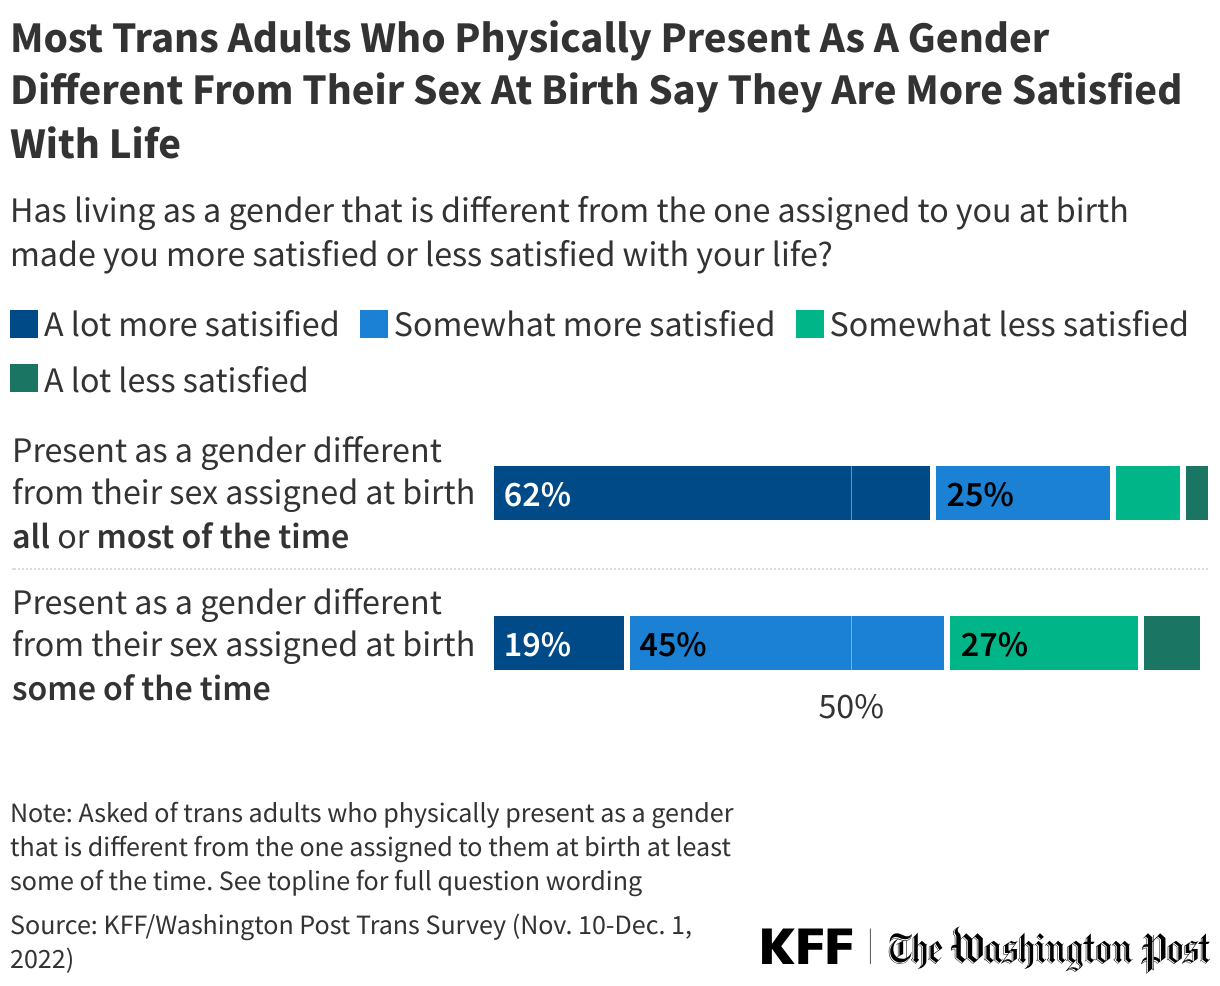
Transgender people often experience depression and anxiety due to minority stress, including enduring ongoing experiences of stigma and discrimination, even after transitioning. Discrimination in health care settings can further limit access to mental health care and contribute to systemic distrust. A 2023 KFF-Washington Post poll found that a majority of transgender adults (64%) have been verbally attacked because of their gender or sexual identity, while about three in ten trans adults said they had to teach a doctor about trans people to get appropriate care or had a doctor refuse to acknowledge their preferred gender identity. However, the poll also found that eight in ten (78%) trans adults say that living as a gender different from the one assigned to them at birth has made them “more satisfied” with their lives.
On X, a podcast host and author with approximately 4.8 million followers shared a screenshot of an article about the study and misinterpreted it to allege that gender-affirming surgery worsens mental health. As of March 11, the post received about 45,000 likes, 17,000 reposts, and 2,400 comments. Other X users, including commenters on the post, correctly noted that stigma may contribute to trans people experiencing ongoing mental health symptoms before and after surgery and that the study did not account for undiagnosed mental health outcomes before surgery. Some cited previous research showing that gender-affirming surgery is associated with improved mental health and noted that regret rates for gender-affirming procedures are significantly lower than those for other types of surgeries. More broadly, studies have found positive associations between gender-affirming care and mental health.
AI & Emerging Technology
Study Finds People Prefer Chatbots When Embarrassed, But Humans When Angry
d3sign / Getty Images
Researchers from the University of Kansas published the results of a study investigating differences in how people perceive health information provided by generative AI chatbots and information provided by humans. The study recruited 100 participants who were either angry or embarrassed when talking about COVID-19 vaccines and boosters, then randomly assigned them to discuss vaccine information with either an AI chatbot or a lab researcher. Afterwards, participants who were embarrassed reported that they preferred chatbots, while those who were angry reported a preference for humans. According to the researchers, this may be because chatbots can be perceived to be nonjudgmental, suggesting that AI chatbots could play a role in reaching certain audiences who may hesitate to seek health information from human sources. KFF polling from 2024 explored trust in AI chatbots for different types of information, highlighting potential limitations of using chatbots for health communication. While about half of adults said they trust AI chatbots at least a fair amount to give accurate information about practical tasks and technology, fewer trusted their reliability for information on health (29%) or politics (19%). Though certain hesitant audiences may be more comfortable getting health information from chatbots, their effectiveness may be limited by broader concerns about AI’s credibility.
About The Health Information and Trust Initiative: the Health Information and Trust Initiative is a KFF program aimed at tracking health misinformation in the U.S., analyzing its impact on the American people, and mobilizing media to address the problem. Our goal is to be of service to everyone working on health misinformation, strengthen efforts to counter misinformation, and build trust.
The Monitor is a report from KFF’s Health Information and Trust initiative that focuses on recent developments in health information. It’s free and published twice a month.
Support for the Health Information and Trust initiative is provided by the Robert Wood Johnson Foundation (RWJF). The views expressed do not necessarily reflect the views of RWJF and KFF maintains full editorial control over all of its policy analysis, polling, and journalism activities. The Public Good Projects (PGP) provides media monitoring data KFF uses in producing the Monitor.
To meet House budget resolution requirements, Congress will need to make major cuts to federal spending on Medicaid. An option under consideration is to limit the use of state taxes on providers, which could save hundreds of billions of dollars according to the Congressional Budget Office (CBO). Medicaid is jointly financed by the federal government and the states, with the federal government paying close to 70% of total costs in fiscal year (FY) 2023. States are permitted to finance the non-federal share of Medicaid spending through multiple sources, including state general funds, health-care related taxes (referred to as “provider taxes” throughout this brief), and local government funds. All states except for Alaska finance some of the state costs with taxes on health care providers, which may be imposed as a percentage of provider revenues or using an alternative formula such as a flat tax on the number of facility beds or inpatient days. The most common provider taxes are levied on nursing facilities (46 states) and hospitals (45 states).
Proponents of restricting provider tax authority say that providers and states receive federal matching funds without expending their own money, which can “inflate a state’s Medicaid match.” As the debate about broader Medicaid spending reductions continues, Republicans may try to recast restrictions on provider taxes as addressing fraud, waste, and abuse. Opponents of such restrictions note that provider taxes are permissible under current law and help fund Medicaid; and restricting provider taxes will create financing gaps for states that could result in higher state taxes, reductions in Medicaid eligibility, lower provider payment rates, and fewer covered benefits. Both proponents and opponents of new restrictions agree that the limited data about provider taxes makes it difficult to assess states’ reliance on them as a funding source and to understand how they affect net payments to providers. The Medicaid and CHIP Payment and Access Commission has submitted recommendations to Congress that states start reporting new data on Medicaid taxes and that those data be publicly available for analysis.
In light of the current debate, this issue brief uses data from KFF’s 2024-2025 survey of Medicaid directors, to describe states’ current provider taxes and the federal rules governing them.
1. All states except for Alaska use provider taxes to help finance the state share of Medicaid spending.
The federal government and states share responsibility for financing Medicaid, with the federal government guaranteeing states federal matching payments with no pre-set limit. States have considerable flexibility in determining how to finance the non-federal share of state Medicaid payments. In state FY 2024, states reported that about 68% of state Medicaid spending came from general funds, most of which come from income and sales taxes. The remaining 32% was funded by other sources including local government funds and provider taxes.
Medicaid provider taxes are defined as those for which at least 85% of the tax burden falls on health care items or services or entities that provide or pay for health care items or services (see Social Security Act, Section 1903(w)(3)(A)). States use provider tax revenues to fund Medicaid “base” rates and supplemental payments, to avoid Medicaid benefit cuts, and to expand Medicaid benefits. Some states have used revenue from provider taxes to finance the ACA Medicaid expansion. Beyond helping finance the state share of Medicaid, permissible tax arrangements may have potential financial benefits for providers who are subject to the tax and serve a high volume of Medicaid patients.
All states but Alaska finance part of the state share of Medicaid funding through at least one provider tax and 39 states have three or more provider taxes in place (Figure 1). While data are limited, the Government Accountability Office (GAO) estimated that provider taxes as a percent of the non-federal share of Medicaid spending in SFY 2018 ranged from less than 0.5% in New Mexico, South Dakota, Texas, and Virginia to more than 30% in Michigan, New Hampshire, and Ohio. Over time, states have increased their reliance on provider taxes, with expansions often driven by economic downturns. GAO reported that reliance on provider taxes had grown significantly over the preceding decade, increasing from 7% in 2008 to 17% in 2018. There are no more current estimates that are publicly available of provider taxes as a share of Medicaid spending.
2. Federal rules set limits on how states can use provider taxes.
States first began using provider taxes to finance the state share of Medicaid in the 1980s, when Medicaid providers would donate funds or agree to be taxed and the revenues from those donations and taxes would be used to finance a portion of the state’s share of Medicaid. According to the Congressional Research Service, states were essentially “borrowing funds from Medicaid providers in order to draw down federal funds and increase Medicaid payment rates to the providers that had paid taxes or donated funds.” The particularly aggressive use of those taxes by some states spurred statutory and regulatory limitations on provider taxes starting in the 1990s. Federal rules now specify that provider taxes must be:
Broad-based, which means the tax is imposed on all providers within a specified class of providers (e.g., the tax cannot be imposed only on providers that see primarily Medicaid patients);
Uniform, which means the tax must apply equally to all providers within the specified class (e.g., the tax rate cannot be higher on Medicaid revenue than non-Medicaid revenue); and
Not hold taxpayers (providers) “harmless,” which means states are prohibited from directly or indirectly guaranteeing that providers will receive their tax revenues back (i.e., be “held harmless”).
There are 19 classes of providers that the Centers for Medicare and Medicaid Services (CMS) uses to ensure that the tax programs are broad-based and uniform (see 42 CFR Section 433.56). In assessing whether provider taxes comply with federal laws, current regulations specify that the hold harmless requirement does not apply when the tax revenues comprise 6% or less of net patient revenues from treating patients (see 42 CFR Section 433.68), a level sometimes referred to as a “safe harbor” limit. States may also receive waivers of the requirement that taxes be broad-based and uniform if the state can prove the net effect of the tax is “generally redistributive,” and that the amount of tax is not directly related to Medicaid payments.
Policy proposals that would reduce the “safe harbor” limit below 6% could affect most significantly the 38 states that have one or more provider taxes that exceed 5.5% of provider net patient revenues (Figure 2). However, if the limit were reduced significantly enough, all states with provider taxes could be affected. There are 10 states with at least one provider tax that is between 3.5% and 5.5% of net patient revenues. One state (Georgia) reports that all provider taxes are below 3.5% of net patient revenues.
3. Provider taxes are most common for institutional providers.
Provider taxes fall on a wide range of provider types but are most common for institutional providers including nursing facilities (46 states), hospitals (45 states), and intermediate care facilities for people with intellectual or developmental disabilities (32 states, Figure 3). States often use provider tax revenues to support payment rates for providers, often by financing supplemental payments like disproportionate share hospital (DSH) payments, upper payment limit (UPL) payments, and managed care state directed payments (uniform payment increases through managed care that are similar to supplemental payments). Hospitals’ base fee-for-service rates vary considerably across states and, on average, are below hospitals’ costs of providing services to Medicaid enrollees and below Medicare payment rates for comparable services, causing some states to rely more heavily on supplemental payments than others to help cover hospitals’ costs. It is unknown from available data how much states are paying hospitals after accounting for base payments, supplemental payments, and the costs of provider taxes (e.g., the net payment rate), which is one reason why the Medicaid and CHIP Payment and Access Commission has called for greater transparency around provider taxes.
Although data on the use of revenues from provider taxes are limited, GAO found that in 2018, states financed a higher percentage of the state share of supplemental payments (e.g., DSH and non-DSH supplemental payments) using provider taxes than they did for other types of Medicaid payments (i.e., base payments). The use of provider taxes to fund supplemental payments to providers has raised some questions regarding compliance with hold harmless requirements for provider taxes. In April 2024, CMS released guidance to states about this issue, noting they will work with states to identify impermissible hold-harmless arrangements but will not take enforcement action until January 2028, allowing states time to come into compliance.
Beyond institutional providers, 20 states have provider taxes on managed care organizations (MCOs), 17 on ambulance providers, and 11 on “other” provider types such as ambulatory care facilities and home care providers (Appendix Table 1). The Deficit Reduction Act of 2005 required states that tax Medicaid MCOs to tax all MCOs uniformly, thus limiting the ability of states to only tax Medicaid MCOs. However, CMS has the authority to waive the uniformity requirement, and other federal requirements if the tax is determined to be “generally redistributive.” The formula for determining whether a waiver request is “redistributive” has allowed states to impose Medicaid taxes primarily on Medicaid enrollees, raising CMS concerns. For example, in California the tax is set at a much higher rate for Medicaid enrollees relative to privately-insured enrollees, which means that 99% of the tax burden falls on Medicaid member months. As a result, there may be issues with the hold harmless requirements because the MCOs paying for nearly all the tax payments also receive premium payments from the state to provide Medicaid coverage, and those premium payments reflect the tax expense. In its approval letter of California’s recent provider tax waiver in January 2025, CMS included a companion letter informing the state that CMS was contemplating proposed regulatory changes that could affect the legality of California’s MCO tax in future years.
4. Provider tax revenues are most likely to be near the safe harbor limit for long-term care providers.
Tax revenues are nearest to the safe harbor limit most often for nursing facilities and intermediate care facilities for people with intellectual or developmental disabilities (Figure 4). If provider tax revenues are 6% or less of patient net revenues, they are not subject to hold harmless requirements, meaning the revenues may fund payments back to the providers being taxed. Proposals to reduce the 6% “safe harbor” limit would likely most significantly affect states with taxes already near the upper limit. Provider taxes that exceed 5.5% of net patient revenue are most common for nursing facilities (22 states) and intermediate care facilities (17 states), both of which provide long-term care for people who need help with the activities of daily living. There are also 13 states that have provider taxes exceeding 5.5% of net patient revenues for hospitals.
5. Further limits on provider taxes are likely to reduce Medicaid spending, coverage, and payment rates.
The recently passed House budget resolution targets cuts to federal Medicaid spending of up to $880 billion or more over a decade. To put the size of the spending cuts in perspective, $880 billion represents 6% of state taxes per resident and 19% of states’ spending on education per pupil, so offsetting the loss of federal revenues would be challenging for states, particularly considering that states generally must balance their budgets. Assuming states will be unable to replace cuts of that magnitude, they will face difficult choices about whether to reduce Medicaid spending by covering fewer people, eliminating optional benefits, or reducing provider payment rates.
There are not yet detailed proposals under consideration by Congress to achieve federal Medicaid spending reductions, but the Congressional Budget Office (CBO) estimated that reducing the safe harbor limit for provider taxes could save tens or hundreds of billions of dollars depending on the size of the reduction (Figure 5). If the hold-harmless threshold were reduced to 5%, CBO estimates the federal government would save $48 billion over 10 years. If the hold-harmless threshold were eliminated, savings would be $612 billion.
CBO’s estimates of federal spending reductions are based on the agency’s assessment that states will reduce Medicaid spending, resulting in people losing Medicaid coverage. While CBO provides national estimates, the effects would vary significantly across the states. States with provider taxes near the safe harbor limit would be affected by even modest changes whereas states with lower provider taxes would only be affected by more significant reductions. Effects on total Medicaid spending and enrollment would also vary based on how much states offset lost provider tax revenues with other sources of funding. Because provider taxes often support Medicaid payment rates, there will almost undoubtedly be downward pressure on payment rates if provider taxes are restricted, particularly for institutional providers including nursing facilities, intermediate care facilities, and hospitals.
The U.S. has been involved in efforts to improve the health of those living in low- and middle-income countries for decades and has been the largest donor to global health in the world. Starting on January 20, 2025, as part of a larger foreign aid review, the Trump administration began to take several steps to defund and dismantle most of the U.S. global health response, rendering its future uncertain. To better understand the U.S. global health response, as it was before this date, here are key facts to know (also see 10 Things to Know About U.S. Funding for Global Health):
1. What have been the goals of U.S. global health efforts?
U.S. global health efforts aim to help improve the health of people in developing countries while also contributing to broader U.S. global development goals (e.g., advancing a free, peaceful, and prosperous world), foreign policy priorities (e.g., promoting democratic institutions, upholding universal values, and promoting human dignity), and national security concerns (e.g., protecting Americans from external threats, sustaining a stable and open international system).1
2. How long has the U.S. been involved in global health?
The U.S. government (U.S.) has been engaged in international health activities for more than a century beginning with efforts in the late 1800s to join with other nations to form the first international health organizations, standards, and treaties designed to promote growing international trade and travel while protecting borders from external disease threats. Since then, U.S. engagement in global health has grown considerably, particularly after the launch of USAID in 1961, the U.S. international development agency, but most markedly in the last two decades with the creation of PEPFAR and other signature U.S. global health efforts. Heightened engagement has been driven by factors such as globalization, the growing recognition that infectious disease threats – including the emergence of new infectious diseases such as HIV, SARS, avian influenza, and COVID-19 – are threats to national security in the U.S. as well as abroad, as well as demonstrated success in addressing global health challenges, such as polio.
3. How much global health funding does the U.S. provide?
In FY 2024, the U.S. provided $12.4 billion to global health. Most funding (81%) was provided bilaterally (provided to or on behalf of other countries or regions), reaching almost 80 low- and middle-income countries, primarily in sub-Saharan Africa. The remaining share was provided to multilateral institutions (where it is pooled with funding from other donors and, in turn, disbursed to countries and programs by the multilateral institution). U.S. funding for global health, however, represents a very small share of the federal budget (<1%). See Figure 1.
4. How does the U.S. rank as a global health donor?
The U.S. government has been the largest donor to health in low- and middle-income countries. The U.S. provided 42% of all international health assistance from major donor governments in 2023 (see Figure 2), the largest of any donor. In addition, the U.S. has historically devoted a larger share of its foreign assistance to health than other donor governments; global health accounted for almost 30% of U.S. foreign assistance in 2023 (all other donor governments devoted less than 20% of their foreign aid budget to global health).
5. What are the main U.S. bilateral global health programs and priorities?
The U.S. has focused its global health work on several main areas and programs, including establishing major initiatives such as PEPFAR, its signature global HIV/AIDS program. These programs include (see Figure 3 for funding amounts):
6. What are the main multilateral health organizations supported by the U.S.?
The U.S. government has been a major donor to several multilateral organizations, including those that are United Nations (U.N.) entities as well as independent, public/private partnerships:
the National Security Council (NSC), within the White House, which is responsible for coordinating and reviewing the U.S. strategy and activities, particularly for GHS;
the Department of State, including the Bureau of Global Health Security and Diplomacy (GHSD);
the Department of Health and Human Services (HHS), including the Office of Global Affairs (OGA), the Centers for Disease Control and Prevention (CDC), the National Institutes of Health (NIH), and the Food & Drug Administration (FDA); and
the Department of Defense (DoD).
To implement health programs, the U.S. government partners with many organizations, ranging from non-profit and private sector organizations to foreign governments and international and multilateral organizations. In FY 2022, of the $10.6 billion in U.S. global health funding obligated to non-U.S. government recipients, the largest share (45%) went to U.S. NGOs, followed by multilateral organizations (34%), foreign NGOs (17%), and foreign governments (3%).
8. What do we know about the effectiveness of U.S. global health efforts?
9. What does the American public think about the U.S. involvement in global health?
Overall, there is broad support for the U.S. playing a role in improving the health for people in developing countries, although support is split along party lines, with the share of Republicans saying the U.S. should play a major role in this area declining since 2016. Half of the public says the U.S. should take a leading or major role in improving health for people in developing countries, while about one-third (36%) say the U.S. should take a “minor role.” Just over half the public says that before Trump took office this year, the U.S. was spending too little (19%) or about the right amount (37%) on these efforts. The public continues to recognize a benefit of spending money on global health. A large majority say that spending money on improving health in developing countries helps protect the health of Americans by preventing the spread of infectious diseases, although support is split along party lines, with most Democrats (86%) and many independents (67%) but fewer Republicans (49%) saying this spending helps Americans in this way.
10. What has the Trump administration done to affect the U.S. global health response?
Starting on January 20, 2025, the first day of his second term, President Trump began to announce numerous executive actions, several of which directly address or affect U.S. global health efforts. These have included a foreign aid freeze and “stop-work order”, cancelling the vast majority of foreign aid grants and contracts, and moving to dismantle USAID (the main implementing agency of U.S. global health efforts). As a result, many U.S. global health programs have been effectively shuttered. This situation presents considerable risks to the health of millions of people in low- and middle-income countries. Multiple lawsuits have been filed challenging these actions and litigation is ongoing.
Update: This rule was finalized on June 25, 2025 and was virtually the same as proposed rule, allowing the change to go into effect for the 2026 plan year. Differing from the proposed rule, which offered no definition, HHS defines “sex-trait modification” services to inlcude “any pharmaceutical or surgical intervention that is provided for the purpose of attempting to align an individual’s physical appearance or body with an asserted identity that differs from the individual’s sex.”
On March 10th, CMS issued a proposed rule that seeks to change how plans sold on and off the Affordable Care Act’s (ACA) Marketplaces (plans for individuals and small businesses), would cover gender affirming care services, which the rule calls “coverage for sex-trait modification1 .” The rule proposes, beginning plan year 2026, to prohibit insurers from covering gender affirming care as an essential health benefit (EHB), which could lead insurers to drop coverage or shift costs to individuals and states.
Essential Health Benefits
The ACA requires non-grandfathered individual and small group health plans to cover a package of EHBs which must be “equal to the scope of benefits provided under a typical employer plan”, are protected by cost-sharing limits, and count towards a plan’s actuarial value as defined in the law. EHB packages vary by state and must include 10 categories of benefits. To date, there have been very few specific services issuers are prohibited from covering within EHBs (prohibited services have included abortion, non-pediatric dental or eye exam services, long-term nursing care, or nonmedically necessary orthodontia).
States vary in how their EHB-benchmark plans treat gender-affirming care with some explicitly covering or excluding and others not explicitly stating a coverage policy. Additionally, separate from EHB benchmark selection, some states have their own mandated benefits which can include gender affirming services and 24 states and Washington, DC prohibit exclusions for transgender related care.
While the policy aim of the proposed rule aligns with the administration’s Executive Orders on gender and limiting access to gender affirming care, certain provisions of these orders are currently subject to preliminary injunctions and the agency states that the proposal “does not rely on the enjoined sections of the executive orders in making this proposal.” Instead, CMS writes that they are proposing the prohibition “because coverage of sex-trait modification is not typically included in employer-sponsored plans, and EHB must be equal in scope to a typical employer plan…” CMS does not provide support for this assertion, instead stating that they find that “0.11 percent of enrollees in non-grandfathered individual and small group coverage market plans utilized sex-trait modification during PYs 2022 and 2023.” Utilization of gender affirming care services is expectedly low in the population overall because only a small share of the population is transgender and not all transgender people seek gender affirming medical care. Further, utilization of a service may be a poor proxy for how commonly it is covered. There are other cases where a small share of the population uses a service that is generally covered by insurance. For example, there were fewer than 5,000 heart transplants in the US in 2023 (equaling one ten thousandth of a percent of the population) but public and commercial insurance typically covers this service.
Coverage of gender affirming care services in employer plans is fairly common. KFF’s 2024 Employer Health Benefit Survey2 found that about one-quarter (24%) of large employers (200 or more workers) stated they covered gender-affirming hormone therapy, a plurality of respondents did not know if they covered these services (45%), and less than one-third (31%) did not offer coverage. The largest firms in the country (5,000 or more workers) employ 43% of people with job-based coverage and were significantly more likely to report covering hormone therapy in their largest plan (50% offered coverage, 18% did not know). In 2023, KFF’s Employer Health Benefit Survey found a similar trend relating to gender-affirming surgery. Among large employers (200 or more workers) offering health benefits, 23% provide coverage for gender-affirming surgery in their largest health plan, with 40% indicating they did not know. More than 60% of the largest firms provide coverage for gender-affirming surgery (and 12% did not know). While for both services, there was uncertainty among employers over the details of coverage, many large employers provided coverage. 2022 data from Mercer and 2025 data on fortune 500 company coverage from HRC found, as KFF did, that coverage rates are particularly high among the largest employers (where most US workers are covered).
If implemented, the proposal would likely have an impact on access and costs for individuals and states. Some plans might drop coverage and while plans could cover gender-affirming services outside of their EHB package, consumers would not be assured the same cost-sharing and benefit design protections as for services included in the EHB package. Costs accrued for gender affirming care would not be required to count towards deductibles or out-of-pocket maximums, and would not be protected from lifetime limits, increasing out-of-pocket liability. Given that transgender people are more likely to be living on lower-incomes than cisgender people, higher costs could pose a particular challenge. Increases in out-of-pocket costs would likely deter enrollees from accessing gender-affirming care services, which are medically necessary and recommended by practically every major US medical association.
States, including about half that prohibit transgender care related exclusions, could also be faced with defraying the cost of covering these services under certain scenarios. The proposal states “if any State separately mandates coverage for sex-trait modification outside of its EHB-benchmark plan, the State would be required to defray the cost of that State mandated benefit as it would be considered in addition to EHB….However, if any such State does not separately mandate coverage of sex-trait modification outside of its EHB-benchmark plan, there would be no defrayal obligation..”
The proposal also raises questions about whether the policy would violate the ACA’s major sex nondiscrimination protections (under Section 1557). Sec. 1557 protects against sex (and other) discrimination in health care and while the Trump Administration has suggested that it will view these protections based on biological sex assigned at birth only, courts can and have said that those protections extend to sexual orientation and gender identity. This interpretation also differs from the opinion issued by the Supreme Court in the Bostock case which found employment sex-based nondiscrimination protections extend to sexual orientation and gender identity.
The proposed rule does not define “sex-trait modification” but references the definition of “chemical and surgical mutilation” used in the Trump administration’s Executive Order, “Protecting Children From Chemical And Surgical Mutilation”, which includes the use of puberty blockers, sex hormones, and surgical procedures to affirm an individual’s gender identity that differs from their sex assigned at birth. ↩︎
Since 1999, KFF’s Employer Health Benefit Survey has collected nationally representative information on the cost and coverage of employer sponsored plans. ↩︎
More than 67 million people—20% of the U.S. population—receive their health insurance coverage through the federal Medicare program. Among the most commonly used services that Medicare covers are physician services and other outpatient services covered under Medicare Part B. In 2021, 9 out of 10 beneficiaries in traditional Medicare used physician and other Part B medical services. Nearly half of the $1 trillion in gross Medicare benefit spending in 2023 (49% or $493 billion) was spent on Part B services. Medicare Part B spending accounts for 25% of all national spending for physician and clinical services.
Each year, the Centers for Medicare & Medicaid Services (CMS) updates Medicare payments for physician services and other Part B services through rulemaking, based on parameters established under law. In November 2024, CMS finalized a 2.83% decrease in the physician fee schedule conversion factor, a key aspect of physician payment rates under the Medicare program. This resulted in an average payment cut of 2.93% to physicians and other clinicians, which took effect on January 1, 2025 and remains in effect today. Congress considered but did not enact legislation to reverse the cut in Medicare physician payments in the year-end spending bill and in the 2025 continuing resolution that funds the government through the end of the fiscal year (Figure 1). Some policymakers continue to push for a fix, which is reportedly under consideration for inclusion in an upcoming budget reconciliation bill.
Efforts by lawmakers to address the Medicare physician payment cut for 2025 are the latest in a series of legislative actions to provide short-term increases to physician payment rates under Medicare to avoid similar reductions in fees. The payment cut finalized for 2025 follows the expiration of temporary funds under the Consolidated Appropriations Act of 2024, which provided a 2.93% increase to physician payments for a portion of 2024 to stave off scheduled cuts.
Over the years, physician groups and some policymakers have called for broader reforms to stabilize Medicare payments to physicians and other clinicians, and have expressed concerns that instability and loss of revenue could push physicians to opt out of the Medicare program, creating potential access problems for Medicare beneficiaries. Physicians are not required to take Medicare patients, but most do; virtually all (98%) of non-pediatric physicians accept Medicare’s standard payment rate for all Medicare covered services, and just 1% opted out of the program in 2024.
MedPAC and others have raised additional concerns about issues such as the long-standing gap in compensation between primary care and specialty care clinicians, the efficacy of quality-based payment incentives through the Quality Payment Program (QPP), and the influence of medical specialty groups and interests through the American Medical Association/Specialty Society Relative Value Scale (RVS) Update Committee, otherwise known as the RUC. The RUC issues annual recommendations to CMS on physician payment rates, and CMS has historically adopted most of these recommendations each year. These issues have drawn the attention of policymakers in recent years, including Robert Kennedy Jr., the Trump administration’s new Secretary of the Department of Health and Human Services (HHS), who has voiced interest in aspects of Medicare physician payment reform, such as increasing incentives for primary and preventive care, as well as bringing greater transparency to the operations of the RUC and potentially reducing the AMA’s influence over payment rates.
This issue brief answers key questions about how Medicare pays physicians and other clinicians, and reviews policy options under discussion to reform this payment system. The brief is focused primarily on the physician payment system used in traditional Medicare. Medicare Advantage plans have flexibility to pay providers differently and currently there is no systematic publicly-available information on how much Medicare Advantage plans pay providers. (See Appendix for a glossary of relevant programs, legislation, and terms.)
Medicare reimburses physicians and other clinicians based on the physician fee schedule, which assigns payment rates for more than 10,000 health care services, such as office visits, diagnostic procedures, or surgical procedures. For services provided to traditional Medicare beneficiaries, Medicare typically pays the provider 80% of the fee schedule amount, while the beneficiary is responsible for a coinsurance of 20%. Physicians who participate in Medicare agree to accept this arrangement as payment in full (known as accepting “assignment”) for all Medicare covered services. Non-participating physicians receive 5% lower Medicare payments, but may accept “assignment” on a claim-by-claim basis and may choose to bill beneficiaries for larger amounts by charging additional coinsurance, up to 15% more than the Medicare-approved amount for the cost of a covered service. A third group of physicians opt out of the Medicare program altogether, and instead enter into private contracts with their Medicare patients, are not limited to charging fee schedule amounts, and do not receive any reimbursement from Medicare. Just one percent of all non-pediatric physicians opted out of the Medicare program in 2024.
Physician fee schedule rates for a given service are based on a weighted sum of three components: (1) clinician work, (2) practice expenses, and (3) professional liability insurance (also known as medical malpractice insurance). These three components are measured in terms of “relative value units” (RVUs). Together these three components represent the overall cost and effort associated with a given service, with more costly or time-intensive services receiving a higher weighted sum. Each component is adjusted to account for geographic differences in input costs, and the result is multiplied by the fee schedule conversion factor (an annually adjusted scaling factor that converts numerical RVUs into payment amounts in dollars). Fee schedule services are each associated with a unique service code, which allows clinicians to seek reimbursement for the care they provide on a service-by-service basis.
Payment rates specified under the physician fee schedule establish a baseline amount that Medicare will pay for a given service, but payments may be adjusted based on other factors, such as the site of service, the type of clinician providing the service, and whether the service was provided in a designated health professional shortage area. Physicians can also receive quality-based payment adjustments under the Quality Payment Program (QPP) (see question 7).
2. How does Medicare update physician payment rates?
Annual updates to the physician fee schedule include statutorily-required updates to the conversion factor under the Medicare Access and CHIP Reauthorization Act of 2015 (MACRA) (see question 6), as well as other adjustments to reflect the addition of new services, changes in input costs for existing services, and other factors. Included in these adjustments are periodic changes to the RVUs assigned to fee schedule service codes, based in part on the recommendations of a multispecialty committee of physicians and other professionals, known as the AMA/Specialty Society RVS Update Committee (RUC) (see question 3).
Under current law, the projected cost of all changes to the physician fee schedule must be budget neutral. That is, the changes may not raise total Medicare spending by more than $20 million in a given year. This requirement was established by the Omnibus Budget Reconciliation Act of 1989 to address concerns that constraints on physician fees for specific services would lead to increases in service volume and growth in Medicare spending for physician services over time. The law requires CMS to adjust fee schedule spending when projected costs exceed the $20 million threshold, typically by decreasing the conversion factor relative to the statutory update called for by MACRA.
3. What is the role of the RUC in determining physician payment rates?
The AMA/Specialty Society RVS Update Committee (RUC) is a volunteer committee of physicians and other professionals, formed by the American Medical Association (AMA) in 1991 to advise CMS on the relative weighting of service codes under the physician fee schedule, the primary mechanism used by CMS to set relative payments for physician and clinical services. The RUC is an independent body and its operations are not directly overseen by Congress or CMS. Further, because the RUC is not an official federal advisory committee, it is not bound by federal standards around transparency, membership balance, and other operating requirements applied to many similar committees. The RUC includes representatives from the AMA and other professional organizations, as well as members appointed by a range of national medical specialty societies.
Each year, CMS identifies potentially misvalued services for RUC review based on statutory criteria and public nomination. Potentially misvalued services may also be identified by the RUC itself, while new or recently revised service codes are identified by a separate AMA panel, known as the Current Procedural Terminology (CPT) Editorial Panel. The RUC then consults with various medical specialty societies, who decide which services they wish to review and develop recommendations on the clinician work, practice expenses, and other factors associated with payment for each service. A final list of recommendations for reviewed services is compiled by the RUC based on a committee vote and referred to CMS.
CMS is not required to adopt recommendations issued by the RUC, but it does so in a majority of cases. The AMA reports an average annual acceptance rate of 90% from 1993 to 2025. Over the years, MedPAC and others have raised concerns about the influence of the RUC, which is largely composed of specialty physicians with a financial stake in the recommendations they are producing, and noted several methodological issues with the data used to develop RUC recommendations (see question 8). MedPAC has called for CMS to develop internal processes to validate RUC recommendations by independent means. More recently, HHS Secretary Kennedy has raised concerns about the lack of transparency and relative lack of oversight of RUC operations by CMS, as well as the influence of the AMA in setting payment rates for physicians, which has brought renewed attention to the issue (see question 9).
4. How have physician payment rates changed in 2025?
CMS recently finalized payment changes for 2025, which include a 2.83% decrease to the physician fee schedule conversion factor relative to 2024. This decrease reflects the following adjustments: (1) the expiration of temporary funds approved by Congress under the Consolidated Appropriations Act of 2024, which increased payments by 2.93% for all fee schedule services furnished between March 9, 2024 and December 31, 2024, (2) a 0% statutory increase for 2025 under the Medicare Access and CHIP Reauthorization Act of 2015 (MACRA), and (3) a modest 0.02% budget neutrality adjustment. The combined impact of these adjustments is a 2.93% decrease in average payments to physicians and other clinicians, which went into effect on January 1, 2025.
As of March 2025, Congress has not passed legislation to address this payment cut. A provision to reduce (though not fully eliminate) the cut was included in an early version of the year-end Continuing Resolution (CR) filed in December 2024, similar to the temporary payment adjustments instituted by Congress in prior years, but was removed from the version signed into law. Congress also considered, but did not include, legislation in the subsequent CR enacted in March 2025, but some policymakers continue to push for a fix, which is reportedly under consideration for inclusion in an upcoming budget reconciliation bill.
5. How did the 2025 payment rule address issues related to primary care, telehealth, and other health care priorities?
Recent changes to the physician fee schedule also include several measures designed to improve health care access and increase support for preventive services, behavioral health, and management of chronic disease. These measures are part of an ongoing effort by CMS and the Department of Health and Human Services (HHS) to strengthen primary and preventive care and address long-standing concerns about the gap in compensation between primary and specialty care physicians (see question 8). The final payment rule for 2025 introduces the following key changes:
CMS has added new billing codes to the physician fee schedule intended to streamline payment for advanced primary care management. This change bundles several existing services related to care management, interprofessional consultation, and other care components into single codes, stratified by patient medical and social complexity, which may be billed on a monthly basis.
CMS has added new billing codes related to caregiver training for direct care services and supports, allowing clinicians to bill for time spent training caregivers on specific clinical skills such as techniques to prevent ulcer formation, wound dressing changes, and infection control, and has expanded existing billing options for trainings dedicated to caregiver behavior management and modification.
CMS has finalized several provisions aimed at improving beneficiary access to telehealth, such as broader coverage of audio-only services and increased flexibility in the use of telehealth for treatment of opioid use disorder (OUD). Safety planning interventions and PrEP counseling have been added to the Medicare Telehealth Services list on a permanent basis, and caregiver training services have been added on a provisional basis.
Absent further action from Congress, many of the other telehealth restrictions that were in place prior to the COVID-19 pandemic will come back into effect on April 1, 2025. These include restrictions limiting telehealth coverage to beneficiaries in rural areas, and requiring beneficiaries to travel to an approved site, such a clinic or doctor’s office, when receiving telehealth services. However, CMS has extended certain limited flexibilities under its authority through December 2025, such as provisions that allow Rural Health Centers (RHCs) and Federally Qualified Health Centers (FQHCs) to serve as distant site providers for all covered telehealth services, and allow providers to use their currently enrolled practice location in place of their home address when providing telehealth services from home.
CMS has also added new billing codes for a range of other primary and behavioral health services, such as cardiovascular risk assessment and care management, use of digital mental health treatment devices, and safety planning interventions for patients at risk of suicide or overdose, among others.
The new rules also include updates to the Medicare Shared Savings Program (MSSP), a permanent accountable care organization (ACO) program in traditional Medicare that offers financial incentives to providers for meeting savings targets and quality goals, as well as other changes related to payment for preventive vaccine administration, opioid treatment programs, evaluation and management of infectious diseases in hospital inpatient or observation settings, and a variety of other health services.
6. How have Medicare payments to physicians changed since the implementation of MACRA?
Medicare has revised its system of payment for physician services numerous times over the years (Figure 1). The current payment system was established under the Medicare Access and CHIP Reauthorization Act of 2015 (MACRA) and includes two primary components: (1) a schedule for annual, statutorily-defined updates to the conversion factor, a key determinant of payment rates under the physician fee schedule, and (2) a new system of bonus payments and quality-based payment adjustments under Quality Payment Program (QPP) (see question 7).
The physician payment system established by MACRA was intended to stabilize fluctuations in payment caused by the prior system under the Medicare Sustainable Growth Rate (SGR) formula, which set annual targets for Medicare physician spending based on growth in the gross domestic product (GDP). Under the SGR, if physician spending exceeded its target in a given year, payment rates would be cut the following year, while spending that was below the target led to increased rates. As with the current system, rates were subject to further adjustment for budget neutrality if the projected cost of all fee schedule spending was projected to increase by more than $20 million for the year.
The SGR was established by the Balanced Budget Act of 1997 to slow the growth in Medicare spending for physician services, but the formula garnered criticism, as growth in service volume and rising costs led to several years of spending on physician services that exceeded the growth target, necessitating payment cuts from 2002 onward. Between 2002 and 2015, Congress enacted 17 short-term interventions (so-called “doc-fixes”) to delay the cuts and provide temporary increases to physician payments, but did so without repealing the SGR, which resulted in accumulated deficits over time.
MACRA permanently eliminated the SGR formula, preventing a 21.2% cut in physician fees slated for 2015 and replacing it with 0% statutory increases to the conversion factor through 2025 (later raised to 0.5% from 2016-2019), followed by modest annual increases from 2026 onward. These updates are set by MACRA and do not vary based on underlying economic conditions. However, subsequent adjustments to preserve budget neutrality and supplemental payments provided by Congress may result in conversion factor updates that are higher or lower than the statutorily-required update in a given year.
Although MACRA has stabilized payments under the physician fee schedule to some degree relative to the years leading up to its enactment, rates have continued to fluctuate over the last decade. Due to strict budget neutrality requirements, CMS has limited flexibility to adjust payment rates for new or undervalued services without offsetting the costs elsewhere in the fee schedule. This often takes the form of budget neutrality adjustments to the conversion factor, such as a -10.20% adjustment in 2021 and a -2.18% adjustment in 2024. Since 2021, Congress has provided several short-term increases to fee schedule rates to boost payment during the COVID-19 pandemic and to offset budget-neutrality cuts, raising concerns that the cycle of “doc-fixes” under the SGR formula has not been wholly avoided under MACRA.
A-APM Incentive Payments: Physicians and other clinicians who participate in qualified A-APMs, such as select accountable care organizations (ACOs) and others, are eligible for bonus payments if they meet certain participation thresholds. A-APMs are a type of value-based care model in which the provider bears some financial risk for the costs of care in a defined setting, such as treatment of a specific condition or primary care services for a group of beneficiaries, typically by sharing in a portion of financial savings and losses relative to a benchmark. Incentive payments to increase participation in A-APMs are part of a broader goal by CMS to have all traditional Medicare beneficiaries in some type of accountable care relationship by 2030.
Each year, A-APM clinicians qualify for bonus payments based on their participation during the Qualifying APM Participant Performance Period (January 1 – August 31) two years prior. Under MACRA, qualifying A-APM clinicians received a 5% bonus in payment years 2019 through 2024 (performance periods 2017 – 2022). Congress subsequently extended these bonus payments to include a 3.5% bonus in 2025 and a 1.88% bonus in 2026. A-APM bonus payments are scheduled to be phased out in favor of annual 0.75% increases to the conversion factor for qualifying A-APM clinicians (relative to smaller 0.25% increases for all other clinicians). These conversion factor updates will begin in 2026, and A-APM bonus payments will be fully retired in 2027.
Roughly 386,000 clinicians qualified for A-APM bonuses in 2024, based on the 2022 performance period, a nearly fourfold increase from 99,000 in 2019, the first year A-APM bonuses were available. At the same time, A-APMs are not evenly distributed throughout the country, and participation among non-physician providers and certain physician specialties remains relatively low, suggesting that additional strategies may be needed to encourage wider adoption of these models. Further, MedPAC and others have noted that the scheduled conversion factor updates for qualifying A-APM clinicians will be relatively small in the first few years after A-APM bonuses are retired, though their effects will compound over time, and have cautioned that additional incentives may be needed to prevent attrition in A-APM participation during this transition.
Merit-based Incentive Payment System (MIPS): Clinicians who do not participate in A-APMs, or do not meet the participation criteria for A-APM bonus payments, are subject to additional reporting requirements under MIPS, which adjusts payments up or down depending on a clinician’s performance on certain quality metrics. As with A-APM bonuses, payment adjustments under MIPS are based on performance two years prior. Clinicians are required to participate in MIPS if they are eligible, but many are exempt, such as those in certain specialties (e.g., podiatrists), those in their first year of Medicare participation, and those who serve a low volume of Medicare patients.
Payment adjustments under MIPS are required to be budget neutral. Adjustments are capped each year (between +9% and -9% in 2025), and savings generated from clinicians who incur negative adjustments are used to fund positive adjustments for those who qualify. Because a relatively small share of clinicians have incurred negative adjustments each year since MIPS was implemented, positive adjustments have generally been much lower than the annual cap. In 2023 for instance, roughly 600,000 clinicians received positive adjustments up to +2.34%, based on the 2021 performance year, while just 23,000 clinicians received negative adjustments down to -9%. MedPAC estimates that another 460,000 clinicians were ineligible for either an A-APM bonus or MIPS adjustment due to low Medicare patient volume or other exemption criteria.
Clinicians who participate in MIPS have traditionally selected from a large set of quality measures and other clinical metrics to report on each year. While this structure was intended to give clinicians flexibility to choose the metrics best suited to their practice, it has also been criticized by physician groups and experts for increasing the reporting burden on participants, and for making comparisons between participants less clinically meaningful and more difficult to assess. In an effort to address these concerns, CMS has introduced several more streamlined reporting options. The newest of these allows clinicians to choose from smaller, bundled subsets of reporting metrics tailored to particular specialties or medical conditions, known as MIPS Value Pathways (MVPs).
MVPs were introduced in 2023 as an optional alternative to reporting under traditional MIPS, and included a preliminary set of reporting pathways aimed at specific clinical contexts, such as primary care, treatment of heart disease, and supportive care for neurodegenerative conditions. CMS has added new MVPs each year since the option was introduced, including 6 in 2025, with the eventual goal of replacing all reporting under traditional MIPS with MVPs in future years. The purpose of this shift is to reduce administrative burden by offering providers smaller, more targeted sets of reporting metrics to choose from, as well as to allow for more clinically meaningful assessments by comparing outcomes among similar clinicians who choose to report under the same MVP.
8. What concerns have been raised about the physician fee schedule?
Criticism of the physician fee schedule has focused on four primary concerns about the way in which Medicare pays physicians and other clinicians. These include: (1) the overall adequacy of Medicare payments to cover medical practice costs and incentivize participation in the Medicare program, (2) the gap in compensation between primary and specialty care clinicians, (3) the influence of the AMA/RVS Update Committee (RUC) and medical specialty groups in determining relative payment rates for fee schedule services, and (4) the success of the Quality Payment Program (QPP) in achieving its goal of incentivizing quality improvements and cost-efficient spending.
Payment Adequacy: Over the years, physician groups and some policymakers have expressed concern that payment rates under the physician fee schedule have not kept pace with inflation in medical practice costs. Practice expenses are one component of the relative-value calculation used to determine payment rates for fee schedule services, but the requirement to preserve budget neutrality makes it difficult for CMS to increase payment for some services without also decreasing payment in other areas, such as by lowering the fee schedule conversion factor (see question 6). Statutory increases to the conversion factor under MACRA are not scheduled to begin until 2026, and do not vary based on underlying economic conditions, which may make it more challenging for some physicians to adapt to changing financial demands.
Core to these concerns is the possibility that loss of revenues could lead some physicians to opt out of the Medicare program, which could create access issues for Medicare beneficiaries. National surveys and other analyses have generally found that beneficiaries report access to physician services that is equal to, or better than, that of privately-insured individuals, with similar or smaller shares reporting delays in needed care or difficulty finding a physician who takes their insurance. A recent KFF analysis found that just 1% of all non-pediatric physicians had opted out of Medicare in 2024, suggesting that the current fee structure has not substantially discouraged participation. Moreover, MedPAC estimates that virtually all Medicare claims (99.7% in 2023) are accepted on “assignment” and paid at the standard rate (see question 1), with beneficiaries in traditional Medicare facing no more than the standard 20% coinsurance rate. At the same time, analyses by KFF and others have found that physicians in some specialties, such as psychiatry, opt out of Medicare at higher rates, which may impact access to these services over time.
Loss of revenue may also lead some physician practices to merge with (or be acquired by) larger health systems or hospitals, a process known as “vertical consolidation.” Vertical consolidation may offer certain benefits to physicians, such as greater economy of scale for practice expenses, lower administrative burden, and access to costly resources such as medical imaging equipment, and may be attractive to physicians who are otherwise struggling to meet their practice costs. While consolidation may be associated with some benefits to patients as well, such as improvements in care integration and coordination between providers, it may also lead to higher out-of-pocket costs and lower care quality by reducing market competition. Further, Medicare generally pays more for a given service provided in a hospital outpatient department than it does for the same service provided in a freestanding physician office, which can lead to increased costs for beneficiaries and higher program spending over time. Policymakers are currently exploring options to align Medicare reimbursement rates between these settings, known as “site-neutral payment reforms.”
Primary Care Compensation: A second concern with the current payment system is that Medicare does not adequately pay for primary care services, as reflected by the gap in Medicare payments between primary and specialty care clinicians. Payments under the physician fee schedule are generally higher for clinical procedures, such as surgeries and diagnostic tests, than for non-procedural services, such as preventive care provided during an office visit. While many clinicians provide a mixture of procedural and non-procedural services, primary care clinicians often dedicate a larger share of their time to non-procedural care. Further, MedPAC has expressed concern that this imbalance encourages clinicians of all specialties to increase their use of more costly and profitable services, such as unnecessary imaging, screenings, and diagnostic tests, at the expense of high-value, but less profitable, services, such as patient education, preventive care, and coordination across care teams, which can impact the quality of patient care and lead to higher physician spending over time.
MedPAC notes that clinical procedures often see gains in efficiency due to technological improvements and other factors, which reduce the time and effort needed to provide them. If fee schedule rates are not adjusted to reflect these improvements, these services may become overvalued over time. By contrast, non-procedural services often involve more fixed time constraints, such as time spent communicating with patients or coordinating with other providers, and are unlikely to see similar gains, contributing to the gap in compensation between these service types.
Due to budget neutrality requirements, efforts to directly increase payment for non-procedural services under the physician fee schedule in order to boost payments for primary care have often necessitated across-the-board payment cuts in the form of decreases to the fee schedule conversion factor (see question 6). Further, physicians may offset any expected reductions in revenue by increasing service volume over time, or by increasing their use of higher intensity, and more highly compensated, service codes, leaving the gap in payment rates relatively constant. These constraints make it difficult for CMS to meaningfully address differences in payment between primary and specialty care, and have led some policymakers to voice concerns that the current budget neutrality requirements are too rigid.
Role of the RUC: The American Medical Association (AMA) and the RUC play a substantial role in annual decision-making around the relative weighting of service codes under the physician fee schedule, the primary mechanism used by CMS to set relative payment rates for physician and clinical services (see question 3). While CMS is not required to adopt recommendations issued by the RUC, it does so in a majority of cases. MedPAC has raised several methodological concerns with the data used by the RUC to develop its annual reports, which are largely based on recommendations from medical specialty societies. These include a lack of transparency, as well as low response rates and total responses on the various member surveys that inform medical specialty society recommendations, which make it difficult for CMS to validate RUC recommendations by other means.
Other concerns raised about the RUC include the overrepresentation of specialty physicians on the committee, and the potential for conflicts of interest when RUC members recommend changes to relative payments for primary and specialty care services. In contrast to federal advisory committees, which are typically formed by Congress, the office of the President, or executive branch agencies, the RUC is an independent committee overseen by the AMA. For this reason, it is not held to the same operating requirements as many other similar committees, which adhere to certain criteria around transparency and membership balance.
To ensure that fee schedule services are not overvalued, MedPAC has recommended that CMS develop internal processes for validating RUC recommendations, such as by collecting data from clinical practices on the number of clinician hours dedicated to commonly-billed services. Pilot studies commissioned by CMS and the Department of Health and Human Services (HHS) have attempted to validate the clinician time component of small subsets of fee schedule services using methods such as analysis of electronic health records, direct observation of clinical procedures, and independently-collected physician surveys. These projects may serve as a blueprint for future work, though implementing these and similar methods on a large scale would likely require significant time and staff investment.
Role of the QPP: QPP programs such as the Merit-based Incentive Payment System (MIPS) and bonus payments for Advanced Alternative Payment Model (A-APM) clinicians are designed to create incentives for quality improvement, care coordination, and the provision of high-value services (see question 7). While the share of clinicians who qualify for A-APM bonuses has more than tripled since the QPP began (from roughly 99,000 to 386,000 in the 2017 and 2022 performance periods, respectively), some policymakers have argued that greater incentives are needed to encourage providers to take on the financial risks and high startup costs associated with these models, particularly as A-APM bonus payments are phased out in favor of relatively smaller conversion factor adjustments in the coming years.
Additionally, MedPAC has voiced concern that MIPS, the quality-based payment program for clinicians who do not participate in A-APMs, imposes too large of a reporting burden on those who participate, while at the same time offering relatively weak incentives to improve quality and control costs. As noted earlier, a large share of clinicians are exempt from the program, and because few participants receive negative adjustments, positive adjustments are relatively modest. The administrative burdens associated with MIPS may be partially addressed by the shift towards MIPS Value Pathways (MVPs) in place of traditional quality reporting, and further assessment of this option will likely take shape as the program is phased in.
9. What policy proposals have been put forward to address concerns with Medicare’s current physician payment system?
In addition to bipartisan legislation that directly addresses the 2025 payment cuts that took effect January 1, 2025, policymakers and others have put forward a number of strategies to revise the current Medicare physician payment system. These include measures to stabilize physician fee schedule payments from year to year, provide additional support to primary care and safety-net providers, and create stronger incentives for efficient spending, care coordination, and participation in Advanced Alternative Payment Models (A-APMs).
In 2025, MedPAC recommended a one-time inflation-based increase to physician payment rates in 2026 (equal to the projected increase in the Medicare Economic Index minus one percentage point), similar to recommendations from past years. While MedPAC has weighed the possibility of recommending annual updates for inflation, it has not done so to date, focusing instead on targeted strategies to bolster payments to primary care clinicians and safety-net providers. For instance, in light of findings that clinicians often receive lower revenue for treating low-income Medicare beneficiaries, MedPAC has recommended raising payment in these instances by 15% for claims billed by primary care clinicians and 5% for claims billed by non-primary care clinicians, to encourage clinicians to treat these populations.
MedPAC has voiced support for the goals behind the Medicare Access and CHIP Reauthorization Act of 2015 (MACRA) and the Quality Payment Program (QPP), including the financial incentives offered to A-APM participants under current law (see question 7), while also recommending changes to the design of the QPP, including the elimination of the Merit-based Incentive Payment System (MIPS). MedPAC has noted that the ongoing shift from traditional MIPS to MIPS Value Pathways (MVPs) addresses some concerns related to administrative complexity and participant comparisons, but a large share of clinicians remain exempt from MIPS reporting and incentive payments have generally remained relatively small (see question 8). In place of MIPS, MedPAC has recommended establishing a voluntary program designed to mimic the structure of A-APMs and other alternative payment models, allowing clinicians to transition into these models more gradually.
Several bills introduced in the last Congress indicate interest in strategies such raising or modifying the budget neutrality threshold, or offering separate conversion factor updates for primary and specialty care services, which would allow CMS greater flexibility to adjust payment rates to reflect evolving policy priorities without necessitating a mandatory payment cut. The Senate Finance Committee has held several hearings on physician fee schedule reform, and released a whitepaper in 2024 outlining a range of options to stabilize conversion factor updates from year to year, extend access to telehealth, and incentivize continued participation in A-APMs, among other reforms.
More recently, House Republicans included adjustments to the physician fee schedule in a menu of potential policy actions circulated in January 2025. The Secretary of the Department of Health and Human Services (HHS), Robert F. Kennedy Jr., has expressed a particular interest in Medicare physician payment reform, and has called for bringing greater transparency to the operations of the AMA/RVS Update Committee (RUC) (see question 3), as well as exploring options for reducing the role the RUC plays in annual decision-making around physician payments.
A decade after the passage of MACRA, Congress’s last major overhaul of how Medicare pays physicians, interest in broader reforms to Medicare’s physician payment system, beyond addressing the physician fee cuts finalized for 2025, is gaining steam. Designing payment approaches that address concerns raised by interested parties to compensate physicians adequately while restraining spending growth represents a challenge for policymakers.
This work was supported in part by Arnold Ventures. KFF maintains full editorial control over all of its policy analysis, polling, and journalism activities.
Medicaid is jointly financed by states and the federal government but administered by states within broad federal rules. Medicaid accounts for a large share of state budgets and can be central to state fiscal decisions. Following years of robust revenue growth, states are now contending with weakening tax revenues, budget shortfalls, and uncertainty in their long-term fiscal outlook, leaving some states with difficult budget decisions. At the same time, there are several options under consideration in Congress to significantly reduce federal Medicaid spending to help pay for tax cuts, with the recently passed House budget resolution targeting cuts to Medicaid of up to $880 billion or more over a decade. There are not yet detailed proposals under consideration by Congress to achieve federal Medicaid spending reductions. However, any reduction in federal Medicaid spending would leave states with tough choices about how to offset reductions through tax increases or cuts to other programs, like education. If states are not able to offset the loss of federal funds with new taxes or reductions in other state spending, states would have to make cuts to their Medicaid programs. This brief explores the magnitude of federal funding cuts under the House budget resolution and puts the $880 billion in context by comparing the size of the cuts to states’ tax revenues, spending on education, and the number of Medicaid enrollees covered for that cost. The analysis assumes $880 billion in federal Medicaid cuts over a decade, though the amount could end up being more or less depending on what Congress passes.
Key Take-Aways
Federal cuts of $880 billion over 10 years (or $88 billion per year) would represent 29% of state-financed Medicaid spending per resident.
States could opt to raise tax revenues to offset federal Medicaid reductions. Proposed federal cuts represent 6% of state taxes per resident.
States could instead make cuts to other states programs such as education, the largest source of expenditures from state funds, to offset federal Medicaid reductions. Proposed federal cuts represent 19% of state education spending per pupil.
To further put the proposed federal cuts in perspective, they are equivalent to all Medicaid spending on 3 million seniors and people with disabilities (18% of enrollees in that group), 14 million other adults (38% in that group), or 22 million children enrolled in Medicaid (76% of that group). These figures are meant to put the magnitude of the cuts in perspective, not to suggest that states would achieve savings by eliminating coverage by these amounts. The effects of federal cuts on Medicaid spending and coverage would depend on the specific policies enacted.
What is the size of federal Medicaid reductions under consideration?
Congress is currently targeting up to $880 billion or more in federal Medicaid spending reductions. The House passed a budget resolution instructing the House Energy & Commerce Committee (E&C) to reduce the federal deficit by at least $880 billion over 10 years. Although the budget resolution does not mention Medicaid, Medicaid comprises $8.2 trillion out of the $8.6 trillion in mandatory spending that E&C must use to come up with spending reductions (assuming Medicare cuts are off the table). As a result, major cuts to Medicaid are the only way to meet the House’s budget resolution required $880 billion (or more) in spending reductions.
This is an illustrative analysis designed to portray the potential impact of $880 billion in Medicaid cuts in the absence of specific policies that would yield federal savings. This analysis assumes that the $880 billion in cuts over a decade are spread uniformly across 10 years, or $88 billion a year, which represents 16% of federal Medicaid funding in federal fiscal year (FY) 2024. While this analysis applies cuts evenly across the 10-year period to get a one-year estimate, in practice, the cuts could grow over time. Policies are often implemented after a period of preparation and some may require multiple years before the effects are fully observed.
The analysis applies the federal cuts proportionally across states for illustrative purposes, though the distributional effects would vary depending on the specific policy changes proposed. This analysis applies the federal cuts proportionally to states based on their share of federal spending, resulting in a 16% cut to federal Medicaid funding across all states, though the total amount of the cuts varies by state, ranging from $78 million to $13 billion (Appendix Table 1). In practice, cuts would almost certainly not be allocated proportionately, and some states would be disproportionately impacted depending on the specific policy proposals pursued. Without specific policies yet under consideration by Congress, this illustrative analysis is a way of understanding the magnitude of the potential Medicaid cuts.
How does $880 billion in federal Medicaid reductions relate to states’ taxes and education spending?
Federal Medicaid cuts of $88 billion per year would represent 29% of state-financed Medicaid spending per resident (Figure 1). For states to maintain Medicaid spending and eligibility at current levels, they would have to increase state spending by $88 billion each year, shifting costs from the federal government to the states. This would result in a 29% increase in state-financed Medicaid spending per resident in FY 2024. Across states, the federal cuts per resident range from $100 to $700, representing anywhere from 17% to 59% in state Medicaid spending per resident (Appendix Table 1). These findings are based on the assumptions above; in practice, the increase in state Medicaid spending per resident would vary based on the specific policy proposals.
States could opt to raise taxes to offset the federal Medicaid cuts, with $88 billion per year in federal Medicaid cuts representing 6% of state taxes per resident nationwide. Total state taxes per resident ranged from $2,530 to $15,225 across states (Appendix Table 1). The federal cuts per resident range from $100 to $700 across states, representing anywhere from 2% to 11% in state tax dollars per resident.
Another option for states is to make cuts to another budget item like K-12 education, with proposed federal Medicaid cuts representing 19% of state spending on education per pupil. States could make cuts to any areas of state spending, but education is the largest source of expenditures from state funds, so it is used as an illustrative example in this analysis. Total education spending is primarily from state and local governments, with a small share financed by the federal government. Reductions in state government spending for K-12 education would have a direct impact on total spending per-pupil. State education spending per pupil ranges from $4,500 to $28,600 across states (Appendix Table 1). The federal cuts per pupil range from $700 to $3,400 across states, representing anywhere from 7% to 38% in state education spending per pupil.
How does $880 billion in federal Medicaid reductions relate to Medicaid coverage by eligibility group?
If states do not offset federal Medicaid cuts by picking up the new costs, they could reduce Medicaid spending by covering fewer people, offering fewer benefits, or paying providers less. To reduce eligibility, states would have to make tough choices about what enrollment groups to apply eligibility restrictions to given variation in enrollment and spending per enrollee across groups. It is unclear if more specific federal policy proposals will disproportionately affect certain eligibility groups (like the Affordable Care Act expansion group), or make changes to minimum eligibility standards or benefits set by the federal government. Also, depending on the specific policy proposals and assuming the matching structure of Medicaid financing is retained, states would have to reduce total Medicaid spending by more than one dollar to achieve a dollar in savings.
To provide context for the scope of proposed cuts to Medicaid, the following analysis shows how many people’s Medicaid benefits are covered with $88 billion. The numbers are presented across different enrollee groups to account for significant differences in Medicaid costs for different groups of enrollees (see Methods).
To put the proposed federal cuts into perspective, they are equivalent to all Medicaid spending on 3 million or 18% of Medicaid enrollees eligible because they are 65 and older or have a disability, 14 million or 38% of adult Medicaid enrollees, or 22 million or 76% of child enrollees (Figure 2). Spending per enrollee varies across eligibility groups and is over $18,000 per year for seniors and people with disabilities compared to $3,000 per year for children. As a result, a $88 billion a year cut would be equivalent to Medicaid spending on a smaller number of seniors and people with disabilities relative to other populations both nationally and across states (Appendix Table 2).
Appendix
Methods
Data: This analysis uses the latest data available from various data sources to illustrate the potential impact of an $88 billion cut to federal Medicaid spending across states. Data sources include:
State Medicaid data from NASBO is reported for the state fiscal year (instead of federal fiscal year) and differs from other sources of Medicaid spending data. For that reason, this analysis uses spending per resident or pupil calculations to relate data across the various sources.
Estimating Annual Federal Cut: This analysis assumes that the $880 billion in cuts over a decade are spread uniformly across 10 years, or $88 billion a year cut, which represents 16% of federal Medicaid funding in FY 2024.
Allocating $88 Billion Across States: This analysis applies the one-year federal cut proportionally to states based on their share of federal spending in FY 2024 from KFF’s projections of Medicaid spending under current law. The federal share of spending is estimated using a 90% match rate for the ACA expansion group and the FY 2024 traditional federal match rates plus a 1.5 percentage point increase for the first quarter of FY 2024 (accounting for the final phase out quarter of the pandemic-era enhanced federal match rate) for the remaining eligibility groups. This results in a 16% cut to federal Medicaid funding across all states, though the total amount of the cuts varies by state. Lastly, the federal cuts are then divided by the U.S. Census Bureau’s 2024 estimates of resident population by state to get an estimate of federal cuts per resident by state.
Estimating State Medicaid Spending Per Resident: State spending per resident in FY 2024 is estimated using KFF’s projections of Medicaid spending under current law (assuming state spending is the difference between total spending and federal spending) and the U.S. Census Bureau’s 2024 estimates of resident population by state. The federal cuts per resident are then divided by state Medicaid spending per resident to estimate the federal cuts as a share of state Medicaid spending per resident.
Estimating State Taxes Per Resident: State taxes per resident in FY 2023 from the U.S. Census Bureau’s Annual Survey of State Government Tax Collections (the latest data available and available for download here) is used as an estimate for state taxes per resident in FY 2024. The federal cuts per resident are then divided by state taxes per resident to estimate the federal cuts as a share of state taxes per resident.
Estimating State Education Spending Per Pupil: State education spending in FY 2024 is estimated from NASBO’s 2024 State Expenditure Report (the latest available data). The analysis combines state general fund and other state fund spending on elementary and secondary education in estimated state fiscal year 2024 to approximate state education spending in FY 2024. This is divided by the number of K-12 students enrolled in fall 2023 by state (the latest data available) from the National Center on Education Statistics, Digest of Education Statistics to get state education spending per pupil. The total federal cuts by state are then divided by the number of students by state to get an estimate of federal cuts per pupil. Finally, the federal cuts per pupil are then divided by state education spending per pupil to estimate the federal cuts as a share of state education spending per pupil.
Estimating Coverage Costs By Eligibility Group: Total Medicaid spending per enrollee for the three enrollment groups (seniors and people with disabilities, expansion adults and other adults, and children) in FY 2024 is calculated using KFF’s projections of Medicaid spending and enrollment under current law. To estimate how many enrollees in each group the federal cuts are equivalent to, the federal cuts are divided by the per enrollee estimate for each group and by state.