Elimination of Federal Diversity Initiatives: Implications for Racial Health Equity

Published: Mar 21, 2025

As one of his first actions in office, President Trump signed executive orders revoking federal diversity, equity, inclusion, and accessibility (DEIA) related programs and actions in the federal government and among federal contractors and grantees. DEI initiatives are intended to create more diverse and inclusive work environments, to address discriminatory policies or practices, as well as to counter the impacts of historical actions that led to unequal opportunities for certain groups. In implementing President Trump’s executive orders, the administration has taken significantly broader actions beyond eliminating DEI programs to include eliminating priorities, actions, information, data, and funding related to concepts of diversity or disparities among federal agencies as well as federal contractors and grantees. Some of these actions have been paused due to ongoing litigation, and it remains to be seen what actions may proceed under final court rulings. Given the broad nature of these actions, they will not only likely lead to a less inclusive and diverse workforce, including in health care, but will also likely lead to widening disparities in health and health care, reversing prior efforts to address disparities and advance equity.

This brief explains the potential impacts of the elimination of diversity and disparities-related initiatives under the Trump administration on racial health disparities. While this brief focuses on racial and ethnic disparities, these actions have implications for health equity across other dimensions, including gender and sexual orientation. The terms DEI and DEIA are similar and often used interchangeably. The “A” in DEIA refers to accessibility for people with disabilities. The remainder of this brief uses DEI as it is more commonly known and used, but with the recognition that accessibility is also a key part of health equity

Federal Actions to Eliminate Disparities Initiatives

On the first day of his second term, President Trump signed Executive Order 14148 which revoked 78 executive orders and memoranda issued by the Biden administration, many related to DEI. This included President Biden’s Executive Order 13985, which required federal agencies to conduct equity assessments and collect data to track and address trends and barriers that underserved communities face in accessing federal positions and programs. The reversal also eliminated DEI frameworks that prioritized equity-driven decision-making and resource allocation in agencies such as the Department of Health and Human Services (HHS) and the Centers for Disease Control and Prevention (CDC).

President Trump also issued Executive Order 14151 and directives that mandate federal agencies to terminate all DEI related offices and positions; equity action plans, actions, initiatives or programs; equity-related grants or contracts; and DEI performance requirements for employees, contractors, or grantees. In addition, he issued Executive Order 14168 to “recognize two sexes, male and female;” specify that sex shall refer to a biological classification of male or female; direct federal agencies and employees to only use “sex” and not “gender;” remove all references to “gender ideology” or identity; and ensure that grant funds do not promote “gender ideology.” Further, he signed Executive Order 14173, which revoked the 1965 Equal Employment Opportunity rule that protected against discrimination in employment among federal contractors; the order also added new requirements for federal contractors and grantees to certify that they do not operate DEI programs that violate anti-discrimination laws and for federal agencies to identify entities, including publicly traded corporations, large nonprofit corporations or associations, and foundations, to target with civil investigations to deter DEI programs. Other actions include Executive Order 14224, which named English as the official language of the U.S. and rescinded an executive order and guidance that reaffirmed the federal government’s commitment to make services accessible to people with limited English proficiency, as well as guidance directing schools and other entities that receive federal funds from the Department of Education to stop using “racial preferences.” This guidance broadens the landmark 2023 U.S. Supreme Court ruling that effectively ended the use of race-conscious admissions policies in higher education, overturning decades of precedent supporting affirmative action.

To carry out the executive orders, the Office of Personnel Management (OPM) directed agencies and departments to take down all outward facing media that “inculcate or promote” “gender ideology,” as well as to remove all public facing DEI related websites and content. This resulted in the temporary shutdown of websites and removal of key health datasets. While some web pages and datasets began returning in several days, they included a warning message that they were being modified to comply with President Trump’s executive orders and some materials, such as codebooks and questionnaires, did not immediately return. The administration also directed departments and agencies to pause grants provided to federal contractors to identify and review programs and activities for consistency with the President’s policies. Reports also indicate that the administration has flagged over 100 words that federal agencies should limit or avoid to comply with the President’s policies, including disparities, diversity, equity, and race. The CDC reportedly ordered the withdrawal of papers pending publication to ensure language compliance. Similarly, reports suggest that the National Science Foundation froze payments to grantees and began screening grant proposals for terms related to gender, equity, and inclusion and that the National Institutes of Health began terminating research grants to comply with the new restrictions.

Multiple lawsuits have been filed challenging the executive orders and actions, which have halted some of these actions, but it remains to be seen what actions will be allowed under final court rulings. For example, a preliminary nationwide injunction blocked enforcement of significant provisions of the executive orders, including the termination of federal contracts and funding. Other litigation has ordered the return of public health web pages and datasets. Some of this information has been restored, such as the FDA’s draft guidance on diversity in clinical trials, but with an explanatory note that any information on the page promoting “gender ideology” is “extremely inaccurate” and that “Administration and this Department reject” the content:

Per a court order, HHS is required to restore this website as of 11:59 PM on February 11, 2025. Any information on this page promoting gender ideology is extremely inaccurate and disconnected from the immutable biological reality that there are two sexes, male and female. The Trump Administration rejects gender ideology and condemns the harms it causes to children, by promoting their chemical and surgical mutilation, and to women, by depriving them of their dignity, safety, well-being, and opportunities. This page does not reflect biological reality and therefore the Administration and this Department reject it.
Source: FDA

Implications for Health and Health Equity

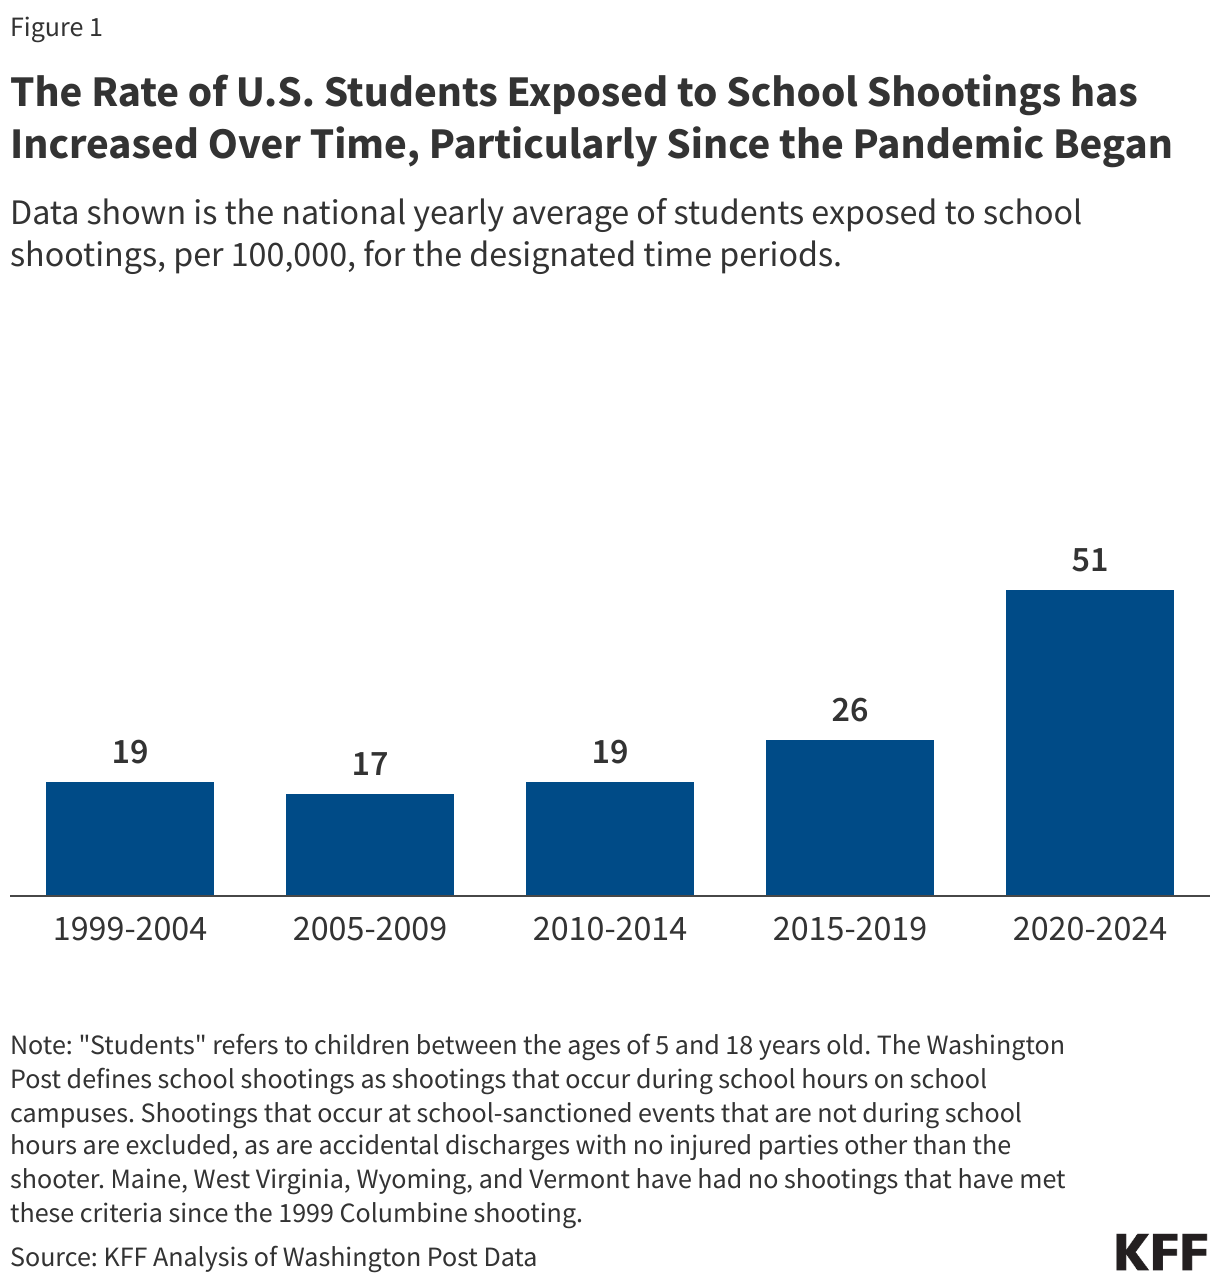
In the wake of the COVID-19 pandemic and racial reckoning following the murders of George Floyd and others, the federal government as well as many states and private entities increased efforts focused on addressing health disparities, including recognizing the role of historical and ongoing racism in driving disparities. This increased focus led to the development of programs and initiatives focused on mitigating disparities, including efforts to address disparities in maternal and infant health, cancer, and chronic disease, as well as other efforts, such as increasing diversity in clinical trials for development of new drugs and devices. Research efforts also increased to understand disparities, the factors driving them, and effective interventions to mitigate them. Implementation of President Trump’s executive orders eliminates much of this work, which will likely lead to widening disparities in health.

Elimination of focused efforts to address health disparities will potentially further exacerbate disparities, contributing to worsening overall health and unnecessary health care costs. To comply with the President’s executive orders, federal agencies have eliminated health equity plans, strategies, and guidance focused on mitigating disparities. For example, the administration ordered the Centers for Medicare and Medicaid Services to disband its Health Equity Advisory Committee, which was charged with addressing systemic barriers to access that included structural racism, and Federal Drug Administration draft guidance on diversity in clinical trials (although it was restored pursuant to a court order). Focused plans and initiatives to mitigate health disparities seek to address the underlying inequities that drive disparities and meet the needs and preferences of diverse populations. These efforts are important for equity and for improving the nation’s overall health and economic prosperity. Racial and ethnic health disparities result in higher rates of illness and death across a wide range of health conditions. Research also shows that disparities are costly, resulting in excess medical care costs and lost productivity, as well as economic losses due to premature deaths. In the absence of focused efforts, disparities will likely widen because the underlying inequities that contribute to them persist, leading to worse overall health and unnecessary health care costs.

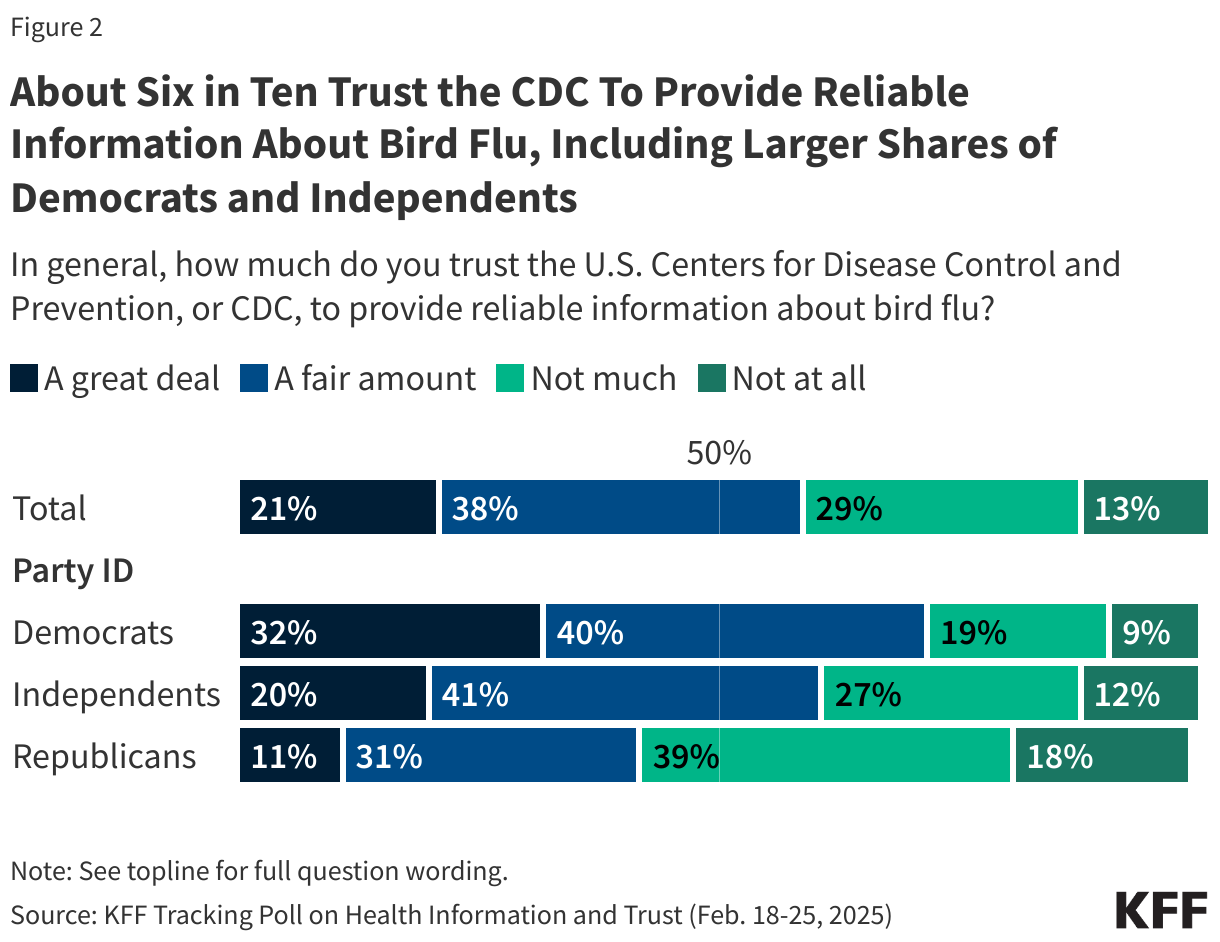
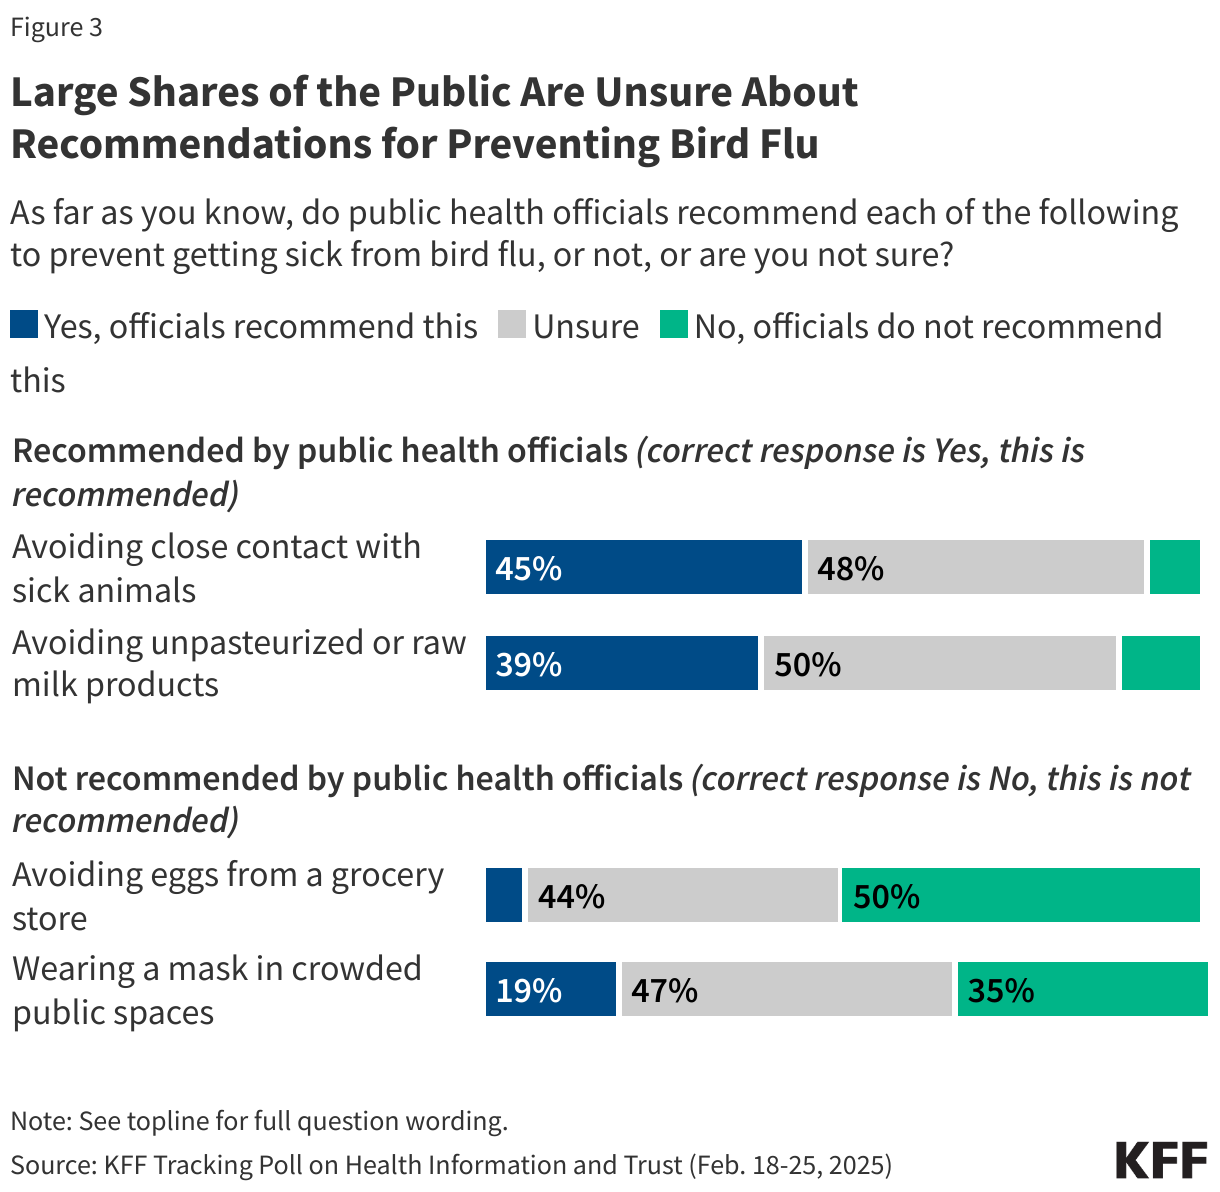
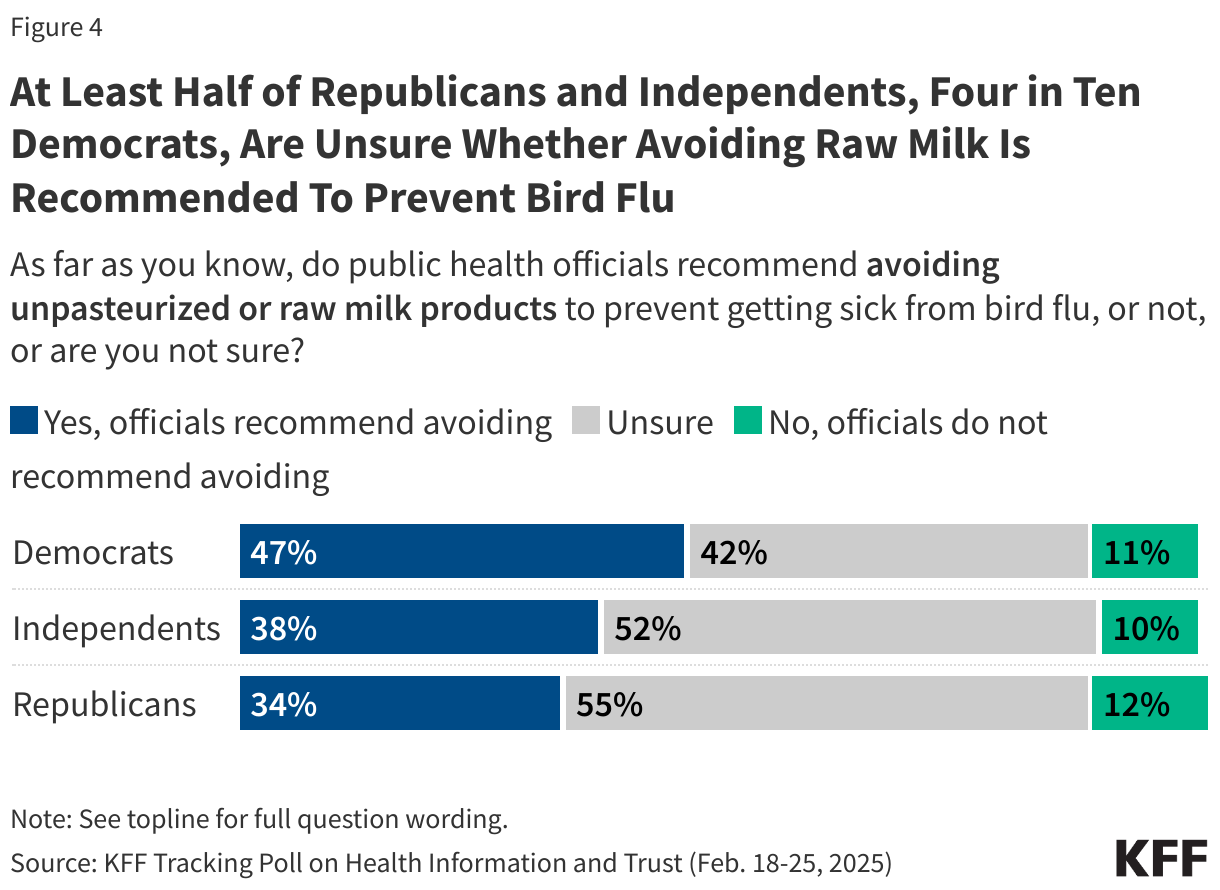
Loss of information, data, and research will inhibit the ability to identify disparities and understand the factors driving them. In implementing the executive orders, agencies removed health information, such as HIV-related content, and reports on current disease threats, like bird flu, as well as federal data, including data from the Centers for Disease Control and Prevention and the U.S. Census. While some of the datasets were returned, they were marked with a warning message suggesting there could be future changes, leaving uncertainty about what data will be available over the long-term. Additionally, as noted, federal agencies are now screening and halting research related to disparities, equity, and inclusion, which will likely lead to reductions in funding to support research on disparities. Data are a cornerstone for efforts to address health disparities and advance health equity. Data are essential for identifying where disparities exist, directing efforts and resources to address disparities as they are identified, measuring progress toward achieving greater equity, and establishing accountability for achieving progress. Without adequate data and research disparities may remain unseen and unaddressed.

Elimination of DEI efforts among the federal workforce and contractors as well as in education will likely lead to a less diverse health care workforce, which would contribute to widening disparities in health care experiences and outcomes. People of color have historically been underrepresented in the health care workforce relative to their share of the population. Research shows that increasing the racial and ethnic diversity and cultural competency of health professionals is associated with improved access to care, greater patient choice and satisfaction, and other benefits. KFF 2023 survey data show Black, Hispanic, and Asian adults who have more health care visits with providers who share their racial and ethnic background report more frequent positive and respectful interactions. Other research suggests that patient and provider racial concordance contributes lower emergency department use, increased visits for preventative care, and greater treatment adherence. One study found that greater representation of Black primary care physicians led to increased life expectancy and lower mortality among Black people. The recent actions to eliminate diversity efforts among federal agencies and contractors as well as in education will likely reverse progress diversifying the health care workforce. For example, research suggests that the 2023 Supreme Court ruling banning affirmative action resulted in a decline in Black, Hispanic and American Indian and Alaska Native medical school students. Moreover, it remains unclear whether hospitals and providers are considered federal contractors subject to the executive orders to eliminate DEI-related activities, but there are concerns about the potential impact to hospital hiring, training, and programming.

Elimination of diversity efforts will lead to a less diverse and inclusive workforce among federal agencies and contractors with fewer protections against discrimination. The new executive orders undo longstanding policies that grew out of antidiscrimination laws focused on increasing employment opportunities for historically underrepresented groups in the federal government and among federal contractors. It reverses efforts by President Biden to strengthen the federal government’s ability to “recruit, hire, develop, promote our nation’s talent and remove barriers to equal opportunity.” Reports suggest that DEI initiatives can support talent acquisition and performance. Prior analysis from the Office of Personnel Management, which has since been removed from the web, found that the federal government achieved significant declines in the gender pay gap for women over time and has a much smaller gap compared to the national gap. Without diversity efforts, certain groups may face increased barriers to employment and advancement, which has impacts for health care access and health.

Federal actions to eliminate diversity and disparities-related efforts are having ripple effects in the private sector, schools, and states. As part of federal actions to eliminate DEI efforts, the federal government issued a statement that they will “investigate, eliminate, and penalize illegal DEI and DEIA preferences” at private companies and universities that receive federal funds. Reports show a wide range of private companies ending or reframing DEI related initiatives in the last several months as well as reversal of DEI efforts in universities and schools. Some states also are reversing or prohibiting DEI-related work, including efforts that began prior to President Trump taking office. In 2024, state legislatures introduced over 30 bills aimed at restricting DEI initiatives in public colleges and universities. Some states also have imposed limits on teaching concepts related to systemic racism, historical inequities, and unconscious bias.

5 Key Facts About Medicaid Coverage for People with Medicare

Published: Mar 19, 2025

The recently passed House budget resolution targets cuts to Medicaid of up to $880 billion or more over a decade to help pay for tax cuts. Major cuts to Medicaid may impact coverage for the almost 1 in 5 Medicare beneficiaries (12.2 million) who are also enrolled in Medicaid. For people covered under both programs (“dual-eligible individuals”), Medicare is the primary payer and covers medical acute and post-acute care, including skilled nursing facility services and home health care. Medicaid wraps around Medicare coverage by paying Medicare premiums and in most cases, cost sharing. Most dual-eligible individuals (8.9 million people in 2024) are “full-benefit” enrollees, which means they are eligible for Medicaid benefits that are not otherwise covered by Medicare, including long-term carevision, and dental. The remaining 3.3 million dual-eligible individuals, “partial-benefit” enrollees, are eligible for Medicare premiums and often, cost sharing assistance, but not for full Medicaid benefits.

It is unclear what policies might be designed to achieve $880 billion in savings, but there are possible implications for Medicare beneficiaries, who account for nearly 30% of Medicaid spending. Effects would vary across states as coverage and benefits do.

1. Medicaid helps make Medicare more affordable for more than 12 million people with Medicare by covering the cost of premiums.

Nearly 1 in 5 (18%), or 12.2 million Medicare beneficiaries also have Medicaid coverage (Figure 1). Most Medicare beneficiaries with Medicaid have low incomes and modest savings, and Medicaid coverage makes the Medicare program more affordable by paying premiums, and in most cases, cost sharing. Medicare Part B premiums are $185 per month in 2025 and without Medicaid, these premiums alone would consume close to 15% of income for people in poverty. Most Medicare beneficiaries with Medicaid also get help from Medicaid to pay their Part A and B deductibles, coinsurance, and copayments through the Medicare Savings Programs, which provide coverage of Medicare premiums and often, cost sharing, to Medicare beneficiaries with limited financial resources. Many dual-eligible individuals receive additional Medicaid-covered wraparound services, such as long-term care, vision, and dental services. Just over half (55%) of Medicare beneficiaries who are under age 65 (who are eligible for Medicare on the basis of a permanent disability) are also covered by Medicaid. Most people with both Medicare and Medicaid receive benefits from separate Medicare and Medicaid coverage arrangements. In 2021, just 5% of people with Medicare and Medicaid were in a program that covered Medicare and Medicaid benefits under a single plan or program with integrated financing.

Medicaid Helps Make Medicare More Affordable for More than 12 Million People with Medicare by Covering the Cost of Premiums

2. The share of Medicare beneficiaries who are also covered by Medicaid varies across states, ranging from 9% to 34%.

Across the 50 states and the District of Columbia, the share of Medicare beneficiaries who are also covered by Medicaid ranges from 9% in New Hampshire to 34% in D.C (Figure 2). The variation stems from differences in eligibility criteria for Medicaid, as well as the income and asset levels of Medicare beneficiaries living in different states. The primary Medicaid eligibility pathways for people with Medicare are through Supplemental Security Income and Medicare Savings Programs, both of which are mandatory. In addition, there are several optional pathways that states can choose to use to expand coverage, making eligibility complex and different across states. In general, in states where more people meet Medicaid eligibility criteria—which may reflect either lower incomes among Medicare beneficiaries or higher income eligibility criteria, a higher share of Medicare beneficiaries are also covered by Medicaid.

The Share of Medicare Beneficiaries who are Also Covered by Medicaid Varies Across States, Ranging from 9% to 34%

3. Medicare beneficiaries with coverage under Medicaid are in poorer health and have greater health needs than Medicare beneficiaries without Medicaid.

Four in ten (41%) people with both Medicare and Medicaid report their health as fair or poor, compared with 15% of Medicare beneficiaries without Medicaid coverage (Figure 3). More than a third (34%) of those with both Medicare and Medicaid have five or more chronic conditions, such as diabetes, hypertension, and heart disease, compared with 23% of Medicare beneficiaries without Medicaid coverage. Additionally, more than four in 10 (44%) have at least one mental health condition, such as depression and schizophrenia, compared with 24% of Medicare beneficiaries without Medicaid coverage.

A larger share of people with both Medicare and Medicaid experience functional or cognitive impairments than Medicare beneficiaries without Medicaid coverage. More than a third (34%) report difficulties performing two or more activities of daily living—such as eating, bathing, and toileting—compared to 11% of Medicare beneficiaries without Medicaid coverage. Additionally, a higher share of people with both Medicare and Medicaid coverage have cognitive impairments (36% versus 12%) and Alzheimer’s or other dementia (8% versus 3%) than beneficiaries without Medicaid coverage.

Medicare Beneficiaries with Coverage Under Medicaid are in Poorer Health and Have Greater Health Needs than Medicare Beneficiaries Without Medicaid

4. People with both Medicare and Medicaid account for a disproportionately high share of spending in both programs.

People with both Medicare and Medicaid comprise 16% of the traditional Medicare population and 31% of traditional Medicare spending in 2021 (Figure 4). Similarly, people with both Medicare and Medicaid comprise 14% of all Medicaid enrollment and 29% of federal and state Medicaid spending. The higher spending relative to enrollment is consistent with the greater health and functional needs of people with both Medicare and Medicaid. (People enrolled in private Medicare Advantage plans are not included in this analysis because Medicare comparable spending data are not available.)

People with Both Medicare and Medicaid Account for a Disproportionately High Share of Spending in Both Programs

5. Nearly 5 million Medicare beneficiaries receive Medicaid wraparound services, including long-term care.

Almost 5 million Medicare beneficiaries with Medicaid used at least one of four Medicaid wraparound services in 2021, including long-term care, vision services, dental services, and non-emergency medical transportation (Figure 5). Medicaid wraparound services are Medicaid benefits available to most Medicare beneficiaries with Medicaid that are not covered under Medicare Part A or Part B. (The services may be covered as a supplemental benefit for people enrolled in a Medicare Advantage plan.) All states are required to provide some wraparound benefits including nursing facility care (part of institutional long-term care), home health (part of home care), and non-emergency medical transportation. Other services are optional for states to provide including dental services, vision services, and all other home care, which includes personal care, support for family caregivers, and services for people in assisted living facilities.

Medicaid covered vision services for 1.9 million Medicare beneficiaries, dental services for 1.4 million beneficiaries, and non-emergency medical transportation for 1.0 million Medicare beneficiaries. In addition, Medicaid covered long-term care services for 2.8 million Medicare beneficiaries (some of whom used both home care and institutional long-term care). Most of the people using long term-care (2.2 million) receive services in home and community settings. The costs of long-term care often exceed the median income and would quickly exhaust the median savings of Medicare beneficiaries, making Medicaid the primary payer of long-term care in the U.S., covering 61% of total spending.

Nearly 5 Million Medicare Beneficiaries Receive Medicaid Wraparound Services, including Long-Term Care

This work was supported in part by Arnold Ventures. KFF maintains full editorial control over all of its policy analysis, polling, and journalism activities.

Pharmacies as an Access Point for Expanding Contraceptive Care: A Geographic Analysis

Authors: Amrutha Ramaswamy, Karen Diep, Brittni Frederiksen, and Alina Salganicoff
Published: Mar 19, 2025

Issue Brief

Key Takeaways

  • There are 3.8 million women of reproductive age living under the Federal Poverty Line (FPL) residing in counties with no or low access to publicly funded clinics offering contraceptive care.
  • Policy changes, such as state policies and laws allowing pharmacists to prescribe contraceptive methods and the Food and Drug Administration approval of an over-the-counter daily oral contraceptive, have positioned pharmacies to play a bigger role in the provision of contraceptive methods.
  • If all states had pharmacist prescribing laws and if all pharmacies offered this care, the share of reproductive age women under the FPL living in counties with little to no access to hormonal contraceptives could decrease, while the share in counties with broadened access to contraceptive options like the pill, ring, patch, or shot could grow considerably as a result of better contraceptive access through pharmacies.
  • 35 states and DC have passed laws allowing pharmacists to prescribe, however, these policies have not been adopted by the majority of pharmacists in those states. Fifteen states do not have laws permitting pharmacists to prescribe contraception.
  • Beyond enacting state policy, there are many challenges in broadening the role of pharmacists and pharmacies as access points for hormonal contraceptive methods. These include insurance and Medicaid reimbursement to pharmacists for contraceptive counseling and consultation services, pharmacist willingness, availability, and capacity to provide services, and patient awareness of the option and interest in getting contraceptive services in a pharmacy setting.

Introduction

Pharmacies are increasingly positioned to play a bigger role in the provision of certain health care services, including access to hormonal contraceptive methods. Currently, over half of states allow pharmacists to prescribe hormonal contraception. Additionally, the Food and Drug Administration (FDA) recently approved an over-the-counter (OTC) daily oral contraceptive pill, and another formulation is currently under FDA review. In this brief, we explore avenues for expanding hormonal contraceptive care and supplies through pharmacies, as well as how and where pharmacies and pharmacists may be positioned to fill gaps in contraceptive care where there are few brick-and-mortar family planning providers, as well as the challenges in expanding these pathways.

Pathways to Contraceptive Care

Today, there are several paths to obtaining many hormonal contraceptives such as the pill, patch, shot, or ring. Those seeking contraceptive methods can 1) visit a clinician (e.g., doctor, nurse practitioner, or nurse midwife) to get a prescription either in-person or via telehealth, 2) order through a telecontraception service, using an online questionnaire to be completed asynchronously or a live video, phone, or text consultation, 3) obtain through a pharmacist in the 34 states that have implemented policies which allow pharmacists to prescribe hormonal contraceptives. In addition, Opill or levonorgestrel (Plan B, Next Choice) emergency contraceptive pills can be obtained at a pharmacy in person or ordered online without needing a prescription. Those who seek an IUD or an implant must go in person to a provider to get the methods inserted.

Although the majority of reproductive-aged women get their contraceptive care at a doctor’s office, larger shares of women with incomes under 200% of the Federal Poverty Level (FPL) or who are uninsured access contraceptive care at a clinic or pharmacy (Figure 1).

Most Women Get Their Birth Control Care at a Doctor’s Office, But Clinics and Pharmacies Play a Larger Role for Women with Low Incomes and Those Without Insurance

Publicly-Funded Contraceptive Clinics

Clinics play an important role in ensuring contraceptive access, particularly for uninsured individuals and those with low incomes. There are over 17,000 clinics nationwide that receive funds from either the Federal Title X family planning program, the Federally Qualified Health Centers (FQHCs) program, Medicaid, or the Indian Health Service (IHS) to provide family planning and contraceptive care. Despite this large network of clinics, many live in communities where access to in-person family planning services is limited. An estimated 19 million women of reproductive age in the US live in counties with fewer than one health center for every 1,000 women and are considered to be in need of publicly-funded contraception. For people living in these medically underserved areas, pharmacies could be leveraged to broaden contraceptive access.

Over-the-Counter Oral Contraception

On July 13, 2023, the FDA approved Opill for OTC availability. It is the first time a daily-use oral contraceptive pill has been approved in the US without a prescription. Emergency contraceptive pills such as Plan B and levonorgestrel generic pills have been available OTC but are not recommended for daily use. Opill became available for purchase in stores and online in the spring of 2024.

Awareness of Opill is generally still low, with just a quarter (26%) of women ages 18 to 49 saying they have heard of the newly approved daily oral contraceptive pill shortly after it became available for sale in 2024. Larger shares of women ages 26 to 35 say they have heard of Opill (30%) compared to women ages 36 to 49 (24%) according to the KFF Women’s Health Survey fielded in May and June 2024. Smaller shares of Black (21%) and Hispanic (23%) women say they have heard of the new oral contraceptive compared to White women (29%).

Research suggests that OTC oral contraceptives could especially expand access to populations who have historically faced barriers accessing contraceptive care, such as young adults and adolescents, those who are uninsured, and those living in contraceptive deserts or areas with limited access to health centers offering the full range of contraceptive methods. However, smaller shares of women who are uninsured (17%) and who live in rural areas (21%) are aware of Opill compared to those with private insurance (29%) and those living in urban or suburban areas (27%).

While Opill is a progestin-only pill, other hormonal contraceptive pills are in development or in the FDA review pipeline for over-the-counter status. Another pharmaceutical company, Cadence, has submitted to the FDA to get the first OTC combined oral contraceptive pill (COC), Zena, on the market in the U.S.

Pharmacist Prescribing

As of February 2025, 35 states and DC had passed laws (Appendix Table 1) enabling pharmacists to prescribe self-administered hormonal contraception — such as oral contraceptive pills, the DMPA injection, the patch, and the ring. Of these states, 34 states have implemented these pharmacist prescription laws (Figure 2 and Appendix Table 1).

35 States and D.C. Have Passed Laws Permitting Pharmacists to Prescribe Short-Acting Hormonal Contraceptive Methods

All of these states allow pharmacists to prescribe oral contraceptives, but vary in other details, such as the type of prescriptive authority, minimum age requirements for the patient, the type of contraceptive permitted, the length of the supply, and whether the patient needs a prior prescription from a physician.

There are generally four different policy pathways states use to expand pharmacists’ scope of practice: collaborative practice agreements (6 states), standing order (9 states), statewide protocol (14 states), and prescriptive authority (5 states) (Table 1). These four mechanisms authorize pharmacists to prescribe and dispense hormonal contraceptives with varying degrees of authority, from collaborative practice agreements being the most restrictive to prescriptive authority offering pharmacists the greatest autonomy.

Mechanisms to Expand Pharmacists’ Scope of Practice

Pharmacy Access Across the US

There were over 70,000 retail, clinic, and hospital-based pharmacies nationwide in March 2024 (Figure 3). It is estimated that 88.9% of people in the US live within 5 miles of their nearest pharmacy. More than 44,000 pharmacies (57% of all pharmacies) were located in states that have passed pharmacist prescribing laws and 29,913 (40% of all pharmacies) were in states that have no pharmacist prescribing laws. In states that have implemented pharmacist prescribing, pharmacist and pharmacy uptake affects the potential impact of these laws to expand contraceptive access.

Figure 3 is titled "Over Half of Pharmacies are Located in States with Pharmacist Prescribing Laws." It's a Map of the United States that shades in states with Pharmacist Prescribing Law and has dots of Pharmacy locations.

There are nearly four times as many pharmacies (70,000) in the US as publicly funded clinics (17,000). Most counties have more pharmacies than publicly funded clinics (Figure 4). Many areas with little to no clinic access have pharmacies that could potentially serve as an additional site to obtain hormonal contraceptive care for people who may not be able to physically get to a clinic for their services. Given the sheer number of sites and geographic spread, pharmacies are geographically situated to expand reproductive health service access points — particularly in areas that currently have no or little access to publicly funded clinics (Figure 4).

.

Although most counties have both pharmacies and publicly funded clinics (2,417 counties, green in map below), one in five counties have no clinics (655 counties, the two darkest blues in map below), 4% of counties have no pharmacies (152 counties, light blue and darkest blue below), and 3% have neither publicly funded clinics or pharmacies (80 counties, darkest blue in map below) (Figure 5).

Access Options by County: Most Counties Have Both Pharmacies and Clinics

Some estimates have found that 19 million women of reproductive age in the US live in counties with fewer than one health center for every 1,000 women and are estimated to be in need of publicly funded contraception. This KFF analysis specifically looks at women of reproductive age who live under the FPL in each of these counties and finds that 3.8 million women of reproductive age with incomes under the under the FPL live in a county with no or lower access (either no clinic or fewer than one clinic to every 1000 women) to publicly-funded clinics offering contraceptive care. Nearly half of those women (1.8 million) live in states that do not have pharmacist prescribing laws. In the broadest scenario where all states have pharmacist prescribing laws and if all pharmacies offered this care, the share who are classified as having no or low contraceptive access could plummet and the share with broadened access to contraceptive options like the pill, ring, patch, or shot could grow considerably.

When considering pharmacies as access points for contraceptive care, the analysis shows that even counties with lower comparative access were those with fewer than one clinic or pharmacy to every 250 women of reproductive age under the FPL. In many counties, pharmacies could function as a point of service for hormonal contraceptive care and potentially alleviate some of the challenges with accessing contraceptive care, even in locations where there is an existing clinic (Figure 6). In these places, women in low-income households who are interested in obtaining hormonal contraceptives at a pharmacy could do so, and those who might otherwise utilize clinic services for those same products might opt to go to the pharmacy, potentially expanding clinics’ capacity to take on more patients and serve those who require clinical care.

Pharmacist Prescribing Policies Could Expand Availability of Hormonal Contraceptives if Fully Implemented

Challenges and Barriers

Pharmacist prescribing laws, pharmacist and pharmacy uptake of these policies, OTC oral contraception, and patient knowledge and uptake all play an important role in the availability and efficacy of pharmacies as a contraceptive care access point. There are, however, many implementation challenges beyond enacting policies to broaden the role of pharmacists and pharmacies as access points for hormonal contraceptive methods.

Reimbursement

Some states require coverage parity or payment for services such as counseling that go beyond insurance coverage of just the contraceptive supply or product. The counseling generally entails a self-screening form for patients to fill out, where patients may be asked a range of questions, from whether they have had a miscarriage or abortion in the last seven days, to medical history questions about diabetes, or migraines, or previous negative interactions with hormonal contraceptives. This may be accompanied by a blood pressure screening. For example, California requires Medicaid (but not commercial plans) to pay for pharmacist contraceptive counseling. New Mexico requires parity in payment for contraceptive counseling in all group health plans so that pharmacists are reimbursed for their time for counseling at the same rate as other clinicians offering the same services. Colorado has a more limited payment parity policy and only requires payment parity for pharmacists in Health Provider Shortage Areas. Some states, like Utah and Minnesota, have pharmacist prescribing policies, but do not formally address payment for the services provided by pharmacists other than the usual dispensing fee for the contraceptive prescription. This is a disincentive for pharmacies and pharmacists to offer these services even if the state has broadened its scope of practice. As a result, even if the costs of the method are fully covered by their plan, patients will be left with out-of-pocket costs for obtaining contraceptive care at pharmacies. These services, however, would typically be covered if they sought contraceptive care from a non-pharmacist clinician.

Uptake Of Pharmacist Prescription and Training

In order to prescribe contraception, pharmacists must complete additional education requirements, which vary by state, and often include several hours of continuing education from an accredited training program. Beyond certification, pharmacists would also need to work at a pharmacy that is willing to offer pharmacist prescription of contraceptives to their customers.

A survey of pharmacists in Oregon conducted in 2015, just before Oregon implemented its prescribing law, found that over half (57%) of pharmacists were interested in prescribing contraception. However, pharmacy staffing shortages, liability concerns, and need for additional training were identified as the three largest barriers to pharmacist participation in prescribing contraceptives. A more recent national study of community pharmacists from 2021 found that a majority (65%) were interested in prescribing hormonal contraception. Pharmacists in this survey, however, expressed similar concerns about safety (e.g. patients not obtaining health screenings), liability, and time constraints, as well as lack of payment or reimbursement for services rendered.

Successful implementation also requires public information and education about the availability and safety of pharmacist-prescribed contraceptives. From the patient perspective, they must be aware of, able to afford, and be comfortable with accessing contraceptive care from a pharmacist. A report from the Birth Control Pharmacist describes a need for public awareness campaigns that this service exists and points out that although there can be media coverage when a state passes a pharmacist prescribing law, delays in implementation and lack of full provider uptake translates into lack of public knowledge about pharmacist prescribing as an option or where to find this service. A Manatt report highlights other successful programs focused on pharmacist prescribing, such as New Mexico’s work with community-based organization, Bold Futures, to expand access to contraceptive counseling and prescription in a pharmacy setting, and North Dakota’s work on ONE Rx, which promoted pharmacist prescription of naloxone.

Interviews with patients have identified several benefits of pharmacist prescribing, such as trusting pharmacists to walk through the benefits and side effects of various types of birth control methods and convenience of a pharmacy, especially when the cost to see a doctor or limited clinic hours/availability poses a barrier. However, patients also identified concerns with a lack of privacy at pharmacies in areas where everyone knows each other, and a need to continue to see a primary care provider.

OTC Contraception

The OTC availability of Opill and levonorgestrel emergency contraceptive pills adds to the options available to those seeking contraceptives in a pharmacy setting. However, the extent of the uptake of OTC oral contraceptives will rely on both access and affordability. Retailers choose whether and how to stock Opill. Those who sell it also need to decide the supply options (one, three, or six-month packs) to stock, which may affect the purchase price . Also, as with emergency contraception, many retailers could choose to keep Opill in a locked case on the shelf or behind the pharmacy counter, which could create additional access barriers.

The suggested retail price for Opill is $19.99 for a one-month supply or $49.99 for a three-month supply. Nine states require state-regulated private health plans and/or Medicaid to cover at least some OTC contraceptive methods without a prescription. However, states have limited authority to regulate contraceptive coverage for many plans. The ACA contraceptive coverage requirement largely falls to the federal government, as they have the authority to regulate the contraceptive coverage mandate in the ACA that affects the majority of plans in the U.S. A Biden Administration proposed regulation intended to expand contraceptive coverage for people with private insurance (and many with Medicaid) for OTC oral contraceptives such as Opill, male condoms, and emergency contraceptive pills without a prescription and without cost-sharing at in-network pharmacies, but this was rescinded and never finalized.

The authors would like to thank the following individuals for their input on this brief: Adam Leive, PhD and Dorothy Kronick, PhD of the Goldman School of Public Policy, University of California, Berkeley; Brigid Groves, PharmD and E. Michael Murphy, PharmD of the American Pharmacists Association.

Sample Scenarios

KFF identified examples of counties where access could be improved most from the passage of pharmacist prescribing laws, expanded clinic funding, and pharmacist uptake of prescribing laws.

Pharmacist Prescribing Law Could Expand Access

Lee County, Alabama, with one Title X clinic and no federally qualified health centers, has the most women of reproductive age living under the FPL per clinic of any county in the US. Lee County is a HRSA designated Medically Underserved Area and, according to a George Washington University US Prescription Contraception Workforce Tracker, only has 87 contraceptive prescribers to 41,324 total women of reproductive age. These prescribers are defined as primarily obstetrician/gynecologists (OBGYNs), family medicine physicians, and advanced practice nurses who have provided at least 10 total prescriptions for the pill, patch, or ring. Alabama does not have a pharmacist prescription law; however, if a law were passed, it is estimated that the nearly 30 pharmacies in Lee County could help bridge the contraceptive prescriber gap (Figure 7).

Figure 7 is titled, "Only One Publicly-Funded Clinic in Lee County, Alabama is Positioned to Serve up to 9,000 Women under the Poverty Level." A map of Lee County, AL, displays location dots for over ten pharmacies and one "FQHCs, Title X Clinics, Planned Parenthoods, and IHS Clinics."

The Role of The Indian Health Service

Many of the counties that have no or low access to pharmacies are those with a high population of American Indian and Alaskan Native people, a historically underserved and marginalized population. In these places, Indian Health Service clinics provide much, if not all, of the contraceptive care options offered to the community. McKinley County, New Mexico and Apache County, Arizona, are neighboring counties in two states that both have pharmacist prescribing laws (Figure 8). In these counties, however, pharmacy uptake would not help address their medically underserved area designation nor expand access to contraceptive care, simply because there are not enough pharmacies in those communities to do so. These counties and similar counties would need additional clinic service sites, rather than expanded pharmacy uptake, to improve access to contraceptive care for women with low incomes.

Figure 8 is titled, "McKinley County, New Mexico & Apache County, Arizona are Neighboring Counties With Few Pharmacies on Primarily Reservation Land." A comparison map of the bordering counties of Apache County, AZ and McKinley County, NM display location dots of one pharmacy per county, with both counties containing several dots for "FQHCs, Title X Clinics, Planned Parenthoods, and IHS Clinics."

Pharmacist Prescribing as A Stopgap Measure

Montgomery County, Tennessee has many more pharmacies than clinics (Figure 9). According to the GW Tracker, Montgomery County has 152 total prescribers to a total of 51,180 women aged 15-44. Tennessee’s pharmacist prescriber law went into effect in 2019 — the same year the prescriber data starts. However, there were no pharmacists prescribing at least 10 prescriptions for the pill, patch, or ring in Montgomery County in 2022. Low participation could be because of low uptake of pharmacists in prescribing and dispensing contraception, lack of participation of pharmacies in offering this service, or low consumer awareness or interest in using the services. The legislation alone has not been enough to expand the number of contraceptive prescribers in the county.

Figure 9 is titled "If Fully Implemented, Tennessee’s Pharmacy Prescribing Law Could Offer Many More Contraceptive Access Points in the County." It is a map of Montgomery County, TN, and displays several Pharmacy location dots and one location dot for FQHCs, Title X Clinics, Planned Parenthoods, and IHS Clinics.

Methods

Overview

The pharmacy location addresses (as of March 10, 2024) were pulled from the Center for Medicare and Medicaid Services (CMS) National Plan and Provider Enumeration System National Provider Identifier (NPI) Registry based on previous research by E. Michael Murphy, Lucianne West, and Nimit Jindal’s paper, “Pharmacist Provider Status: Geoprocessing Analysis of Pharmacy Locations, Medically Underserved Areas, Populations, and Health Professional Shortage Areas” (November 2021).

Pharmacy Data

The Health Insurance Portability and Accountability Act of 1996 (HIPAA) requires that every health care provider and organization have an NPI number — Type 1 numbers are assigned to specific providers and Type 2 numbers are assigned to provider locations. Adhering to the Murphy et. al methodology, we pulled all providers with the taxonomy code 3336C0003X, which designates a community or retail pharmacy, excluded all Type 1 providers, removed duplicate addresses and phone numbers, and removed all territories. Then, after extensive data cleaning to prepare the data for geocoding, the data was geocoded using R, with a cascade method which first tried the US Census Geocoder, then Open Street Maps, and then Google Maps API. The remaining pharmacies that did not correctly geocode were manually checked and almost all were closed, so these closed pharmacies were removed from the database and the remaining were manually geocoded. After data cleaning and removing duplicates, we identified 74,752 pharmacies in the US.

Clinic Data

Federally Qualified Health Centers (FQHCs)

The FQHC data, current as of March 2024, was pulled from the Health Resources and Services Administration (HRSA) website.

Indian Health Service (IHS) clinics

Indian Health Service Clinic locations, current as of June 2023, were obtained from the Indian Health Service (IHS) website. Although the IHS data includes a flag for FQHCs, very few of the FQHC-flagged clinics were found in the FQHC dataset, and there were several others in the FQHC data that did not have a flag. For this reason, the IHS clinics were de-duplicated from the FQHCs by geographic location (clinics with the same or similar name within a half mile of each other).

Title X clinics

The Title X Clinic data from the Office of Population Affairs (OPA) in Health and Human Services (HHS) is current as of February 2024. Mobile clinics were excluded and duplicates based on location were removed. Title X clinics that are also FQHCs were counted as FQHCs to avoid double counting. Tennessee did not have any clinics reflected in the database due to the state’s refusal to comply with federal Title X funding rules requiring clinics to provide referral for abortion.

Planned Parenthood clinics

The Planned Parenthood dataset is an internally collected KFF dataset pulled from the Planned Parenthood Federation America (PPFA) website. This data is current as of March 2024.

Women of Reproductive Age Under the Federal Poverty Line

Women of reproductive age under the Federal Poverty Line (FPL) was calculated using the 2022 American Community Survey (ACS) 5-Year Estimates Detailed Tables: B17001, Poverty Status in the Past 12 Months by Sex by Age from the US Census website. Counts for females 15-49 under the FPL, over the FPL, and total by county were summed. To maintain data quality, any counties that had fewer than 50 women of reproductive age under the FPL were suppressed.

In 2024, the FPL was an annual income of $15,060 per year for a family of 1 and $25,820 for a family of 3. In 2022, the last year used in the 5-year American Community Survey sample cited, it was $13,590 for a family of 1 and $23,030 for a family of 3.

In 2022, Connecticut made a change to its counties – going from 8 to 9, and redrawing some of the county lines. ACS released a 1-year comparison file for Connecticut with these new counties, which is used in lieu of the 5-year in this analysis. The full 5-year ACS file with the new Connecticut counties will not be available until 2027. The 5-year was used for all other states as the sample size is larger.

A Note About Sex and Gender Language

Throughout this research, we refer to women of reproductive age. This is a nationally collected metric often used in reproductive health research. This is not a full representation of people who seek access to the full range of contraceptive methods: people of all gender identities use contraception.

Appendix

State Laws Granting Pharmacists Authority to Prescribe Contraceptives, 2025

Examining School Shootings at the National and State Level and Mental Health Implications

Authors: Nirmita Panchal and Sasha Zitter
Published: Mar 18, 2025

Since the Columbine school shooting in 1999, there have been over 420 school shootings across the United States. More than 160 of these shootings occurred after the onset of the COVID-19 pandemic, indicating a significant increase. While 2024 marked the beginning of a decline in the number of mass shootings per year since the onset of the pandemic, this trend did not apply to school shootings, the number of which remains consistently high to date. Although school shootings continue to account for a small portion of total firearm violence, they can have a widespread impact that goes beyond physical harm. According to the Washington Post, at least 390,000 students were exposed to a school shooting (exposure is defined as students attending a school at which a shooting occurred during the current school year) since the 1999 Columbine shooting.

This brief analyzes the rate of student exposure to school shootings over time. While these exposures often occur at the community level, this brief quantifies exposures at the state and national level in order to draw comparisons. Individual state policies may play a role in their exposure rates. A KFF analysis found that states with more restrictive firearm laws generally have lower youth firearm morality than states with fewer firearm laws. The rate of exposure to school shootings depends on factors including school enrollment size and state population size. Therefore, even a single school shooting incident in a state can impact many youths beyond those that are physically injured and may significantly increase exposure rates. Key findings include:

  • The U.S. average yearly rate of student exposure to a school shooting has increased threefold over time (from 19 per 100,000 students in 1999-2004 to 51 in 2020-2024).
  • From 2020 to 2024, the rate of school shooting exposure per 100,000 students was highest in Delaware (359), DC (356), Utah (166), Arkansas (130), and Nevada (127).
  • Children exposed to gun violence may experience serious adverse effects, including anxiety, PTSD, suicide risk, and substance use issues. Some safety measures at schools, such as active shooter drills, may also negatively affect student mental health.

How has exposure to school shootings changed over time among U.S. students?

Since 1999, the rate of U.S. students exposed to a school shooting has nearly tripled, with most of the increase occurring during the pandemic years (2020-2024) (Figure 1). KFF analysis of the Washington Post’s school shooting database found that the average yearly rate of student exposure to school shootings grew from 19 per 100,000 in 1999-2004 to 51 in 2020-2024.

The Rate of U.S. Students Exposed to School Shootings has Increased Over Time, Particularly Since the Pandemic Began

Delaware, the District of Columbia, Utah, Nevada, and Arkansas had the highest rates of students exposed to school shootings since the pandemic. These states have experienced student exposure rates that are at least double the U.S. average yearly rate of exposure (51 per 100,000 students) from 2020-2024. The rate per 100,000 students was highest in Delaware (359), DC (356), Utah (166), Arkansas (130), and Nevada (127) (Figure 2). Note that student exposure rates can vary greatly at the state level due to factors such as school student enrollment size and state population. For example, Delaware and DC had low student populations (under 200,000) from 2020 to 2024, making their exposure rates more volatile than in higher-population states, and a small number of shootings could produce a high rate. For more information, see Methods.

In Several States, the Rate of Students Exposed to School Shootings is More Than Double the National Rate

While student exposure to school shootings spiked during the pandemic, several states, including Washington state and Maryland, have had exposure rates higher than the U.S. average for the past several decades (Figure 3). Since 1999, Washington’s exposure rates have remained at or above national average exposure rates – including the state’s lowest average yearly rate in 2010-2014 (25 per 100,000 students) to the state’s highest average yearly rate in 2020-2024 (62). Similarly, Colorado, Maryland, North Carolina, and Nevada have often endured school shooting exposure rates that are higher than the national average rate. Some states have consistently experienced increases in exposure rates over time, including Florida (from a yearly average of 13 per 100,000 students in 1999-2004 to 52 in 2020-2024) and Georgia (from a yearly average rate of 12 in 1999-2004 to 76 in 2020-2024).

The Rate of Students Exposed to School Shootings has Increased in Many States Over TimeYears Shown: 2020-2024U.S. Average Yearly School Shooting Exposure Rate: 51 per 100,000 Students

In contrast, Maine, Vermont, West Virginia, and Wyoming have had no student exposure to school shootings since 1999. However, there may have been incidences of gunfire on school grounds in these states that did not meet the Washington Post’s criteria for school shootings.

How do exposures to school shootings and efforts to mitigate them affect student mental health and well-being?

Although school shootings account for a small portion of gun violence, they are linked to negative mental health consequences for students and communities at large. Youth antidepressant use and suicide risk can increase in communities with exposures to school shootings. More broadly, exposure to gun violence is linked to post-traumatic stress disorder and anxiety, in addition to other mental health concerns among youth. Gun violence may also lead to challenges with school performance, including increased absenteeism and difficulty concentrating. Additionally, a survey prior to the pandemic found that the majority of teenagers and their parents felt at least somewhat worried that a school shooting may occur at their school. Although research is limited on how mass shootings affect individuals not directly exposed to them, current literature suggests that information and knowledge of mass shootings may be linked to increased levels of fear and anxiety.

Measures intended to combat school violence – such as the placement of school officers and the use of metal detectors – may also negatively affect the well-being of students and their sense of safety. Fifty-four percent of public schools reported having a sworn law enforcement officer (SLEO) such as a police officer or school resource officer on campus during the 2023-2024 school year. While many public schools report feeling that SLEOs have a positive impact on the school community, evidence that they reduce gun violence or school shootings is lacking. Further, among school shootings that involved a SLEO, several involved the officer shooting an unarmed student or staff member. Although nearly all (92%) public schools with SLEOs report that these officers carry a firearm, just over half of these schools have a written policy for firearm handling expectations among SLEOs. Further, the placement of these officers on school campuses may negatively impact students of color specifically, as they are more likely to face disciplinary action than their White counterparts. Separately, 8% of public schools report having metal detectors at school gates for all or most students and 14% of public schools perform random metal detector checks on students. While these detectors are used as a security measure, there are not enough data to demonstrate that they decrease the risk of violent behavior on school grounds. Additionally, the presence of metal detectors may damage students’ sense of safety at school.

Other safety measures include written action plans and drills in the event of an active shooter, with the latter being linked to psychological harm among participants. While 98% of public schools had a written procedure to handle an active shooter during the 2023-2024 school year, only 27% of these schools reported feeling “very prepared” for an active shooter situation. Additionally, many public schools drill students on emergency lockdown and evacuation procedures for school shootings with varying degrees of intensity, with some being psychologically harmful to participants. A longitudinal study on children exposed to school shootings in Texas demonstrated that even when school shootings do not result in deaths, the impacts of gun violence at schools – such as chronic absenteeism and economic consequences – can follow children into early adulthood. Similarly, when schools properly execute a plan prepared in advance, physical and mental harm is not completely preventable. For example, in the recent shooting at a Madison, Wisconsin school, officials praised the well-executed response by authorities, but injury and death occurred regardless.

Methods

Student exposure data is based on KFF analysis of The Washington Post’s School Shooting Database. Data on the number of youths injured by or exposed to gun violence at school is not federally tracked. However, several organizations have independently collected this data, including The Washington Post. The Washington Post dataset follows a narrow definition of school shootings that includes incidences of gunfire that occur on campus immediately before or after, or during school hours. Shootings at after-hours school-sanctioned events are excluded. Accidental discharges are included only if someone other than the shooter is injured. Suicides on school campuses are included only if they occurred within view of other students. This analysis focuses on the rate of students exposed to school shootings at the national and state level over time. Exposure to a school shooting is defined as students attending a school at which a shooting occurred during the current school year. In alignment with The Washington Post methodology, student enrollment data were based on data from the U.S. Department of Education, National Center for Education Statistics. For shootings that occurred during school hours, student enrollment data was reduced by 7% to account for the average number of absences on a given day. For shootings that occurred immediately before or after school hours, student enrollment data was reduced by 50%. Student exposure rates can vary greatly at the state level due to factors such as school student enrollment size and state population. For example, a state with a single shooting incident at a school with a large student population will have a higher school shooting exposure rate compared to a similarly-sized state with a single shooting incident at a school with a small student population.

Appendix

Number of School Shooting Incidents and Rate of Student Exposure, by State, 2020-2024

Congress Passes Full-Year Continuing Resolution Bill, Maintaining Global Health Funding at Prior Year Levels

Published: Mar 18, 2025

On March 15, 2025, the President signed a full-year “continuing resolution” (CR) that continues funding the federal government through the rest of the fiscal year. It maintains U.S. global health funding at the prior year (FY 2024) level ($10.8 billion).[i] The Full-Year Continuing Appropriations and Extensions Act, 2025, which was passed by the House on March 11, 2025 and the Senate on March 14, 2025, references relevant sections of the Further Consolidated Appropriations Act, 2024 – as well as the associated explanatory report, specifying funding levels for global health programs at the Department of State (State), U.S. Agency for International Development (USAID), Centers for Disease Control and Prevention (CDC), and National Institutes of Health (NIH). The CR also includes language (Section 1113) instructing departments and agencies to report back to Congress within 45 days on spending, expenditure, or operating plans at the program, project, or activity level for FY 2025, and specifically for foreign assistance programs funded under State and Foreign Operations (SFOPs), which includes State and USAID, at the country, regional, and central program level, and for any international organization. See other budget summaries for details on historical annual appropriations for global health programs.

KFF Analysis of Global Health Funding in the FY 2025 Continuing Resolution (CR)

[i] The $10.8 billion in global health funding is based on those amounts specified in appropriations bills. In past years, additional funding for global health has also been determined at the agency level.

5 Key Facts About Medicaid Program Integrity – Fraud, Waste, Abuse and Improper Payments

Published: Mar 18, 2025

Medicaid is the primary program providing comprehensive coverage of health and long-term care to 83 million low-income people in the United States and accounts for one-fifth of health care spending. Medicaid is jointly financed by states and the federal government but administered by states within federal rules. The recently passed House budget resolution targets cuts to Medicaid of up to $880 billion or more over a decade. While several options appear to be under consideration to significantly reduce Medicaid spending, President Trump publicly said recently about Medicaid, “We are not going to touch it. Now, we are going to look for fraud.” Speaker Johnson has said, “Medicaid is hugely problematic because it has a lot of fraud, waste, and abuse.” Although fraud, waste, and abuse can be related concepts (and all fall under a broader “program integrity” umbrella), they are also distinct in important ways (Box 1). These terms apply to other government health care programs, private health insurance, and other government programs more broadly.1  On March 11, 2025, the White House released a statement saying most federal spending lost to fraud is from entitlement programs such as Medicaid and Medicare, citing “improper payment” estimates, without clarifying (as GAO does) that “improper payments” are not a measure of fraud or abuse and most improper payments are the result of missing documentation or missing administrative steps, and are not necessarily payments made for ineligible enrollees, providers, or services.

Speaker Johnson has referenced $50 billion in annual fraudulent payments (a figure that may reflect improper payments rather than fraud). In debates about broader Medicaid spending reductions, Republicans may try to recast policy changes such as adding work requirements to Medicaid and restricting the use of provider taxes as addressing fraud, waste, and abuse. Despite talk about eliminating fraud, the President’s recent order to remove Inspectors General (IGs), who are responsible for providing independent oversight of federal programs, from at least 17 government agencies—including HHS—appears to run counter to the stated focus on fraud, waste, and abuse. Recent KFF polling shows, while the public thinks that reducing fraud and waste in government health programs could lead to reductions in overall federal spending, many (60% of Republicans, 55% of Democrats, and 51% of independents) also think reducing fraud and waste in government programs could result in a reduction of benefits. Overall, most Americans (77%) hold favorable views of Medicaid, including six in ten Republicans (63%), and at least eight in ten independents (81%) and Democrats (87%).

This brief explains what is known about improper payments and fraud and abuse in Medicaid and describes ongoing state and federal actions to address program integrity.

Box 1: Definition of Terms

Fraud is the intentional act of deception and misrepresentation by a person with the knowledge that the deception could result in some unauthorized benefit to that person or another person (e.g., billing for services never provided). Medicaid fraud is generally considered a criminal act (42 CFR 433.304 and 455.2).

Abuse refers to provider practices that are inconsistent with acceptable business and medical practices (e.g., reimbursement for services that are not medically necessary or that don’t meet professionally recognized health care standards) that result in unnecessary cost to the program (42 CFR 455.2). It also includes beneficiary practices that result in unnecessary cost to the Medicaid program.

Waste is the inappropriate utilization of services and misuse of resources that result in unnecessary cost to the program (e.g., duplication of tests). Waste is not an intentional or criminal act.

Errors are mistakes made without intent or knowledge of the error.

Improper payments are any payments that should not have been made or that were made in an incorrect amount (including overpayments and underpayments) under statutory, contractual, administrative, or other requirements. It includes any payment to an ineligible recipient, any payment for an ineligible good or service, any duplicate payment, any payment for a good or service not received, and any payment that does not account for credit for applicable discounts (31 U.S.C. § 3351(4)). Office of Management and Budget (OMB) guidance instructs agencies to report as improper payments any payments for which insufficient or no documentation was found (31 U.S.C. § 3352(c)(2)).

1. Both the federal government and states are responsible for ensuring program integrity.

Program integrity refers to the proper management and functioning of the Medicaid program to ensure it is providing quality and efficient care while using funds–taxpayer dollars–appropriately with minimal waste. Medicaid is a very complex program that involves millions of beneficiaries, hundreds of thousands of providers, and significant federal and state expenditures. Program integrity efforts work to prevent and detect waste, fraud, and abuse, to increase program transparency and accountability, and to recover improperly used funds. Program integrity activities help ensure that eligibility decisions are made correctly; prospective and enrolled providers meet federal and state participation requirements; services provided to enrollees are medically necessary and appropriate; and provider payments are made in the correct amount and for appropriate services. Program integrity also includes routine oversight to ensure compliance with state and federal law.

State Medicaid agencies administer Medicaid on a day-to-day basis and have the primary responsibility for program integrity. Program integrity includes specific, dedicated activities, as well as activities that are built into program functions (e.g., beneficiary and provider enrollment, service delivery, payment). Federal laws and regulations include requirements for states to reduce fraud, waste, and abuse. Each state must have a Medicaid Fraud Control Unit (MFCU) to investigate fraud and prosecute or refer to prosecution individuals or entities defrauding Medicaid. Other state agencies and fiscal officers may be involved, including state auditors. Comprehensive managed care is the primary Medicaid delivery system (accounting for 75% of beneficiaries and over 50% of total Medicaid spending) which creates different risks, as the state is delegating provider contracting, utilization management, and claims processing to a managed care organization (MCO). States with managed care programs have additional program integrity responsibilities.

The federal government’s responsibility is to provide “effective support and assistance to states to combat provider fraud and abuse.” CMS supports states through funding, training, and defining in regulation how states must comply with Medicaid program integrity requirements. Three federal agencies – the HHS Office of Inspector General (OIG), U.S. Department of Justice (DOJ), and Government Accountability Office (GAO) – are also involved in this work, each with different roles and responsibilities. Federal agencies regularly report on Medicaid program integrity performance, including:

2. There is no comprehensive or reliable measure of fraud in Medicaid.

Fraud is not unique to Medicaid. Fraud occurs in Medicaid, Medicare, and private health insurance. Most monetary loss from fraud is by providers. Fraud includes obtaining a thing of value through willful misrepresentation. Measuring fraud is difficult, in part, because it can only be determined with certainty after the fact and if it is identified. There are no reliable measures of fraud against Medicaid. DOJ and HHS-OIG operate a Health Care Fraud and Abuse Control (HCFAC) program, designed to coordinate federal, state, and local health care fraud and abuse law enforcement activities. A HCFAC report is published annually, describing health care fraud enforcement actions. Recent analysis of the FY 2023 HCFAC report found no beneficiary fraud in the listing. Providers convicted (of different kinds of fraud against Medicaid and Medicare) included ambulance service providers, durable medical equipment suppliers, diagnostic labs, nursing homes, pain clinics, pharmacies, physical therapists, physicians, and substance use treatment providers. Examples of successful criminal and civil investigations highlighted in the report include:

  • Sentencing of an EMT supervisor for an ambulance company who wrote and signed hundreds of false ambulance run sheets that were used to send fraudulent bills to the Texas Medicaid program;
  • Sentencing of a pharmacy owner in a scheme to bill Kentucky Medicaid (and other health benefit programs) for drug prescriptions that were never filled; and
  • Sentencing of a Michigan physician for his role in a health care fraud scheme that exploited patients suffering from addiction by administering unnecessary back injections and illegally distributing millions of medically unnecessary opioids.

In FY 2023, total HCFAC recoveries reached $3.4 billion (across Medicaid and Medicare). The reported return on investment for the HCFAC program (2021-2023) was $2.80 for every $1 spent. HHS-OIG also publishes an annual summary of the cases brought by state Medicaid Fraud Control Units (MFCUs). The report identifies criminal convictions and civil settlements and judgments by provider type. In FY 2024, MFCUs reported 1,151 convictions and $1.4 billion in recoveries (or $3.46 for every $1 spent).

3. Improper payments are not a measure of fraud.

The Improper Payments Information Act (IPIA) of 2002 (replaced by the Payment Integrity Information Act (PIIA) of 2019) requires the heads of federal agencies to annually review programs they administer and identify those that may be susceptible to significant improper payments, to estimate the amount of improper payments, to submit those estimates to Congress, and to submit a report on actions the agency is taking to reduce the improper payments. The Office of Management and Budget (OMB) has identified Medicaid and CHIP as programs at risk for significant improper payments. As a result, CMS developed the Payment Error Rate Measurement (PERM) program to comply with the IPIA / PIIA and related guidance issued by OMB.

The PERM program measures improper payments in Medicaid and produces a national improper payment rate, which is not a fraud rate. Improper payments, which are often cited when discussing program integrity, are payments that do not meet CMS program requirements. PERM is based on reviews of fee-for-service (FFS), managed care, and eligibility components of a state’s Medicaid program in the year under review. The error rate is not a “fraud rate” (or a waste or abuse rate) but a measurement of payments made that did not meet statutory, regulatory, or administrative requirements or are made in an incorrect amount (including overpayments and underpayments). While fraud and abuse may be one cause of improper payments, not all improper payments represent fraud or abuse. PERM is not designed to detect or measure fraud. States are audited on a rolling three-year basis, meaning each PERM cycle measurement includes one-third of states. Annually, the most recent three cycles are combined to produce a national improper payment rate (weighted by state size). (CMS also produces improper payment rates for CHIP, Medicare, and advanced premium tax credits (APTCs) for the federally facilitated exchange.) As with variation in all aspects of Medicaid operations, PERM rates vary across states ranging from under 1% in Alabama, South Dakota, and Washington to over 20% in South Carolina and Wyoming.

In 2024, Medicaid paid an estimated 94.9% of total outlays properly, representing $579.73 billion in proper federal payments (Figure 1). The overall Medicaid improper payment rate was 5.1% (or $31.10 billion in federal payments). However, 79.1% of the improper Medicaid payments were the result of insufficient documentation or missing administrative steps (Figure 1). These payments were not necessarily for ineligible enrollees, providers, or services (i.e., since they may have been payable if the missing information had been on the claim and/or the state had complied with requirements). Examples include state failure to document beneficiary eligibility or to appropriately screen enrolled providers, or medical records not submitted or missing required documentation to support the medical necessity of a claim. Other improper payments include payments for beneficiaries who were ineligible or were eligible but received a service that was not covered (15.6%), for providers not enrolled in the program (2.0%), and other monetary losses (3.3%) (Figure 1). States are often required to develop and implement corrective action plans for errors and deficiencies.

The 2024 improper payment rate was the lowest rate since the COVID-19 pandemic began due, in part, to flexibilities granted during the public health emergency (e.g., suspended eligibility renewal determinations and reduced requirements for provider enrollment and revalidations) and to improved state compliance with program rules. Prior to the pandemic, the improper payment rate increased following the reintegration of the PERM eligibility component in 2019, which was suspended from 2015 – 2018 to provide states with time to adjust to eligibility process changes in the Affordable Care Act.3  (In its place, CMS required states to implement pilots to assess the accuracy of their eligibility determinations.) While the national improper payment rate increased notably in 2019, 2020, and 2021 (to 21.7%), more than three quarters of improper payments (in each year) were due to insufficient documentation or missing administrative steps (data not shown). In 2024, CMS finalized rules related to eligibility and enrollment that included guidance for states on eligibility documentation procedures to reduce “paperwork” errors that lead to the majority of eligibility-related improper payments. Specifically, the rule requires records to be kept in electronic format for the entire period the case is active and for at least three years after and identifies the information that must be included in all case records; however, Congress may repeal these rules.

Medicaid Paid an Estimated 94.9% of Total Outlays Properly, and Improper Payments are Mostly Due to Insufficient Information

4. HHS and CMS identify key areas of program integrity focus, informed in part by recommendations made by other federal agencies.

HHS works with all states to develop strategies to address the root causes of improper payments. States are responsible for implementing, overseeing, and assessing the impact of these strategies and actions. Efforts include systems and process improvements (e.g., adding new claims processing checks, upgrading claims processing systems, and enhancing procedures for provider and beneficiary enrollment).

Every five years, HHS and CMS must issue a comprehensive Medicaid program integrity plan that outlines the agency’s strategy for working with states on program integrity. Historically, program integrity efforts focused on the recovery of misspent funds, but more recent initiatives move beyond “pay and chase” models to focus more heavily on prevention and early detection of fraud and abuse and other improper payments. The FY 2024-2028 CMS plan highlights key areas of focus including Medicaid managed care oversight, eligibility determination processes, systems improvements, data analytics and data sharing, and federal training and technical assistance. To help target oversight activities, CMS will continue to use a risk-based approach to focus efforts on high-risk states, providers, managed care plans, and program areas to maximize return on investment. CMS identified Medicaid managed care, non-emergency medical transport (NEMT), dental benefits, nursing facilities, and home- and community- based services as areas where there may be high-risk program integrity vulnerabilities.

Independent agencies like MACPAC and GAO regularly make recommendations to reduce fraud, waste, and abuse in Medicaid. In 2024, GAO indicated CMS had taken steps to address improper Medicaid payments (consistent with their recommendations) including improving managed care oversight (e.g., increasing audits), assessing fraud risks (including documenting vulnerabilities and identifying mitigation strategies), and improving state compliance with provider screening and enrollment requirements. GAO notes, however, actions on recommendations that remain unimplemented could further enhance program integrity—including additional CMS oversight/action to improve state compliance with provider enrollment and screening requirements, ensure timely state eligibility determinations, and improve collaboration with state auditors. Additionally, GAO made recommendations to CMS about other areas where program oversight and transparency could be improved including managed care, demonstration waivers, and other financing. MACPAC recommendations include simplifying and streamlining program integrity regulatory requirements, improving state-federal coordination, and identifying the most effective program integrity activities.

5. “Fraud, waste, and abuse” are at the forefront of current debates as a basis for making changes in Medicaid and more broadly.

Medicaid is a very complex program that involves millions of beneficiaries, hundreds of thousands of providers, 51 state agencies (including DC), different delivery systems, complicated eligibility rules, and significant federal and state expenditures—all of which together create vulnerabilities and opportunities for error. Since the enactment of Medicaid in 1965, the statute has evolved to promote program integrity. The focus of program integrity efforts has also evolved at CMS in response to changing legislation, policy developments, and priorities. Each administration may approach program integrity differently, with different goals and a willingness to accept different tradeoffs. Republicans in Congress and the Trump Administration state they are not aiming to cut Social Security, Medicare, or Medicaid benefits but aiming to root out fraud, waste and abuse—often citing improper payment estimates as evidence of extensive fraud in Medicaid and Medicare, despite GAO stating improper payments are not designed to identify fraud and are not a measure of fraud or abuse. While policy makers and the public support efforts to root out fraud and make government more efficient, there is little support for broad reductions in federal spending on Medicaid that could affect coverage, benefits, or access to care.

What is known about fraud in Medicaid is that it’s not unique to Medicaid (fraud also occurs in Medicare and private health insurance) and is mostly committed by providers. There are checks on fraud, waste, and abuse at both the federal and the state levels, as described in the sections above. GAO and MACPAC recommendations to reduce fraud and abuse may involve additional investments in oversight and transparency but not reductions in federal funding. As the budget debate continues, there may be efforts to recast certain Medicaid policy changes such as adding work requirements to Medicaid and restricting the use of provider taxes as addressing fraud, waste, and abuse. There are proponents and opponents of such policies, and these policies may come with tradeoffs (e.g., decreasing federal funding while shifting costs to the states and reducing coverage), but they are not about rooting out fraud in Medicaid.

  1. GAO has issued separate overviews that apply government-wide of fraud and improper paymentswaste, and abuse. ↩︎
  2. A subset of states are audited each year; CMS publishes an improper payment rate for the states measured in each cycle – most recently available in 2024 (p. 52), 2023 (p. 52), and 2022 (p. 53). ↩︎
  3. CMS continued to report the 2014 improper payment rate for eligibility errors as part of its overall PERM improper payment rate calculation. ↩︎

What Services Does Medicaid Cover in Assisted Living Facilities?

Authors: Priya Chidambaram, Abby Wolk, Alice Burns, and Molly O’Malley Watts
Published: Mar 14, 2025

Issue Brief

Assisted living facilities are a type of residential facility where older adults and people with disabilities may live when they are unable to live safely or comfortably in their own home. In assisted living facilities, residents typically live in their own room or apartment and share common areas. They have access to services including meals, supervision and security, social activities, and home care (also known as “home and community-based services” or HCBS). About one million people live in assisted living facilities in the U.S, though that number varies slightly between sources because of differing definitions of assisted living. Other types of residential care facilities include board and care homes, nursing facilities, and continuing care retirement communities. The costs of assisted living facilities (which averaged $64,200 in 2023) tend to be lower than those of nursing homes but higher than those of living independently, and most people pay for the costs of assisted living by themselves. Medicare does not cover the costs of assisted living, but Medicaid may cover the home care services residents receive and offer other protections for residents with Medicaid. It is unknown how many assisted living facilities accept Medicaid, but the National Center for Assisted Living estimates that Medicaid pays for daily services for about 200,000 people (approximately one in five residents).

There are expectations of major changes to Medicaid through Congressional or executive actions that could have implications for people in assisted living facilities who rely on Medicaid coverage. Although Medicaid law prohibits states from covering assisted living room and board expenses, states’ home care programs may offer some coverage. Using data from the 22nd KFF survey of officials administering Medicaid home care programs in all 50 states and the District of Columbia (a state for the purposes of this analysis), which states completed between April and October 2024, this issue brief describes the circumstances under which Medicaid covers services provided in assisted living facilities, and protections the Medicaid program offers to residents of assisted living facilities. Key findings include:

  • Most state Medicaid programs (41) cover home care services provided to eligible residents in assisted living facilities under some circumstances (Figure 1, Appendix Table 1).
  • 34 states cover personal care provided in assisted living facilities and 29 states make services such as personal care available to residents 24 hours a day, 7 days per week.
  • Half of states (25) offer protections against eviction beyond what is required under federal law, but only 10 states require assisted living facilities to accept new residents who are covered by Medicaid.

Forty-One States Cover Home Care Services Provided in Assisted Living Facilities

What home care services are covered by Medicaid in assisted living facilities?

While federal Medicaid statute requires states to cover the costs of nursing facilities, including both room and board and the costs of care, nearly all home care is optional for states to cover. Many older adults and people with disabilities move into assisted living facilities when they require assistance with the activities of daily living (such as eating and dressing) and the instrumental activities of daily living (such as preparing meals and managing medication), as an alternative to nursing facilities. Although Medicaid does not cover room and board in assisted living facilities, Medicaid may cover home care for assisted living facility residents and some states may have policies in place to defray the costs of room and board (see below).

41 of the 47 responding states cover services provided in assisted living facilities through at least one Medicaid home care program (Figure 1, Appendix Table 1). Medicaid home care can be offered through either the Medicaid state plan or as part of a specialized waiver. Benefits offered through a state plan are generally available to all Medicaid enrollees who need them, whereas waivers allow states to offer services that are targeted to a specific population. States may also use waivers to provide a broader set of services and to limit the number of people who can participate in the waiver. States most commonly provide home care in assisted living facilities through 1915(c) waivers (32 states), which are generally tailored to specific populations. States less commonly offer home care through 1115 waivers (6 states), the personal care state plan benefit (8 states), or the Community First Choice option (3 states).

People who are ages 65 and older or have physical disabilities are the most likely to be eligible for Medicaid coverage of home care in assisted living facilities. Among the 32 states that cover home care in assisted living facilities for a specific population, 30 states do so using waivers that target adults who are ages 65 and older or have physical disabilities. Only 24 states provide home care in assisted living facilities to support other targeted populations including: waivers for people with intellectual or developmental disabilities (9 states), traumatic brain injuries (5 states), mental health conditions (3 states), HIV/AIDS (1 state), and medically fragile/technology dependent children (1 state).

Thirty-four states cover personal care provided in assisted living facilities and twenty-nine states make services such as personal care available to residents 24 hours a day, 7 days per week (Figure 2, Appendix Table 2). KFF asked states about what services they provide in assisted living facilities through Medicaid home care programs using the Centers for Medicare and Medicaid Services’ (CMS) list of services, which are categorized in a comprehensive taxonomy. The taxonomy was developed to provide common language for describing home- and community-based services across waivers and state plans. CMS defines personal care services—the most commonly covered benefit—as services provided to help Medicaid enrollees remain in their homes and communities rather than live in institutional settings, such as nursing homes. Such services generally include assistance with the activities of daily living such as eating and bathing or the instrumental activities of daily living such as managing medication. In Medicaid, round-the-clock services (provided by 29 states) are a defined benefit in which a provider takes responsibility for the health and welfare of a person 24 hours a day, 7 days a week. Other services covered by many states in assisted living facilities include case management (24 states); nursing (22 states); equipment, technology, and modifications (21 states); and non-medical transportation (19 states, Figure 2, Appendix Table 2).

Personal Care and Round-the-Clock Services are the Most Commonly Covered Services in Assisted Living Facilities

What protections does the Medicaid program offer to residents of assisted living facilities?

Although states are prohibited from using Medicaid funds to pay for the costs of room and board, Paying for Senior Care reports that 47 states (including D.C.) provide some level of assistance to Medicaid enrollees in assisted living. (Paying for Senior Care is an online source of information about financial resources for seniors, and is owned and operated by Caring, LLC, which maintains directories of and offers referrals to senior care providers.) Medicaid enrollees have relatively low incomes and fewer savings compared to other adults, which could make it difficult to afford the full price for a room at an assisted living facility. Paying for Senior care reports that common forms of assistance from Medicaid include capping the costs assisted living facilities may charge Medicaid enrollees and using Medicaid funding to pay for meal preparation and service. Such supports are permissible because in the first case, Medicaid is not spending any money, and in the second case, Medicaid is not paying for food, but rather for help preparing and eating it, which is considered a form of personal care. Beyond Medicaid, there are 44 states that provide additional supplemental security income (SSI) to cover assisted living costs, and SSI recipients are generally eligible for Medicaid.

Although those programs help residents afford the costs of assisted living, they may also discourage assisted living facilities from caring for Medicaid enrollees, particularly because Medicaid payment rates tend to be lower than what people would pay out-of-pocket. In 2023, Wisconsin made national news on account of seniors being evicted from assisted living facilities after they had spent all of their savings on home care and became eligible for Medicaid.

Federal law provides some protections against eviction for assisted living residents who become eligible for Medicaid. Assisted living facilities that accept Medicaid are considered to be a home and community-based setting, as defined under the HCBS Settings Rule. Under the provisions in this rule, assisted living facilities providing home care under Medicaid must provide “comparable protections” as to what tenants have under landlord-tenant law in a given state, county, and city. Since these protections are driven by local landlord-tenant law, eviction protections vary by where a facility is located. The protections at an absolute minimum generally mean that a resident cannot be evicted without written notice and a trial, and are more extensive in some localities.

In addition to federally required protections, 25 of 47 responding states have additional eviction protections in place for Medicaid enrollees who live in assisted living facilities and are unable to pay the monthly fees (Figure 3, Appendix Table 3). The most common protection (15 states of 25) requires facilities to transition people into a new facility if they are unable to pay monthly fees. Some states noted using care coordination agencies or case managers to coordinate moving residents to a new facility if they were facing an eviction. A small number of states (9 of 25) prohibit assisted living facilities from evicting residents if they are paying the state-determined payment amount for room and board. Such states have limits on the monthly fees assisted living facilities can charge Medicaid enrollees that are calculated based on enrollees’ income. An additional 2 states have similar protections in place for people who are using home care provided through managed care plans and Kansas prohibits assisted living facilities from evicting people under any circumstances.

Over Half of Responding States Have at Least One Eviction Protection in Place for Medicaid Enrollees Who Live in Assisted Living Facilities

New Jersey and Oklahoma require all assisted living facilities to accept Medicaid enrollees as new residents and eight other states require assisted living facilities to accept Medicaid enrollees if they receive Medicaid payments (Figure 4, Appendix Table 4). It is not known what percentage of assisted living facilities receive Medicaid funding or how many states require them to do so, and most states do not require assisted living facilities to accept new residents who are enrolled in Medicaid.

10 States Require Assisted Living Facilities to Accept New Residents Who are Enrolled in Home Care Waivers

This work was supported in part by Arnold Ventures. KFF maintains full editorial control over all of its policy analysis, polling, and journalism activities.

Appendix

States' Policies for Covering Services Provided in Assisted Living Facilities by Waiver and Program

States' Policies for Covering Home Care Services in Assisted Living Facilities

States' Policies for Eviction Protections for Waiver Participants Who Live in Assisted Living Facilities and Are Unable to Pay the Monthly Fees

States' Policies Requiring Assisted Living Facilities to Accept New Residents by Waiver/Program

Will the Trump Administration Fast Track the Privatization of Medicare?

Published: Mar 13, 2025

Note: This piece was updated on March 14th to reflect the latest data from MedPAC.

The privatization of Medicare has been taking place without much public debate – a trend that has implications for the 68 million people covered by Medicare, health care providers, Medicare spending, and taxpayers. Since 2010, the share of Medicare beneficiaries receiving their Medicare benefits from private Medicare Advantage insurers has more than doubled (Figure 1). The Congressional Budget Office (CBO) projects nearly two-thirds of all Medicare beneficiaries will be in private plans by 2033, though data released in the early part of 2025 show enrollment growth in 2025 has been somewhat lower than CBO projected. The Trump administration has the opportunity to weigh in on the pace of growth in private Medicare Advantage enrollment and the future of traditional Medicare, which remains the source of coverage for close to half of the Medicare population.


Share of Medicare beneficiaries enrolled in Medicare Advantage and traditional Medicare, 2007-2034.

Questions about Medicare Advantage are likely to come up at the forthcoming confirmation hearing of Dr. Mehmet Oz, President Trump’s nominee to head up the Centers for Medicare & Medicaid Services (CMS). In the past, Dr. Oz has promoted Medicare Advantage in co-authored papersinterviews and on his television show. His support for Medicare Advantage aligns with general preferences among Republicans to maximize the role of the private sector, including Medicare Advantage, over government-run public programs, such as traditional Medicare.

The growth in Medicare Advantage is due to a number of factors, but none may be greater than the appeal of potentially lower costs and extra benefits like dental coverage and debit cards, offered by Medicare Advantage plans and aggressively marketed by brokers and insurers. Insurers are required to offer extra benefits when they estimate that their costs for Medicare-covered (Part A and Part B) benefits will be lower than the maximum amount the government is willing to pay in an area. They are able to offer additional extra benefits, in part, due to a payment system that, on average, sets maximum payments well above the costs of similar people in traditional Medicare and adjusts payments for health status in a way that overestimates costs for Medicare Advantage enrollees.

According to MedPAC, an independent, non-partisan agency that advises Congress about Medicare payment, the federal government pays insurers 20% more for Medicare Advantage enrollees than it pays for similar people in traditional Medicare, at a cost of $84 billion in 2025. To put the $84 billion in context, that’s more than Medicare paid physicians under the physician fee schedule to treat traditional Medicare patients in 2024. The higher Medicare spending for Medicare Advantage enrollees results in $13 billion in higher Medicare Part B premiums paid by Medicare beneficiaries, including those who are not in Medicare Advantage.

To promote efficiencies and trim federal spending, the administration could, for example, make technical adjustments to the payment system through the annual rate notice that could have the effect of lowering payments to plans. To achieve further savings, the administration could work with Congress to adopt savings proposals, including those that have recently been advanced by the Paragon Health Institute. These include ending the quality bonus program that increases Medicare spending by nearly $12 billion a year or capping Medicare Advantage benchmarks at 100 percent of local traditional Medicare costs except in areas with low Medicare Advantage penetration. Such changes would achieve Medicare savings but could also make it less profitable for insurers and potentially slow growth or even reduce private plan enrollment.

Alternatively, the Trump administration could adopt policies to accelerate the pace of privatization, such as boosting payments to plans through the annual rate notice and adopting other policies to encourage more private plan enrollment. The administration could, for example, make it easier for insurers and brokers to market Medicare Advantage plans to attract new enrollees, by unwinding the requirement that all television ads be approved before they can be aired or easing the requirement that brokers provide certain information to beneficiaries before they can enroll them in a plan.

The administration could also advance policies to make Medicare Advantage the default enrollment option for new beneficiaries – an approach that would likely accelerate the pace of privatization, and potentially increase spending, all other things equal.

The transformation of Medicare into a marketplace of private plans raises a number of questions that are not being debated. Should the payment system for Medicare Advantage plans be modified, and if so, how and to what end? What should be the role of traditional Medicare nationwide and in rural areas, where fewer beneficiaries are enrolled in Medicare Advantage? Should traditional Medicare be strengthened, with additional benefits and an out-of-pocket cap, so beneficiaries have a meaningful choice when comparing Medicare coverage options? What more should be done to help beneficiaries understand the tradeoffs between traditional Medicare and Medicare Advantage including the potential for extra benefits and lower costs in Medicare Advantage versus challenges that may arise due to limited provider networks and prior authorization requirements?

It’s not yet clear whether the administration will promote policies that fast track the privatization of Medicare in a way that may increase federal spending, or focus more on achieving efficiencies and savings within Medicare Advantage. How this plays out will have implications for beneficiaries, health care providers and insurers, and is worthy of serious debate.

This work was supported in part by Arnold Ventures. KFF maintains full editorial control over all of its policy analysis, polling, and journalism activities.

News Release

Poll: Most Republicans Do Not Trust CDC On Bird Flu

Many People Are Unaware that Public Health Officials Recommend Avoiding Raw Milk

Published: Mar 13, 2025

As bird flu continues to circulate among animals in the U.S. with some human cases, about six in 10 (58%) people overall have at least “a fair amount” of trust in the Centers for Disease Control and Prevention (CDC) to provide reliable information about bird flu, though only 21% have a “great deal of trust,” the latest KFF Tracking Poll on Health Information and Trust finds.As the White House withdraws the nomination of Dr. David Weldon to lead the CDC, Republican trust in the agency is low, with about six in 10 (58%) Republicans saying they have little to no trust in the CDC to provide reliable information on bird flu. Most Democrats (72%) and independents (61%) have at least a fair amount of trust in the CDC to provide reliable information on bird flu.

The poll also finds that many people are unaware or unsure about current public health recommendations for preventing the spread of bird flu. For instance, about 4 in 10 adults (39%) are aware that public health officials recommend avoiding raw or unpasteurized milk as a precaution against bird flu, while most either are unsure (50%) or incorrectly say that officials do not recommend avoiding raw milk (11%).

A larger share of Democrats (47%) compared with independents (38%) and Republicans (34%) are aware that public health officials recommend avoiding raw milk. At least half of independents (52%) and Republicans (55%) say they are not sure if this is recommended. However, few across partisans say avoiding unpasteurized milk is not recommended.Amid concerns about egg prices and inflation more broadly, the poll finds nearly nine in 10 adults (86%) are concerned that bird flu will increase the cost of food. Fewer, but still around half (51%), are concerned that bird flu will be the next pandemic in the U.S. or will negatively affect their family’s health (50%). Democrats are almost twice as likely as Republicans to worry that bird flu will be the next pandemic (68% and 36%, respectively) or that it will negatively affect their family’s health (64% and 36%, respectively).

The poll is part of KFF’s Health Information and Trust Initiative, which is aimed at tracking health misinformation in the U.S, analyzing its impact on the American people, and mobilizing media to address the problem.Designed and analyzed by public opinion researchers at KFF, this survey was conducted Feb. 18-25, 2025, online and by telephone among a nationally representative sample of 1,322 U.S. adults in English and in Spanish. The margin of sampling error is plus or minus 3 percentage points for the full sample. For results based on other subgroups, the margin of sampling error may be higher.

Poll Finding

KFF Tracking Poll on Health Information and Trust: Bird Flu

Published: Mar 13, 2025

Findings

As bird flu continues to circulate among animals in the U.S., the latest KFF Tracking Poll on Health Information and Trust finds that the public is more concerned about the economic impacts of the disease rather than the human health impacts at this point. Trust in the U.S. Centers for Disease Control and Prevention (CDC) to provide reliable information on bird flu is divided along partisan lines, with Democrats and independents largely expressing confidence in the agency, while most Republicans report little to no trust, reflecting broader partisan differences in skepticism toward public health agencies since the COVID-19 pandemic. Divided trust in the CDC and other public health agencies could pose a problem for communicating precautionary measures to the public if bird flu evolves into a wider public health emergency. Currently, the poll finds that most of the public is uncertain about which precautions are recommended to prevent bird flu transmission.

Awareness and Concerns About Bird Flu Outbreak in the U.S.

Amid concerns from public health officials, this KFF Tracking Poll on Health Information and Trust finds that attention to news about bird flu has remained steady since January, and the public is most concerned about bird flu’s impact on grocery costs rather than health implications. Since spring 2024, H5N1 avian influenza has affected humans and animals in the U.S. and Canada. At this time, the CDC reports that the current public health risk remains low. While some human infections have occurred, including one death linked to H5N1 in January 2025, there have been no known cases of human-to-human transmission.

Half of adults in the U.S. have heard or read “a lot” (13%) or “some” (39%) about recent cases of bird flu in the U.S., including larger shares of Democrats (59%), those with a college degree (59%), and adults ages 65 and older (68%). One-third (32%) of the public have heard “a little” and 16% have heard “nothing at all.” Similar shares – about half – across race and ethnicity have heard at least “some” about the avian flu.

Amid national concerns about inflation and rising prices, nearly nine in ten adults are “very” or “somewhat” concerned that bird flu will increase the cost of food in the U.S. This includes at least eight in ten adults across partisans, race and ethnicity, and household income levels.

Smaller shares, but still about half, of the public are concerned about the health impacts of the bird flu, including the impact on their own families. About half of U.S. adults are concerned the bird flu will be the next pandemic (51%) or that it will negatively impact their own or their family’s health (50%), including larger shares of Democrats (68% and 64% respectively), Hispanic adults (71% and 70%), Black adults (63% and 65%), and those with lower household incomes (63% for both). Health concerns seem to have increased somewhat since January, when one-third of adults said they were concerned they or a family member would get sick from bird flu.

Majority Are Concerned About Bird Flu’s Impact on Food Costs; Half Worry About a Potential Pandemic or Health Impacts

There has been a lot of change for key health agencies over the past few weeks with Robert F. Kennedy, Jr.’s confirmation as the new Secretary of Health and Human Services (HHS), as well as the Trump administration’s downsizing of the federal workforce and the firing (and attempted rehiring) of some employees working on bird flu for the U.S. Department of Agriculture (USDA).

Amid these changes, the CDC remains one of the federal government agencies with primary responsibility for communicating with the public about emerging public health threats. Overall, nearly six in ten adults trust the CDC “a great deal” (21%) or “a fair amount” (38%) to provide reliable information about bird flu, while about four in ten adults say they either don’t trust the CDC “much” (29%) or “at all” (13%).

A KFF poll conducted before Robert F. Kennedy’s confirmation as HHS Secretary showed that most Republicans trusted him to make the right recommendations when it comes to health issues, while few Democrats or independents felt the same. Despite this, and Kennedy’s new position at HHS overseeing the CDC, partisan patterns in trust in the CDC for bird flu information mirror trust in the agency since the COVID-19 pandemic, with Democrats and independents expressing much higher levels of trust than Republicans. This poll – conducted the week after Kennedy’s confirmation – finds that majorities of Democrats (72%) and independents (61%) trust the CDC at least “a fair amount” to provide reliable information on bird flu, while fewer (42%) Republicans say the same. This partisan divide on trust in the CDC is consistent with divisions in trust in the agency on health issues in recent years, but represents a shift from the start of the COVID-19 pandemic when trust in the CDC and other health agencies was high across partisans.

About Six in Ten Trust the CDC To Provide Reliable Information About Bird Flu, Including Larger Shares of Democrats and Independents

Many Are Unaware or Unsure of Current Public Health Recommendations on Bird Flu

At this time, the CDC recommends avoiding close contact with sick animals and avoiding unpasteurized milk products as precautions against bird flu, while eggs purchased from grocery stores are considered safe, and wearing masks in public spaces is not currently recommended for the general public as a bird flu precaution. This poll finds the public largely unaware or unsure which precautions are currently recommended to protect themselves from bird flu.

About four in ten adults are aware that avoiding close contact with sick animals (45%) and avoiding unpasteurized or raw milk products (39%) are recommended by public health officials as precautions against bird flu, though half of the public says they are “not sure” if these are recommended. Few (7% and 11% respectively) incorrectly say these precautions are not recommended by public health officials.

About half of the public is aware that public health agencies are not recommending avoiding eggs from a grocery store for bird flu prevention, but about four in ten (44%) are unsure of whether this is recommended. Similarly, the public is also divided on whether public health officials are recommending that people wear masks in crowded public spaces to prevent bird flu, with one in five (19%) saying it is recommended, about one-third (35%) saying it is not recommended for bird flu prevention and half (47%) saying they are unsure.

Interactive DataWrapper Embed

Although similar shares of adults across partisans are unsure about most of the precautions asked about in this survey, awareness diverges slightly on the issue of unpasteurized milk. There is large public health consensus that pasteurization of milk is crucial for killing foodborne bacteria and viruses that can cause illness in humans, and there is no evidence for health benefits to consuming raw milk. Given that H5N1 bird flu has infected dairy cows across the U.S., raw milk consumption is even more dangerous. HHS Secretary Kennedy has said he drinks raw milk, has criticized the FDA’s regulation of the product, and has called for the removal of a ban on interstate sale of raw milk, which may increase consumption. A larger share of Democrats (47%) compared with independents (38%) and Republicans (34%) are aware that public health officials recommend avoiding raw milk. At least half of independents (52%) and Republicans (55%) say they are not sure if this is recommended. However, few across partisans say avoiding unpasteurized milk is not recommended.

At Least Half of Republicans and Independents, Four in Ten Democrats, Are Unsure Whether Avoiding Raw Milk Is Recommended To Prevent Bird Flu

Methodology

This KFF Tracking Poll on Health Information and Trust was designed and analyzed by public opinion researchers at KFF. The survey was conducted February 18-25, 2025, online and by telephone among a nationally representative sample of 1,322 U.S. adults in English (1,254) and in Spanish (68). The sample includes 1,014 adults (n=53 in Spanish) reached through the SSRS Opinion Panel either online (n=992) or over the phone (n=22). The SSRS Opinion Panel is a nationally representative probability-based panel where panel members are recruited randomly in one of two ways: (a) Through invitations mailed to respondents randomly sampled from an Address-Based Sample (ABS) provided by Marketing Systems Groups (MSG) through the U.S. Postal Service’s Computerized Delivery Sequence (CDS); (b) from a dual-frame random digit dial (RDD) sample provided by MSG. For the online panel component, invitations were sent to panel members by email followed by up to three reminder emails.

Another 308 (n=15 in Spanish) adults were reached through random digit dial telephone sample of prepaid cell phone numbers obtained through MSG. Phone numbers used for the prepaid cell phone component were randomly generated from a cell phone sampling frame with disproportionate stratification aimed at reaching Hispanic and non-Hispanic Black respondents. Stratification was based on incidence of the race/ethnicity groups within each frame. Among this prepaid cell phone component, 140 were interviewed by phone and 168 were invited to the web survey via short message service (SMS).

Respondents in the prepaid cell phone sample who were interviewed by phone received a $15 incentive via a check received by mail. Respondents in the prepaid cell phone sample reached via SMS received a $10 electronic gift card incentive. SSRS Opinion Panel respondents received a $5 electronic gift card incentive (some harder-to-reach groups received a $10 electronic gift card). In order to ensure data quality, cases were removed if they failed two or more quality checks: (1) attention check questions in the online version of the questionnaire, (2) had over 30% item non-response, or (3) had a length less than one quarter of the mean length by mode. Based on this criterion, no cases were removed.

The combined cell phone and panel samples were weighted to match the sample’s demographics to the national U.S. adult population using data from the Census Bureau’s 2024 Current Population Survey (CPS), September 2023 Volunteering and Civic Life Supplement data from the CPS, and the 2024 KFF Benchmarking Survey with ABS and prepaid cell phone samples. The demographic variables included in weighting for the general population sample are sex, age, education, race/ethnicity, region, civic engagement, frequency of internet use, political party identification by race/ethnicity, and education. The weights account for differences in the probability of selection for each sample type (prepaid cell phone and panel). This includes adjustment for the sample design and geographic stratification of the cell phone sample, within household probability of selection, and the design of the panel-recruitment procedure.

The margin of sampling error including the design effect for the full sample is plus or minus 3 percentage points. Numbers of respondents and margins of sampling error for key subgroups are shown in the table below. For results based on other subgroups, the margin of sampling error may be higher. Sample sizes and margins of sampling error for other subgroups are available on request. Sampling error is only one of many potential sources of error and there may be other unmeasured error in this or any other public opinion poll. KFF public opinion and survey research is a charter member of the Transparency Initiative of the American Association for Public Opinion Research.

GroupN (unweighted)M.O.S.E.
Total1,322± 3 percentage points
Party ID
Democrats432± 6 percentage points
Independents424± 6 percentage points
Republicans377± 6 percentage points