Medicaid Coverage for Women

Published: Aug 26, 2026

Medicaid, the nation’s health coverage program for people with low incomes, provides more than 39 million women across the nation with health and long-term care coverage. Women comprise the majority of the adult Medicaid population and the program offers coverage of a wide range of primary, preventive, specialty, and long-term care services that are important to women across their lifespans. Given the importance of the program for women and their families, changes to the program, such as the 2025 federal policy changes to Medicaid and the enactment of new work requirements for the Medicaid expansion population, will have significant implications for low-income women’s access to coverage and care. This data note presents key data points describing the current state of the Medicaid program as it affects women.  

Who is Eligible for Coverage?

In 2023 adult women comprised 37% of the overall Medicaid population and the majority of adults on the program (Figure 1).1 Prior to the 2010 Affordable Care Act (ACA), women were more likely to qualify for Medicaid than men because of their lower incomes and because they were more likely to belong to one of Medicaid’s categories of eligibility for adults: pregnant, parent of a dependent child, senior, or person with a disability. The ACA added a new Medicaid eligibility category by extending Medicaid eligibility to nearly all adults under age 65 with incomes up to 138% of the federal poverty level (FPL), though women are still more likely than men to be covered by Medicaid.
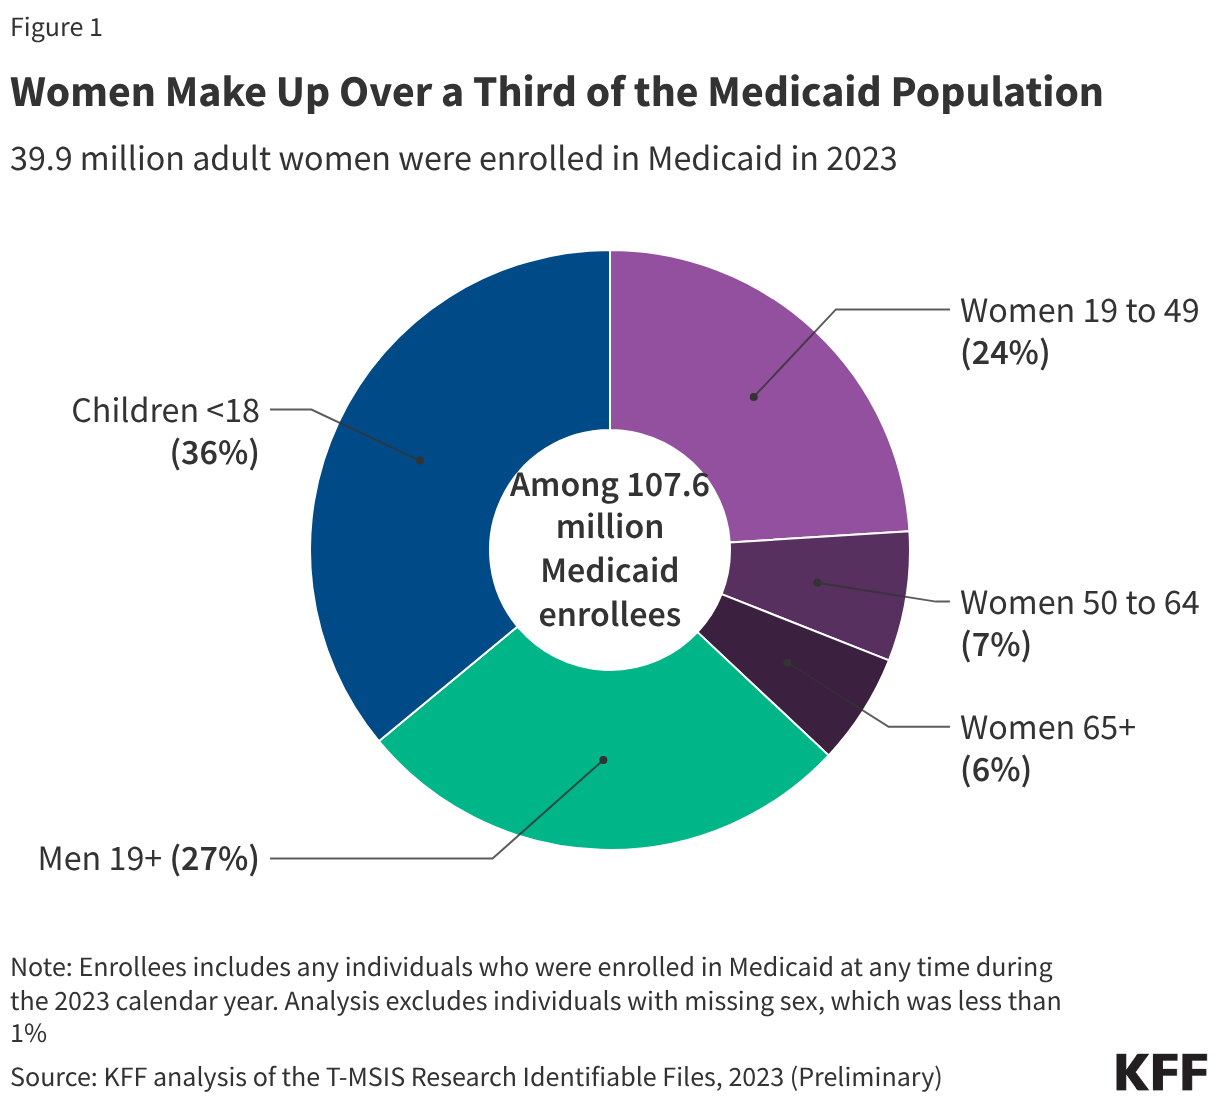
Pie chart showing age and gender breakdown of individuals enrolled in Medicaid in 2023. Overall, adult women 19 and older make up the majority of the adult Medicaid population, and women of reproductive age (ages 19 to 49) make up 24% of the whole Medicaid population.
  • As of May 2026, 40 states and DC have opted to expand eligibility for Medicaid under the ACA, which allows women and men with low incomes below 138% FPL to qualify regardless of their pregnancy, parenting or disability status.  
  • In the 10 states that have not expanded Medicaid under the ACA, adults only qualify if they meet income criteria AND belong to one of the previously mentioned categorical eligibility groups. While there are federal eligibility minimums, states have the option to expand eligibility levels for each group up to certain limits. As a result, income eligibility criteria vary for different groups of beneficiaries within as well as between states.
  • In the states that have not adopted the ACA Medicaid expansion, approximately 576,000 women ages 19 to 64 with incomes below the federal poverty level and who are uninsured fall into a “coverage gap.” This is because they earn too much money to qualify for Medicaid in their state but not enough to qualify for assistance purchasing a private policy through their state’s ACA Marketplace, which is available for individuals with incomes between 100% FPL and 400% FPL.
  • H.R. 1, the 2025 budget reconciliation law, has made significant changes to the Medicaid program. For the first time, eligibility for adults in the ACA Medicaid Expansion group will be conditioned on meeting work requirements, starting January 1, 2027. Prior KFF research has shown that most adult women covered by Medicaid meet work requirements or could qualify for one of the law’s exemptions (including being a parent of a child under age 14), but they are at risk of losing coverage because of the administrative burdens related to reporting requirements. In 2023, approximately 40% of adult women enrolled in Medicaid were enrolled via the ACA expansion pathway.2 The Congressional Budget Office (CBO) estimates that these requirements will reduce federal Medicaid spending by $326 billion over the next 10 years but will also increase the number of uninsured by 5.3 million in 2034.

Profile of Women Under 65 Covered by Medicaid

Medicaid covers a diverse population of women who face many social, economic, and health challenges that affect their ability to receive timely and high-quality health care.  

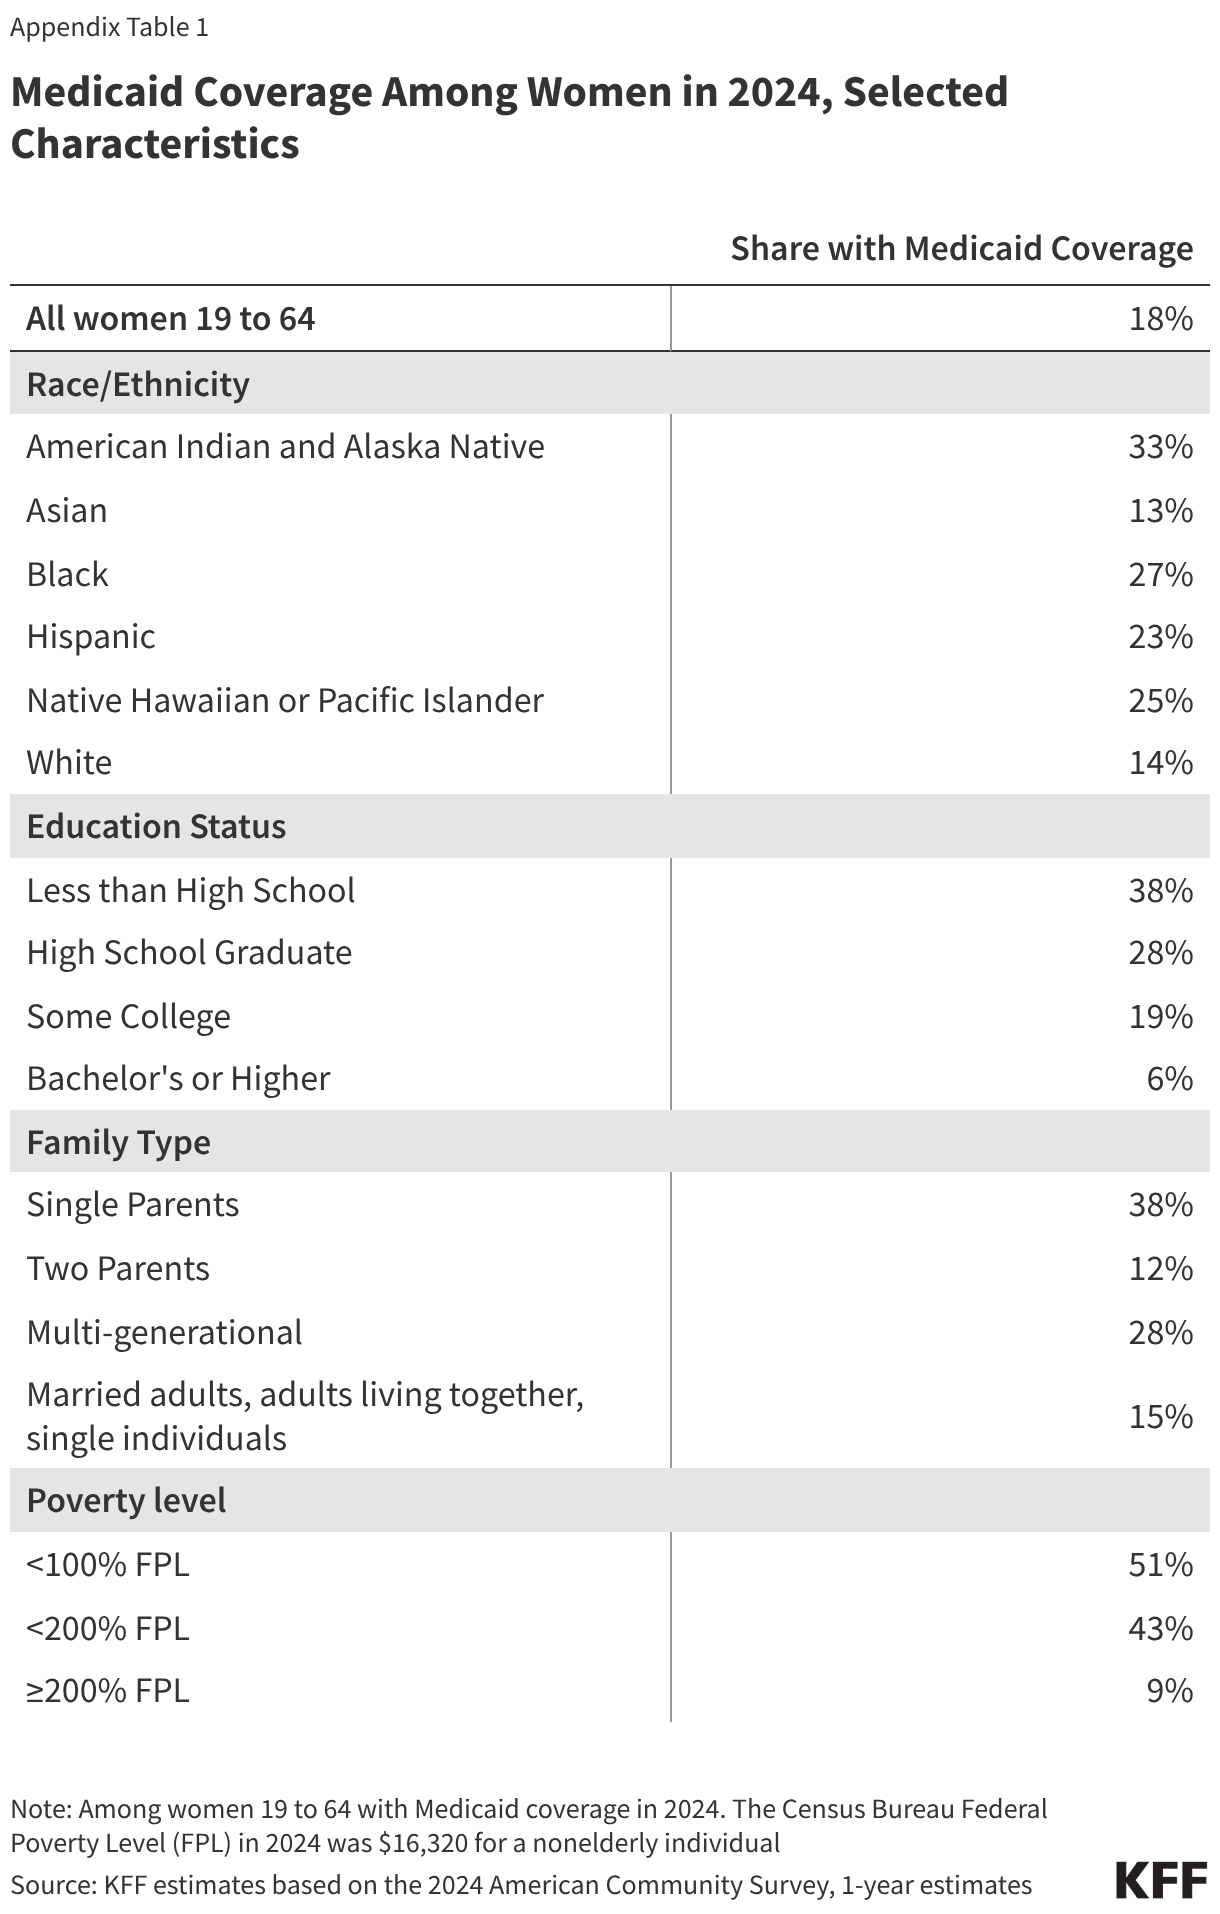
  • In 2024, Medicaid covered 18% of adult women ages 19 to 64 in the United States, but coverage rates were higher among certain groups, such as women of color, single mothers, low-income women, and women who have not completed a high school education (Figure 2).  
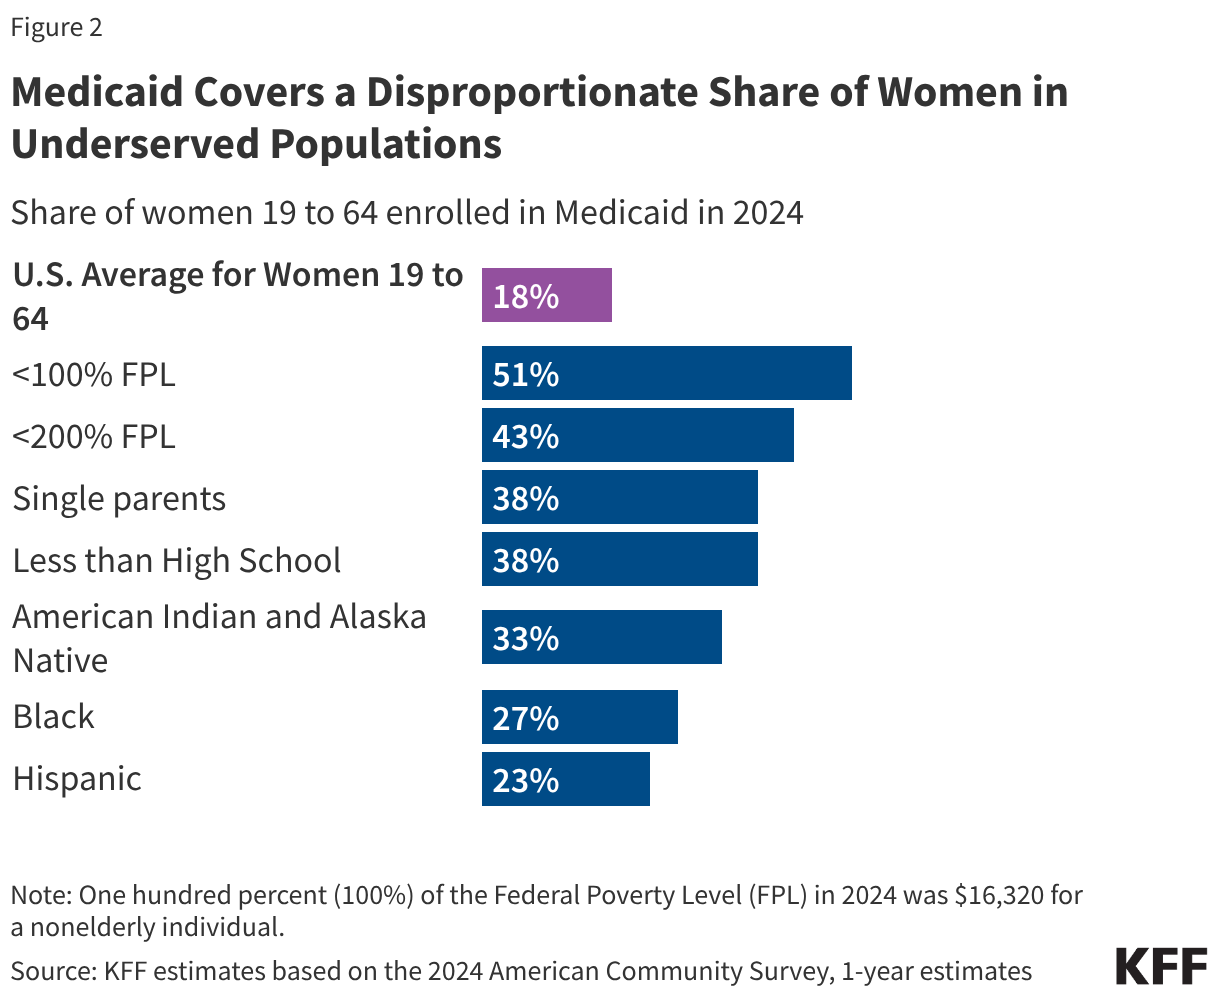
Bar chart showing the share of women ages 19 to 64 who are covered by Medicaid across various selected subgroups. Higher shares of women with lower incomes, single moms, and women of color are covered by Medicaid compared to the national average.
  • Differences in Medicaid eligibility levels and poverty rates across the states translate into vastly different Medicaid coverage rates for women across states, from a low of 9% in Utah and Texas to 32% in New Mexico (Figure 3).  
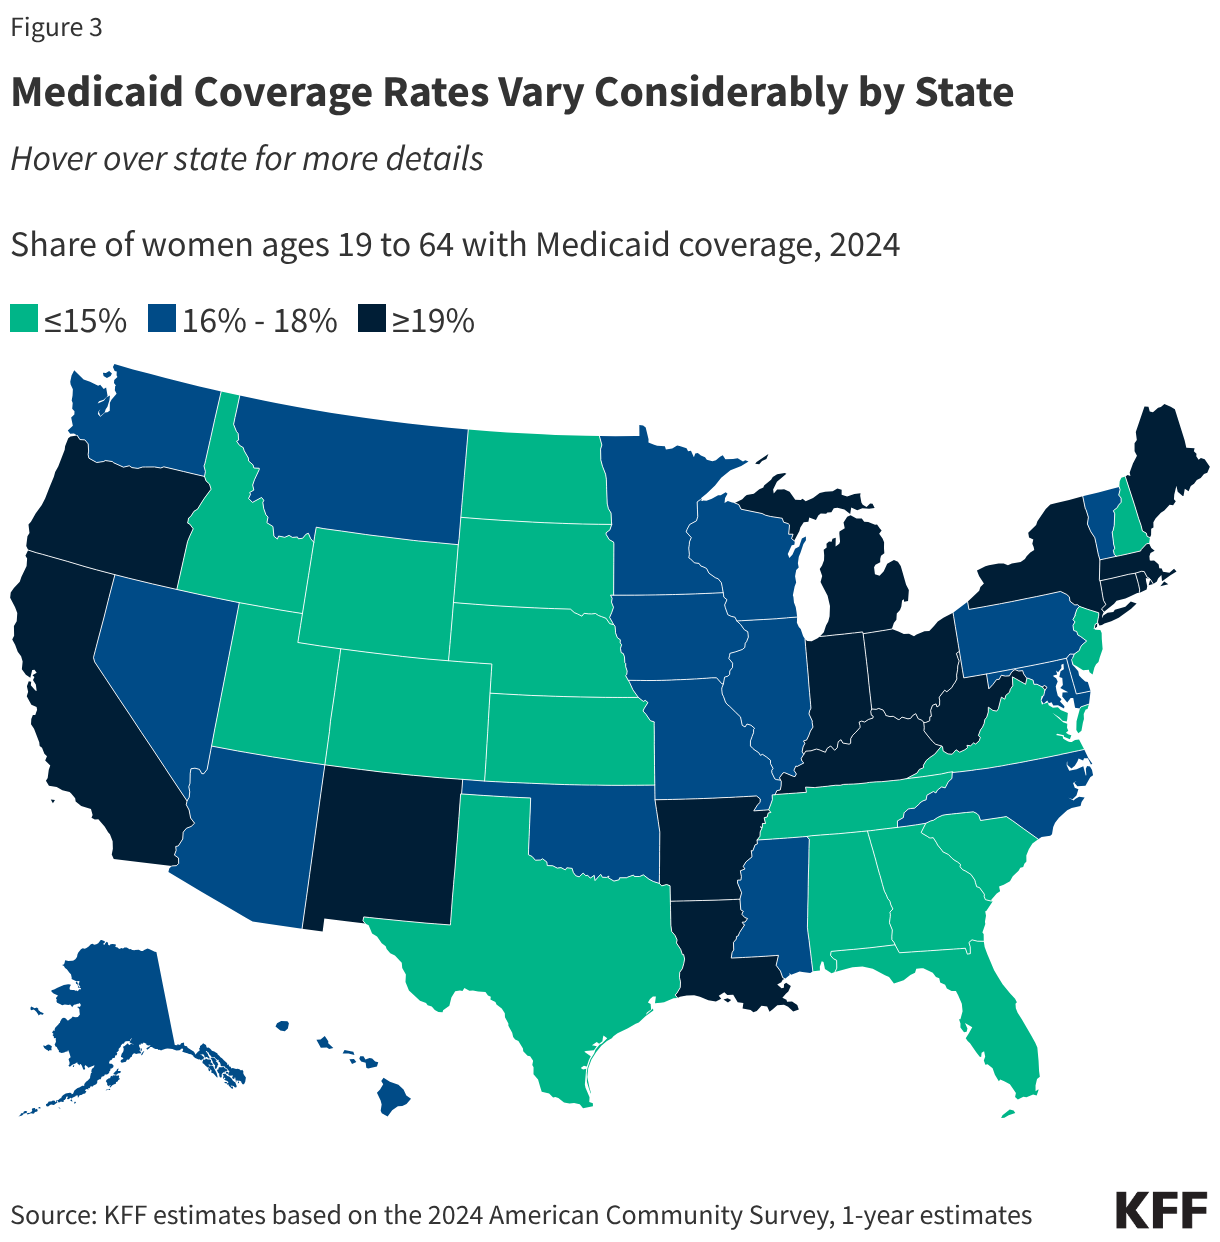
This map of the United States shows that Medicaid coverage among women ages 19 to 64 varies considerably across states. Coverage is highest in many states in the Northeast, Midwest, and West, while lower coverage is more common across parts of the South and Mountain West.

Adult women of reproductive age (19 to 49) comprise a quarter (24%) of the Medicaid population (Figure 1). Medicaid covers a wide range of reproductive health care services, including family planning, and pregnancy-related care including prenatal services, childbirth, and postpartum care—all without cost-sharing. Medicaid coverage of abortion services, however, is very limited under federal law and in most states.  

Family Planning 

Federal law requires state Medicaid programs to offer family planning benefits, but states determine the specific services and supplies for those who qualify through pre-ACA pathways. For the ACA expansion populations, the ACA requires states to cover all FDA approved, granted, and cleared  contraceptive methods, counseling on STIs and HIV, and screening for breast and cervical cancers. Research has found that most states have aligned their benefits and cover these services across all eligibility groups.  

  • The federal government pays 90% of costs for family planning services, a higher federal matching rate than for other services (typically between 50% and 78%). Women covered by Medicaid cannot be charged any out-of-pocket costs for family planning services. 
  • Federal law states that Medicaid beneficiaries have “free choice of provider,” which allows them to seek care from any qualified participating provider that offers the services. However, contrary to longstanding interpretation of the free choice of provider clause, a 2025 Supreme Court ruling, Medina v. Planned Parenthood South Atlantic, allows state Medicaid programs to disqualify clinics from participating in their networks if they offer abortion care in addition to other medical services. As of June 2026, at least seven states (AR, MO, MS, NE, OK, SC, and TX) have bans on Planned Parenthood’s participation in Medicaid, and several other states have proposed similar policies. Nationally, one in ten (10%) reproductive age women covered by Medicaid who received family planning services got their care at a Planned Parenthood clinic in 2023.
  • In addition to the Medina ruling, H.R.1 established a one-year ban on federal Medicaid reimbursements to Planned Parenthood in all states and some other reproductive health providers that provide abortion services. The policy was in effect from July 2025 to July 2026. While this rule expired, future legislation could be enacted by Congress to reinstate this funding ban.
  • Over half of states currently operate limited scope Medicaid family planning programs, which extend access to family planning services to uninsured women who do not qualify for full Medicaid coverage (often because their incomes exceed the Medicaid income thresholds).  

Maternity Care  

Medicaid is the largest single payer of pregnancy-related services, financing 40% of all U.S. births in 2024. In three states Medicaid covers more than 50% of all births. By federal law, all states provide Medicaid coverage without cost sharing for pregnancy-related services to pregnant people with incomes up to 138% of the federal poverty level (FPL), but many states extend eligibility to those at higher income levels. 

  • Similar to family planning, there is no federal definition of what services states must cover under their traditional Medicaid programs for pregnant women beyond inpatient and outpatient hospital care, but states that have expanded Medicaid eligibility must cover all preventive services recommended by the United States Preventive Services Task Force (USPSTF) to individuals who qualify through this pathway, which includes a broad range of pregnancy-related preventive services. Overall, most states cover a broad range of maternity care services, including prenatal screenings, folic acid supplements, and breastfeeding supports. States may not charge cost-sharing for any pregnancy-related services.
  • Historically, Medicaid coverage for pregnant people ended after 60 days. Due in part to the high rates of maternal mortality and morbidity in the United States and the disproportionately high rates of poor maternal outcomes experienced by Black and Native American pregnant people, there was a growing interest in expanding postpartum coverage beyond the 60 days. The federal American Rescue Act of 2021 gave states the option to extend postpartum coverage to pregnant people to a full year. To date, all states, with the exception of Arkansas, have extended postpartum coverage to 12 months.   
  • In the 10 states that have not expanded Medicaid coverage under the ACA, many women lose Medicaid eligibly after the postpartum period. This is because the income eligibility for pregnancy-related care is typically considerably higher than that offered to parents of dependent children. Eligibility levels for parents in the states that have not expanded Medicaid range from 15% FPL in Texas to 105% FPL in Tennessee (Figure 4). In the states that have expanded Medicaid eligibility, most women with Medicaid financed births are able to remain enrolled in the program and have continuous coverage beyond the postpartum period. 
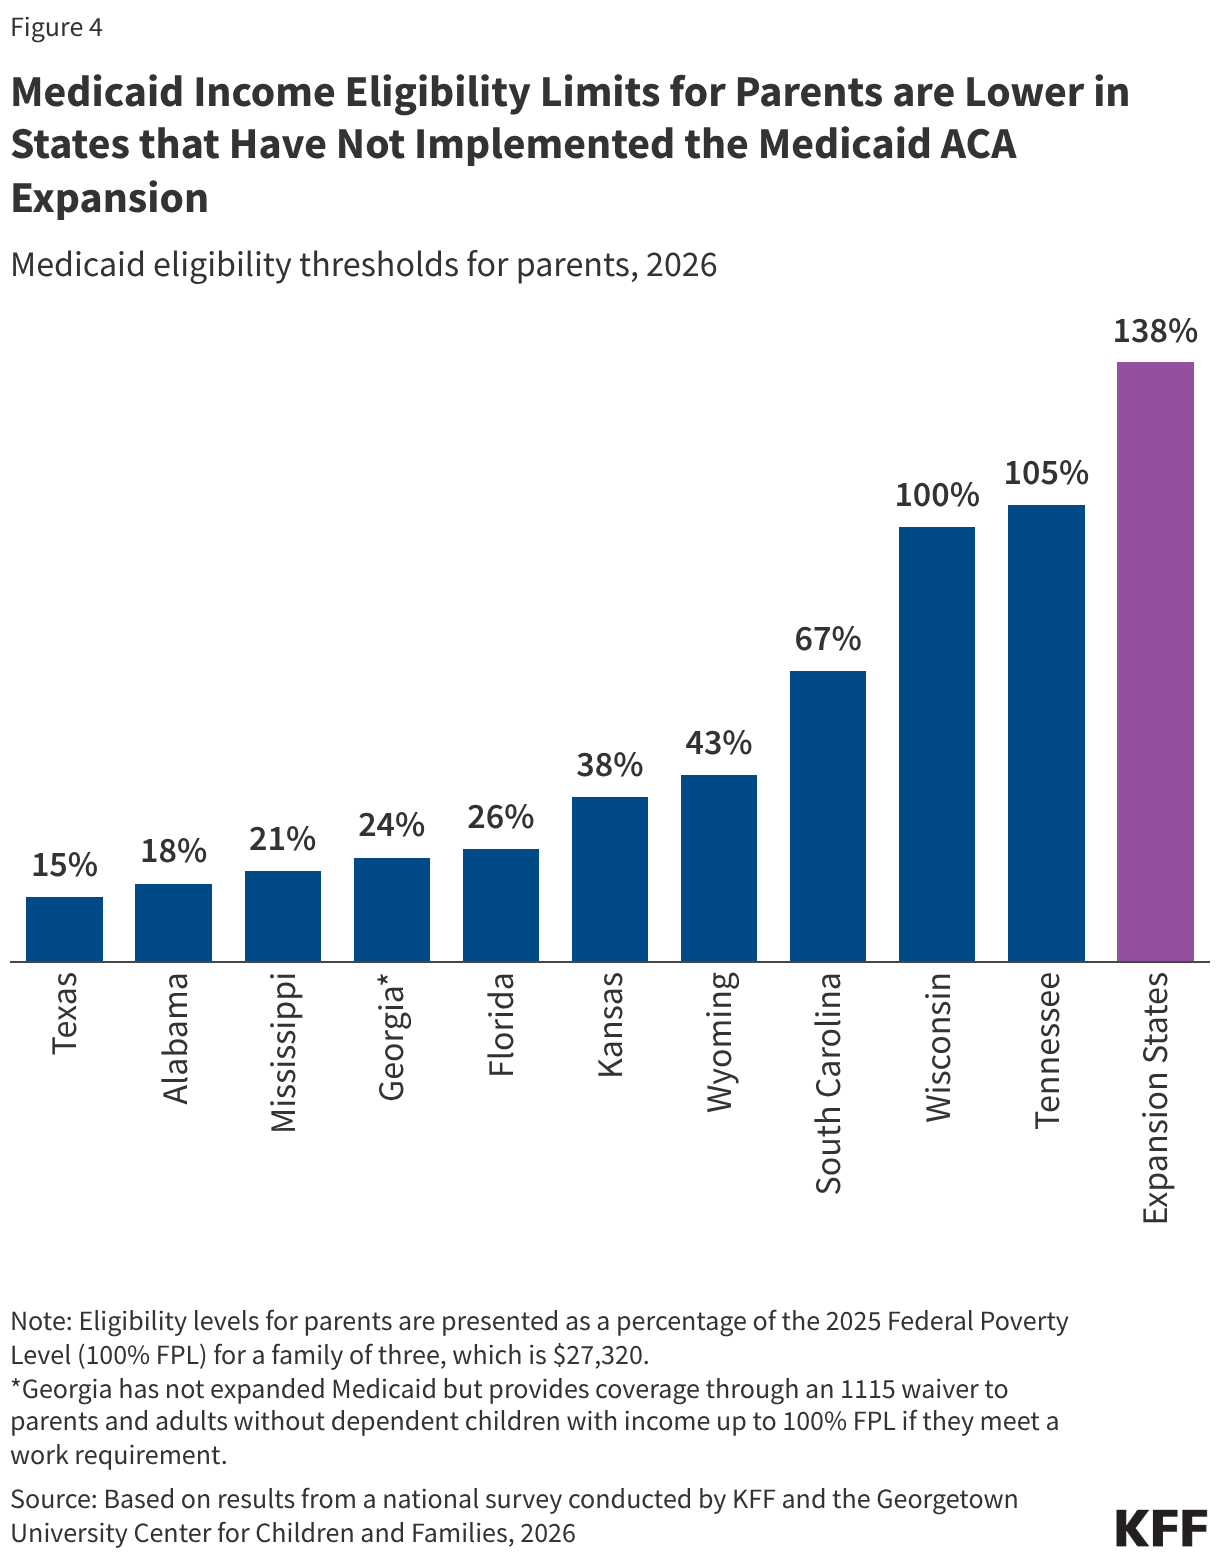
Column chart showing that Medicaid income eligibility limits for parents are much lower in states that have not expanded Medicaid compared to states that have expanded Medicaid.

Abortion  

While the 2022 Dobbs decision overturning Roe v. Wade eliminated federal protections and allowed states to ban or severely restrict the provision of abortion, abortion remains legal and available in many states. However, the federal Hyde Amendment prohibits federal spending on abortions in all states, except when the pregnancy is a result of rape or incest, or when it jeopardizes the life of the pregnant person (Figure 5). States may use their own unmatched funds to cover abortions in other circumstances. As of July 2026, 29 states (including the 13 states where abortion provision is currently banned) and DC follow Hyde restrictions and 21 states cover abortions for Medicaid beneficiaries that are considered to be “medically necessary” and pay for these using only state funds. Nearly half of women of reproductive age with Medicaid coverage live in a state that follows Hyde amendment standards or currently bans the provision of abortion. In cases when Medicaid finances abortions for Medicaid enrollees, reimbursement rates tend to be low and often do not cover the full cost of the procedure.
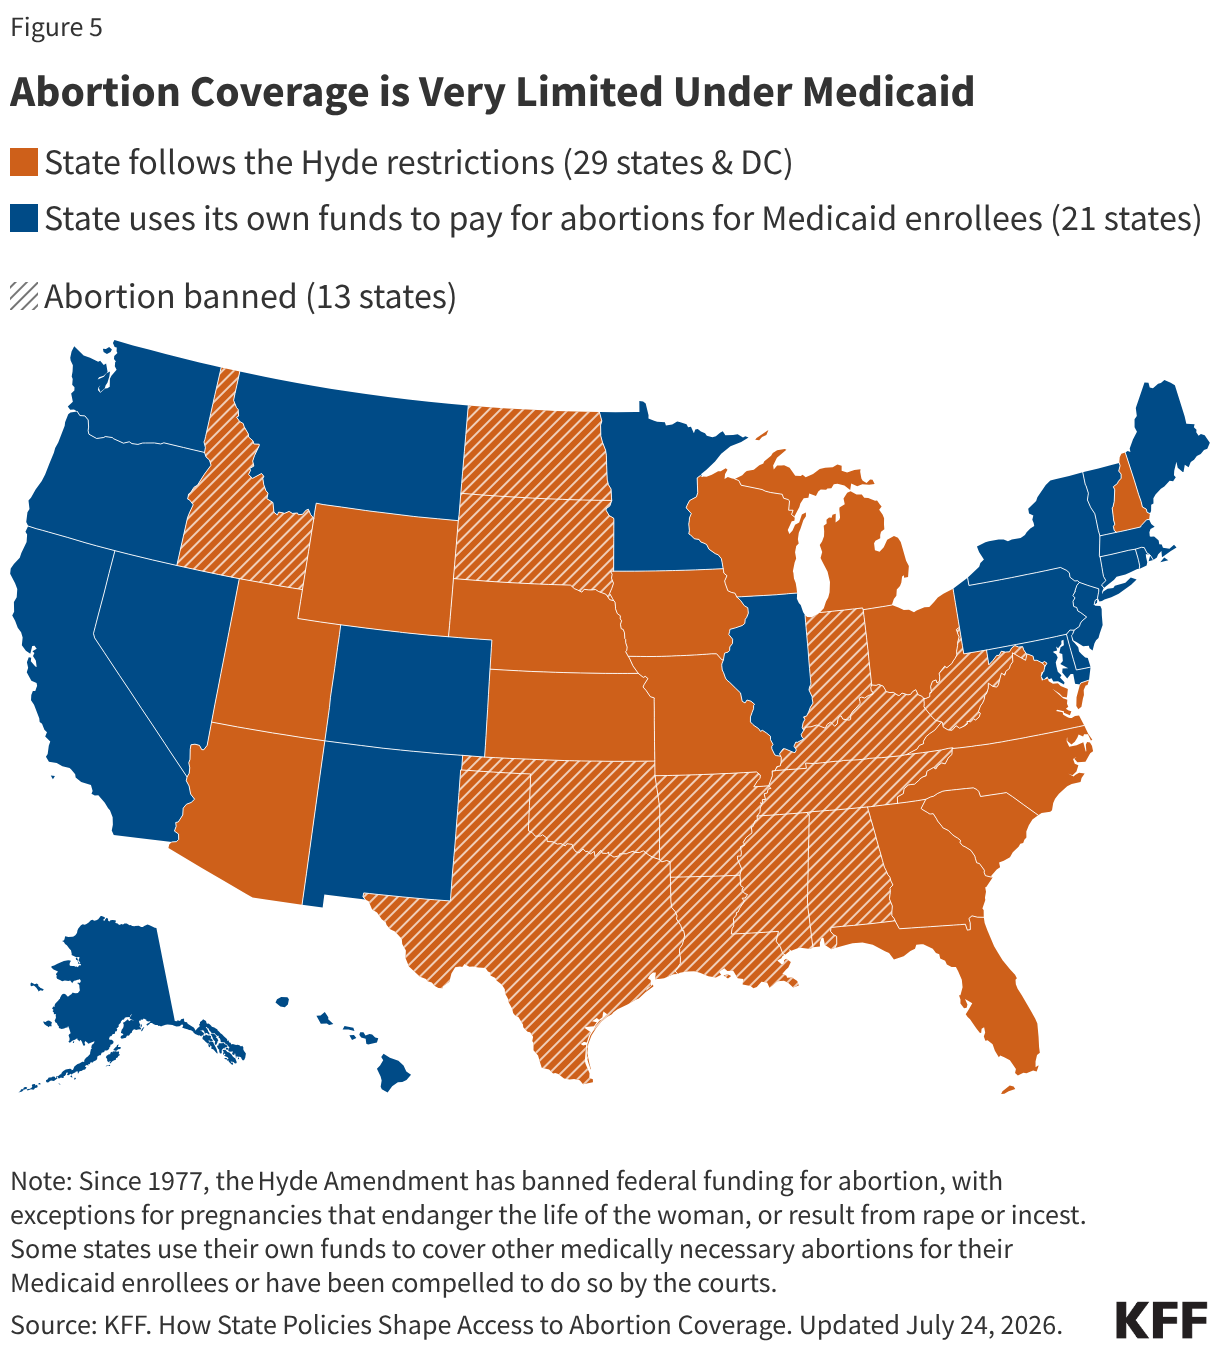
This map shows that Medicaid coverage for abortion is very limited across the U.S. The majority of states, including the 13 states where abortion provision is banned, follow the federal Hyde restrictions and only cover abortions when the pregnant person's life in danger or the pregnancy is the result of rape/incest. Twenty-one states use their own funds to pay for abortions for Medicaid enrollees.

As women age, their health needs generally shift from reproductive care to greater need for screening and management of chronic diseases, mental health care, and disability care (although many women in their reproductive years also have these health needs).  

Mental Health  

  • In 2024, Medicaid covered over one in four (27%) adult women with any mental illness and 31% of adult women with a serious mental illness. 
  • Medicaid’s behavioral health benefits include acute care services, long-term services and supports to enable people with chronic illness to receive community-based care. In addition, states with Medicaid expansion programs are required to cover 10 essential health benefits, which include mental health and substance use disorder services, including behavioral health treatment.  

Breast and Cervical Cancers 

  • Under the Breast and Cervical Cancer Prevention and Treatment Act, states may extend Medicaid coverage for cancer treatment to uninsured women diagnosed with breast or cervical cancer through a federal screening program and receive a federal match for those services. In 2023, 44,000 women were enrolled in Medicaid through the Breast and Cervical Cancer Program.  
  • Preventive services for breast and cervical cancers are required benefits in ACA Medicaid Expansion programs. States are required to cover mammograms and pap tests, genetic (BRCA) screening for high-risk women, and breast cancer preventive medication for high-risk women. Most states cover the screening tests for all beneficiaries. However, coverage for other services such as such as colposcopy following an abnormal pap result (which will be a required as a covered services under the HRSA Women’s Preventive Services  Guidelines effective January 2027) and genetic screening for women at higher risk of breast cancer is more uneven across state eligibility pathways.  

Disability, Aging and Long-Term Care

Women with Disabilities  

  • Medicaid covers four in ten (41%) nonelderly women who have a broad range of physical and mental disabilities, including physical impairments, severe mental illnesses, and specific conditions such as muscular dystrophy, cystic fibrosis, and HIV/AIDS (Figure 6).3 In addition, Medicaid also covers some nonelderly women who separately also qualify for Medicare coverage due to long-term disabilities (discussed below). 
  • Benefits that Medicaid covers include: assistance with medical and supportive services including rehabilitation, transportation, and therapeutic services, which help people with disabilities live independently and are not typically covered by private health insurance plans. Long-term services, including home health care, are another critical health benefit for women with disabilities that has very limited coverage through commercial plans but is covered by Medicaid.  
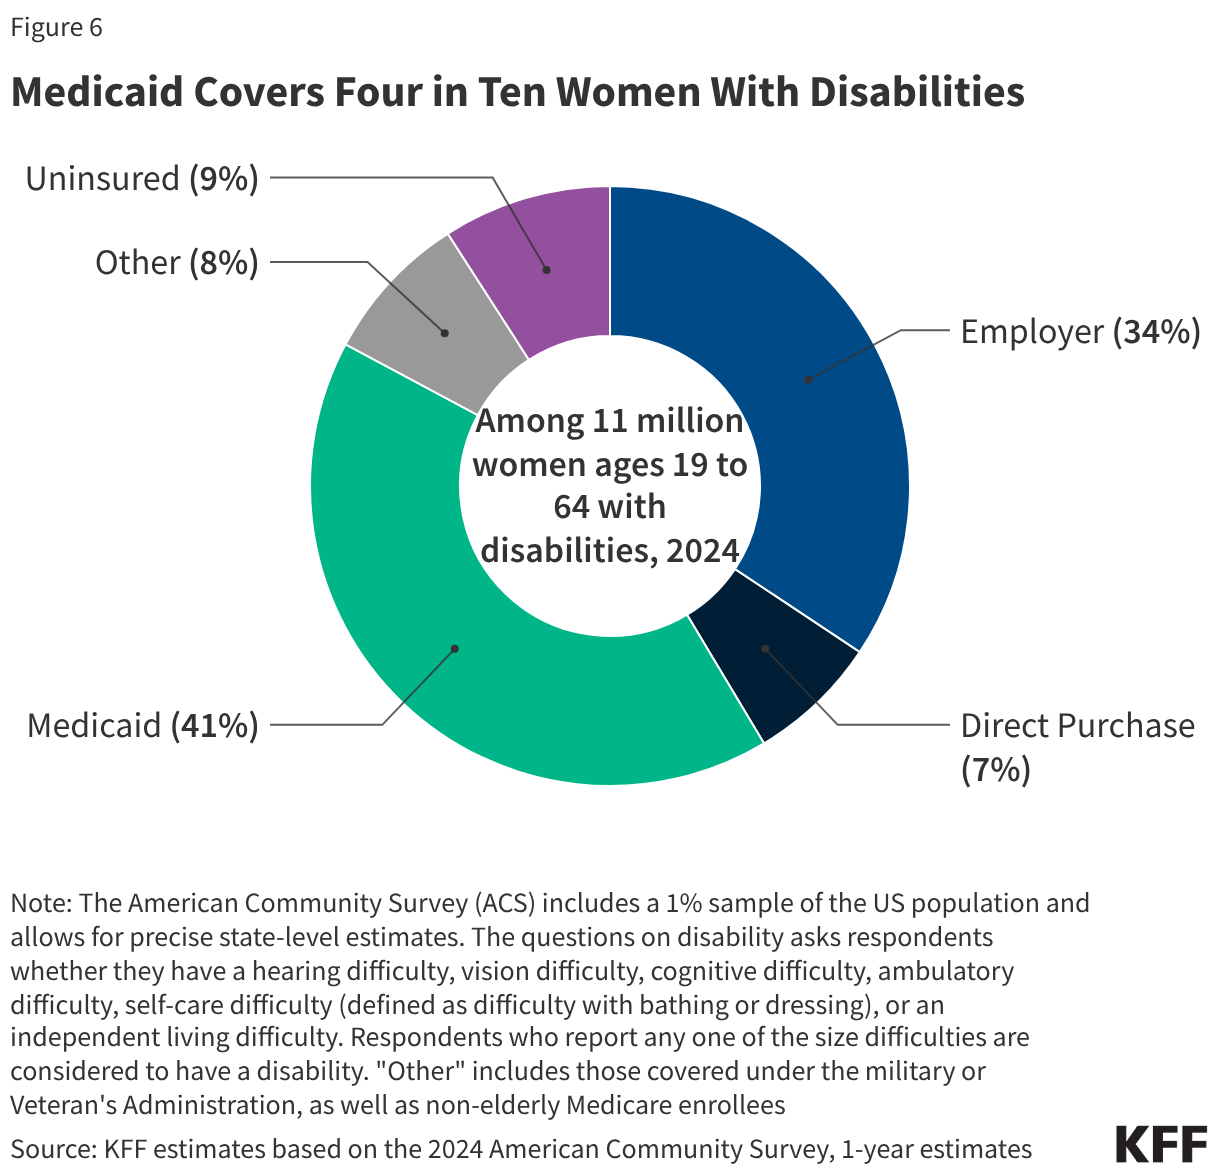
Pie showing health insurance coverage for women ages 19 to 64 with disabilities in 2024 in the U.S. Medicaid is a major source of coverage for women with disabilities, covering 41%, with another 34% getting coverage through employer-sponsored insurance.

Medicare-Medicaid Enrollees and Long-Term Care 

Medicare provides health coverage to people 65 and older and younger people with long-term disabilities. Medicaid provides coverage to approximately 12 million Medicare beneficiaries (20% of all Medicare beneficiaries) with low incomes and modest assets. These individuals are often referred to as “dually eligible beneficiaries,” and in 2023, women of all ages accounted for 60% of this group (Figure 7). Many of these beneficiaries have extensive and costly health needs.  

  • The majority of dually eligible beneficiaries qualify for full Medicaid benefits and may receive coverage for services that Medicare does not currently cover, such as dental and vision care, and long-term services and supports. Other dually eligible beneficiaries may only receive assistance with their Medicare premiums and/or cost sharing through the Medicare Savings Programs, but not full Medicaid benefits, if they meet an income and asset test. 
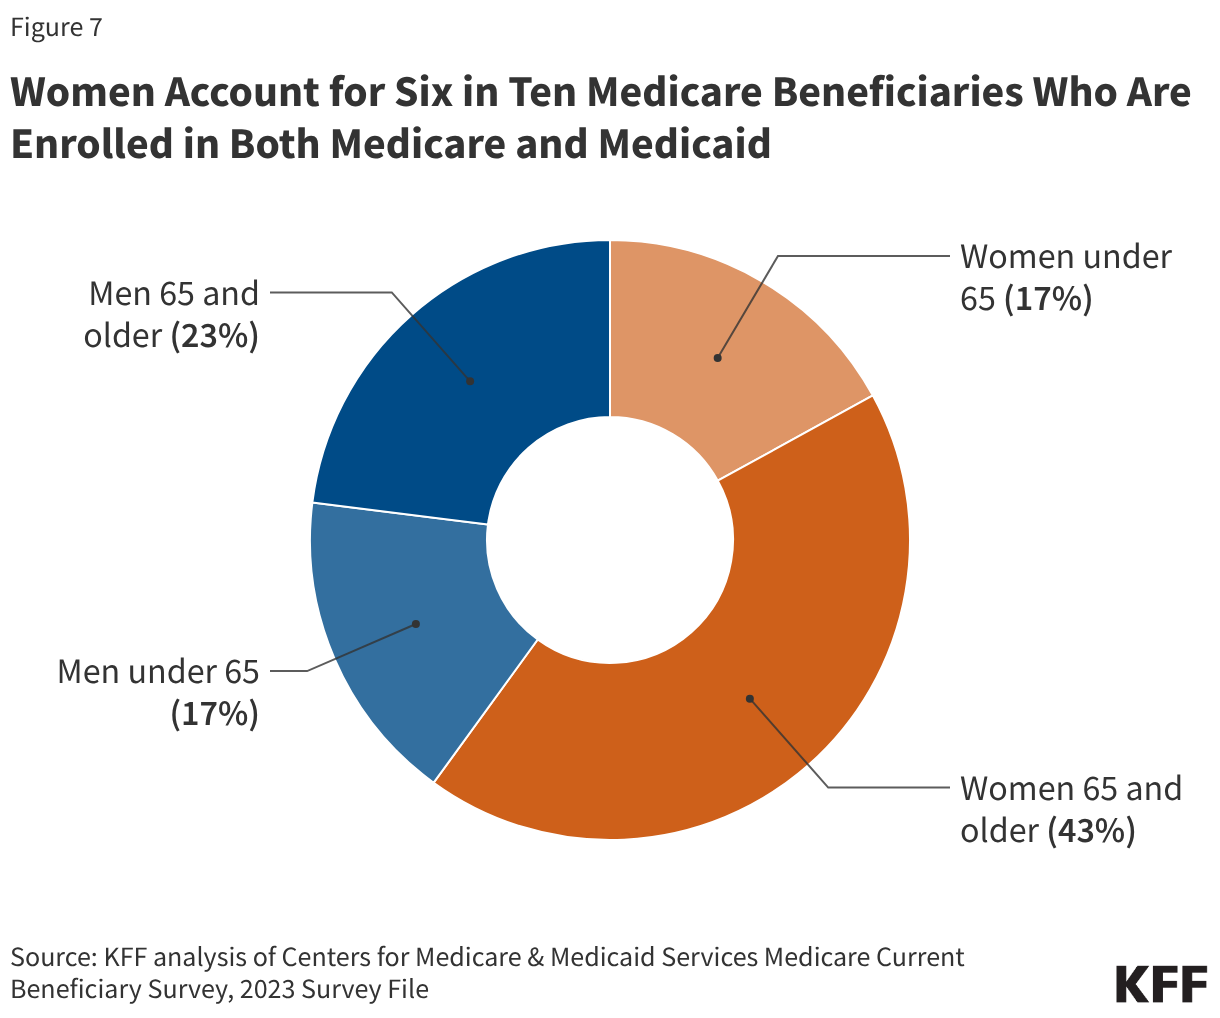
Women Account for Six in Ten Medicare Beneficiaries Who Are Enrolled in Both Medicare and Medicaid (Donut Chart)
  • Medicaid covers a continuum of long-term services and supports ranging from home care (HCBS) that allow persons to live independently in their own homes or in other community settings to institutional care provided in nursing facilities and intermediate care facilities for individuals with intellectual disabilities. In 2023, HCBS represented 64% of total Medicaid expenditures on long-term care (LTC).  
  • Since women are more likely to live longer and experience higher rates of chronic illness and disability than men, they are more likely to require long-term services in their lifetime. Approximately two-thirds of nursing home residents (61%) and people receiving home health care (60%) are women. Medicaid coverage provides access to these long-term services, which would otherwise be unaffordable for women with fixed incomes (in 2025, nursing home care averaged more than $114,975 annually for a semi-private room).  

Compared to their uninsured counterparts, women with Medicaid experience fewer barriers to care and on several measures have utilization rates comparable to low-income women with private insurance.  

  • Women covered by Medicaid use primary and preventive health services, such as pap smears and mammograms, at rates comparable to women with private insurance and at higher rates than uninsured women (Figure 8).  
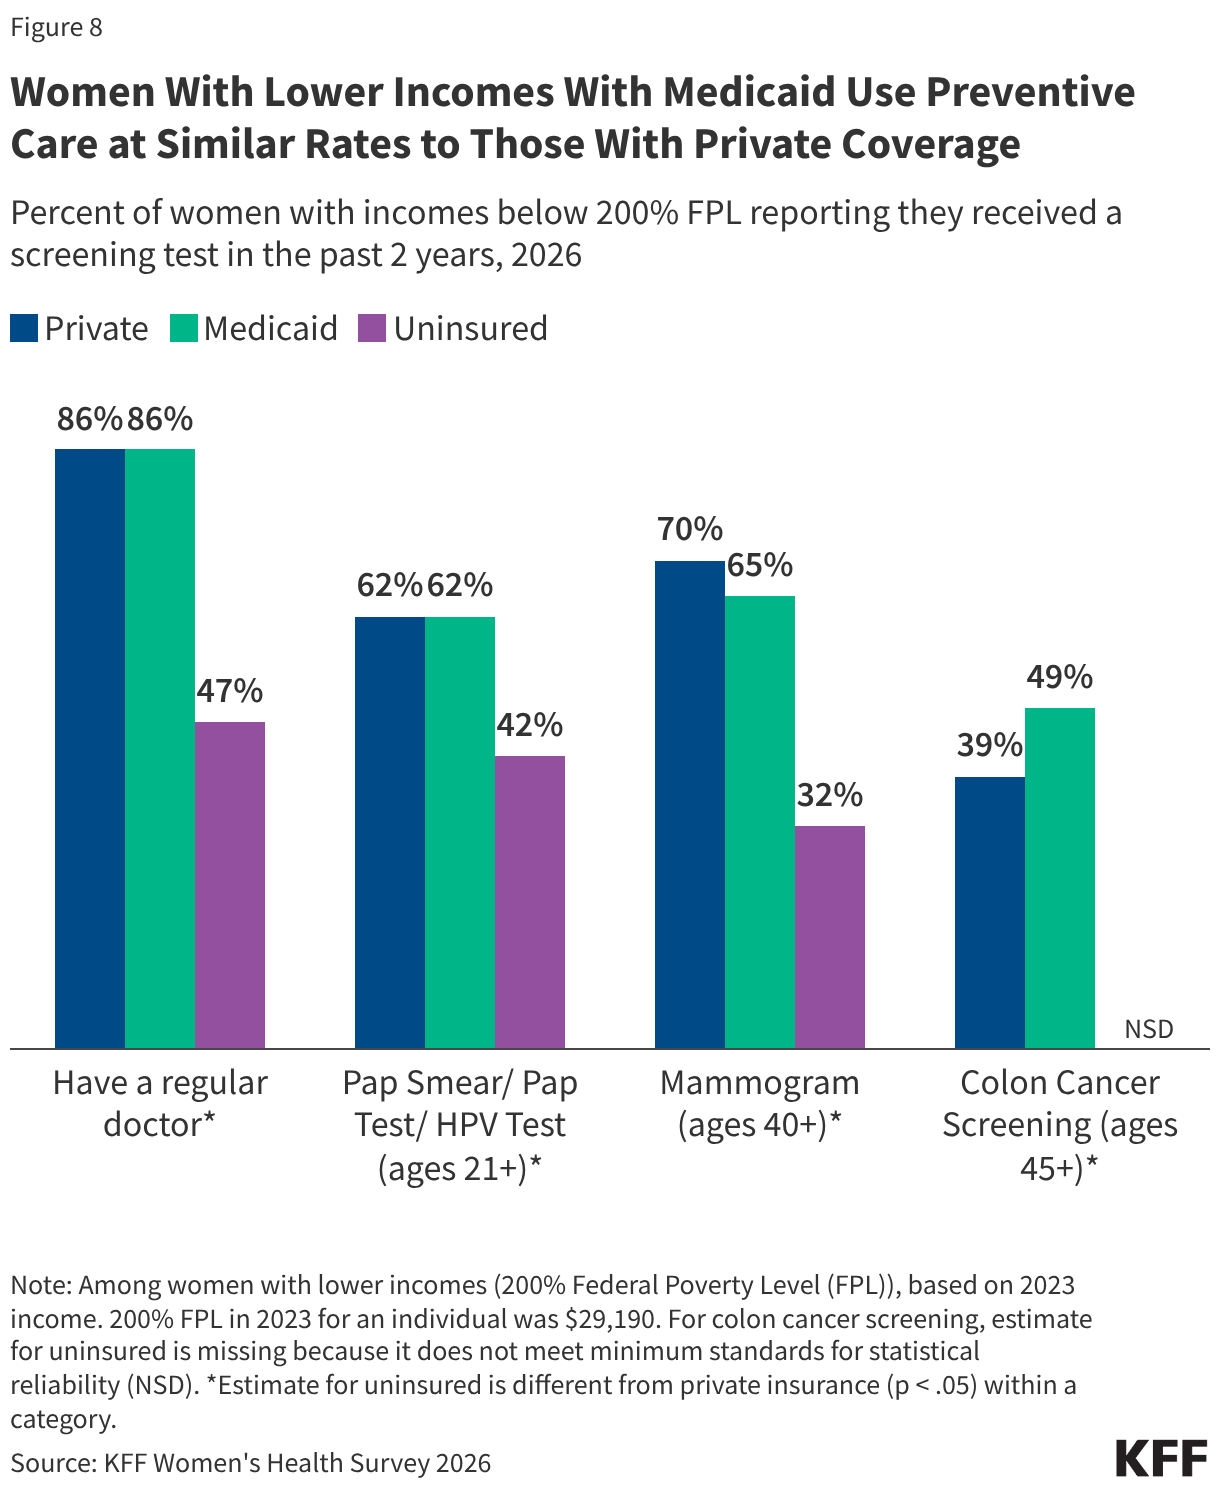
These grouped columns show that among lower-income women, those with Medicaid coverage are just as likely as women with private coverage to have a regular doctor and to receive Pap or HPV testing, and they report relatively high rates of mammograms and colon cancer screening. Uninsured women generally report lower rates of preventive care.
  • Women with Medicaid coverage are less likely than uninsured women to experience cost barriers. Compared to low-income women with private insurance, women on Medicaid were less likely to report that they delayed or went without care due to cost, likely attributable to the fact that Medicaid does not charge deductibles, rarely charges premiums and has only nominal cost-sharing. Affordability, however, is still a problem for some women in the program because they are typically low-income and have to pay out of pocket costs in states that impose caps on the number of covered visits or prescriptions or charge copayments for prescription drugs (for non-pregnant adults). Three in 10 low-income women on Medicaid report that they had not filled a prescription (31%) in the past year because of the cost (Figure 9).  
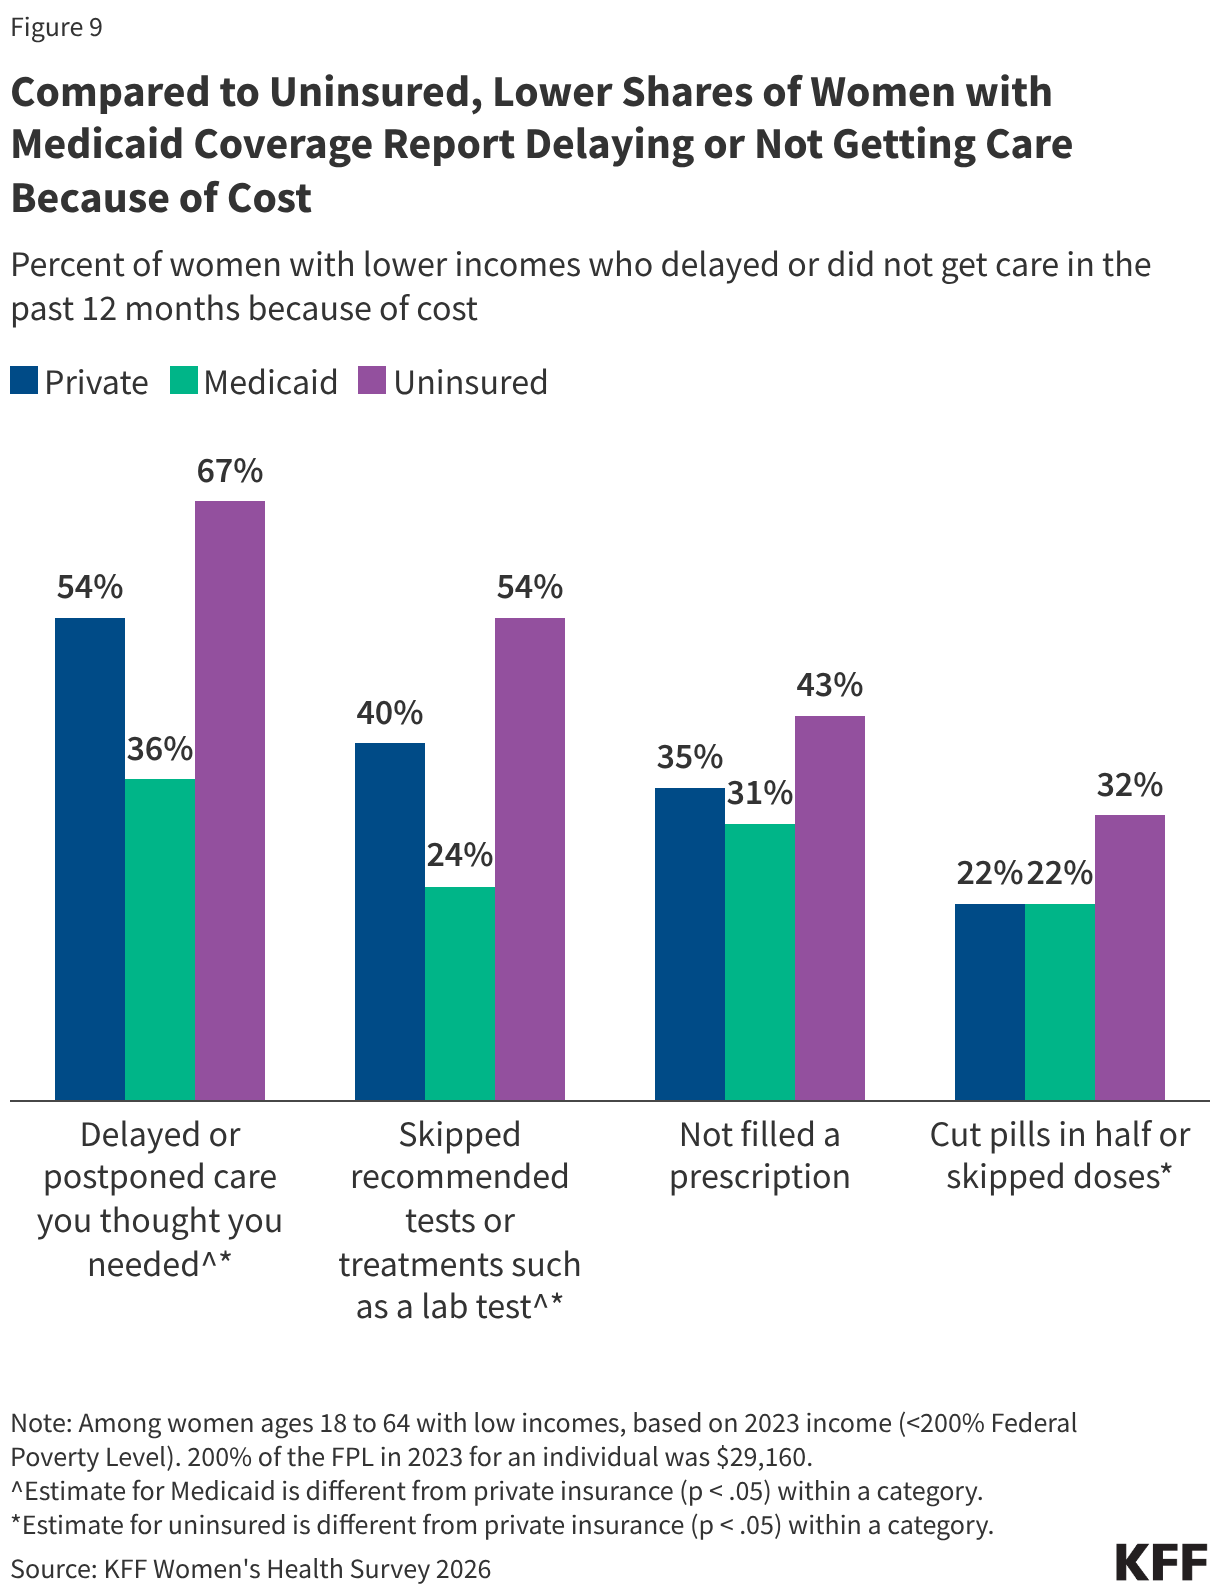
Grouped columns showing that among women with lower incomes ages 18 to 64, those with Medicaid coverage are less likely than uninsured women, and in some cases women with private coverage, to report delaying care, skipping recommended tests or treatments, or not filling prescriptions because of cost.
This table shows that Medicaid coverage among women ages 19 to 64 varies across racial and ethnic groups, education levels, family types, and income levels. Medicaid coverage is more common among women with lower incomes, those with less education, and single parents, as well as among American Indian and Alaska Native and Black women.
  1. KFF analysis of the T-MSIS Research Identifiable Files, 2023 (Preliminary) ↩︎
  2. KFF analysis of the T-MSIS Research Identifiable Files, 2023 (Preliminary) ↩︎
  3. KFF estimate based on the 2024 American Community Survey, 1-year estimates ↩︎

Availability of Rural Hospitals Providing Inpatient Maternity Care in Medicaid

Published: Aug 26, 2026

In recent years, concerns about access to maternity care in rural areas have grown as hundreds of rural hospitals have closed their obstetrics units. In 2023, approximately half of rural hospitals offered obstetrics services, and almost half of rural counties did not have a hospital offering obstetrics services. A lack of access to maternity care can lead to negative health outcomes, such as low birthweight and premature births, and increased maternal mortality. According to a Government Accountability Office study, difficulty recruiting and retaining providers and low Medicaid reimbursement rates are some of the biggest challenges to providing obstetric services in rural areas. Medicaid is a major payer of obstetrics care in rural communities, covering almost 1 in 4 rural women of reproductive age and financing nearly half of all births in rural communities.

Existing concerns for hospital-based rural maternity care access are expected to grow due to cuts to Medicaid in the 2025 reconciliation law that are projected to reduce spending in rural areas through changes to hospital supplemental payments and reduced Medicaid enrollment. Although increasing obstetric payments to hospitals has been a priority for many states over the past decade, changes from the reconciliation law could result in reduced Medicaid revenues for hospital services, including for rural hospitals that already have lower financial margins. While the temporary rural health fund included in the law allocates $50 billion over ten years to reduce the impact of the Medicaid cuts in rural areas, not all of it is directed to rural hospitals and, overall, it is not likely to offset the longer-term impacts of the cuts.  

Considering the existing challenges to hospital-based maternity care in rural areas and the potential for worsening trends, this brief analyzes the availability of hospitals providing inpatient maternity care in rural areas for Medicaid enrollees and illustrates how access to these services could be affected if additional rural hospitals were to close or eliminate those services. For the purposes of this data note, hospitals offering inpatient maternity care are defined as those that delivered 10 or more births in the year (see Methods).

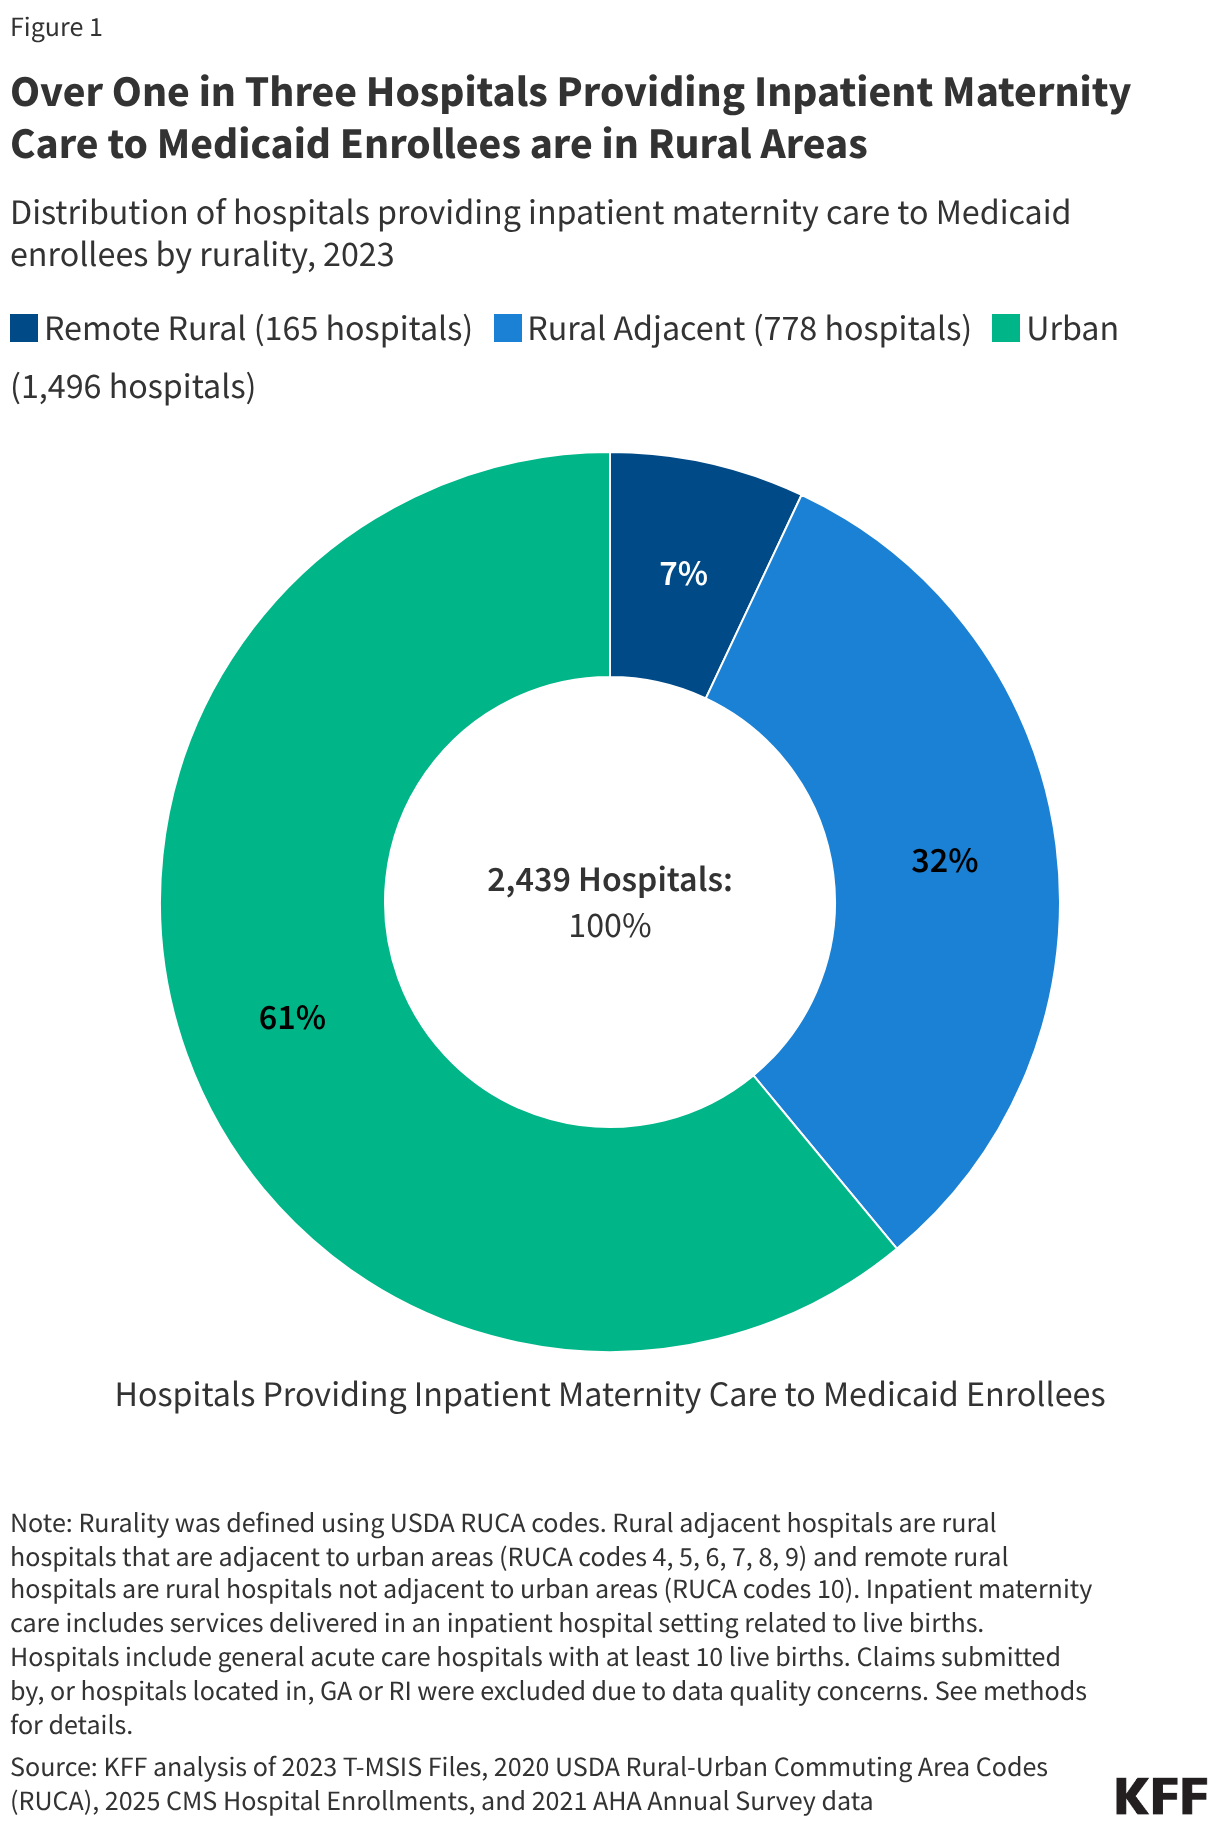
Over 1 in 3 hospitals providing inpatient maternity care to Medicaid enrollees are in rural areas.

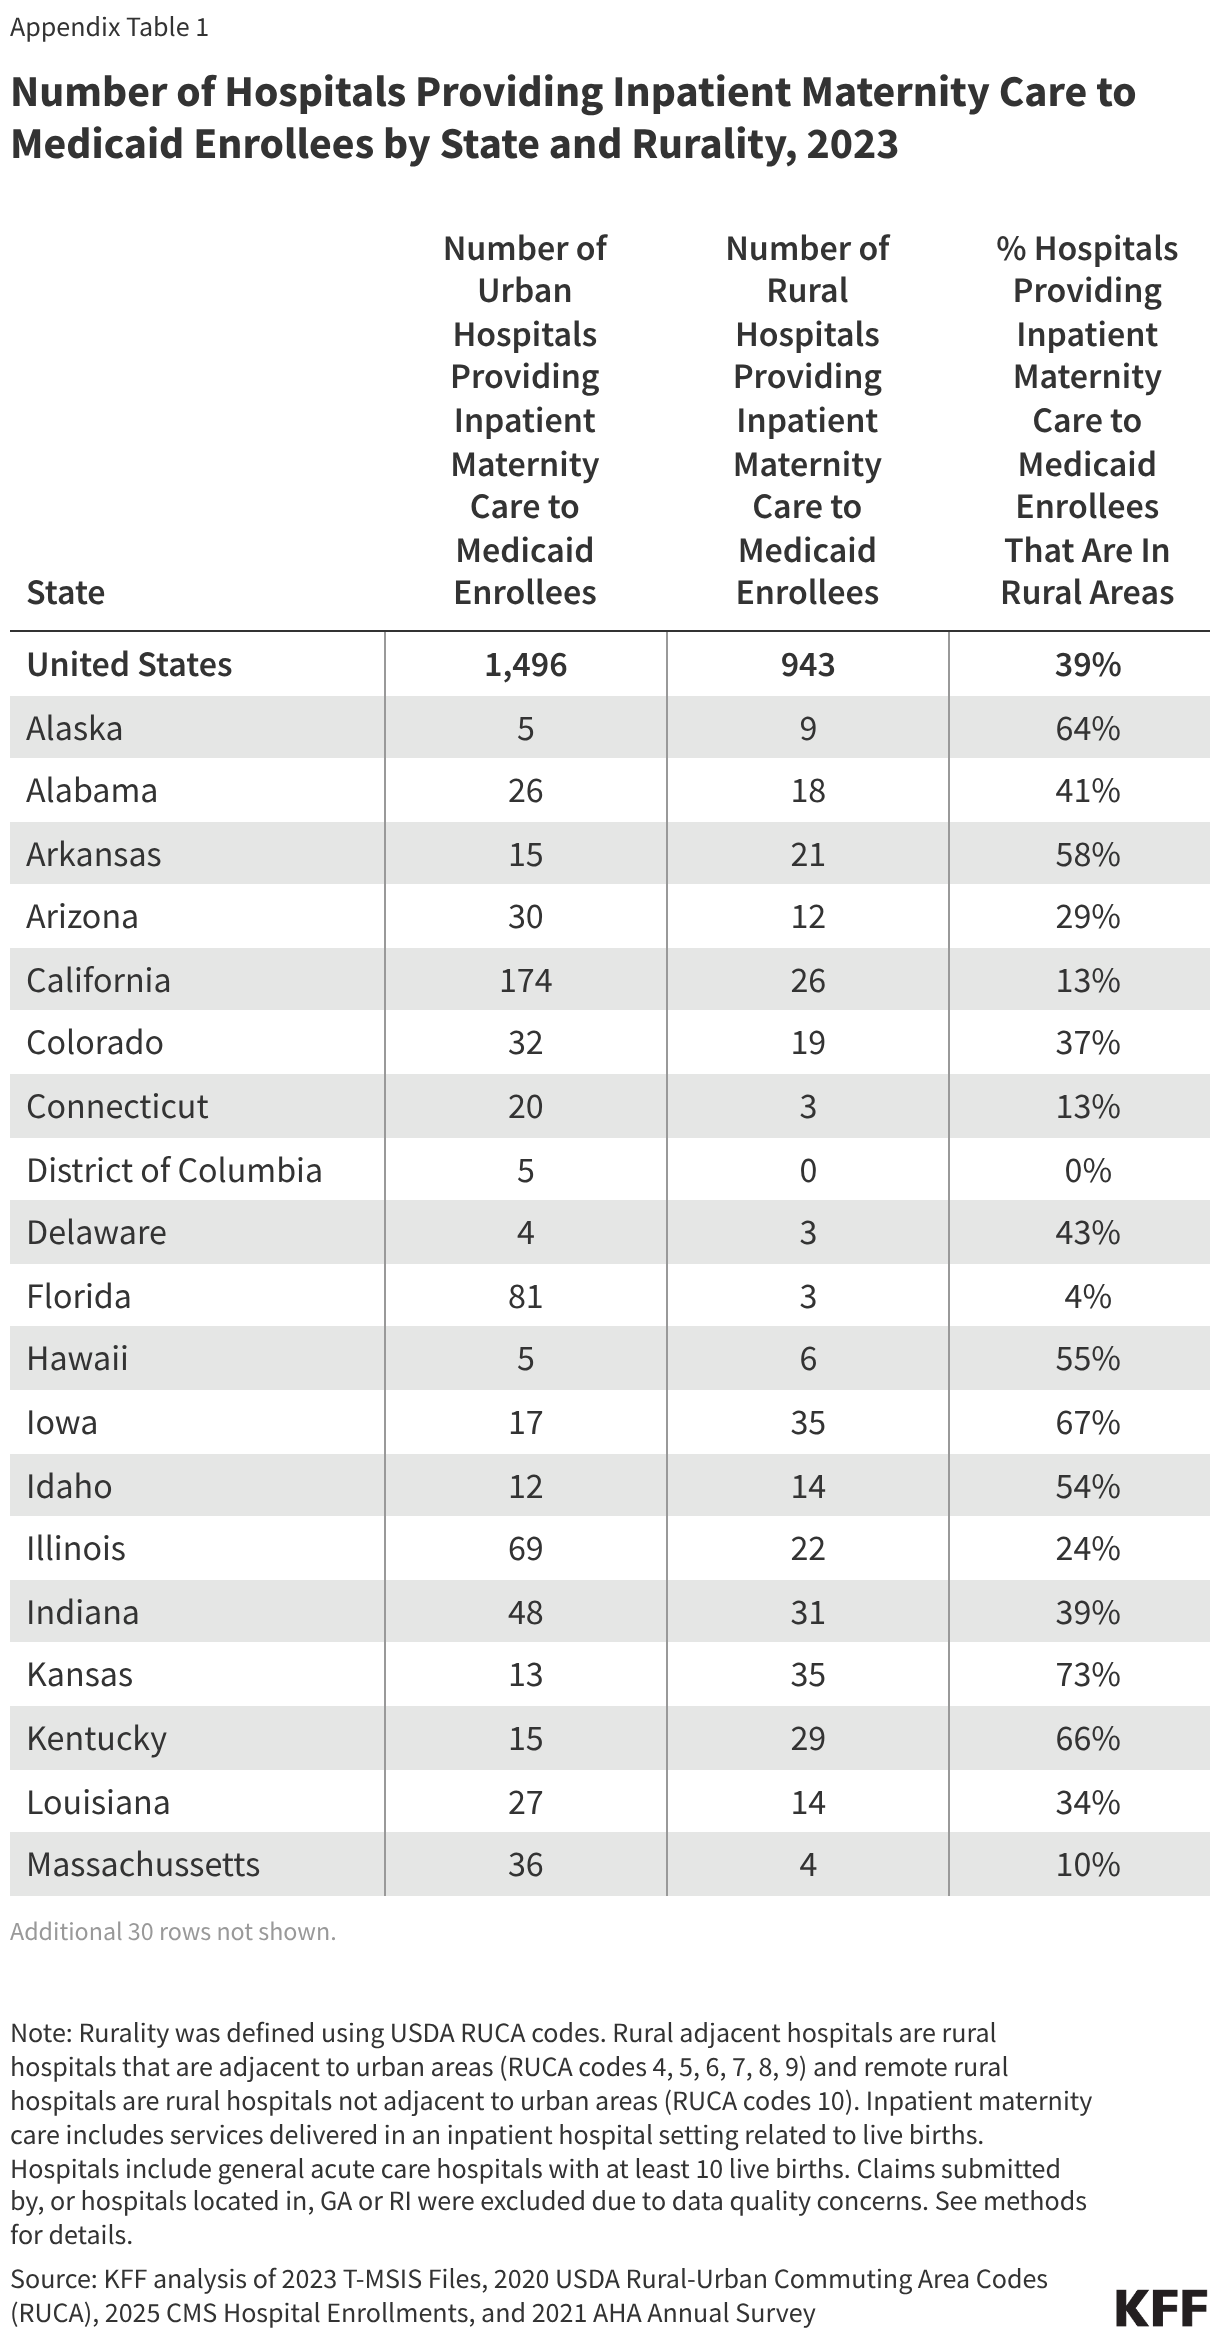
In 2023, 943 rural hospitals provided inpatient maternity care to Medicaid enrollees, constituting 39% of hospitals nationally providing inpatient maternity care to Medicaid enrollees. Rural hospitals that were adjacent to urban areas (rural adjacent) accounted for 778 (32%) hospitals, and the most rural hospitals (those not adjacent to urban areas, remote rural) accounted for 165 (7%) hospitals (Figure 1).

Over One in Three Hospitals Providing Inpatient Maternity Care to Medicaid Enrollees are in Rural Areas (Small multiple donut chart)

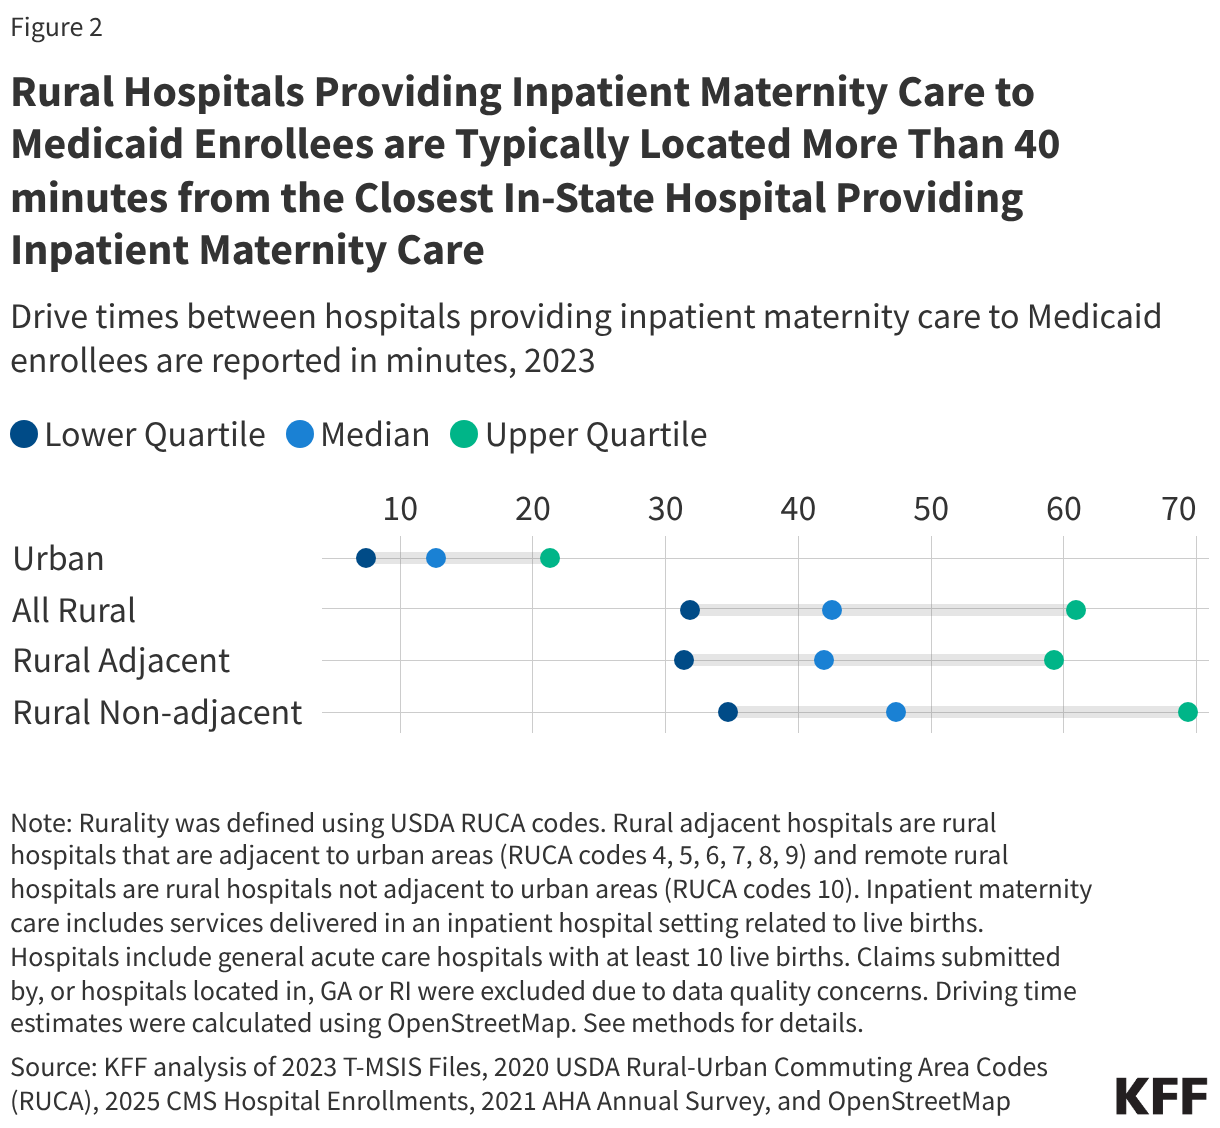
Rural hospitals providing inpatient maternity care to Medicaid enrollees are typically located more than 40 minutes from the closest in-state hospital providing inpatient maternity care.

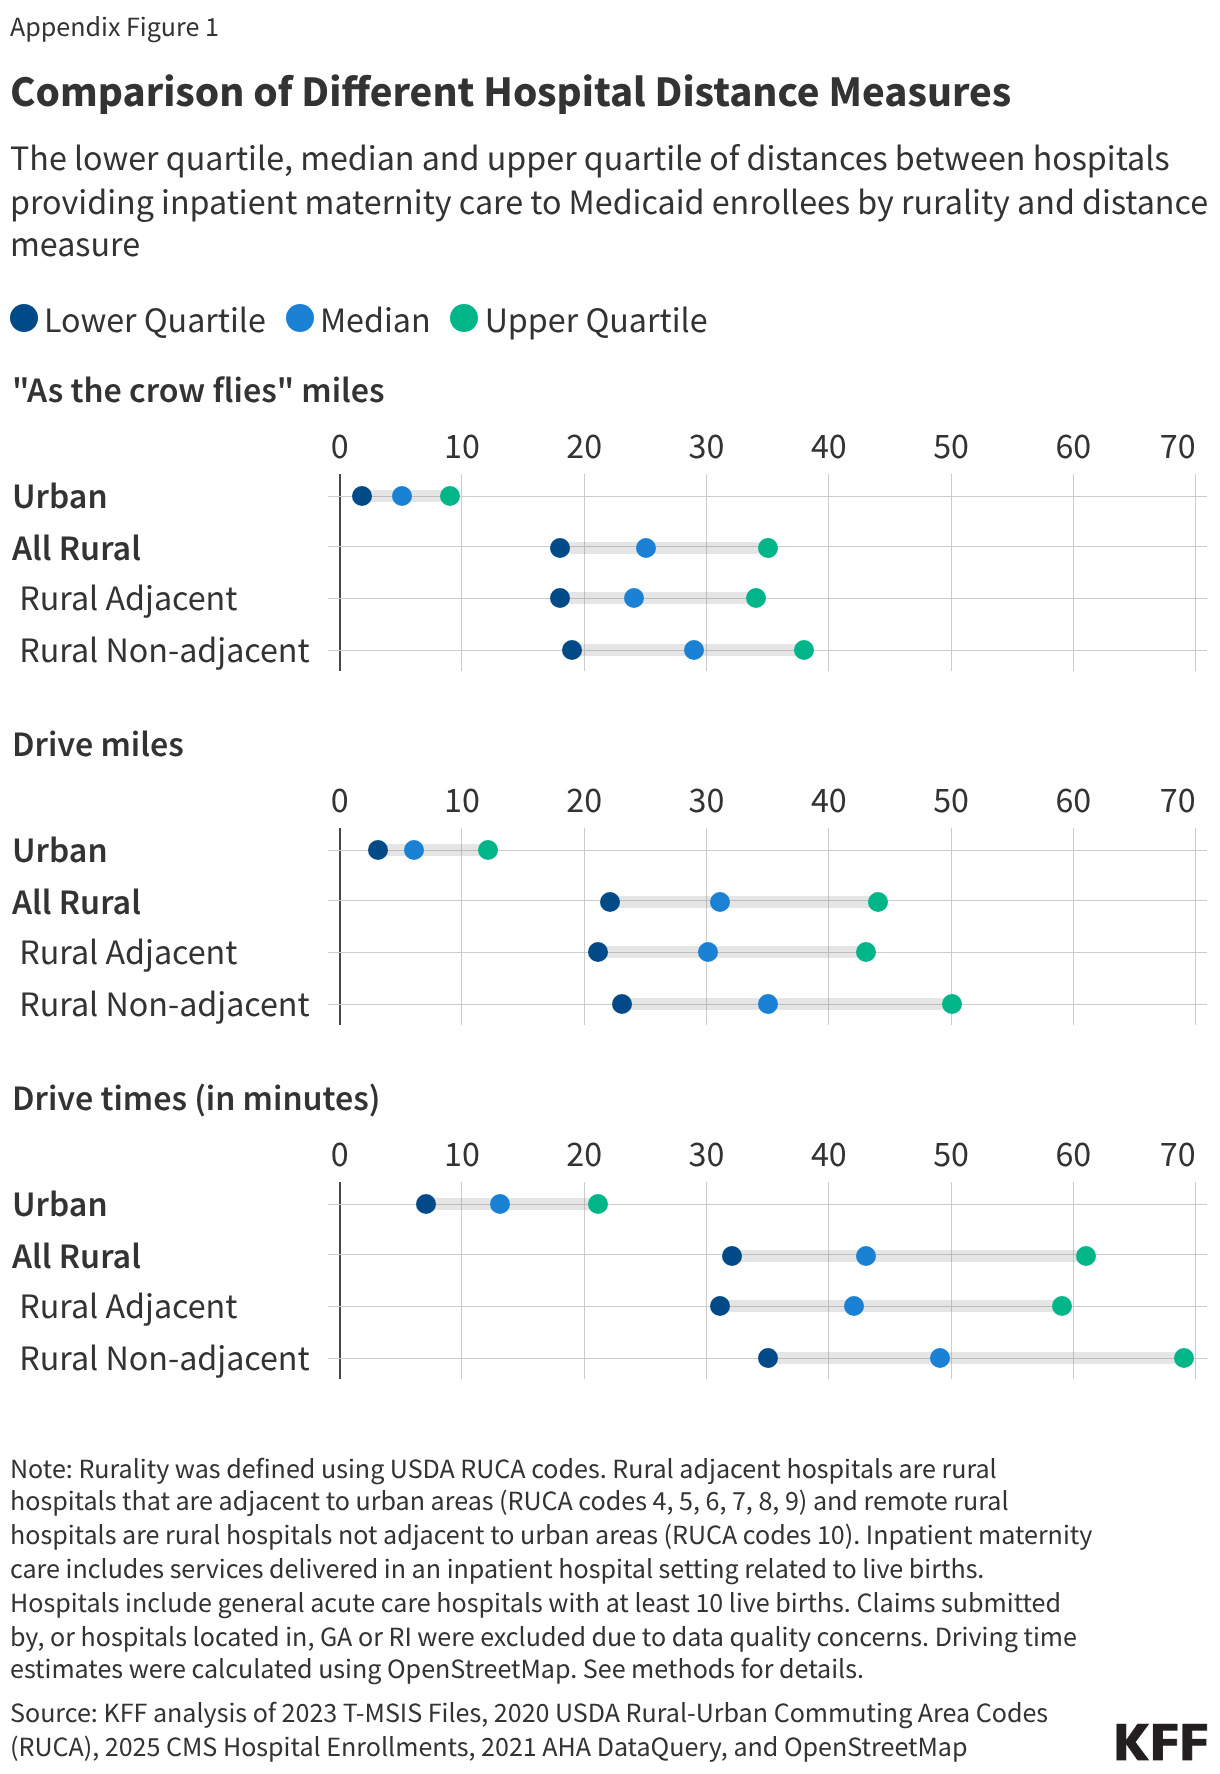
If a rural hospital closes, one measure of the effect on Medicaid enrollees is the amount of time it would take to drive to the nearest in-state hospital. The typical drive time between hospitals providing inpatient maternity care to Medicaid enrollees and their closest in-state neighbors is 43 minutes for rural hospitals compared with 13 minutes for urban hospitals (Figure 2). For 1 in 4 of these rural hospitals, the nearest in-state hospital that provided inpatient maternity care is at least one hour away (Figure 2). Distance to the nearest in-state hospital was calculated because most Medicaid enrollees obtain medical services within their state of residence, and though states have special processes for enrolling and paying out-of-state hospitals, seeing providers across state lines is challenging for enrollees (see Methods). The analysis uses driving time (in minutes) as a measure of distance between two hospitals because it accounts for traffic patterns between rural and urban areas, but results are similar when using other measures of distance (Appendix Figure 1).

Rural Hospitals Providing Inpatient Maternity Care to Medicaid Enrollees are Typically Located More Than 40 minutes from the Closest In-State Hospital Providing Inpatient Maternity  Care (Dot Plot)

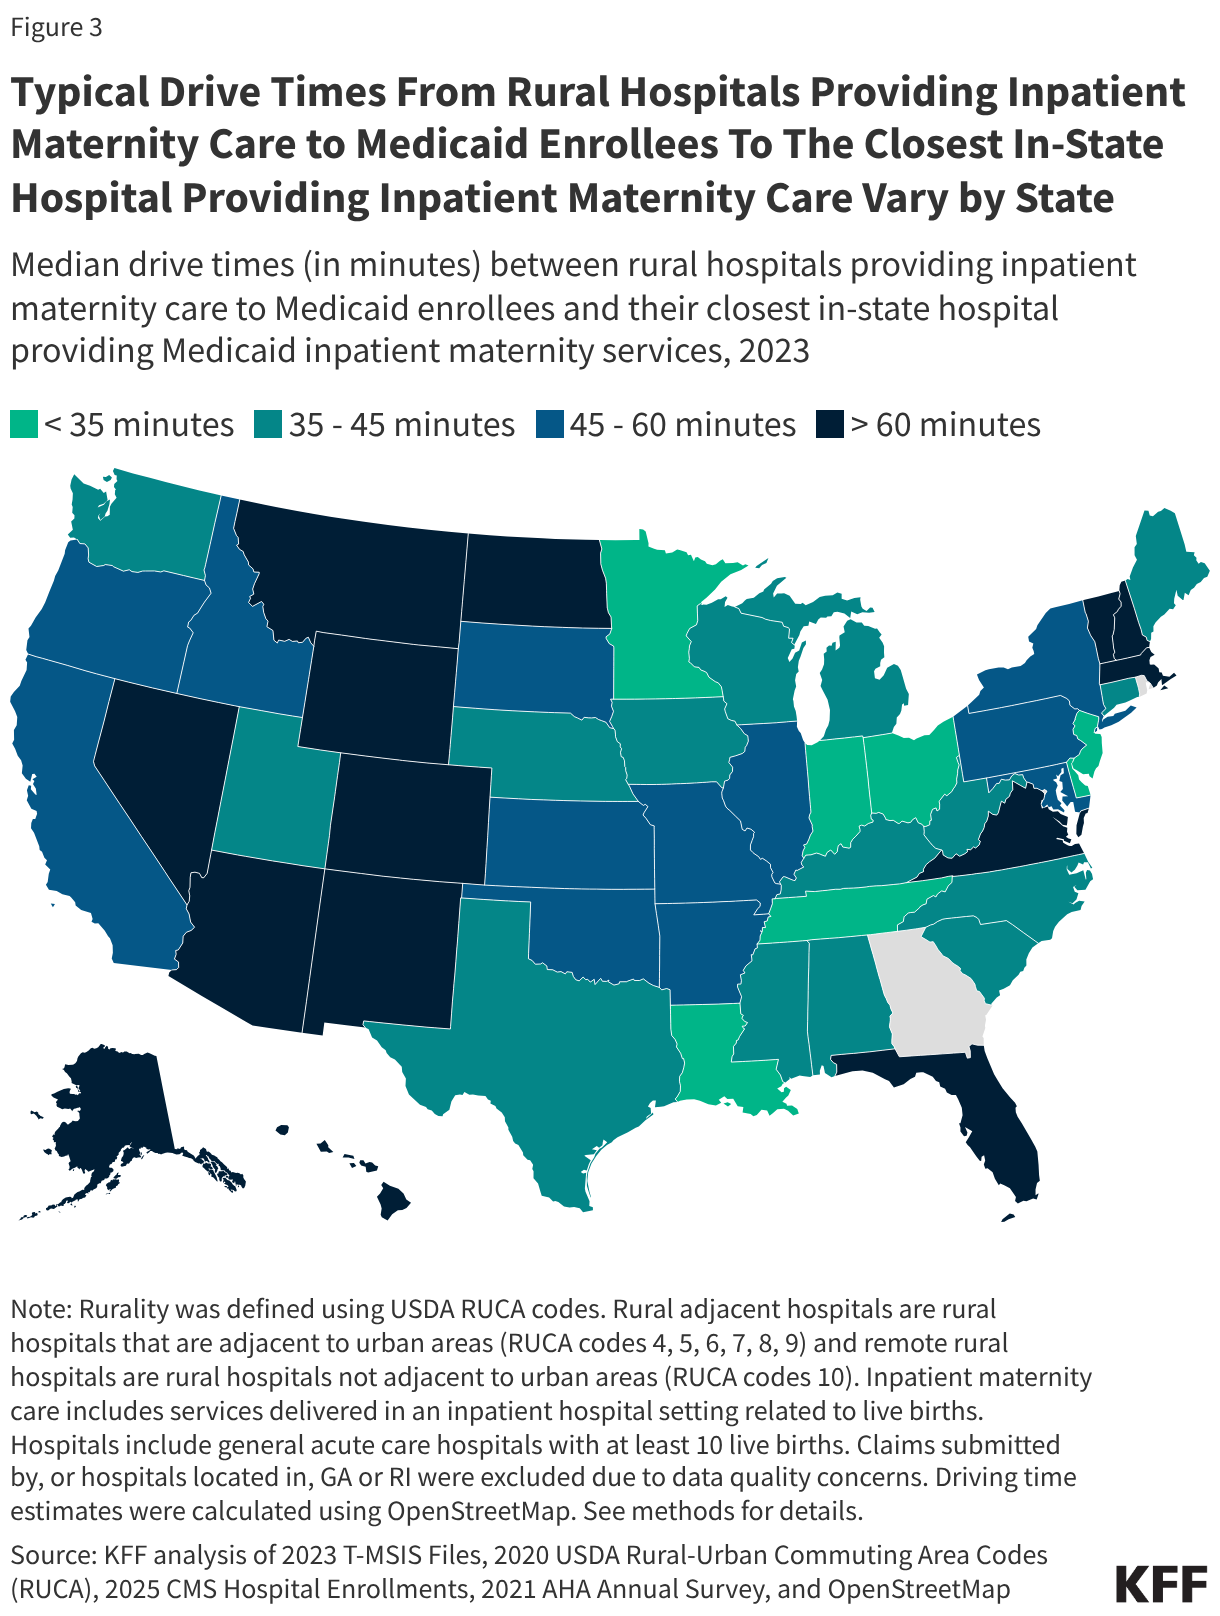
Typical drive times from rural hospitals providing inpatient maternity care to Medicaid enrollees to the closest in-state hospital providing inpatient maternity care vary by state.

In 14 states, the typical drive time from rural hospitals providing inpatient maternity care to Medicaid enrollees to their nearest in-state neighbor is one hour or more (Figure 3).The top three states with the longest typical driving times are Alaska, Nevada, and North Dakota. The states with the shortest drive times between their rural hospitals and another hospital providing inpatient maternity care to Medicaid enrollees are New Jersey, Louisiana, and Ohio.

Typical Drive Times From Rural Hospitals Providing Inpatient Maternity Care to Medicaid Enrollees To The Closest In-State Hospital Providing Inpatient Maternity Care Vary by State (Choropleth map)

Patrick Drake, an independent consultant, contributed to the analysis of driving time data.

Appendix
Comparison of Different Hospital Distance Measures (Dot Plot)
Number of Hospitals Providing Inpatient Maternity Care to Medicaid Enrollees by State and Rurality, 2023 (Table)

Methods

Data: This analysis uses data available from the 2023 Preliminary T-MSIS Research Identifiable Demographic-Eligibility and Claims Files. The Inpatient (IP) Header File was used to identify hospitals providing inpatient maternity care to Medicaid enrollees.

State Inclusion Criteria: To assess the usability of states’ data, four relevant quality assessments from the DQ Atlas were examined for IP claims file and billing provider completeness. KFF also evaluated usability based on the percentage of hospitals that merged with two external data sources used in the analysis for hospital addresses (CMS Hospital Enrollments and AHA Annual Survey data). The billing provider National Provider Identifier (NPI) is the primary hospital identifier in the claims data for this analysis (see more details under “Identifying Hospitals”). Below are the states that were excluded according to each criterion:

  • DQ Atlas Claims Volume – IP: No states excluded
  • DQ Atlas Service Users – IP: No states excluded
  • DQ Atlas Billing Provider NPI – IP: Georgia was deemed “unusable” for this assessment and excluded. Approximately 81% of its IP Header claims were missing a billing provider NPI.
  • DQ Atlas Billing Provider Type, Specialty, and Taxonomy – IP: No states excluded
  • KFF state-level merge rates to CMS Hospital Enrollments and AHA Annual Survey data: Rhode Island was excluded. Approximately 44% of its IP Header claims were unable to merge onto either the CMS Hospital Enrollments or the AHA Annual Survey data, and thus hospital address could not be determined (other states, except Georgia, had 15% or less of their claims unable to merge).

Identifying Inpatient Maternity Care: A hospital was identified as providing “inpatient maternity care” when it provided 10 or more live births to Medicaid enrollees, following other studies on obstetric care access in rural areas. Diagnosis and procedure codes in the T-MSIS inpatient header claims files were used to identify live birth codes from the Office of Population Affairs’ published code lists for the Contraceptive Care Measures that are endorsed by CMS’ consensus-based entity. A list of diagnosis and procedure codes is available upon request.

Identifying Hospitals: Hospitals were identified in the claims data using billing provider NPI. According to DQ Atlas methodology, the billing provider in the IP file primarily represents the hospital where the inpatient care occurred.

Hospital address information: This analysis used data available from the 2025 CMS Hospital Enrollments (accessed in November 2025) and data available from FY2021 AHA Annual Survey (accessed in February 2023) to identify hospital addresses. The CMS Hospital Enrollments data set provides monthly enrollment information for all hospitals currently enrolled in Medicare and the AHA Annual Survey provides data from an annual survey of all hospitals in the U.S. and its associated areas. KFF used both sources to account for hospitals that may have closed between 2023 and 2025 or opened between 2021 and 2023 (2023 was the most current year of T-MSIS data at the time of analysis).

The analysis used these external sources rather than the T-MSIS Annual Provider File (APR) because of concerns regarding data quality in the APR file. Technical documentation for the APR suggests that users may want to use the NPI to link to external data sources to obtain additional provider information, and other researchers have found provider legal name and address in the APR to be inconsistent.

Hospital exclusion criteria: Below is a list of criteria used to identify hospitals providing inpatient maternity care to Medicaid enrollees in the analysis. The number of unique NPIs and the number of IP Header claims that were kept after each step are reported.

Only hospitals identified as a general acute care hospital using National Plan and Provider Enumeration System (NPPES) taxonomy codes were included in the analysis because they are accessible to all Medicaid enrollees and treat a range of health care conditions. Hospital types that were excluded from the analysis include: chronic disease hospitals, long-term care hospitals, religious nonmedical health care institutions, psychiatric hospitals, rehabilitation hospitals and military hospitals.

Exclusion Criteria# of Unique Billing Provider NPIs Remaining# of IP Header Claims
Start: All unique billing provider NPIs/header claims in the IP file10,973 (100%)12,267,627 (100%)
Claims without a live birth diagnosis or procedure code3,132 (7,841 dropped)1,715,496 (10,552,131 dropped)
Submitting state for the claim is GA or RI (see “State Inclusion Criteria”)2,995 (137 dropped)1,648,650 (66,846 dropped)
Billing provider NPI is associated with a RI, GA or PR zip code2,953 (42 dropped)1,646,590 (2,060 dropped)
Billing provider NPI is missing or less than 10 digits2,951 (2 dropped)1,644,384 (2,206 dropped)
Billing provider taxonomy code is not a general acute care hospital or is missing2,675 (276 dropped)1,626,606 (17,778 dropped)
Did not merge onto CMS Hospital Enrollments or AHA Annual Survey data2,596 (79 dropped)1,600,273 (26,333 dropped)
Claim is not for a Medicaid eligible enrollee (CHIP_CD = 1 or, if missing, ELGBLTY_GRP_CD = 1-60 or 69-75) or with a Medicaid claim type code (CLM_TYPE_CD = 1 or 3).2,595 (1 dropped)1,466,715 (133,558 dropped)
NPIs that correspond to the same hospital address/coordinates/CCN2,537 (58 dropped)1,466,715 (claims not dropped since they represent the same hospital)
NPIs that had fewer than 10 births2,439 (98 dropped)1,419,113 (47,602 dropped)
End: Final unique billing provider NPIs/header claims in the IP file included in the analysis2,439 (22%)1,419,113 (12%)
 

Defining Rural Hospitals: To define hospital rurality, this analysis uses 2020 USDA Rural-Urban Commuting Area (RUCA) Codes at the hospital zip code level, which is the main geographic identifier included in either the CMS Hospital Enrollments or AHA Annual Survey data. This analysis categorized hospitals as urban, rural adjacent, and remote rural as follows:

Urban

  • 1: Metropolitan core: primary flow is within a metro urban area (UA)
  • 2: Metropolitan high commuting: primary flow is 30% or more to a metro UA
  • 3: Metropolitan low commuting: primary flow is 10% to 30% to a metro UA

Rural adjacent

  • 4: Micropolitan core: primary flow is within an urban area of 10,000 to 49,999 people (micro UA)
  • 5: Micropolitan high commuting: primary flow is 30% or more to a micro UA
  • 6: Micropolitan low commuting: primary flow is 10% to 30% to a micro UA
  • 7: Small town core: primary flow is within an urban area of 9,999 or fewer people (small town UA)
  • 8: Small town high commuting: primary flow is 30% or more to a small town UA
  • 9: Small town low commuting: primary flow is 10% to 30% to a small town UA

Remote rural

  • 10: Rural area: primary flow is to a tract outside an UA

Calculating Distance Measures Between Hospitals: Hospital addresses were geocoded using data from OpenStreetMap (OSM). Hospital names and addresses were matched to OSM features, and corresponding latitude and longitude coordinates were extracted. Thirty-five hospitals (1%) were not matched to coordinates using OSM and were manually geocoded using Google Maps searches of hospital names and addresses.

Hospital distances were calculated between hospitals within the same state because most Medicaid enrollees obtain medical services within their state of residence, and because states have special processes for enrolling and paying out-of-state hospitals. Only 7% of hospitals in this analysis have the nearest hospital in another state, and results were not meaningfully changed by this decision.

To identify the nearest hospital within a state, straight-line distances were calculated using the Haversine formula (“as the crow flies”) for each hospital pair in a state, which is consistent with other hospital distance analyses. The hospital with the shortest “as the crow flies” distance was chosen as the nearest hospital. Travel mileage and times to the nearest hospital were then computed using the OSM road network via the Open Source Routing Machine (OSRM) public API. Routing followed drivable paths and incorporated road characteristics from OSM (see OSM Routing documentation).

Kindergarten Routine Vaccination Rates Continue to Decline

Published: Aug 21, 2026

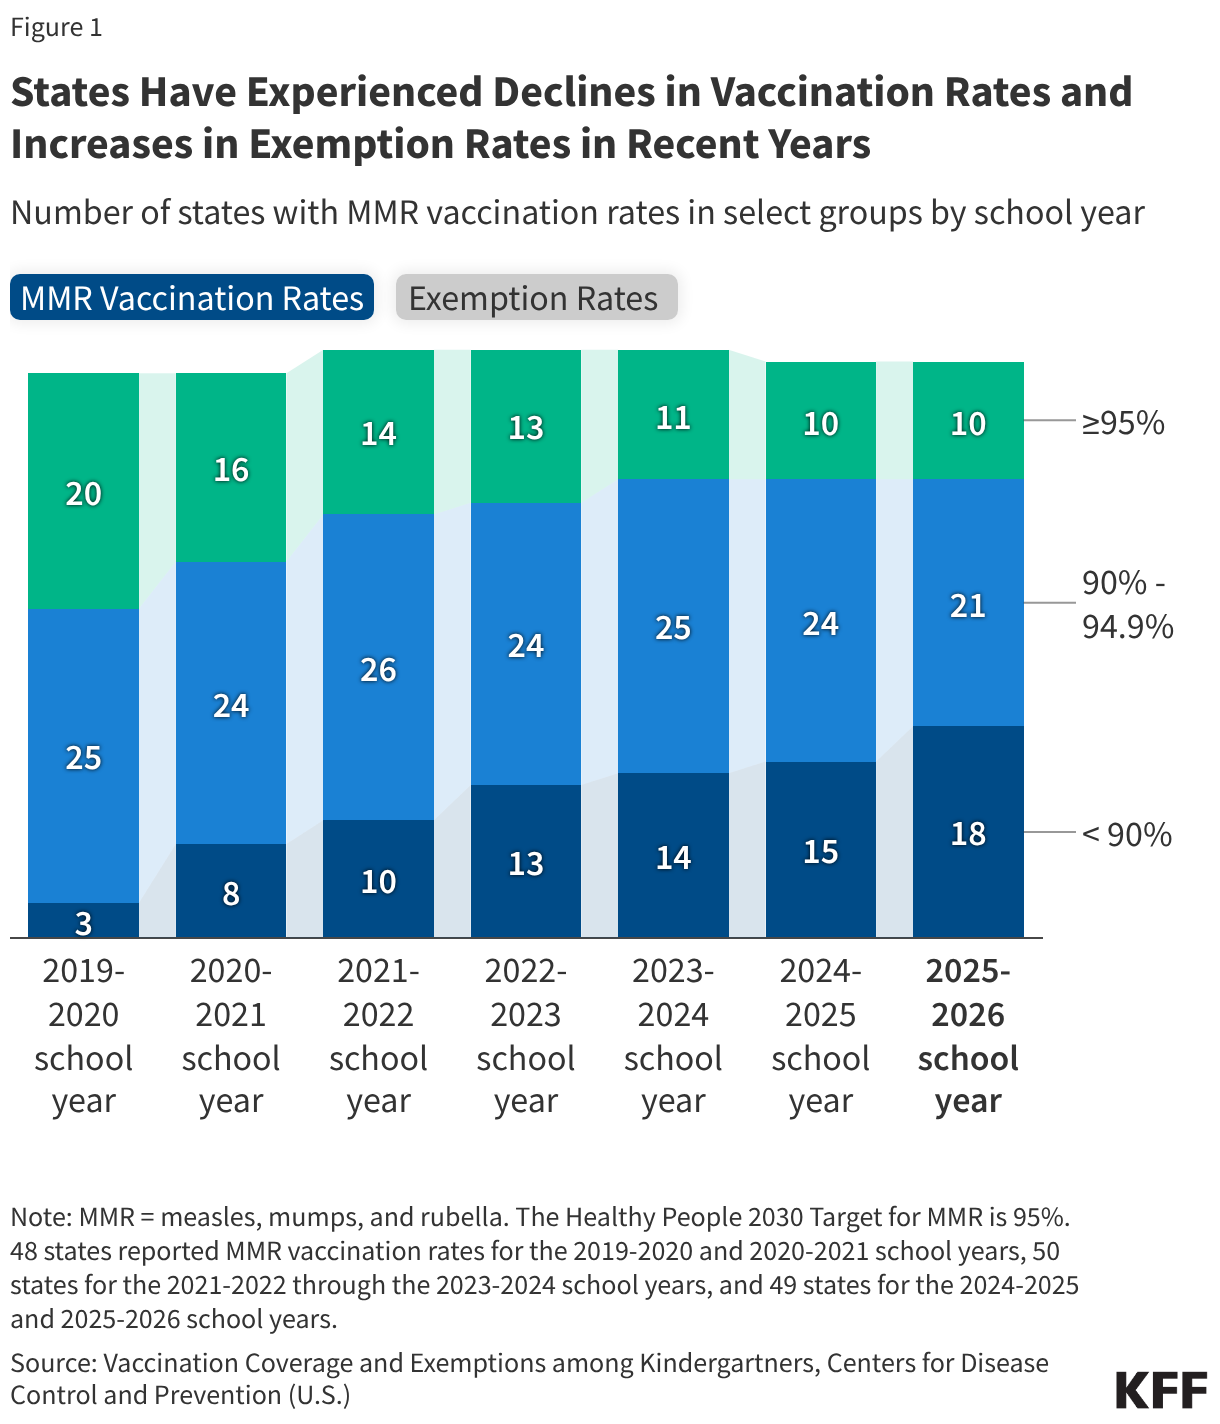
As measles cases rise across the U.S., children’s routine vaccination rates continue to decline while exemptions from school vaccination requirements, particularly non-medical exemptions, have increased. These trends began during the COVID-19 pandemic and have continued (Figure 1), signaling a shift in attitudes toward childhood vaccinations. This period has seen widespread vaccine misinformation and more skepticism among the public about the safety and effectiveness of measles vaccines as well as a decline in trust of health authorities in general and increasingly partisan views on vaccine requirements. Department of Health and Human Services (HHS) Secretary Kennedy and the Trump administration have also made significant changes to federal vaccine policy, including several attempts to change childhood vaccine recommendations and dropping Medicaid vaccine reporting requirements. Due to recent federal actions, most states have announced that they are no longer following federal recommendations as their benchmark for some or all childhood vaccines. As the school year begins, these changes along with changes to school vaccine exemption requirements in some states may increase confusion for families and could further drive down vaccination rates among children. This issue brief provides an update on the latest trends in kindergarten children’s routine vaccination and exemption rates as state and federal vaccination policy continues to evolve.

States Have Experienced Declines in Vaccination Rates and Increases in Exemption Rates in Recent Years (Stacked column chart)

The share of kindergarten children up to date on their vaccinations continues to decline. Data collected and aggregated annually by the CDC from state and local immunization programs found that 92.4% of kindergarteners had been vaccinated against measles, mumps, rubella (MMR) and polio and 92.0% against DTaP (diphtheria, tetanus, and acellular pertussis) for the 2025-2026 school year. This is down from 95% across all three vaccines for the 2019-2020 (pre-pandemic) school year and below coverage levels of the past decade. MMR vaccination rates also fall below the Healthy People 2030 “target” rate of 95%, the level needed to prevent community transmission of measles, leaving approximately 280,000 kindergarteners  unvaccinated and unprotected against a highly contagious and life-threatening virus. While measles has been officially “eliminated” from the U.S. since 2000, measles cases have surged over the past two years. In 2026, the U.S. has reported more cases of measles than in any year since 1991, putting the U.S.’s elimination status at risk. Measles cases have been reported in most states, with South Carolina, Utah, Pennsylvania, Texas, and Virginia seeing the largest outbreaks so far in 2026.

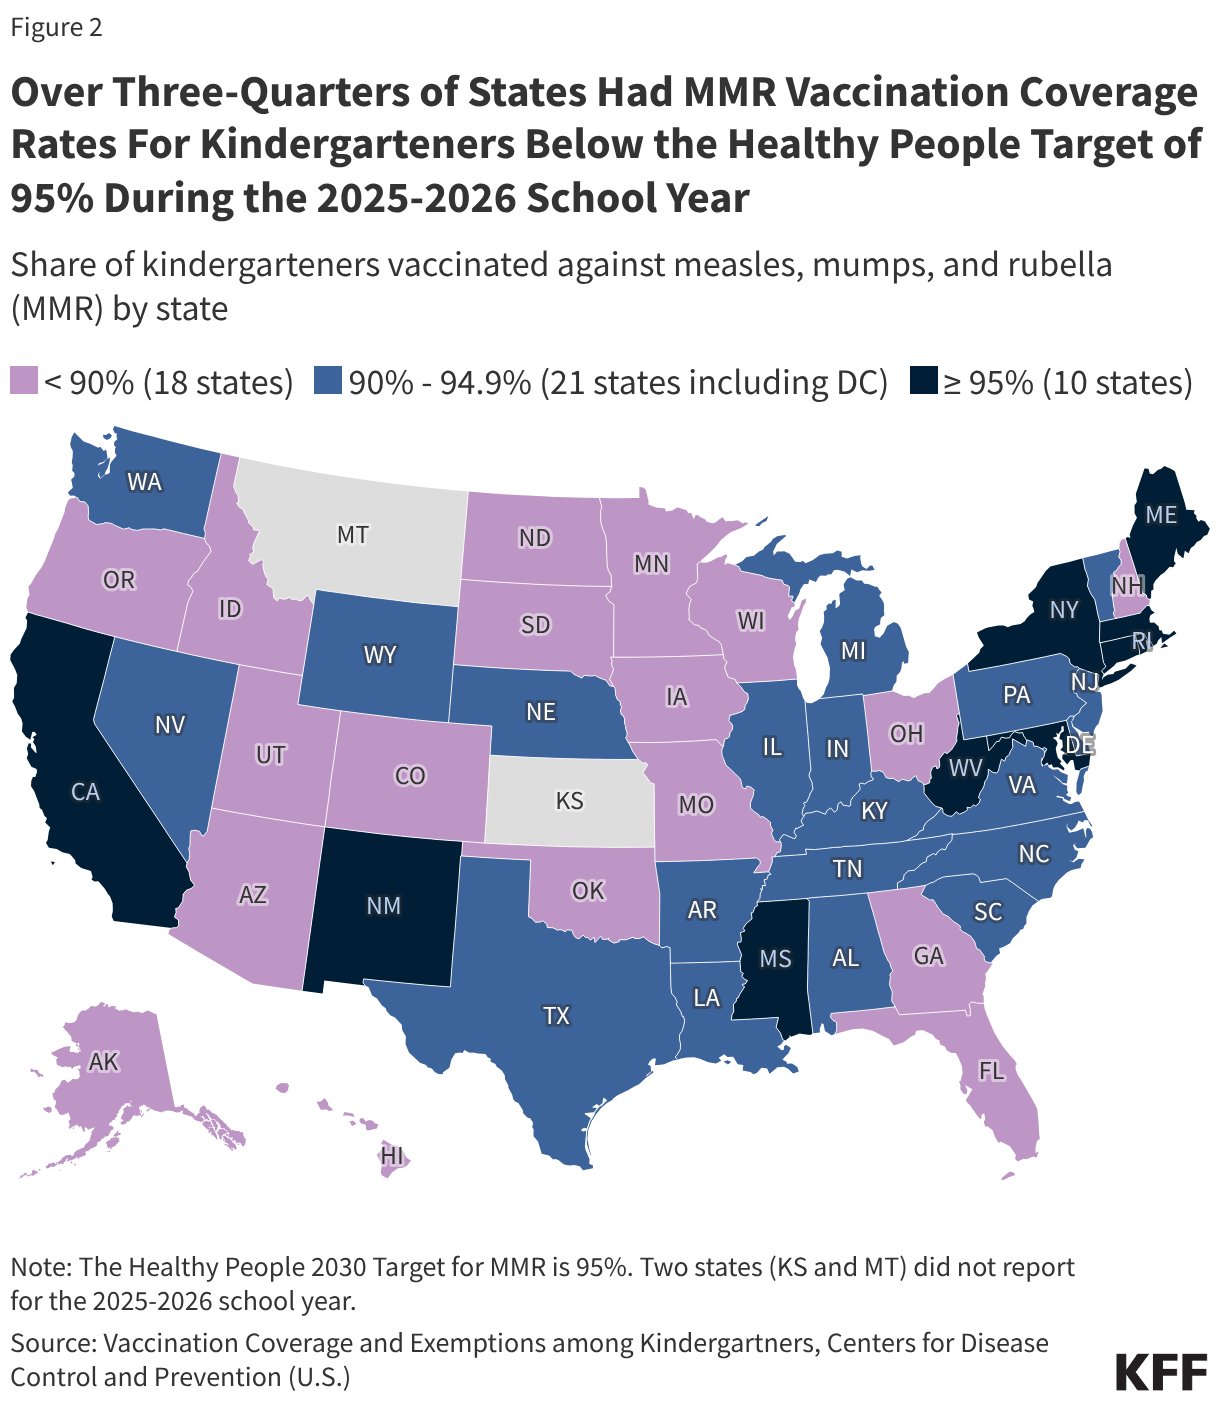
Over three-quarters (39) of states had MMR vaccination rates below the “target” rate of 95% for the 2025-2026 school year (Figure 2). Further, 18 states reported rates below 90% for the 2025-2026 school year. This is compared to only 28 states below 95% and three states below 90% before the pandemic began. In the last year alone, over half of states experienced declines in vaccination rates for MMR, DTaP, polio, and varicella. There is also substantial variation in vaccination rates across states, with MMR coverage rates among kindergarteners for the latest school year ranging from a low of 75.2% in Idaho to a high of 98.9% in West Virginia. There can also be variation in vaccination coverage within states, and, when there are clusters of unvaccinated people within a specific community, the risk of an outbreak is higher.

Over Three-Quarters of States Had MMR Vaccination Coverage Rates For Kindergarteners Below the Healthy People Target of 95% During the 2025-2026 School Year (Choropleth map)

At the same time, the share of kindergarten children with an exemption from one or more required vaccinations increased. The share of children claiming an exemption from one or more vaccinations rose from 2.5% in the 2019-2020 school year to 4.2% in the 2025-2026 school year, the highest national exemption rate to date. Increases in non-medical exemptions accounted for the recent increases; non-medical exemptions increased from 2.2% to 4.0% while medical exemptions declined slightly from 0.3% to 0.2% from 2019-2020 to 2025-2026. While a seemingly small increase in non-medical exemptions, any increases limit the overall share of children able to be vaccinated and make it more difficult to reach vaccination rate goals. Studies have shown that higher exemption rates are associated with lower vaccination coverage rates and increased risk for disease outbreaks.

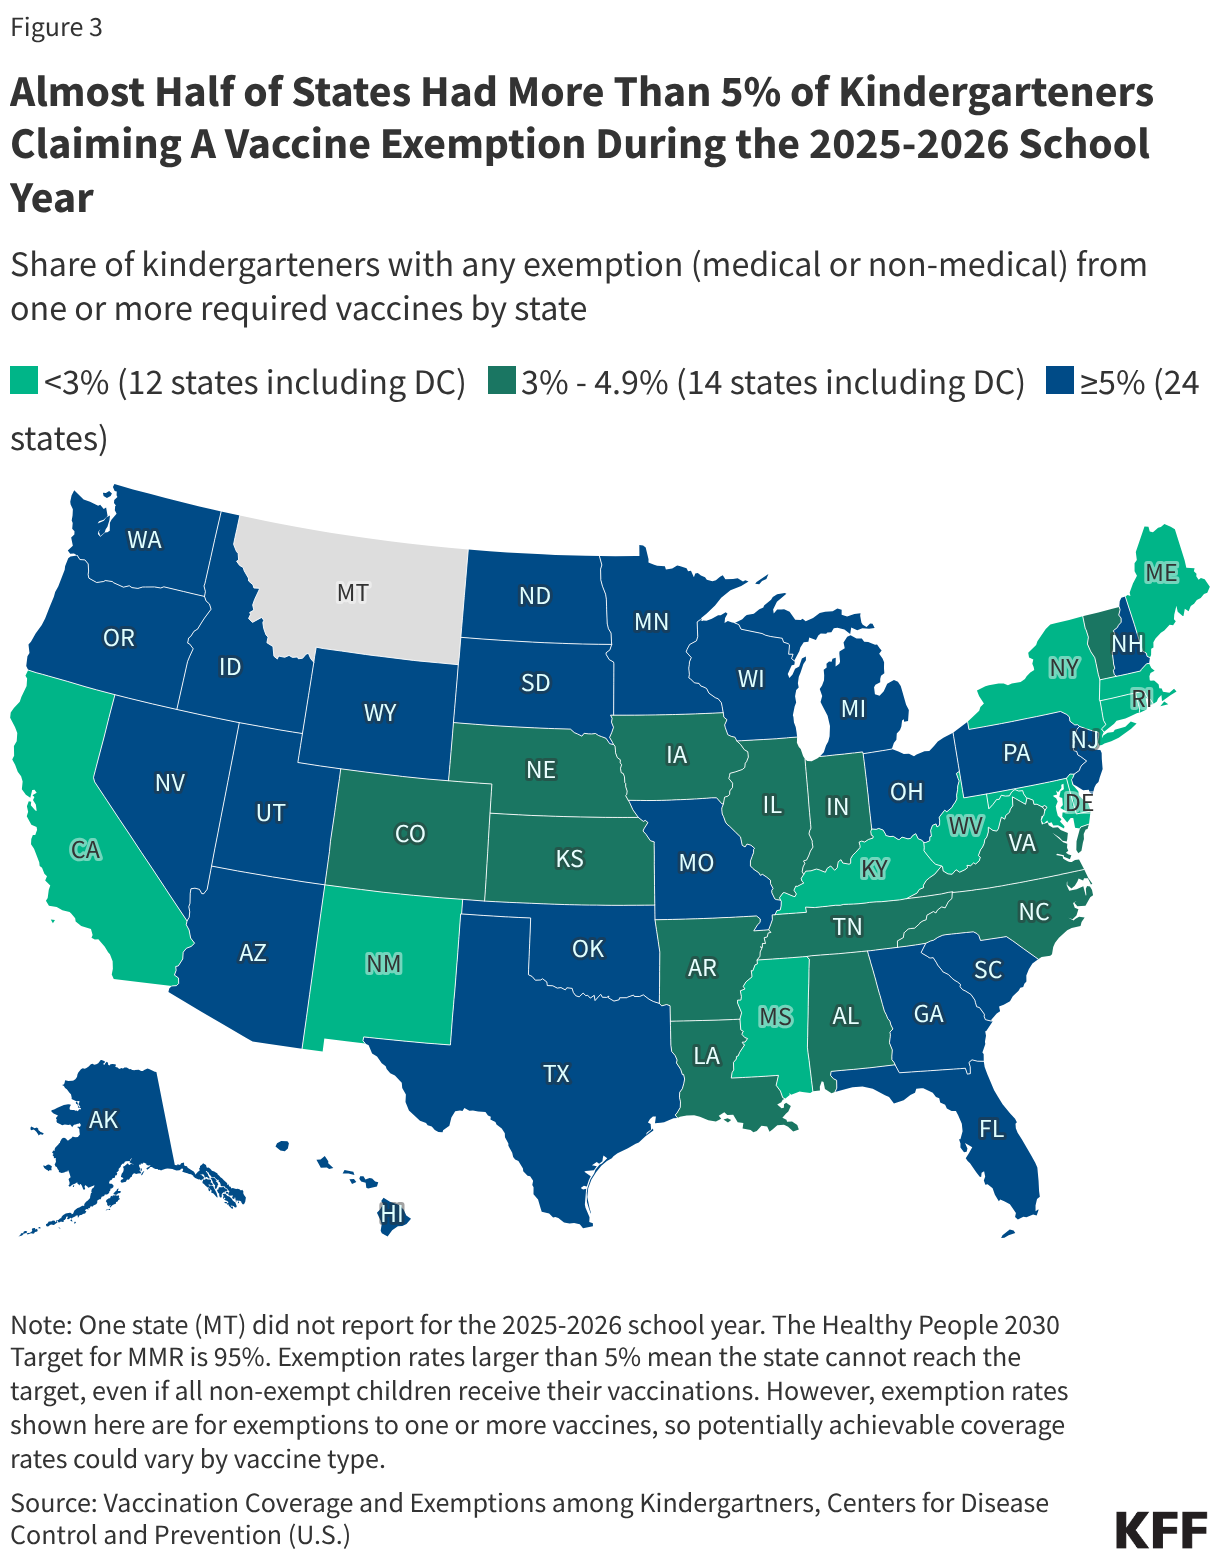
Almost half (24) of states in the 2025-2026 school year had vaccine exemption rates over 5% (Figure 3). This is up from eight states during the pre-pandemic school year. Exemption rates over 5% make it impossible to reach vaccination coverage rates at or above 95% even if all non-exempt children were vaccinated (rates shown here are for exemptions to one or more vaccines, so potentially achievable coverage rates could vary by vaccine type). In the last year alone, most states experienced an increase in the share of kindergarteners claiming an exemption for one or more vaccines. States and local jurisdictions, not the federal government, set vaccine requirements and exemption criteria for daycare and school entry. As of 2026, all states and DC required children to be vaccinated against certain diseases, including MMR, to attend public schools, though exemptions are allowed in certain circumstances. All states allow a medical exemption, and almost all (46 states including DC) allow for a religious or personal belief exemption (or both). In recent years, some states have pursued changes to reduce or eliminate requirements or expand non-medical exemptions, which could further impact children’s vaccination trends.

Almost Half of States Had More Than 5% of Kindergarteners Claiming A Vaccine Exemption During the 2025-2026 School Year (Choropleth map)

State and Local Policies on School Vaccine Requirements: Overview and Current Status

Published: Aug 21, 2026

Key Points

  • The Constitution gives authority to state and local governments, not the federal government, to set school vaccine requirements and currently all 50 states and DC currently require certain vaccines for school attendance. All jurisdictions require MMR, DTaP, polio, and varicella vaccination for school-age children, while requirements for several other vaccines vary by state. All states allow for exemptions to these requirements.
  • Jurisdictions differ substantially in how they allow parents to claim exemptions from school vaccine requirements. All states permit medical exemptions, while 45 states and DC permit religious and/or personal belief exemptions. States also vary widely in the documentation, review, and other requirements for obtaining an exemption.
  • Due to actions by the Trump administration, which has questioned the safety and effectiveness of vaccines and sought to reduce the number of recommended childhood vaccines, a growing number of states has begun to delink their recommendations from those of the federal government, which may have implications for school vaccine requirements. As of August 2026, 30 states and DC had announced that they would no longer follow Centers for Disease Control and Prevention’s (CDC) Advisory Committee for Immunization Practices (ACIP) recommendations for one or more childhood vaccines, with 27 states delinking from CDC/ACIP recommendations for all childhood vaccines. Because state and local school vaccination policies may be linked to states’ broader childhood vaccine recommendation policies, these moves could have implications for school entry requirements.
  • Recent state policy changes have generally made non-medical exemptions easier to obtain. Since 2025, at least nine states have enacted changes that make non-medical exemptions more permissive, including by reducing documentation or procedural requirements. Research indicates that easier-to-obtain non-medical exemptions are associated with higher exemption rates and, in turn, declining childhood vaccination coverage.

These trends are taking place in the context of falling national childhood vaccination rates since 2019, declines that are entirely attributable to the growth in non-medical exemptions. Higher exemption rates have been associated with increased incidence of diseases such as measles and pertussis, indicating continued outbreaks that place more children at risk for vaccine-preventable diseases in the U.S. are likely. 

Evolution of School Vaccine Requirements

Under the U.S. Constitution, states (and local governments) have the authority to impose immunization requirements, not the federal government (see Box 1). The earliest known school vaccine requirements in the U.S. were put in place by a local government in the 19th century, when Boston enacted a city-wide requirement for smallpox immunization for school entry in 1827. In 1855, Massachusetts enacted the first state-level school vaccine mandate, also for smallpox. As more childhood vaccines were developed and recommended for routine use over time, states began adding additional requirements for diphtheria, tetanus, pertussis, and polio. By 1963, 20 states required at least one vaccine for children to attend school.

Box 1: Legal Powers of States and the Federal Government Relating to Vaccine Requirements

The U.S. Constitution provides certain public health powers to states and to the federal government. The 10th Amendment “police powers” clause grants states the responsibility for enacting laws to promote health, safety and general welfare (such as public health), which has come to be interpreted as including the power to enact vaccine requirements. . The Constitution grants the federal government public health responsibilities relating to inter-state and border disease control, and tax and spending powers that allow the government to direct funds to states for specific purposes such as vaccinations. In addition, the federal government has licensing and regulatory oversight of vaccines through Department of Health and Human Services (HHS) agencies such as the Food and Drug Administration (FDA) and Centers for Disease Control and Prevention (CDC).

Over time there have been legal challenges to states’ powers to impose school vaccine requirements, but the federal courts have consistently ruled in favor of states’ powers. For example, in the Jacobson vs. Massachusetts (1905) ruling, the Supreme Court established that states can mandate vaccines for school attendance and impose fines for non-compliance; Zucht vs. King (1922) affirmed that schools can require proof of vaccination prior to entry; and Prince vs. Massachusetts (1944) upheld states power to impose vaccination mandates despite parental objections based on religious beliefs. As recently as 2026, a federal appeals court affirmed New York state’s 2019 repeal of its prior “religious beliefs” exemption for school vaccine mandates that had been enacted after a large measles outbreak in the state, rejecting a challenge to the law brought by Amish parents (Miller vs. McDonald, 2026).”

In the 1960s, the federal government also increased its support to states for vaccinations and broadened its immunization-related policy-making efforts. In 1962, Congress created the Public Health Service Section 317 Immunization Grants Program, which allowed federal funds to be directed to state and local jurisdictions for purchasing vaccines. In 1964, a new specialized expert committee called the Advisory Committee on Immunization Practices (ACIP) was established at the federal level to provide guidance regarding vaccines. ACIP was designated an official federal advisory committee and placed organizationally under the Centers for Disease Control and Prevention (CDC) Director in 1972. The 1960s and 1970s also saw the licensure of new combination measles, mumps and rubella (MMR) vaccines, coinciding with a number of measles outbreaks among children that drew national attention, and  spurred expanded federal and state efforts to strengthen and update vaccination laws (the measles vaccine was added to the federal 317 program in 1965). In the 1970s, large measles outbreaks in Alaska (1976) and Los Angeles, California (1977) led policymakers in those states to enact stricter measles vaccination requirements for school children that resulted in lower measles incidence, demonstrating to policymakers nationwide that enforcement of immunization requirements was possible, acceptable, and effective for most communities. Subsequently, CDC encouraged all states to implement school immunization requirements. 

By 1981, all 50 states and DC had some form of school immunization requirements, and in the 1981-82 school year, vaccination levels in school entrants nationwide had reached 96% or higher for diphtheria-tetanus-pertussis (DTP), polio, and measles vaccines. In 1983, CDC/ACIP published the first general federal recommendations for childhood vaccinations, which were updated in 1989 and eventually merged with the recommended schedule issued by the American Academy of Pediatrics (AAP) in 1995. Throughout the 1990s and 2000s more vaccines were added to the CDC/ACIP recommendations for children and adolescents, including Hepatitis A, Hepatitis B, Haemophilus influenzae type b (Hib), pneumococcal, rotavirus, varicella, human papillomavirus (HPV), and meningococcal vaccines. Over time, states have integrated many of these vaccines into their school immunization policies as well, though the specific set of required vaccines varies across states, as described below.

Current state policies on school vaccination requirements

As shown in Figure 1, all 50 states and DC require MMR, DTaP, polio, and varicella vaccines for school-age children. Forty-nine states and DC also require Hepatitis B (Alabama is the exception), with three of those states requiring Hepatitis B for childcare settings only (Maine, Montana, South Dakota). Thirty-five states require meningococcal vaccines for school-age children, while 27 states require Hepatitis A. Just four jurisdictions require HPV vaccines for school-age children (DC, Hawaii, Rhode Island, and Virginia).

Figure 1

State Exemption Policies for School Vaccine Requirements

While all states allow for individual exemptions to state school vaccination requirements, the extent of these exemptions vary. They fall into two general categories: “medical” (exemptions based on medical contraindications) and “nonmedical” (exemptions based on religious beliefs or other personal/philosophical beliefs). Currently, all states allow for medical exemptions, while 45 states and DC allow for religious and/or personal belief exemptions (the exceptions are California, Connecticut, Maine, New York, and West Virginia). Of the jurisdictions allowing non-medical exemptions (see Figure 2):

  • 30 states allow religious exemptions only
  • 15 states allow religious and personal belief exemptions
  • 1 state (Minnesota) allows personal belief exemptions only
Figure 2

States also vary in how difficult it is to obtain an exemption and in their oversight of exemptions. All states require some form of documentation from a health care professional to grant a medical exemption, though how rigorous the process is differs across states. Likewise, in states that allow for nonmedical exemptions, documentation and approval processes can vary in their rigor and requirements. For example:

  • In California, physicians issuing medical exemptions must use a centralized system, all exemption requests are reviewed by the state’s health department that has the authority to invalidate inappropriate requests, and justifications must adhere to standards for medical contraindications (previously, the state linked its standards for medical exemptions to CDC/ACIP recommendations, but as of 2025 uses AAP criteria instead). In New York, review and enforcement for exemption requests is the responsibility of school officials (the state has also delinked its standards for medical contraindications from CDC/ACIP, linking to AAP instead). In Mississippi, the state health department reviews all medical and non-medical (religious) exemption requests.
  • In West Virginia, medical exemptions are reviewed by the state health department and must adhere to guidance from ACIP, AAP, and AAFP. In January 2025, the governor issued an executive order newly allowing religious and personal belief exemptions in the state, setting off a legal battle with the Department of Education. Currently, religious and personal belief exemptions in West Virginia are on hold while the state Supreme Court considers the case. 
  • In Oregon, nonmedical exemptions are allowed but parents must receive counseling about disease risks and vaccine benefits before their child can be granted the exemption. In Washington, religious exemptions simply require parents to complete a form, while personal belief exemptions require parents to receive counseling prior to granting the exemption.
  • In states such as Arizona, Idaho, Oklahoma, and Texas, nonmedical exemptions are granted after parents submit a form requesting them, with no counseling or health professional certification required.

Since 2025, at least 9 states have enacted policy changes that are more permissive for non-medical exemptions. For example, in Texas a new law allows parents to download the state’s non-medical exemption form directly rather than first having to submit a written request to the state’s health department for the form, and Utah has made a student’s vaccine exemption form a part of their permanent school record, allowing the form to remain valid even if a student transfers schools. In New Hampshire, advanced practice registered nurses and physician associates have recently been added as health care providers with the authority to sign school vaccination exemption forms and a new law requires that materials about school vaccine requirements include the statement “Medical and religious exemptions are available under New Hampshire law.”

State Procedures for Setting School Vaccination Requirements

Each state has its own legal and organizational process for setting school entry immunization requirements, which can range from a more statutory process where state legislatures determine most key school vaccination policies, to a more administrative, one where state health departments or other agencies have the responsibility and authority to determine these requirements. Many states have a mix of these elements, such as using a statutory process for some vaccines and an administrative process for others, or where state law determines which vaccines are required while administrative processes determine the specifics such as dosages and schedules. For example:

  • Pennsylvania, Mississippi, South Carolina, and Virginia are states with a more administrative approach, where state health (or other) agencies have significant responsibilities in determining school vaccination requirements. In these cases, the state legislature has established the general requirement that children attending school must be immunized but has delegated authority to state agencies to determine the specific vaccines, dosages, and other technical requirements.
  • In Arkansas and Florida, state legislation sets school vaccination requirements for specific vaccines, while giving the health department responsibility for other vaccines. In Florida, for example, state laws set the requirement that Diphtheria-Pertussis-Tetanus (DPT), MMR, and polio vaccines are required for school entry, but allow the health department to set requirements for other vaccines such as hepatitis A, pneumococcal, and varicella.
  • In Kentucky, Maine, and West Virginia, state laws identify the full set of diseases students must be immunized against, but health departments and/or education departments are empowered with the responsibility to establish dosages, schedules, exemption policies, and other technical requirements.

In many states, childhood vaccination recommendations in the past have been linked to guidance from the CDC/ACIP and in some cases this has included school vaccination policies, such as when states link their allowed medical contraindications for exemptions to CDC/ACIP guidance, as mentioned above. However, since 2025 the Trump administration has sought to make changes to federal vaccine recommendations for children, including by issuing a new federal childhood vaccine schedule in January 2026 (which has been temporarily blocked by a federal judge) and issuing an Executive Order (EO) in August 2026 calling for changes to the federal childhood vaccine schedule and specifically asking States and territories to “consider updating relevant laws and regulations that define the scope of immunization requirements for contexts such as school enrollment and attendance.” In anticipation of and in reaction to the Trump Administration’s policy changes, starting in 2025 a number of states began announcing they will no longer link their own recommendations to those of CDC/ACIP. As of July 30, 2026, most states (30 states, including DC), announced they would no longer follow the CDC/ACIP general childhood vaccine recommendations for one or more childhood vaccines, with 27 doing so for all childhood vaccines, and instead rely on prior recommendations, state recommendations, and/or those of external entities such as AAP. No states have made policy changes in line with the August 2026 EO.  At least 10 state and local jurisdictions have announced specifically that their school vaccine requirements have not changed as a result of the EO.

5 Questions and Answers About Medicaid and Provider Taxes

Published: Aug 20, 2026

The 2025 reconciliation law imposes significant new restrictions on states’ ability to generate Medicaid provider tax revenue, including prohibiting all states from establishing new provider taxes or from increasing existing taxes as well as reducing existing provider taxes for states that have adopted the Affordable Care Act (ACA) Medicaid expansion. Medicaid is jointly financed by the federal government and the states, with the federal government guaranteeing states federal matching payments with no pre-set limit. In federal fiscal year (FFY) 2024, the federal government paid 65% and states paid 35% of total Medicaid costs. States are permitted to finance the non-federal share of Medicaid spending through multiple sources, including state general funds, health-care related taxes (referred to as “provider taxes” throughout this brief), and local government funds.

Changes to provider tax rules will have significant effects on state budgets and may make it difficult for states to maintain current Medicaid spending without increasing state general fund spending; but could increase transparency around Medicaid financing. The changes come at a time when states are already experiencing overall slower revenue growth, and it is unclear how states will be able to make up the lost revenues. The changes could exacerbate existing state budget challenges and result in lower provider payment rates or reductions in Medicaid benefits or coverage, although the effects will vary by state.

This issue brief uses data from KFF’s 2025-2026 survey of Medicaid directors and from a proposed rule on provider taxes to describe states’ current provider taxes, explore how rules governing provider taxes are changing because of the 2025 reconciliation law and the regulations implementing that law, and summarizes which changes may affect each state.

1.How have states used provider taxes to help finance the state share of Medicaid?   

KFF’s 2025 Medicaid Budget Survey found that the majority of state Medicaid spending came from general fund revenues, but provider taxes contributed 18%. States have considerable flexibility in determining how to finance the state (or non-federal) share of Medicaid payments, within certain limits. Across all states, most of the state share of Medicaid spending comes from state general funds, but there is considerable variation in how much states rely on other funding sources. KFF’s 2025 Medicaid budget survey found that general funds accounted for a median of 70% of the non-federal share in state fiscal year (FY) 2026 enacted budgets, while provider taxes accounted for 18%, and funds from local governments or other sources accounted for 6% (this is relatively similar to 2018 data on non-federal share funding sources reported by the Government Accountability Office (GAO) and 2024 data on general fund spending from the National Association of State Budget Officers (NASBO)). 

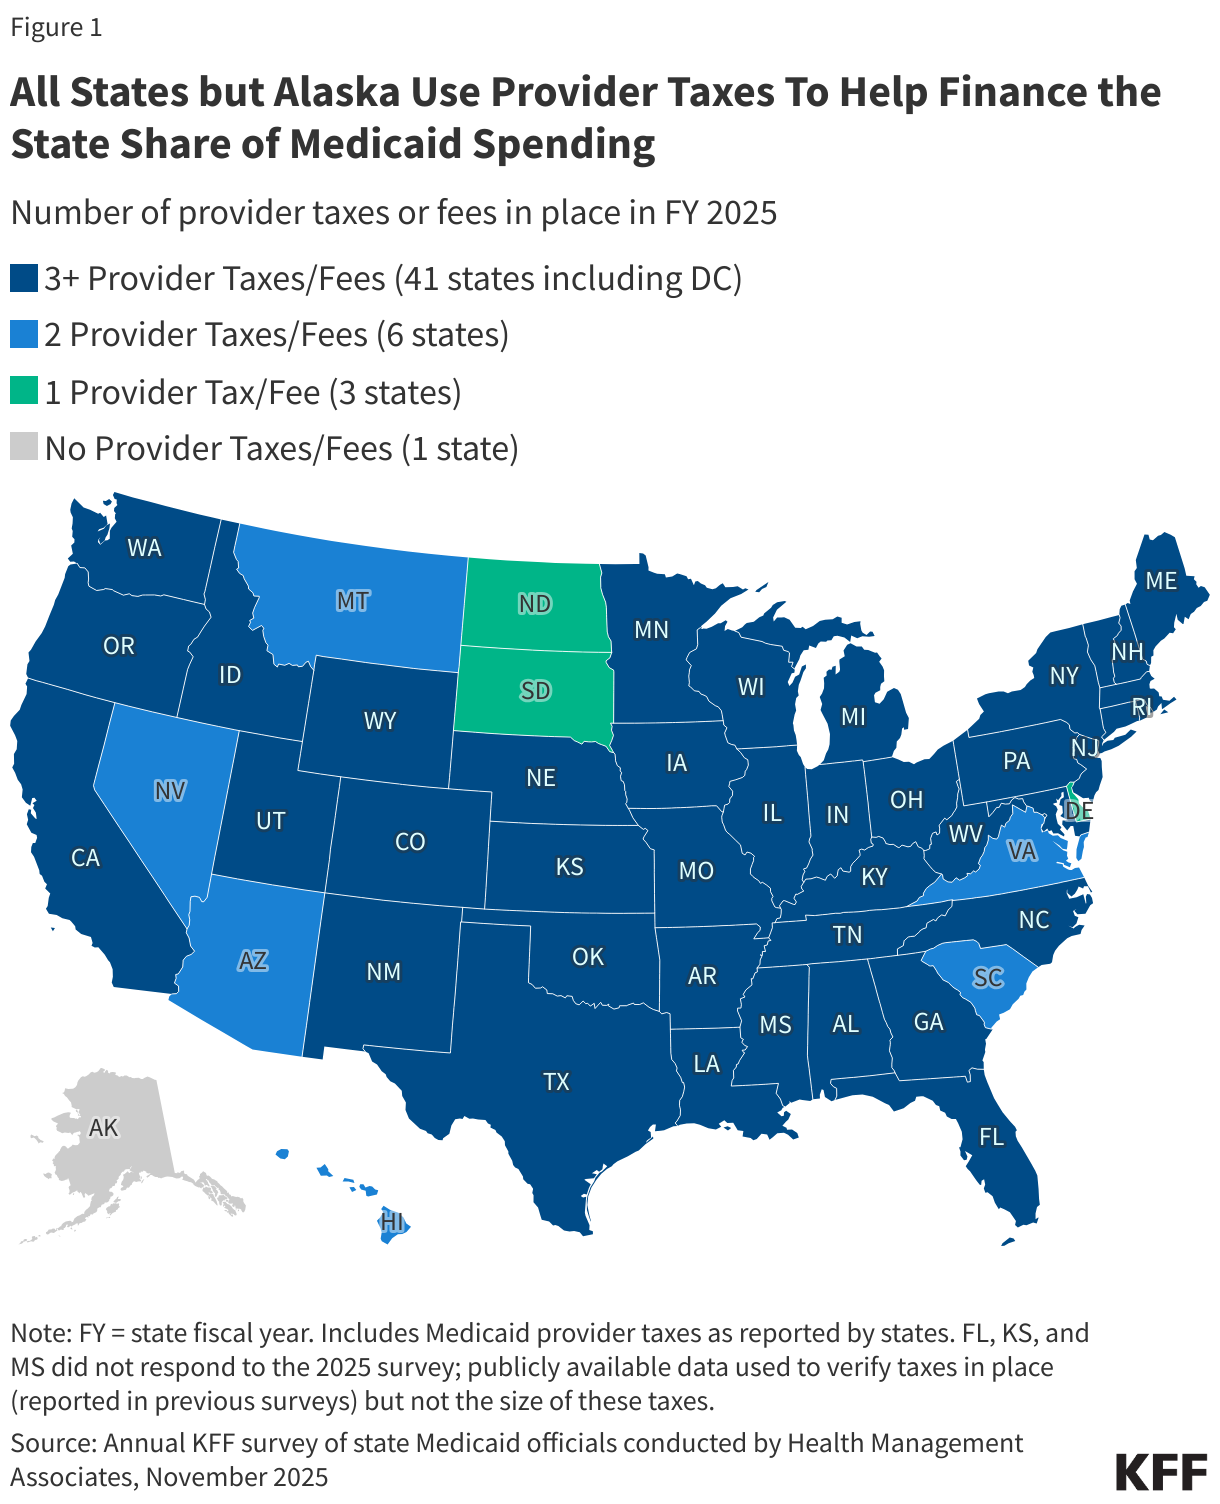
All states but Alaska finance part of the state share of Medicaid funding through at least one provider tax and 41 states have three or more provider taxes in place (Figure 1). Medicaid provider taxes are defined as those for which at least 85% of the tax burden falls on health care items or services or entities that provide or pay for health care items or services (see Social Security Act, Section 1903(w)(3)(A)). Provider taxes may be imposed as a percentage of provider revenues or using an alternative formula such as a flat tax on the number of facility beds or inpatient days. States use provider tax revenues to fund Medicaid “base” rates and supplemental payments; to finance eligibility expansions, including the ACA Medicaid expansion; or to more generally support the Medicaid program. Over time, states have increased their reliance on provider taxes, with expansions often driven by economic downturns or a desire to fund eligibility expansions or provider reimbursement increases. Beyond helping finance the state share of Medicaid, permissible tax arrangements may have potential financial benefits for providers who are subject to the tax and serve a high volume of Medicaid patients.

All States but Alaska Use Provider Taxes To Help Finance the State Share of Medicaid Spending (Choropleth map)

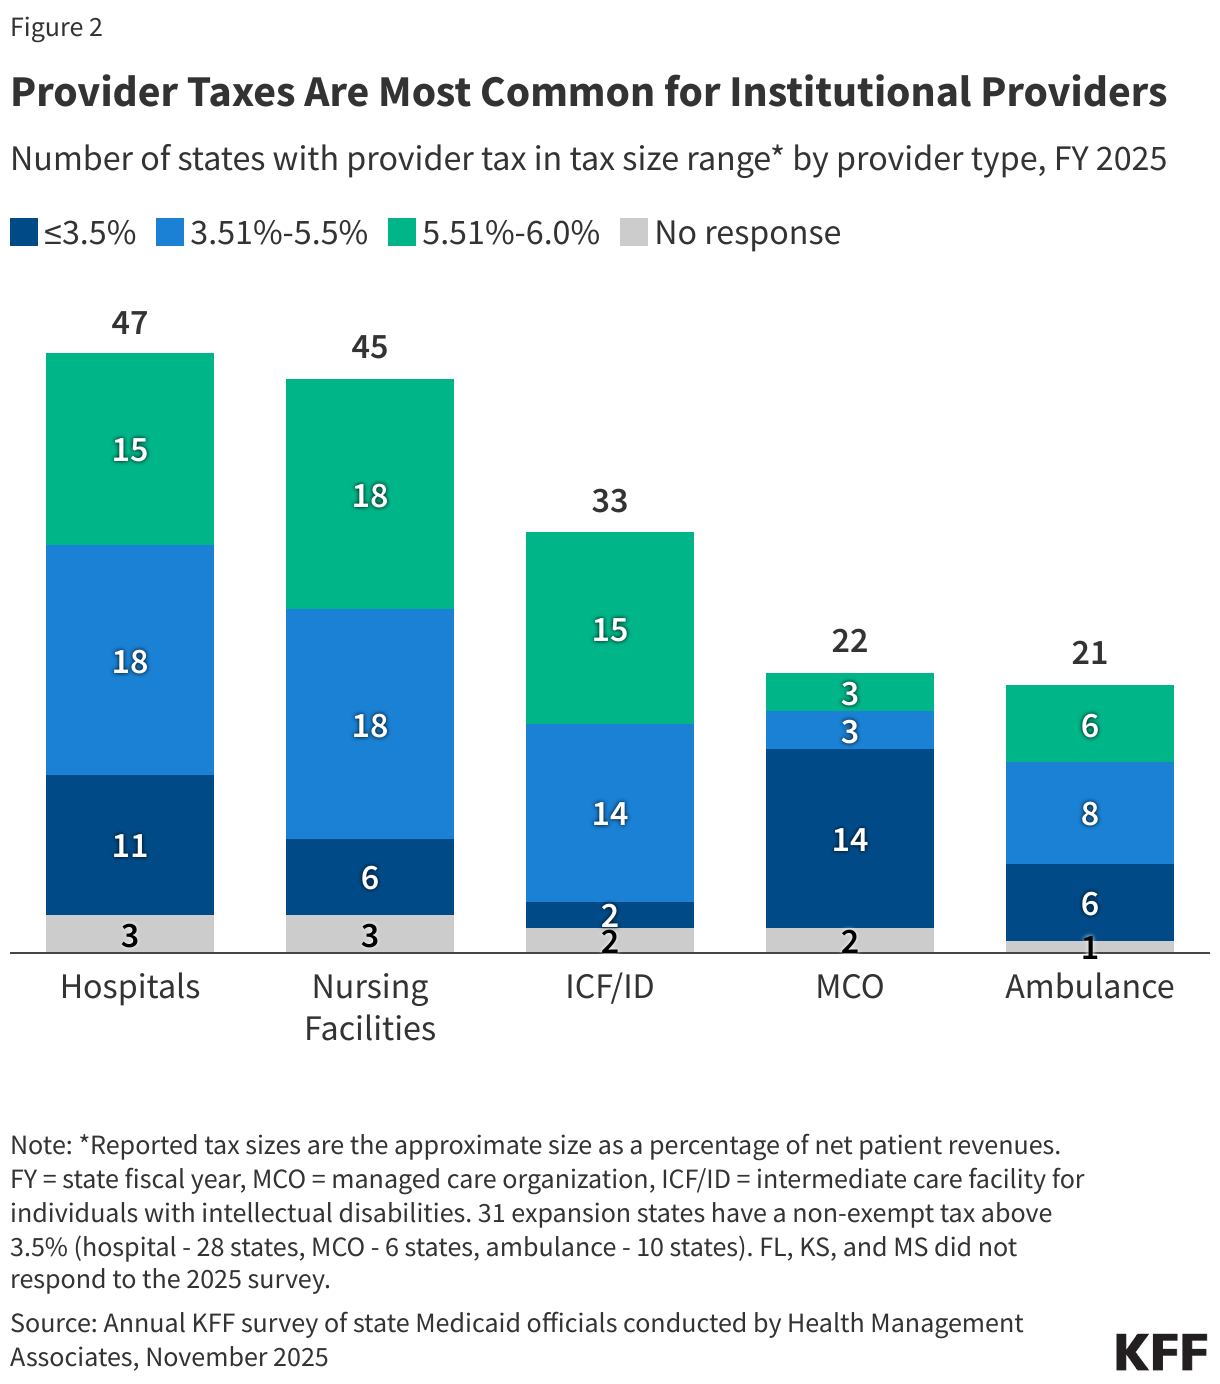
Provider taxes are most common for institutional providers. That includes hospitals (47 states), nursing facilities (45 states), and intermediate care facilities for people with intellectual or developmental disabilities (33 states, Figure 2). Provider tax revenues often finance supplemental payments to institutional providers, which may be a major source of revenues for those providers. Payment policies vary considerably by state, and research has shown that Medicaid base payment rates are below those of Medicare and often below hospitals or nursing facilities’ costs of providing services to Medicaid enrollees, causing some states to rely more heavily on supplemental payments than others to help cover costs. Beyond institutional providers, states have taxes on managed care organizations (MCOs) (22 states), ambulance providers (21 states), and “other” provider types (9 states) such as ambulatory care facilities and home care providers. Provider tax revenues are most likely to be near the 6% safe harbor limit (described in more detail below) for nursing facilities followed by hospitals and intermediate care facilities for people with intellectual or developmental disabilities (Figure 2).

Provider Taxes Are Most Common for Institutional Providers (Stacked column chart)

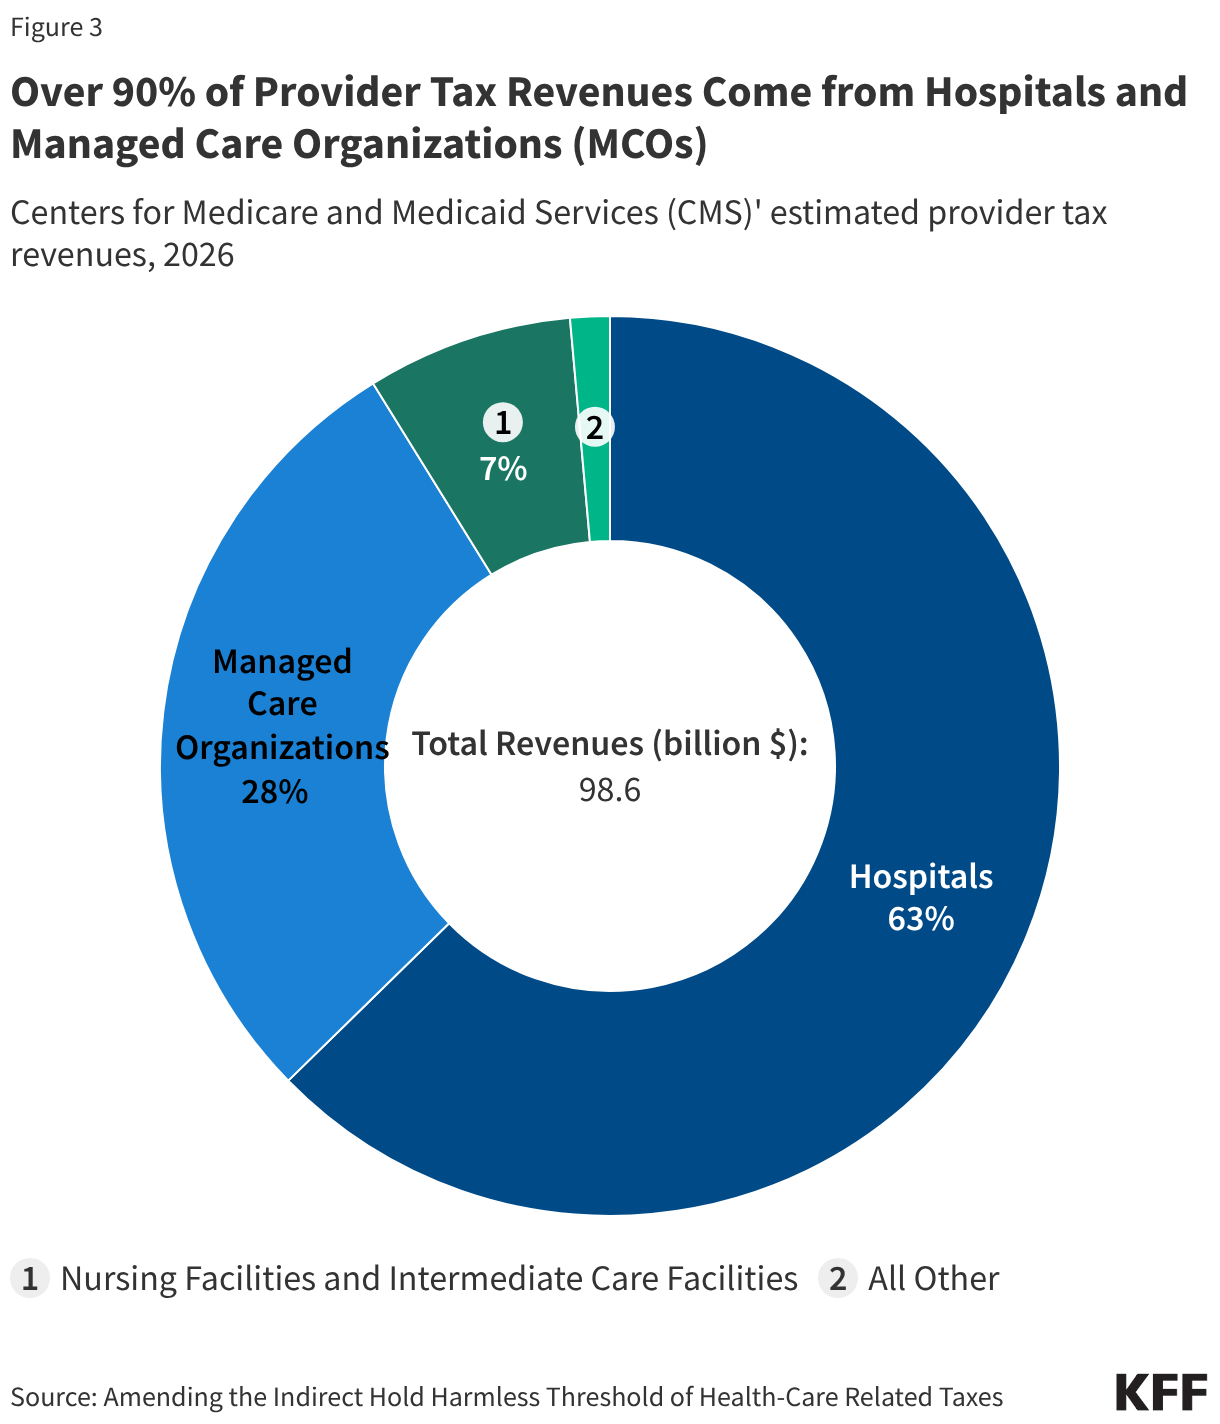
CMS estimates that states will collect nearly $100 billion in provider tax revenues in 2026, mostly from hospital taxes (Figure 3). Historically, the federal government did not provide consistent or comprehensive publicly available data about states’ provider tax policies or revenue collections. In June 2024, the Medicaid and CHIP Payment and Access Commission (MACPAC), called for increased transparency over how states financed the non-federal share of Medicaid payments. However, CMS requested additional data from states about their provider taxes in 2025 and 2026. Using those data and their own projections, CMS estimates that tax revenues in calendar year 2026 will be $98.6 billion, with $61.8 billion coming from taxes on hospitals and $28.1 billion coming from taxes on managed care organizations.

Over 90% of Provider Tax Revenues Come from Hospitals and Managed Care Organizations (MCOs) (Donut Chart)

2. What federal rules governed provider taxes before the 2025 reconciliation law?

Since the 1990s, federal rules governing provider taxes have included three core components—requiring taxes to be “broad-based,” “uniform,” and not hold providers “harmless.” Provider taxes were established in the 1980s, but particularly aggressive use of provider taxes following their establishment in the 1980s led to statutory and regulatory limitations beginning in the 1990s. Federal rules prior to passage of the 2025 reconciliation law specified that provider taxes must be:

  • Broad-based, which means the tax is imposed on all providers within a specified class of providers (e.g., the tax cannot be imposed only on providers that see primarily Medicaid patients);
  • Uniform, which means the tax must apply equally to all providers within the specified class (e.g., the tax rate cannot be higher on Medicaid revenue than non-Medicaid revenue); and
  • Not hold taxpayers (providers) “harmless,” which means states are prohibited from directly or indirectly guaranteeing that providers will receive their tax costs back (i.e., be “held harmless”).

To ensure tax programs are “broad-based,” CMS has specified 19 classes of providers (see 42 CFR Section 433.56). States may obtain “uniformity waivers” of the requirements that taxes be broad-based and uniform if the state can prove the net effect of the tax is “generally redistributive,” and the amount of tax is not directly related to Medicaid payments. In assessing whether provider taxes comply with federal laws, regulations specify that the hold harmless requirement does not apply when the tax revenues comprise 6% or less of net patient revenues from treating patients (see 42 CFR Section 433.68), a level sometimes referred to as a “safe harbor” or “hold harmless” limit.

Changes in the 2025 Reconciliation Law

The 2025 reconciliation law, signed by President Trump on July 4, 2025, imposes significant new restrictions on states’ ability to generate Medicaid provider tax revenue. The Congressional Budget Office (CBO) estimated provider tax policy changes from the 2025 reconciliation law would reduce federal Medicaid spending by $226 billion between 2025 and 2034. Those savings reflect the following changes to federal rules:

  • An effective prohibition on new provider taxes or increases to existing ones ($89 billion in savings). The law effectively prevents the enactment of any new provider taxes by establishing a hold harmless limit of 0% for any taxes that were not in effect as of July 4, 2025. It also prevents any increases to existing provider taxes, which are capped at their rates as of July 4, 2025.
  • Reduced limits on provider taxes in states that adopted the Affordable Care Act (ACA) Medicaid expansion ($102 billion in savings).  Beginning in FFY 2028, the law gradually reduces the hold harmless limit for states that have adopted the ACA expansion by 0.5% annually until the safe harbor limit reaches 3.5% in FFY 2032. The new limits apply to all provider taxes except for those levied on nursing facilities and intermediate care facilities.
  • Revisions to the conditions under which states may receive uniformity waivers ($35 billion in savings). Effective July 5, 2025, the law prohibits states from using uniformity waivers if the tax charges higher or lower rates based on the volume of Medicaid revenues or patients.

Changes in the July 2026 CMS Proposed Rule

CMS released a proposed rule in July 2026 to implement the hold harmless provisions in the 2025 reconciliation law, which included some provisions not required under the law. The list below highlights some of the key provisions included in the proposed rule:

  • Broader interpretation of taxes “in effect.” Under the proposed rule, CMS would recognize provider taxes as being in effect as of July 4, 2025 or earlier if they had been enacted. This is less restrictive than guidance issued in November 2025, which also required that all applicable uniformity waivers to have been approved by July 4, 2025 and for states to be “actively collecting” revenues as of July 4, 2025.
  • Establishing health insurers as a permissible class of providers. Although not required by the 2025 reconciliation law, the rule proposes to add a new “health insurer” provider class to expand CMS oversight of health-care related taxes that goes beyond the existing “MCO” provider class including Health Maintenance Organizations and Preferred Provider Organizations. The proposed rule does not define the new class, but CMS is seeking comments on the potential scope of the new provider class. Such taxes would be subject to all other requirements governing Medicaid provider taxes, including new limits in the 2025 reconciliation law. CMS notes that these taxes are often imposed through state insurance commissions or departments.
  • Discontinuation of the 75/75 test. The 2025 reconciliation law did not address the “75/75” test, under which taxes exceeding the hold harmless limit could remain permissible as long as more than 75% of taxpaying providers do not receive more than 75% of the cost of the tax back through enhanced Medicaid or other state payments. Starting in FFY 2027, the proposed rule would discontinue the 75/75 test.
  • Enhanced Reporting Requirements and Compliance System. The proposed rule would significantly expand state reporting requirements and introduce retrospective CMS review to determine ongoing state compliance with the new hold harmless limits. States would be required to submit data (interim in 2026 and final in 2028) to CMS to determine applicable hold harmless limits as of July 4, 2025. States would also be required to submit quarterly reports beginning October 1, 2026, supplying tax collection data as well as information on how tax revenues are used by the state and whether public providers are exempt from the tax.

Under the proposed rule, CMS estimates that federal Medicaid spending would decrease by $246 billion over the next ten years (2026- 2035). This is similar to the CBO estimates although the CBO estimate does not include effects for the year 2035, which accounted for $44 billion of CMS’ total federal spending reduction. While the difference in estimates is relatively small, there are a few key differences in the agencies’ assumptions:

  • States response. CBO assumed that states would replace 50% of the lost provider tax revenues with other funding sources but CMS assumes they will only replace 30%.
  • Coverage loss. CBO estimated that provider tax changes in the 2025 reconciliation law will increase the number of uninsured people by 1.2 million by 2034, but CMS estimates that there will be no enrollment loss associated with the loss of revenues. 

4. Which states may face reductions in existing provider tax revenues?

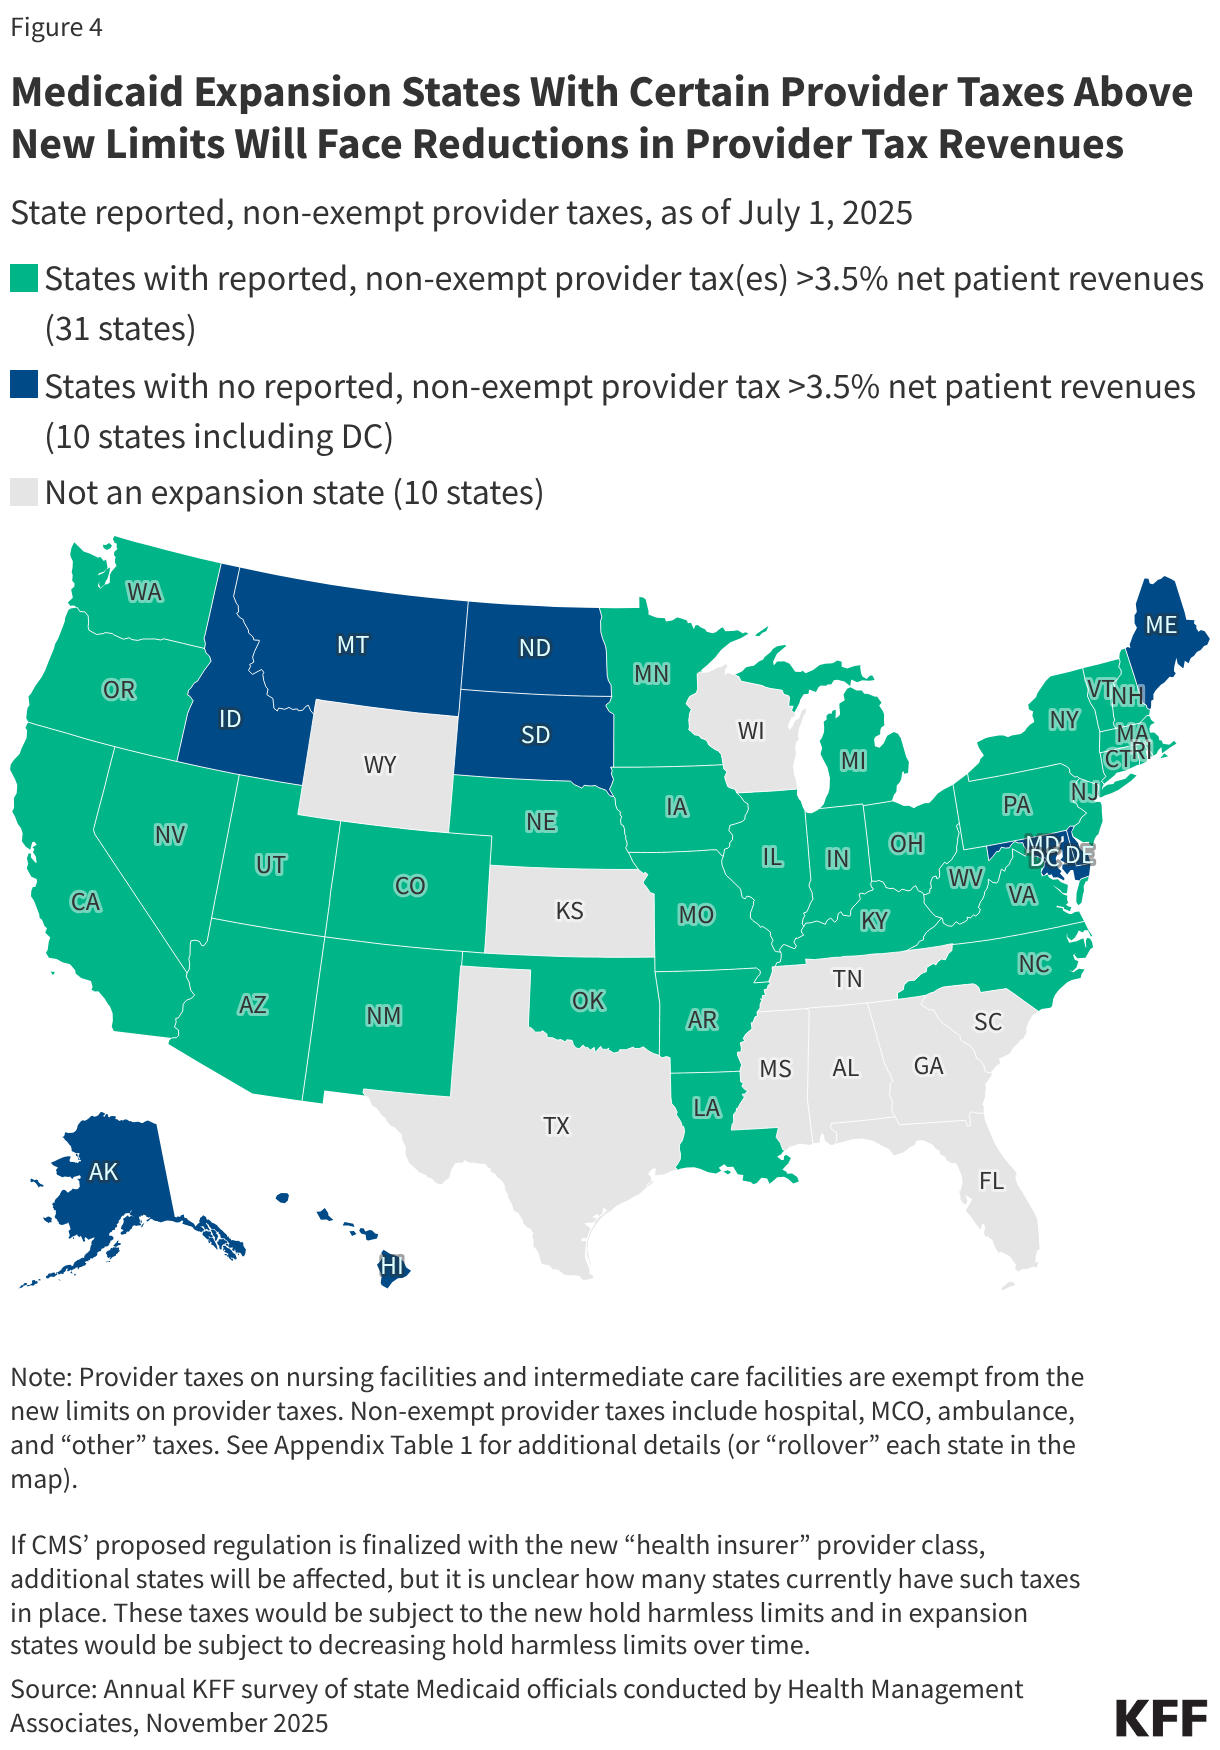
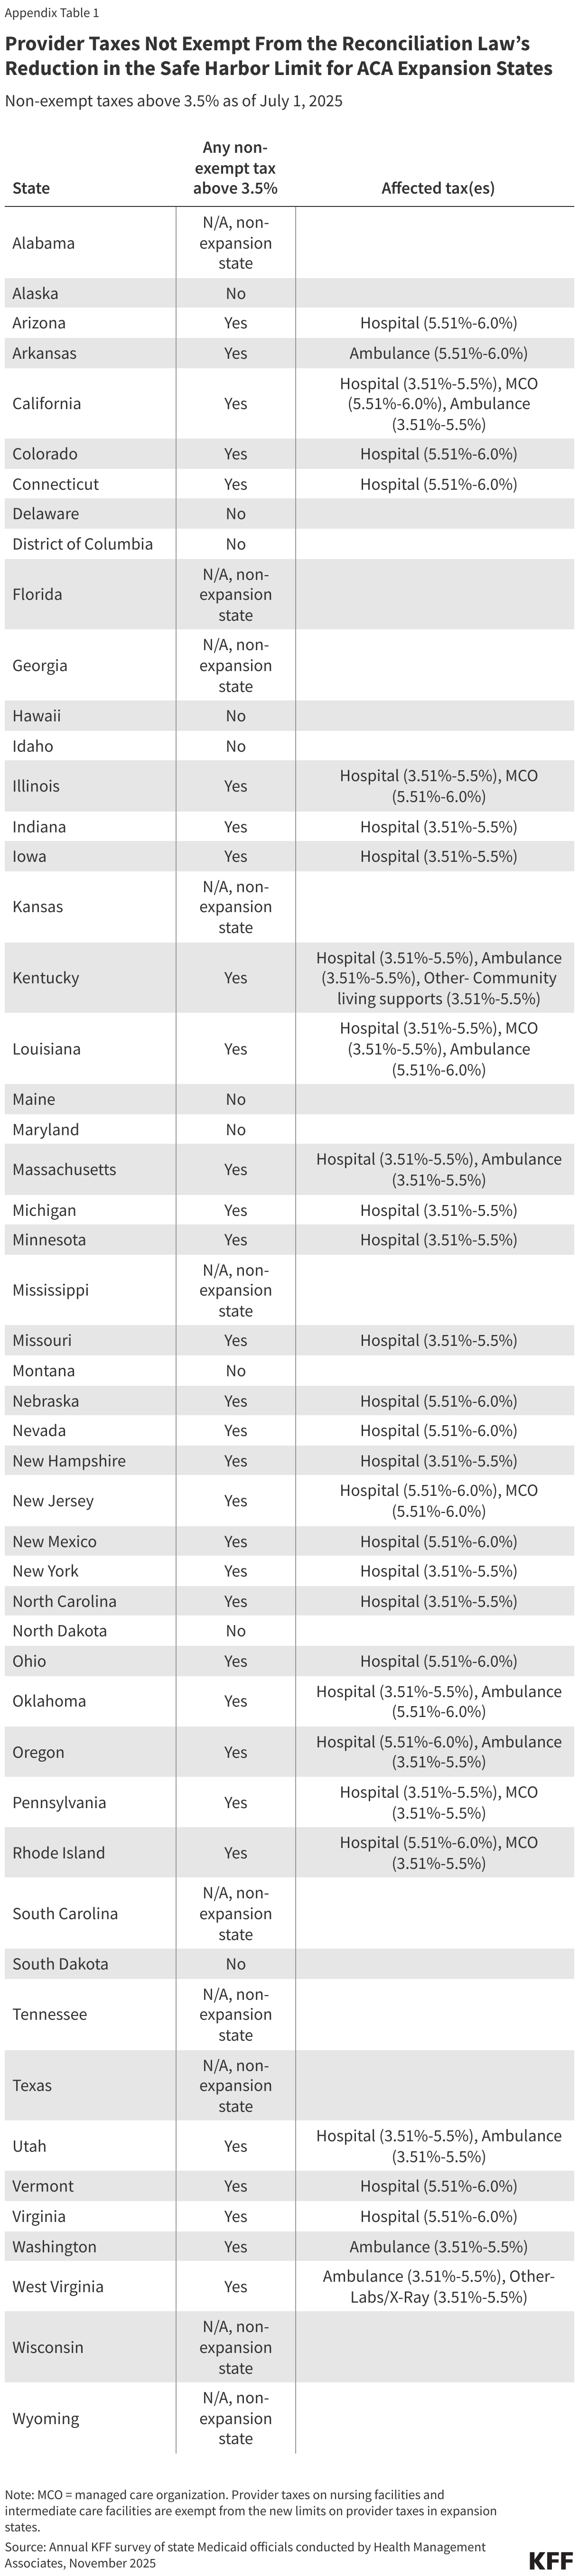
States that have adopted the ACA Medicaid expansion and have certain provider taxes above the new hold harmless limits will face reductions in existing provider tax revenues. KFF data (from 2025) show that an estimated 31 states will have to reduce one or more reported provider taxes because of the lower hold harmless limits in ACA expansion states (Figure 4 and Appendix Table 1). Hospital taxes are the most frequently affected, with 28 of the 31 affected states having a hospital tax over 3.5% of net patient revenues as of July 1, 2025. Over half of the Medicaid provisions in the 2025 reconciliation law apply only to ACA expansion states, including the lower hold harmless limits. Those changes—coupled with lower provider tax revenues—may make it particularly difficult for ACA expansion states to navigate a challenging fiscal climate and increasing numbers of uninsured residents.
If CMS’ proposed regulation is finalized with the new health insurer provider class, additional states will be affected, though it is unclear how many states currently have such taxes in place. CMS’ decision to establish health insurers as a provider class for the purposes of Medicaid provider tax rules means that additional taxes will be subject to new hold harmless limits and in ACA expansion states, additional taxes may be subject to the decreasing hold harmless limits over time.

Medicaid Expansion States With Certain Provider Taxes Above New Limits Will Face Reductions in Provider Tax Revenues (Choropleth map)

5. Which states may need to rework their “uniformity waivers?”

Uniformity waivers have allowed states to waive the requirement that provider taxes be broad-based and uniform if CMS determines that the tax is “generally redistributive.”  Provider taxes established through such waivers have generally taxed some types of providers within a class more heavily than others. States may use uniformity waivers to achieve policy goals such as limiting tax burdens for sole community hospitals, rural hospitals, or other vulnerable providers; but states have also used the waivers to impose taxes primarily on Medicaid providers. The disproportionate taxation of Medicaid providers has raised CMS concerns, including during the Biden Administration, and in May 2025, the Trump Administration released a proposed rule that aimed to address those concerns. The final rule was published on February 2, 2026 (Box 2).

The 2025 reconciliation law prohibits states from using uniformity waivers if the tax charges higher or lower rates based on the volume of Medicaid revenues or patients. The law specifies that taxes may not be considered generally redistributive if the state effectively varies tax rates based on the providers’ Medicaid revenues or patients, even if the tax does not explicitly name “Medicaid” when establishing the tax rates. The requirement is largely targeted at MCO taxes but may also apply to other provider tax types. It is effective as of July 5, 2025, but the Secretary may give states up to three fiscal years to come into compliance. The final rule on uniformity waivers provides states with transition periods that depend on what type of tax the waiver applies to and the most recent date of CMS approval for the waiver. Specifically:

  • For taxes on MCOs with a waiver approval within 2 years of April 3, 2026, states have until the end of the current calendar to transition their taxes (this is expected to be the case in California and at least three other states).
  • For all other taxes on MCOs, states have until the end of FY 2027 (which in most states, means they would need to be complying by July 1, 2027).
  • For taxes on entities other than MCOs, states have through the end of FY 2028 to come into compliance.

States may come into compliance by either submitting a new waiver proposal that meets the new requirements from the final rule (Box 2) or they may otherwise modify their tax such that no waiver is necessary.

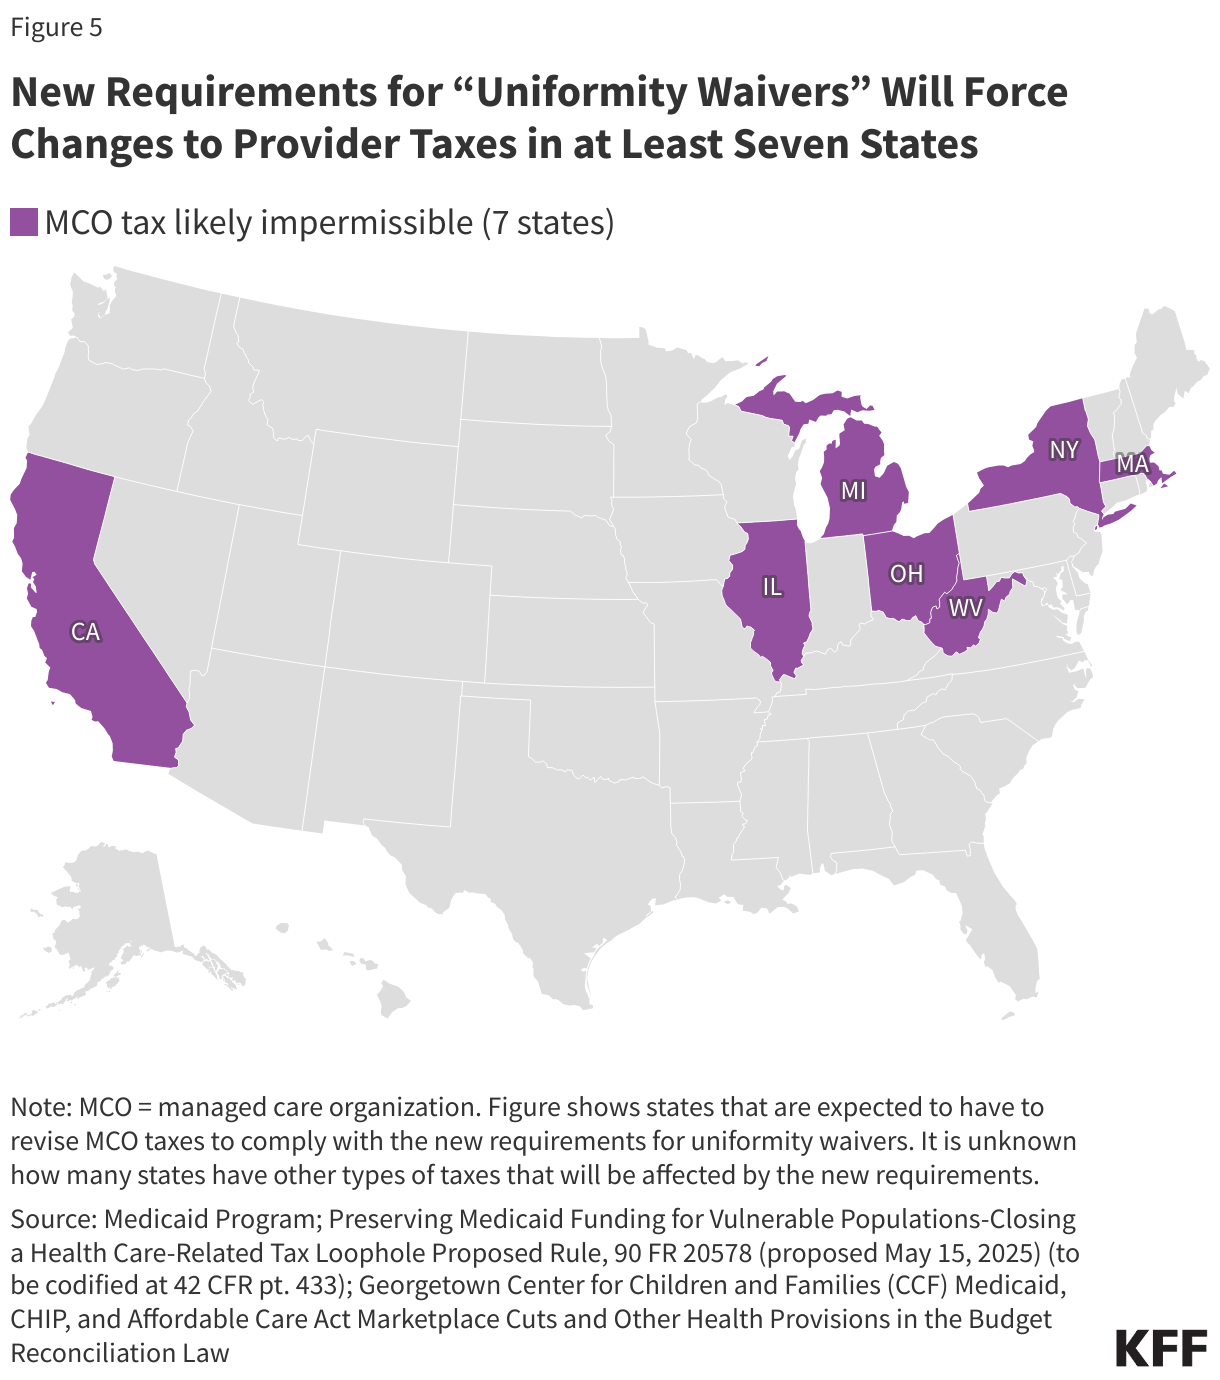
The final rule states that new limits on uniformity waivers will affect at least nine taxes in at least seven states, with effects starting as early as January 1, 2027 (Figure 5). CMS did not identify the specific states in the final rule, but in the proposed rule, CMS specifically named California, Massachusetts, Michigan, and New York as being affected.  KFF and other researchers expect that the other three states are Illinois, Ohio, and West Virginia. The final rule states that existing MCO taxes would now be prohibited in seven states unless the taxes were modified, and that within those seven states, there were at least two additional taxes affected, including one on hospitals and one on nursing homes. However, elsewhere, in the preamble to the final rule, CMS indicated that there were two nursing facility taxes that would now be prohibited. (It’s unclear whether the second nursing facility tax is within the seven states or in an eighth state.) CMS indicates that additional taxes may need to be modified or eliminated, but it is unknown which states have such taxes or what types of providers the taxes pertain to. Beyond uncertainty surrounding the scope of affected taxes, much remains unknown about how states may respond to the new rule.

Box 2: CMS’ Final Rule on Uniformity Waivers

Since 1993, CMS has assessed whether proposed taxes are “generally redistributive” using a statistical formula that assesses whether a state’s tax has a tendency to “derive revenues from taxes imposed on non-Medicaid services in a class and to use these revenues as the State’s share of Medicaid payments” (58 Fed. Reg. 43164, August 13, 1993). Consistent with Section 71117 of the 2025 reconciliation law, the February 2026  final rule prohibits all taxes that have differential tax rates based on Medicaid revenues or patients even if they meet the statistical test. The final rule focuses primarily on managed care organization (MCO) taxes and cited examples where nearly all tax revenues were paid by Medicaid MCOs with private health plans paying nearly none, but notes other types of taxes would also be affected.

New Requirements for “Uniformity Waivers” Will Force Changes to Provider Taxes in at Least Seven States (Choropleth map)

This work was supported in part by Arnold Ventures. KFF maintains full editorial control over all of its policy analysis, polling, and journalism activities.

Provider Taxes Not Exempt From the Reconciliation Law’s Reduction in the Safe Harbor Limit for ACA Expansion States (Table)
News Release

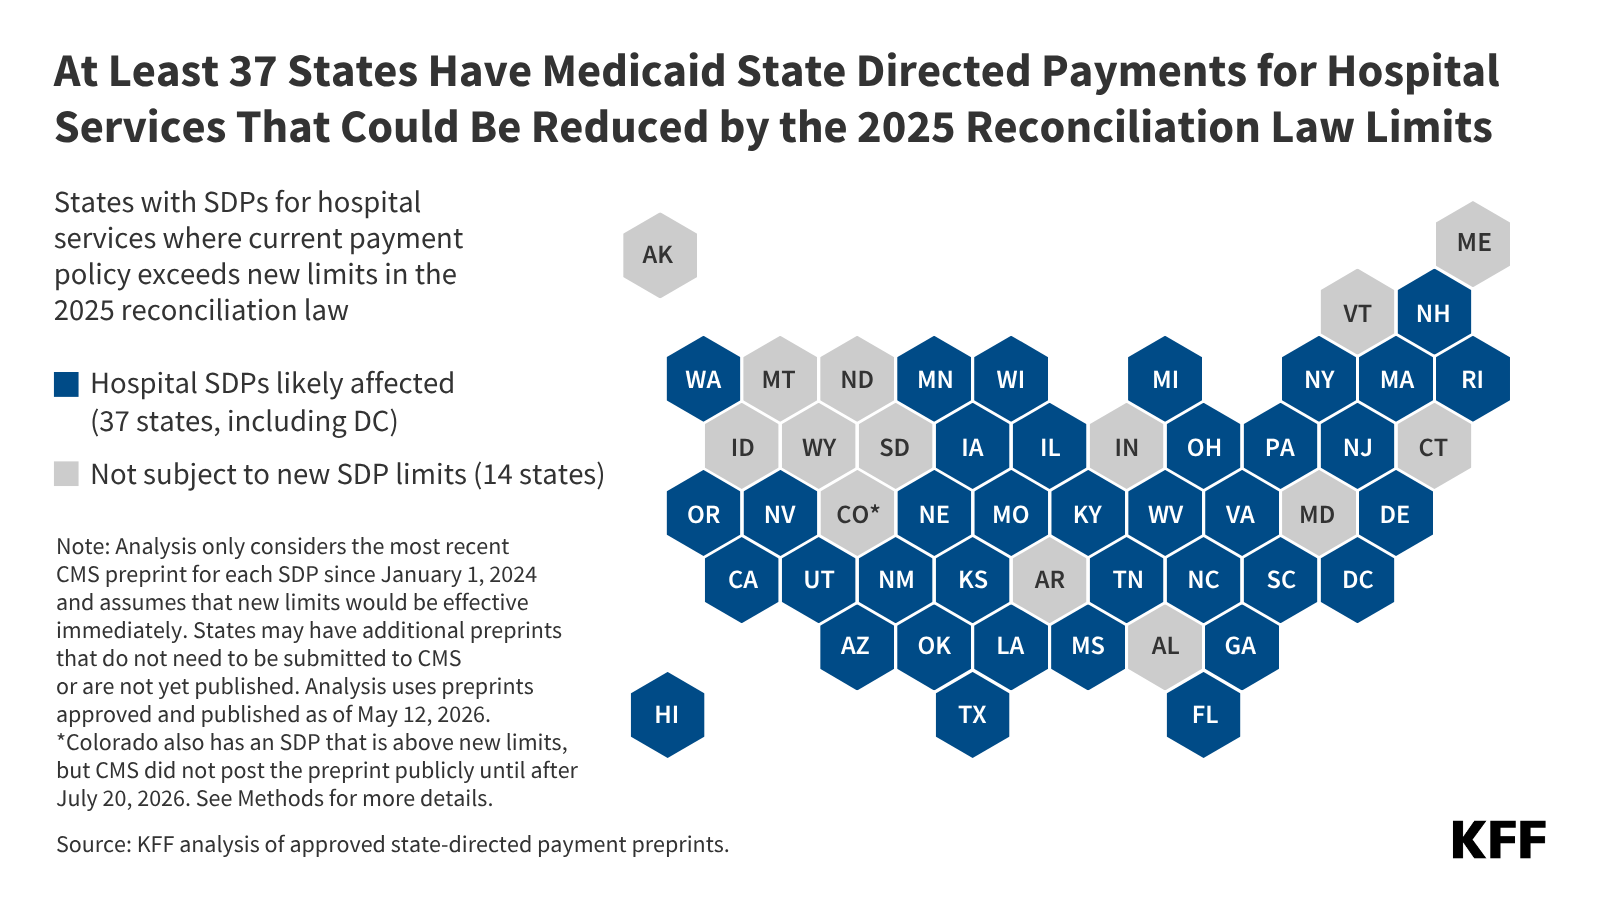
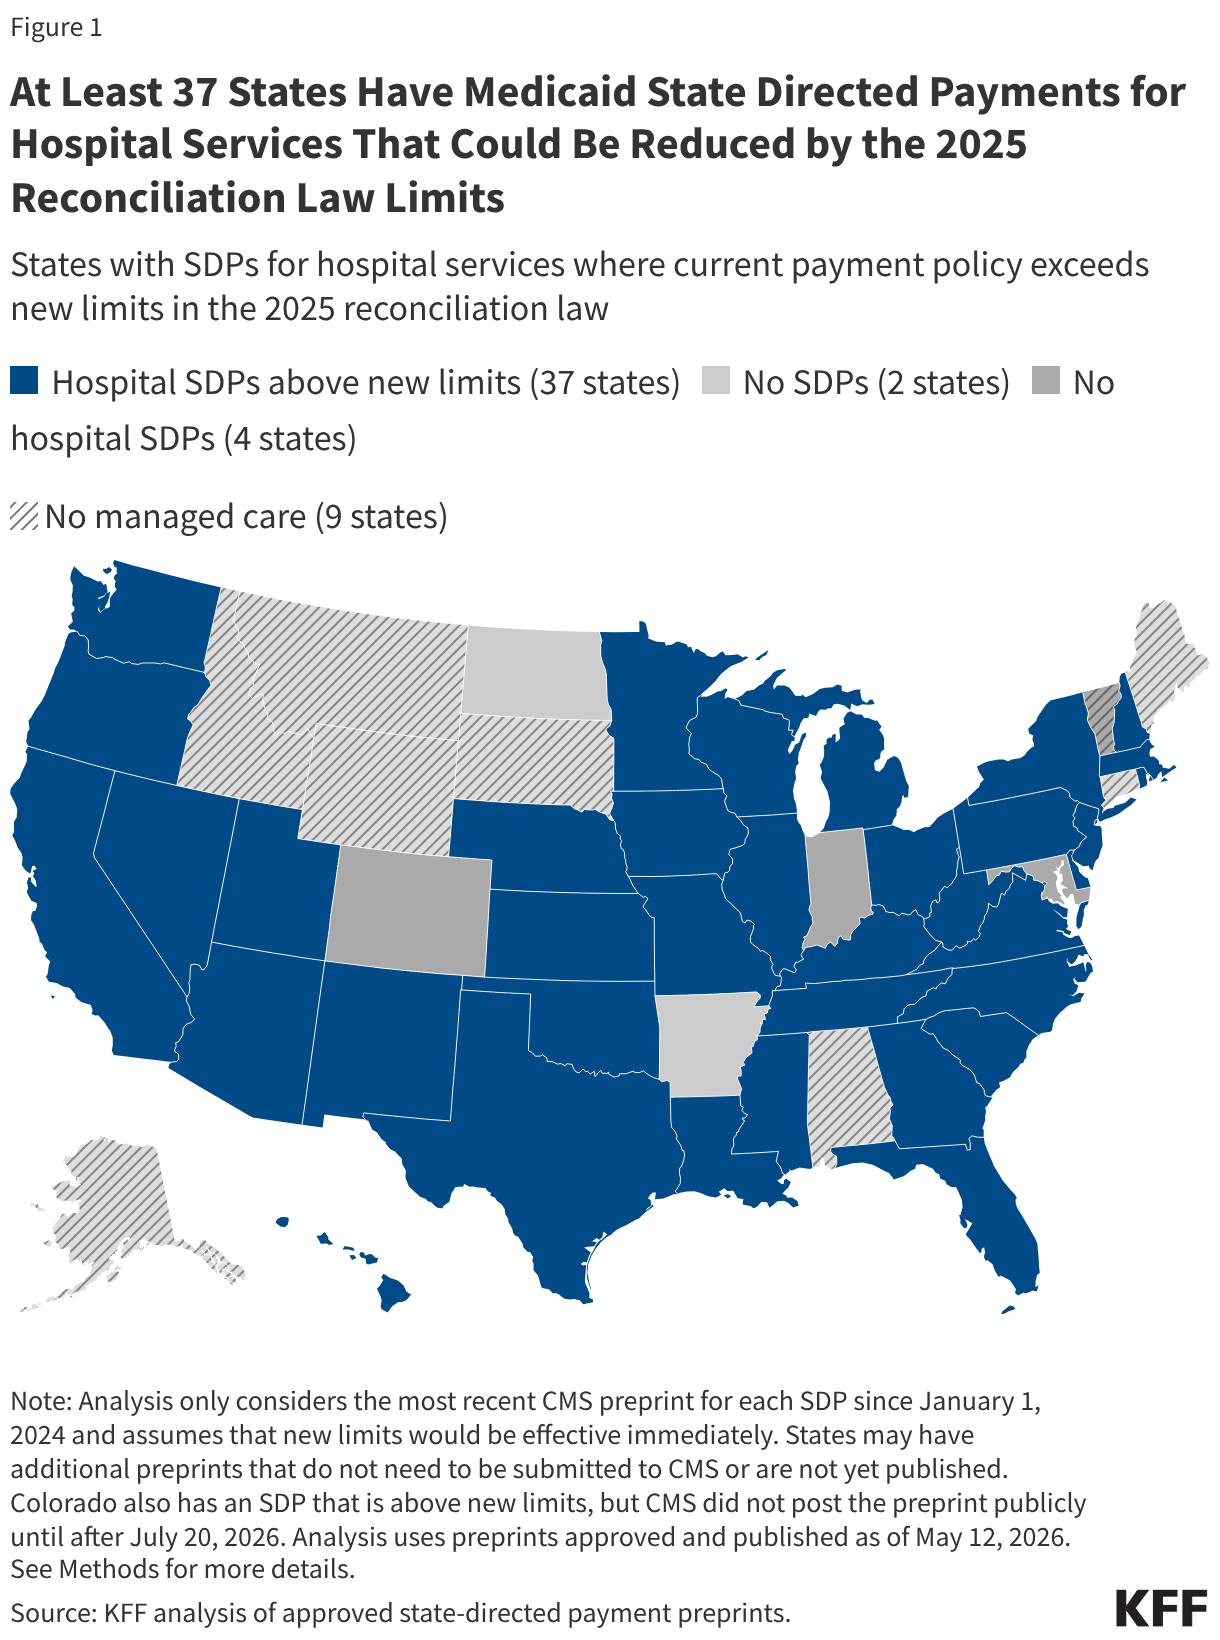
Analysis: At Least 37 States Have Medicaid State Directed Payments for Hospital Services That Could Be Reduced by the 2025 Reconciliation Law Limits

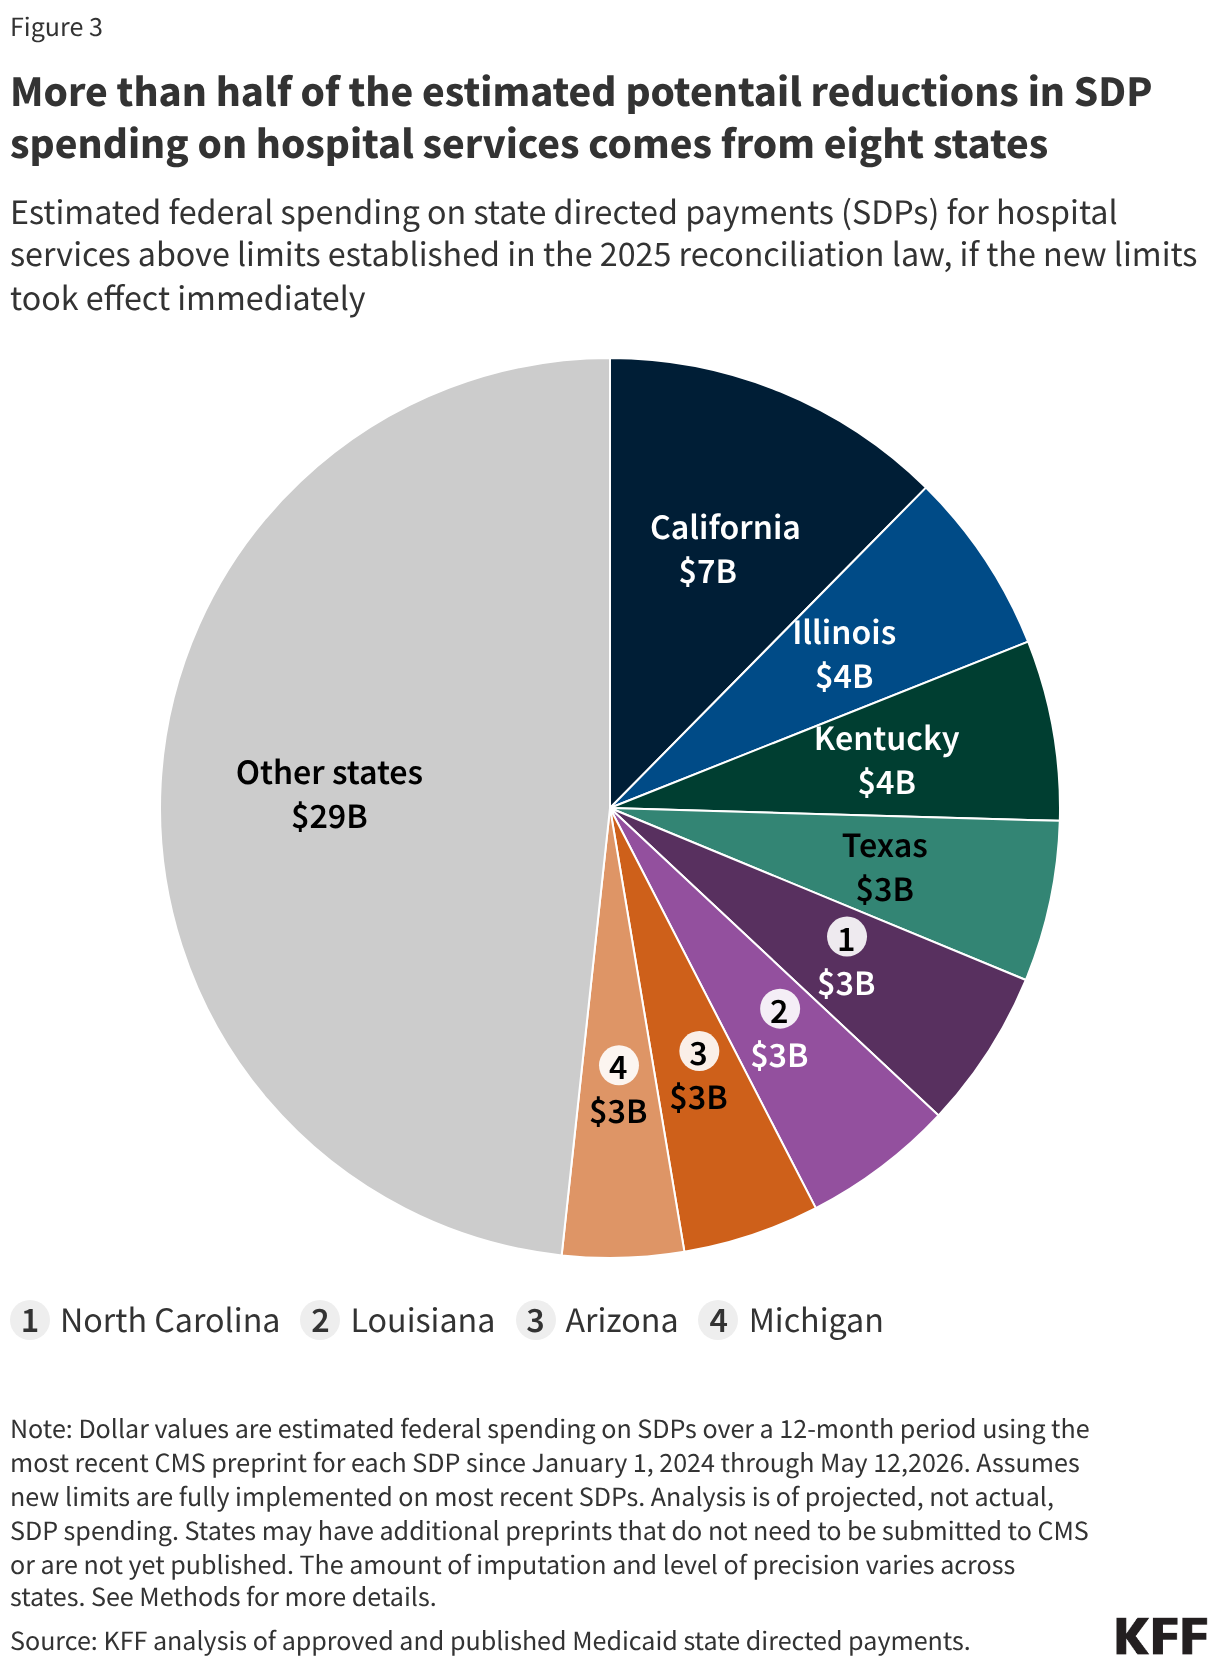
States with the Biggest Potential Reductions in Medicaid Payments to Hospitals Include California, Illinois, Kentucky, Texas, North Carolina, Louisiana, Arizona and Michigan

Published: Aug 14, 2026

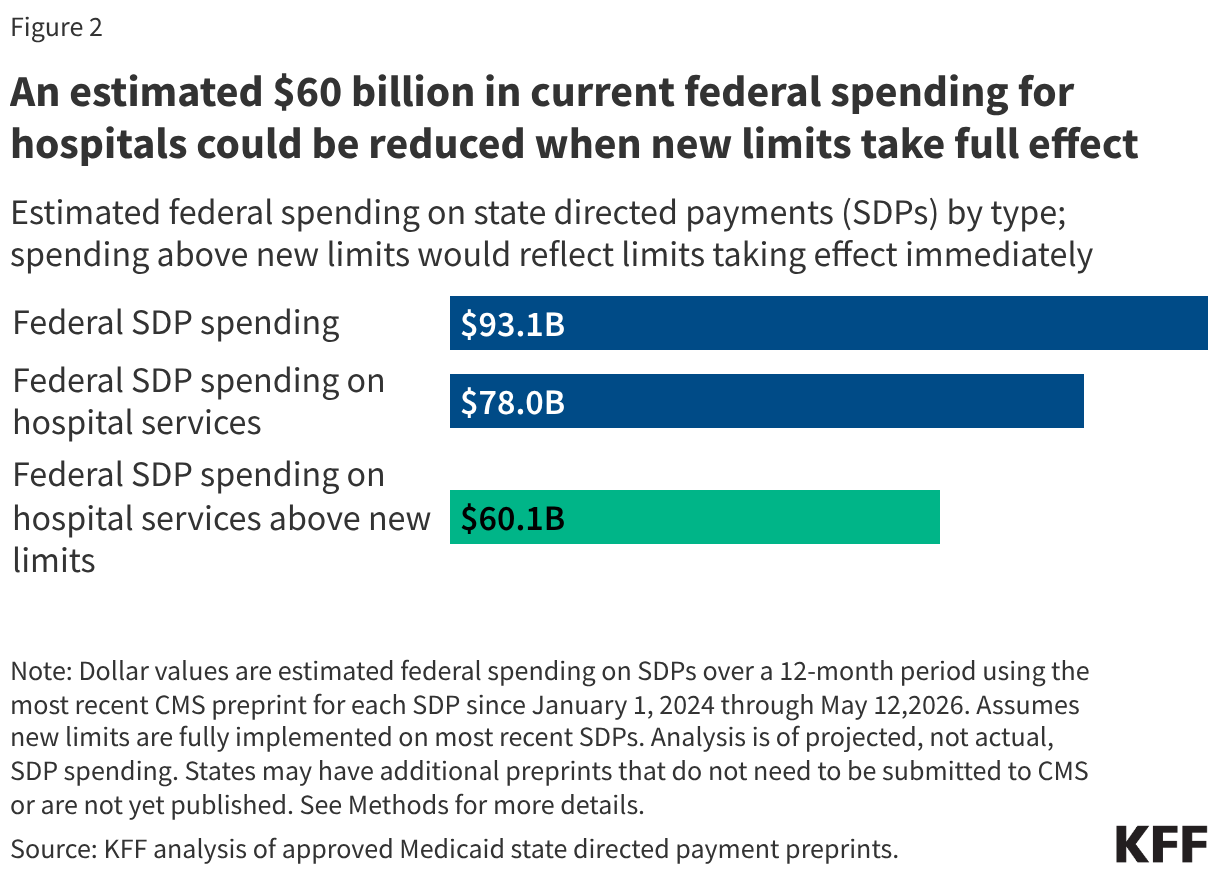
An estimated $60 billion in federal Medicaid spending in 37 states (including the District of Columbia) would likely exceed new federal limits on state directed payments for hospital services once fully implemented, a new KFF analysis finds.

The 2025 reconciliation law made major changes to Medicaid eligibility and financing, including new limits on how much states can direct Medicaid managed-care organizations to pay for certain services, including hospital care.

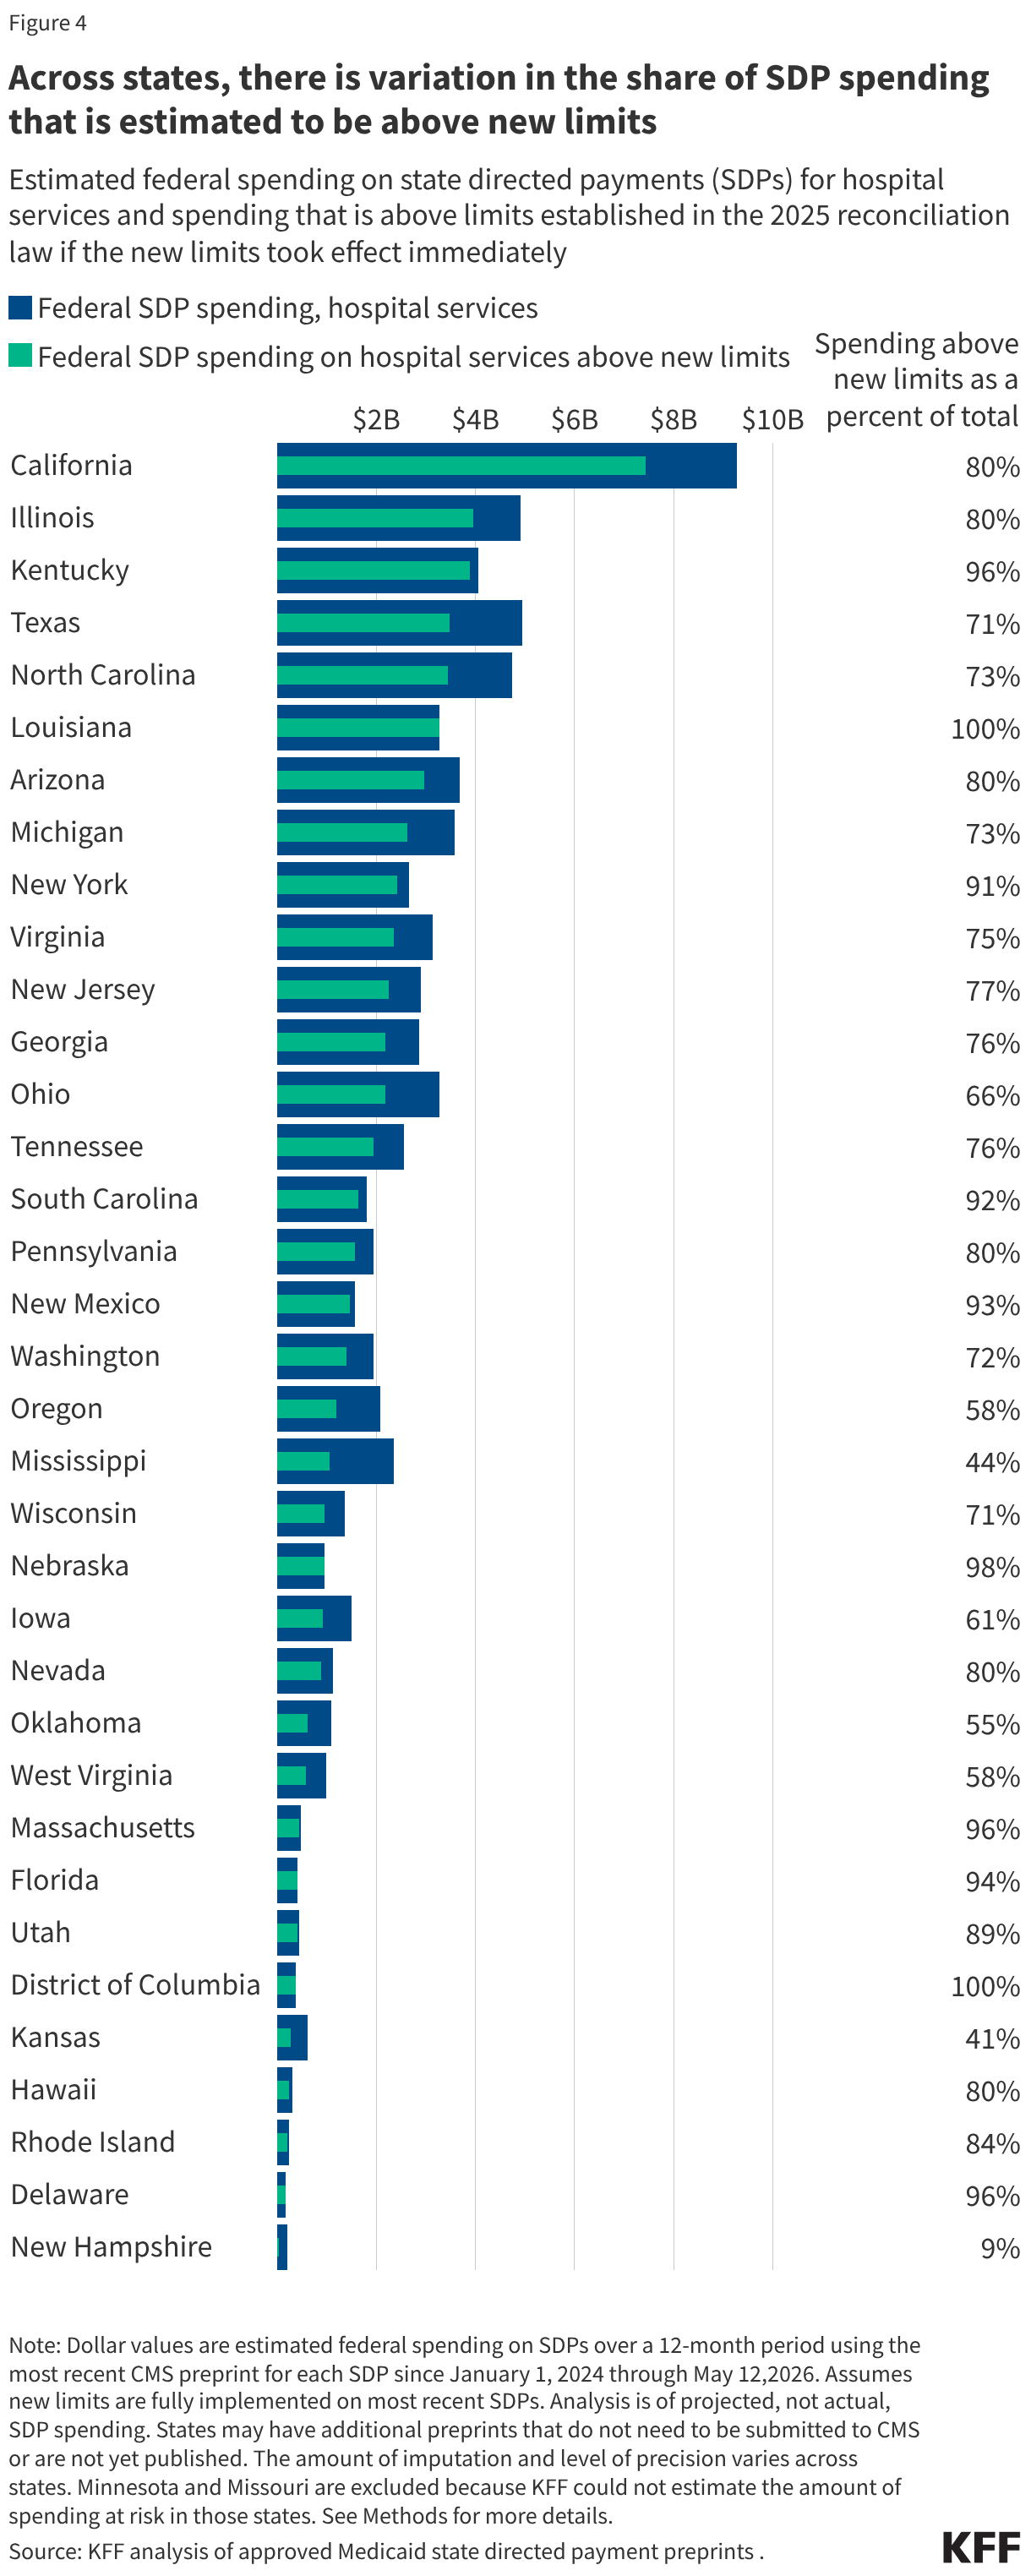
The eight states with the biggest potential reductions in Medicaid payments to hospitals account for half of the total: California ($7.4 billion), Illinois ($4.0 billion), Kentucky ($3.9 billion), Texas ($3.5 billion), North Carolina ($3.4 billion), Louisiana ($3.3 billion), Arizona ($3.0 billion) and Michigan ($2.6 billion).

In the past, states were allowed to direct managed care plans to pay hospitals and other providers up to the average commercial rates for such services. Once implemented, the new law limits such payments in most states to Medicare payment rates, which typically are substantially lower than commercial rates. In the 10 states that have not expanded their Medicaid programs under the Affordable Care Act, payments are capped just above Medicare rates.

The Trump administration in June 2025 issued a proposed rule to implement the change but has not yet finalized those regulations. The analysis assesses the scope of federal funding for hospital services that could be affected once the new limits are fully in place, including insights into how the magnitude of the changes will vary by state.

The estimates do not project actual revenue losses for hospitals annually, which would be affected by other coverage changes, provider tax changes as well as state responses to the new limits.

States with state directed payments that exceed the new limit could take a range of actions in response, including increasing base payment rates for hospital services, though their ability to do so may be limited by other new restrictions on financing mechanisms, such as provider taxes. Hospitals’ ability to absorb reduced payment rates also varies and could pose particular challenges for hospitals with low operating margins, including many rural hospitals and hospitals with relatively large numbers of Medicaid patients.

At Least 37 States Have Medicaid State Directed Payments for Hospital Services That Could Be Reduced by the 2025 Reconciliation Law Limits

Published: Aug 14, 2026

The 2025 reconciliation law reduced federal Medicaid spending by an estimated $911 billion from 2025 through 2034, some of which stems from new restrictions on Medicaid state directed payments (SDPs) for hospital and other health care services. While states are generally prohibited from directing how managed care organizations (MCOs) pay for care, states can implement SDPs that require MCOs to increase rates or set minimum rates for specified Medicaid services. In authorizing SDPs and allowing states to require payments up to the rates paid by private insurers, the Centers for Medicare and Medicaid Services (CMS) aimed to help states improve access to care and provider participation. A 2024 rule on Medicaid managed care that codified rules for SDPs increased states’ use of SPDs and associated federal spending, spurring opponents to argue that private insurance rates were too high a threshold. Many states that contract with MCOs use SDPs to make uniform rate increases that function like supplemental payments in fee-for-service (FFS) Medicaid. This issue brief explores the state-level implications of forthcoming restrictions for SDPs, focusing on SDPs that pay for hospital services because KFF estimates that 84% of SDP spending is directed toward hospital services. Two companion issue briefs provide a summary of forthcoming changes and estimate current SDP spending before forthcoming restrictions take effect.

The analysis estimates the amount of current federal spending on SDPs for hospital services that exceeds the new limits established by the 2025 reconciliation law. In practice, the new limits will be gradually phased in over time for existing SDPs. In some cases, spending on SDPs could also be affected by new limits on provider taxes prior to the SDP limits taking effect, or the two changes will affect SDPs concurrently. The findings of this analysis demonstrate the potential amount of federal funding for hospital services that would be above the new limits (when fully implemented), providing a sense of the eventual magnitude of the changes and how they vary by state. The focus is federal funding because many states finance SDPs through either provider taxes or intergovernmental transfers (IGTs), making it difficult to determine the amount of net revenues health care providers receive. This analysis finds that:

  • At least 37 states have Medicaid state directed payments for hospital services that could be reduced by the 2025 reconciliation law limits based on their current payment policies (Figure 1).
  • An estimated $60 billion in current federal spending for hospital services through SDPs is above new limits and could be reduced when the new limits on SDPs are fully implemented.
  • More than half of the estimated potential reductions in federal SDP spending on hospital services above new limits comes from eight states (CA, IL, KY, TX, NC, LA, AZ and MI).
At Least 37 States Have Medicaid State Directed Payments for Hospital Services That Could Be Reduced by the 2025 Reconciliation Law Limits (Choropleth map)

Among SDPs which started on January 1, 2024 or later and were approved through May 12, 2026, KFF estimates that SDPs with payments for hospital services in 37 states are likely affected by the limits. Of those SDPs, KFF was able to estimate the amount of spending directed to hospitals that exceeded the new payment limits in 131 “preprints” filed by 35 states (see Methods for a description of KFF’s criteria for including preprints in the analysis). Preprints are application forms that document how states direct Medicaid managed care plans to pay providers using SDPs. Preprints are the only national source of data on SDPs but are limited because there are gaps in data provided by the preprints. For example, the preprints include states’ projected spending on SDPs but not actual spending, do not document how total spending is allocated across different services when a single SDP governs payments for multiple services, and omit details about the required payment rates for about half ($39.6 billion) of all hospital spending in this analysis. Such data gaps required KFF to impute missing data in several cases and rely on the best available sources of data in others, contributing to uncertainty in the estimates (see Methods). Although the estimated amounts of spending above new limits are uncertain, there are 37 states with SDPs that pay for hospital services using a rate that is based on average commercial rates. Those SDPs will likely no longer be permissible at current rates under the new law.

The 2025 reconciliation law established new payment limits for SDPs, capping them at or near Medicare rates instead of average commercial rates (ACR). The new limits are set in relation to a “benchmark,” which is a standardized rate that measures MCO rates relative to other payment rates such as Medicaid FFS, Medicare FFS, and average commercial (private) rates. Before the reconciliation law passed, CMS capped SDP payment limits at average commercial rates, which average about double what Medicare pays. (Prior federal rules specified average commercial rates were the limit for hospital services, nursing facility services and professional services at academic medical centers. CMS informally applied the same limit to other services.) Under the reconciliation law limits, SDP payment rates may not exceed 100% of the Medicare payment rate in states that have adopted the Affordable Care Act (ACA) Medicaid expansion (“expansion states”) and 110% of the Medicare payment rate for non-expansion states. In June 2025, CMS released a proposed rule that would implement the new changes.

To estimate the share of hospital spending above new limits, KFF started with estimated SDP spending for hospital services from its prior analysis, which also captured states’ estimated base payment rates for hospital services (e.g., without the SDP) and the final payment rates after accounting for SDPs. As noted in the prior brief, many SDPs indicate the type of benchmark used (e.g., average commercial rates or Medicare rates) but do not provide the payment level (e.g., 100% or 80% of average commercial rates). For hospital services with SDPs benchmarked to commercial rates, KFF estimated the Medicare-equivalent rates using RAND’s state-level inpatient and outpatient ratios of commercial to Medicare rates. KFF compared the base and final payment rates to the Medicare-based limits to estimate the amount of SDP spending that would fall above the new Medicare-related limits when the law is fully implemented (see Methods). Making assumptions about missing payment rate information and about conversions to Medicare rates contributes to the uncertainty of KFF estimates.

New limits on SDPs are likely to decrease Medicaid payments for hospital services in at least 37 states (Figure 1). There are 37 states with SDPs that direct payments for hospital services, all of which have at least one SDP with established payment rates for hospital services estimated to exceed the new limits established by the 2025 reconciliation law. Additional states could be affected by the new limits if there are SDP preprints that CMS has not yet approved or published, and all states are limited in their ability to create new SDPs. Some states may not know whether they will be able to implement planned SDPs. For instance, Colorado submitted an SDP proposal to CMS on June 27, 2025 that would pay hospitals using average commercial rates. The proposal notes that the program could represent an additional $378 million in reimbursements to Colorado hospitals. However, as of July 20, 2026, CMS had not published the preprint on its approved list (although it was posted as of August 11, 2026).

An estimated $60 billion in current federal spending for hospitals through SDPs could be reduced once the new limits take full effect (Figure 2). This represents 64% of federal spending on SDPs and 77% of federal spending on SDPs for hospital services. The $60 billion is an estimate of the amount by which federal payments would currently be above the new limits if those limits were in effect today. It does not represent the amount by which federal payments would be reduced in any given year, since these limits will be phased in over time starting in January 2028 and will fully take effect at different times in different states.

An estimated  billion in current federal spending for hospitals could be reduced when new limits take full effect (Stacked Bars)

The $60 billion in federal SDP spending above new limits does not represent annual estimates of hospitals’ Medicaid revenue losses. Although the new limits on SDPs have major implications for hospital finances, spending above the new limits is not equivalent to the yearly change in revenues hospitals might expect. Actual revenue losses for hospitals could be higher or lower because of interaction with other policy changes and state and hospital behavioral responses:

  • Additional Medicaid policy changes. The 2025 reconciliation law is estimated to reduce federal Medicaid spending by $911 billion, with several policies expected to reduce hospital revenues. For example, changes to provider taxes could affect how states finance the state share of Medicaid. In a proposed rule on the provider tax changes, CMS reports that the changes to SDPs in total (which include providers other than hospitals) are estimated to reduce federal Medicaid spending by $510 billion from 2026-2034, but that $155 billion of those reductions are also part of the reduced spending stemming from changes to provider tax rules. Beyond provider tax changes, hospital revenues will be affected by new work requirements and other provisions that could result in fewer patients being covered by Medicaid, and more people being uninsured.
  • State Medicaid dollars above new limits. New SDP spending limits may also reduce state spending, but this analysis only includes the federal share. The state share is excluded because states fund some or all the state share for SDPs with provider taxes or intergovernmental transfers from entities such as public hospitals. In such cases, it is unclear how much the state share represents new revenues to hospitals in aggregate.
  • Possible offsets from states. States might offset some of the reductions in SDP revenues by increasing base payment rates for hospital services, although their ability to do so may be limited given new restrictions on financing mechanisms like provider taxes.

More than half of the estimated potential reductions in federal SDP spending on hospital services comes from eight states (Figure 3). California ($7.4 billion), Illinois ($4.0 billion), Kentucky ($3.9 billion), Texas ($3.5 billion), North Carolina ($3.4 billion), Louisiana ($3.3 billion), Arizona ($3.0 billion), and Michigan ($2.6 billion) have the largest estimated amounts of federal SDP spending for hospital services above new limits. Although the analysis focused on federal spending, if total spending were instead used, the same eight states would still account for more than half of spending above the new limits. Rhode Island, Delaware, and New Hampshire have the smallest estimated amounts of federal SDP spending for hospital services above new limits (accounting for a combined total of $0.4 billion in federal spending).

More than half of the estimated potential reductions in SDP spending on hospital services comes from eight states (Pie Chart)

The dollar amount of SDP spending above new limits may not indicate which states could have the biggest proportional effects when the law is fully implemented. For instance, although California has the largest estimated amount of hospital SDP spending above new limits, it also had the highest Medicaid spending in 2024. It is possible that other states’ spending over the new limits may account for a larger share of those states’ Medicaid spending. Data for Medicaid hospital spending by state in 2025 and 2026 are not yet available, making it difficult to look at SDP spending as a share of total Medicaid spending across states.

Across states, there is variation in the share of SDP spending that is estimated to be above new limits (Figure 4). Estimated spending above new limits as a share of all hospital SDP spending range from 9% in New Hampshire to 100% in two states (Louisiana and DC). In KFF’s analysis of SDP spending for hospital services above new limits, in 27 states at least 70% of SDP spending for hospital services is above the new limits.

KFF includes Minnesota and Missouri in the 37 states that are likely affected because they both have SDPs that pay for hospital services using a benchmark linked to average commercial rates. However, the preprints for those SDPs did not meet KFF’s inclusion criteria for this analysis because data were insufficient to estimate the amount of spending at risk under the new limits. As a result, Minnesota and Missouri are excluded from the analyses of the amount of SDP spending at risk under the new limits (see Methods).

A key factor in determining how much of the SDP spending exceeds the new payment limits is the level of base payment rates. States with lower base rates may be spending more through SDPs to bring total payment rates up to 100% or 110% of Medicare rates, and therefore, more of the SDP will fall below the new limits established by the 2025 reconciliation law. Conversely, in states where the vast majority of estimated SDP spending exceeds the new limits, base payments are estimated to be at or near the reconciliation law limits.

Hospitals will likely vary in how they are impacted by lower SDP spending, and it is unknown how the new limits will affect access to care among Medicaid enrollees. The effects for specific hospitals will depend on how much they are currently receiving in SDPs, how much their revenues decline as the new limits take effect, the interaction with changes to provider taxes, and how dependent they are on SDP revenues. Effects will vary across states but also within states because states may direct SDPs to a subset of hospitals, or sometimes a single hospital, and among eligible hospitals, SDPs vary with Medicaid patient volume. Hospitals’ ability to absorb reduced payment rates also varies. For hospitals with relatively high operating margins (such as for-profit hospitals and those serving relatively large shares of commercial patients), changes to SDP revenues might be more easily absorbed. On the other hand, hospitals with relatively low operating margins (like rural hospitals and those serving relatively large shares of Medicaid patients) may adapt in ways that affect Medicaid enrollees’ access to care, such as by cutting service lines or closing.

Across states, there is variation in the share of SDP spending that is estimated to be above new limits (Bullet Bars)

This work was supported in part by Arnold Ventures. KFF maintains full editorial control over all of its policy analysis, polling, and journalism activities.

Patrick Drake, an independent consultant, contributed to the analysis of SDP data.

KFF appreciates the contributions of external reviewers who provided comments on earlier versions of this analysis.

Methods

Data source: This analysis uses data available from the list of approved state directed payment preprints published by the Centers for Medicare and Medicaid Services (CMS) as of May 12, 2026. The approved state directed payment (SDP) preprints are PDF versions of forms that are completed by states and approved by CMS. States are required to seek approval using such a preprint for any SDP that requires managed care organizations (MCOs) to pay for services at any rate other than fee-for-service (FFS) Medicare or Medicaid rates. The approved preprints are often posted online 6–12 months after their start date, although some approved preprints are posted online much later.

KFF developed a Python script to download the available PDFs, extract relevant data from them, and standardize certain fields. Each preprint was turned into one row in a spreadsheet. Data from tables within the preprint were extracted and converted into separate tables in KFF’s data file with each row in the preprint table converted into a row in the spreadsheet table.

SDP preprint inclusion criteria: KFF included all SDPs in the analysis with a rating period start date of January 1, 2024, onward for the 50 states and Washington DC (hereafter referred to as a state). Puerto Rico was the only territory that had published SDPs, which were excluded. In each case, KFF only kept the most recent preprint for any given SDP. For example, if an SDP had an initial approval in 2024 and then renewals in 2025 and 2026, KFF would only include the 2026 renewal in the final dataset. Out of the 304 preprints included in this analysis, 23 (totaling $8.6 billion in federal spending) ended in calendar year 2024.

A small number of SDP preprints were excluded due to file formatting or data validity issues. Specifically:

  • Data from five preprints were encoded differently, so the data could not be programmatically extracted into the dataset and were therefore excluded from the analysis (two from New Hampshire, one from Ohio, and two from Florida, totaling $89 million in federal spending for one year).
  • Data from preprints that had obvious data quality issues were excluded from this sample. For instance, two were from Illinois (which projected total annual spending of more than $100 billion) while one from Minnesota did not report spending data in the preprint.

KFF also reviewed all preprints with end dates prior to July 1, 2025, and excluded preprints for the following reasons.

  • The preprint was likely funded from COVID-19 relief dollars (including the increased federal funding for home care from the American Rescue Plan Act) and so unlikely to still be in place.
  • The preprint was likely combined into a different preprint when renewed or was otherwise renamed when renewed.
  • The preprint ended in 2024, and online research suggests that the payment was discontinued.

For purposes of identifying which states are likely affected by new limits, KFF manually reviewed SDPs in Minnesota and Missouri, which were the only two states with at least one preprint directed to hospital services but which did not meet the inclusion criteria. Upon review, KFF determined that preprints for hospital services in these states would also likely be affected.

See Methods Table 1 for a list of the inclusion criteria, the counts of preprints after each criterion was applied, and the federal spending for preprints that were retained at each stage.

Calculating total spending on SDPs: This analysis used the states’ projected total, federal, and state spending from the preprint. Most preprints are for a one-year period, but some are for longer or shorter periods. In such cases, KFF adjusted the data to be a one-year equivalent. When preprints were for periods shorter than 12 months, dollars were scaled up (e.g., if the preprint was for 6 months, the spending was multiplied by two) and for preprints that were for periods longer than 12 months, spending was scaled down (e.g., retaining two-thirds of spending if the preprint extended for 18 months).

KFF also manually reviewed the federal spending numbers because some states reported them as percentages of total spending and others reported them as dollar amounts. Manual review ensured the Python script had adequately handled the different reporting structures.

Calculating SDP spending by service type: For preprints that made payments for multiple service types (which accounted for $32.4 billion in federal spending), spending was apportioned across service types.

  • For SDPs directed to hospital and non-hospital services, 90% of spending was allocated to hospital services.
  • For SDPs directed to both inpatient and outpatient hospital services, 68% of hospital spending was allocated to inpatient services and 32% was allocated to outpatient services. Distinguishing between the two is important because states sometimes use different benchmark rates for each.

Apportioning spending across service types is difficult, and KFF used a variety of sources to develop the most realistic assumptions feasible. KFF analyzed data on Medicaid spending, including CMS-64 spending by service type, data on Medicaid spending by service type from the National Health Expenditures, the Congressional Budget Office Medicaid baseline, and existing studies on hospital payment policies such as those from the Medicaid and CHIP Payment and Access Commission (MACPAC). All of those data points suggest that the vast majority of SDP spending pays for hospital services, and $53.1 billion out of the $60.5 billion in federal spending from preprints directed to a single provider type went to hospital services. KFF also strove to use an assumption that resulted in estimates of hospital SDP spending that are similar to what could be expected on the basis of other data and research as described above.

When identifying the service types in the preprints, the Python script attempted to align service types between preprint Table 2 (which specifies payment rates for sets of providers) and preprint Question 20 (a checklist of services included in the SDP). In many cases, this alignment involved some uncertainty, requiring manual review and classification of service types.

Identifying benchmarks for MCO payments: The most common type of SDPs requires MCOs to make payments that are on top of the regular base payment rate (as opposed to limiting or replacing the negotiated rate). In such cases, payments are measured using a “benchmark” or standardized rate to compare the MCO rates to other payment rates, such as those of Medicaid FFS, Medicare FFS, or the average among commercial payers (“average commercial rates”). KFF used the Python script to identify the applicable benchmark type from the preprint but also manually reviewed the data since states sometimes used inconsistent terminology to report the same benchmarks.

Identifying payment levels: To identify how current payment rates align with the new limits on SDPs in the reconciliation law, KFF first needed to identify payment levels in the preprints. The level is specified as a percentage of the benchmark (e.g., 90% of average commercial rates or 140% of Medicare rates). Both types of payments were pulled from Table 2 when available. Payment rates for inpatient and outpatient hospital services were tracked separately with each row in Table 2 when applicable.

Hospital analysis: The methods above were used in a previous KFF analysis to estimate current SDP spending before new limits take effect. Additional methods below were incorporated into this analysis.

Hospital analysis inclusion criteria: For the analysis of how SDP spending levels align with new limits on SDPs in the 2025 reconciliation law, KFF further limited the analysis to:

  • SDPs with inpatient or outpatient hospital services as a service type in Question 20,
  • Those required to report a benchmark, and
  • Those benchmarked to Medicare or average commercial rates.

Of the 131 preprints included in the hospital spending analysis (accounting for $78.0 billion in federal spending on hospital services), 35 did not include payment levels in Table 2 (accounting for $39.6 billion in federal spending on hospital services). Payment rates were missing for the relevant preprints because states left Table 2 incomplete and instead noted that rates were reported in attached addendums, which CMS generally does not make publicly available (some rate description addendums were at the end of the preprint, but they were not included in this analysis because they were not in a machine-readable format). KFF submitted a Freedom of Information Act request to access the addendum data on August 25, 2025, but, as of July 21, 2026, had not received the addendums or any information about whether the addendums would be available or the timing of their availability.

Comparing payment levels to new limits in the 2025 reconciliation law. In cases where rates were benchmarked to commercial rates, KFF first converted the rates to a Medicare-equivalent rate using state inpatient and outpatient commercial-to-Medicare price ratios from the 2024 RAND Price Transparency Study. The RAND price ratios are approximations, and actual commercial-to-Medicare price ratios may be higher or lower than what was used in the KFF analysis. For instance, RAND price ratios were derived from claims data from 2020–2022, and so may have changed between then and the sample period. RAND price ratios were also based on a sample of claims and are higher than some from other estimates at a national level, but have been used by other researchers to analyze state directed payments.

For SDP preprints that were missing the payment level, KFF estimated the payment rates for hospital services using the payment levels in other preprints. KFF first created national and state-specific (when possible) median payment rates for the following measures:

  • Inpatient rates among SDP preprints that are benchmarked to average commercial rates and Medicare rates, and
  • Outpatient rates among SDP preprints that are benchmarked to average commercial rates and Medicare rates

Where feasible, the analysis used the applicable state-specific rate (eight states—Georgia, Kentucky, Louisiana, New Mexico, Nevada, New York, Pennsylvania, and Washington). In other cases, the analysis used the applicable national rate (six states—Arizona, California, Hawaii, Illinois, Texas, and Wisconsin). Additionally, for North Carolina, KFF used the state-specific rate for outpatient services and the national rate for inpatient services. KFF’s imputed benchmark rates were more conservative than a RAND analysis of SDPs, in which all missing rates benchmarked to commercial rates are assumed to be 100% of average commercial rates.  For the remaining states, KFF had complete payment rate information from the preprints.

Estimating spending on hospital services above new limits: When the total payment rate (accounting for base payments and the SDP) was below the new limit (100% in expansion states or 110% in non-expansion states; expansion status was pulled from KFF’s Status of State Medicaid Expansion Decision tracker), the SDP was assumed to already be under the new limit and so would not need to be reduced. This was the case for 27 preprints, representing $2.2 billion in federal hospital spending. All other SDPs were assumed to be affected. When the base rate was above the new limit, 100% of the SDP was estimated to be above the new limit (this was the case in 50 SDPs, accounting for $15.0 billion in federal hospital spending).

For SDPs where the base rate was below the new limit, but the total rate of the SDP was above the new limit (a little less than half of preprints in the sample), KFF estimated the amount of federal spending above new limits as detailed below and in Formula 1.

  1. The calculation was done separately for each provider row in Table 2, using the federal spending apportioned to each service line (as described above in “Calculating SDP spending by service type”) to calculate the estimated spending above new limits.
  2. KFF estimated the difference between the total rate and the maximum rate allowed under the 2025 reconciliation law (both measured relative to Medicare payment rates, as described above), which represents the “portion of increase from the SDP above limit.”
  3. KFF also estimated the difference between the total rate and the base rate, which represents the “increase from SDP.”
  4. Those two rates were used to estimate the percentage of the SDP spending that would be above new limits.
  5. That share was multiplied by the “apportioned federal spending” for the specific service line (i.e., the amount of SDP spending calculated by service type) to estimate the amount of SDP spending above new limits.
  6.  The total rate comes from the “Total Payment Level” column of Table 2 (converted into a Medicare-equivalent rate when benchmarked to ACR) and the base rate comes from the “Average Base Payment Level from Plans to Providers” column (converted into a Medicare-equivalent rate when benchmarked to ACR).

Formula 1:

Appendix Table 1
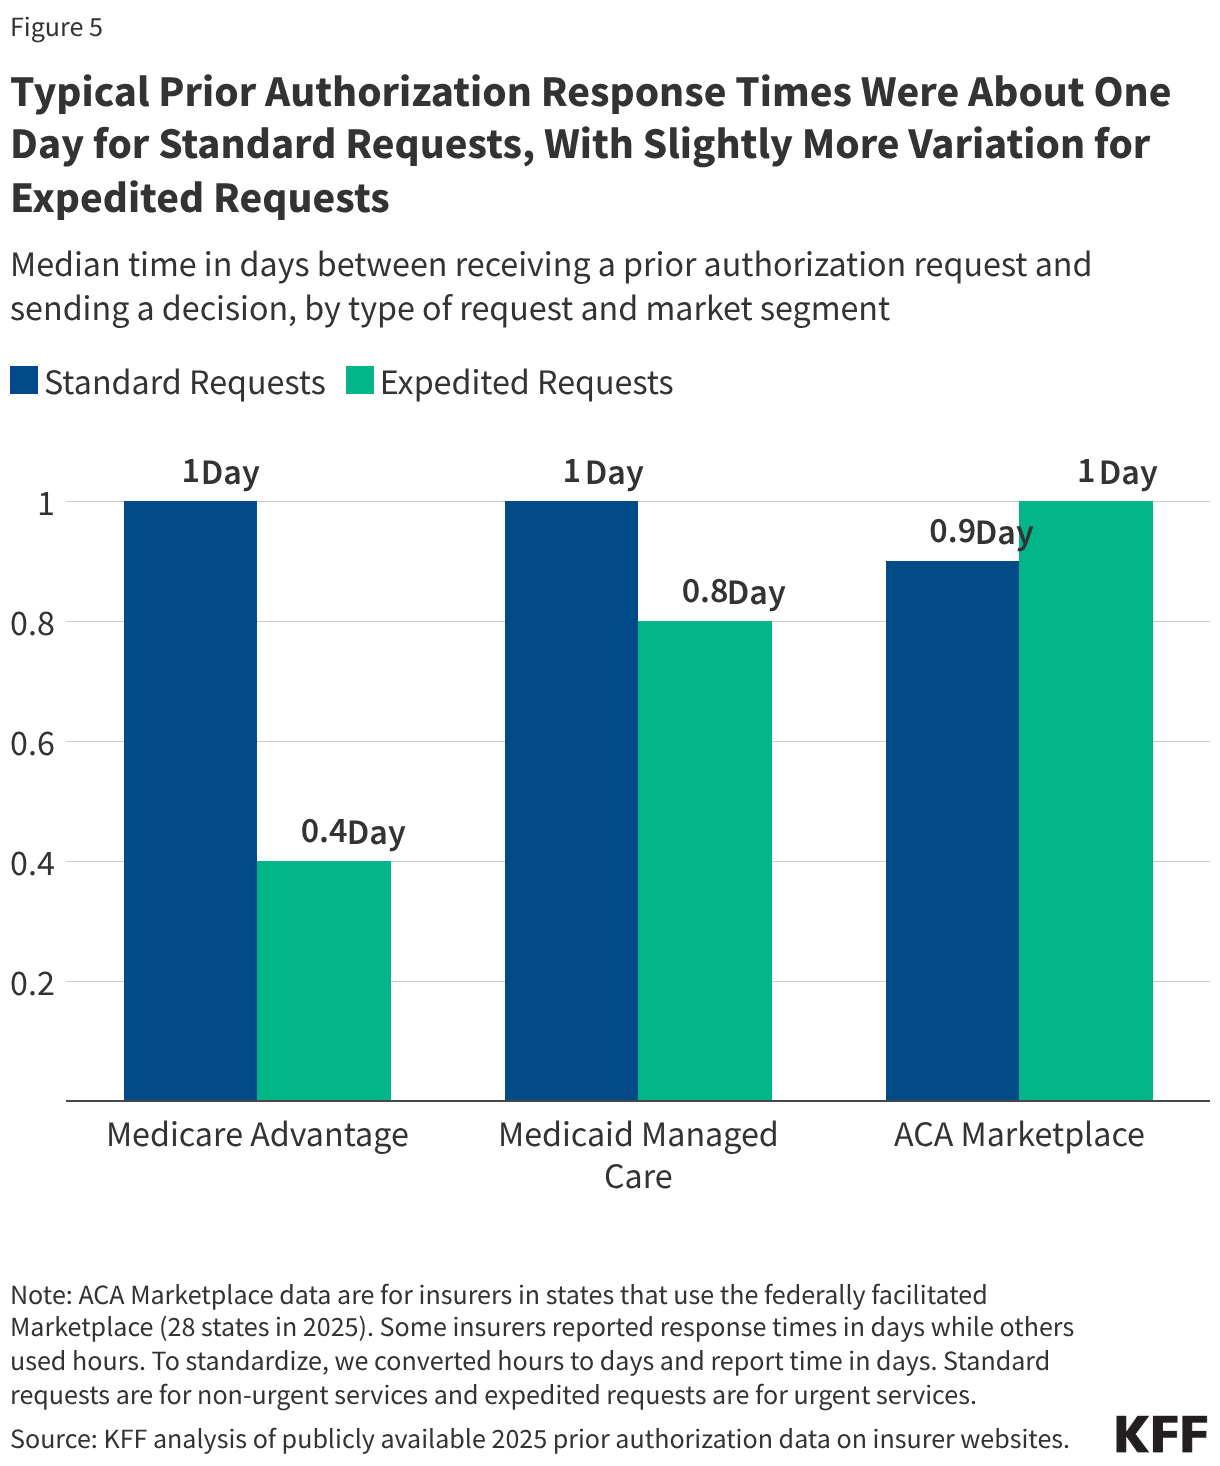
Analysis StepCount of PreprintsFederal Spending Among Preprints (billion $)Federal Hospital Spending Among Preprints (billion $)Notes
Preprints listed on CMS’s website as of May 12, 20261,038 


All preprints pulled from CMS website987246.4202.1Some links are broken or duplicates
Preprints in time period and states570 
166.1
 
137.8Includes the preprint for each state directed payment (SDP) from January 2024 onward for the 50 states and DC
Most recent SDP submission or renewal35899.682.2Limits to the most recent preprint where the sample previous included renewals
Preprints without data quality issues35299.682.2KFF dropped preprints that were missing information about the start date, end date, spending amounts, etc.
Preprints manually reviewed and dropped (sample for previous KFF analysis)30593.178.0KFF dropped preprints from older years that were subsumed into newer preprints and those that were temporary policies started during the COVID-19 pandemic
Include hospital services13987.978.0


Preprints that require a benchmark13380.177.8Benchmarks are only required for SDPs that require managed care organizations to make payments that are on top of the negotiated rates.
Use Medicare or average commercial rates as benchmark13180.177.8


Optional Medicaid and CHIP Coverage for Lawfully Present Immigrant Children Could Mitigate Coverage Losses Due to 2025 Reconciliation Law

Authors: Carlos Cruz, Drishti Pillai, and Samantha Artiga
Published: Aug 14, 2026

Summary

Actions taken by the Trump administration and Congress will likely have major impacts on health and health care for immigrant families, including reducing the number of lawfully present immigrants eligible for federally funded health coverage under the 2025 reconciliation law. While undocumented immigrants have already been ineligible for federally funded health coverage, the law newly limits Medicaid and Children’s Health Insurance Program (CHIP), subsidized Affordable Care Act (ACA) Marketplace, and Medicare coverage to lawfully present immigrants who are lawful permanent residents (LPRs) or green card holders, certain Cuban or Haitian immigrants, and people residing in the U.S. under Compacts of Free Association (COFA). As such, many lawfully present immigrants, including humanitarian immigrants, such as refugees and asylees, will become ineligible for coverage. However, the law does not eliminate optional Medicaid and CHIP coverage under the Immigrant Children’s Health Improvement Act (ICHIA) for lawfully residing children and pregnant people. This option allows a state to cover a broader group of lawfully present immigrants who meet income and other eligibility requirements. As such, ICHIA coverage could help mitigate potential coverage losses for lawfully present immigrant children and pregnant people.

This brief provides an overview of health coverage of noncitizen children based on KFF analysis of 2024 American Community Survey (ACS) data to provide greater insight into the potential role of ICHIA coverage in limiting the law’s impact on coverage for lawfully present immigrant children. While there are few noncitizen children in the U.S. overall, their access to health coverage has important implications for their health and well-being, including their long-term health and economic stability as adults. Although states can also use ICHIA to expand coverage for lawfully present immigrant pregnant people, this analysis does not include this group since they cannot be separately identified in ACS data. Similarly, the analysis includes all noncitizen children rather than just lawfully present immigrant children, because the data do not provide information on immigration status. However, separate research suggests there are very few undocumented children in the U.S. overall. Key takeaways include the following:

  • As of April 2026, 38 states have implemented ICHIA coverage for lawfully residing immigrant children, and over nine in ten (92%) of the approximately 2.6 million noncitizen children in the U.S. live in a state with ICHIA coverage for children.
  • Noncitizen children are more likely to be uninsured than citizen children. Recent noncitizen children in the U.S. for less than five years are at the highest risk of being uninsured, with 28% lacking coverage compared to 22% of their longer-term noncitizen counterparts and 5% of citizens.
  • The uninsured rate for noncitizen children living in states that have adopted ICHIA coverage for children is lower compared to the rate for noncitizen children living in states that have not (25% vs 37%), likely reflecting a combination of ICHIA coverage and other more expansive coverage policies in these states.

Together, the data show that Medicaid, CHIP, and other public coverage help reduce uninsured rates for noncitizen children, particularly recent noncitizen children living in ICHIA states. Maintaining ICHIA coverage could help mitigate coverage losses for lawfully present immigrant children as the 2025 reconciliation law eligibility restrictions go into effect. Additionally, implementation of ICHIA coverage in the states that have not yet adopted it or that have room to expand it for either children or pregnant people could further limit coverage losses. Even with ICHIA coverage in place, outreach and communication to families and effective processes to screen individuals for eligibility under the option will be important for preventing administrative coverage losses among those eligible as new restrictions are implemented.

Medicaid and CHIP Coverage Under the ICHIA Option

Prior to the 2025 reconciliation law, undocumented immigrants were already ineligible for Medicaid, CHIP, and other federally funded coverage, and lawfully present immigrants faced eligibility restrictions for Medicaid and CHIP. In 1996, the Personal Responsibility and Work Opportunity Reconciliation Act limited Medicaid and CHIP eligibility to certain groups of lawfully present immigrants deemed to have a “qualified status” and required many of these groups to wait at least five years before they could enroll even if they met other eligibility criteria (Table 1). As such, many lawfully present immigrants faced a five-year waiting period for coverage and others remained ineligible regardless of their length of time in the country, although some groups were exempt from the five-year waiting period. Lawfully present immigrants were eligible for ACA Marketplace coverage with subsidies to offset the cost of this coverage during their five-year waiting period for Medicaid or CHIP.

Table 1: Lawfully Present Immigrants by Qualified Status
Lawfully Present Immigrants With
“Qualified Status”
Lawfully Present Immigrants Without
“Qualified Status”
• Lawful permanent resident (LPR or green card holder)
• Refugee
• Asylee
• Cuban/Haitian entrant
• Paroled into the U.S. for at least one year
• Conditional entrant granted before 1980
• Granted withholding of deportation
• Battered noncitizen, spouse, child, or parent
• Victims of trafficking and their spouse, child, sibling, or parent or individuals with pending application for a victim of trafficking visa
• Member of a federally recognized Indian tribe or American Indian born in Canada
• Citizens of the Marshall Islands, Micronesia, and Palau who are living in one of the U.S. states or territories (referred to as Compact of Free Association or COFA migrants)
• Granted Withholding of Deportation or Withholding of Removal, under the immigration laws or under the Convention against Torture (CAT)
• Individual with Non-Immigrant Status, includes worker visas, student visas, U-visa, and other visas, and citizens of Micronesia, the Marshall Islands, and Palau
• Temporary Protected Status (TPS)
• Deferred Enforced Departure (DED)
• Deferred Action Status
• Lawful Temporary Resident
• Administrative order staying removal issued by the Department of Homeland Security
• Resident of American Samoa
• Applicants for certain statuses
• People with certain statuses who have employment authorization

Since 2009, states have had the option to expand Medicaid and CHIP coverage for lawfully residing children and pregnant people under ICHIA. This option extends eligibility to lawfully residing children and/or pregnant people beyond those with “qualified status” and eliminates the five-year waiting period for coverage. As of April 2026, 38 states including DC have taken up this option for children and pregnant people or for children only and 2 states have taken it up for pregnant people only (Figure 1).Most states that have taken up ICHIA for children have taken up other coverage expansion options. These include options such as the ACA Medicaid expansion to low-income adults and fully state-funded coverage for certain groups of immigrants, such as children, regardless of immigration status (Appendix Table 1.)
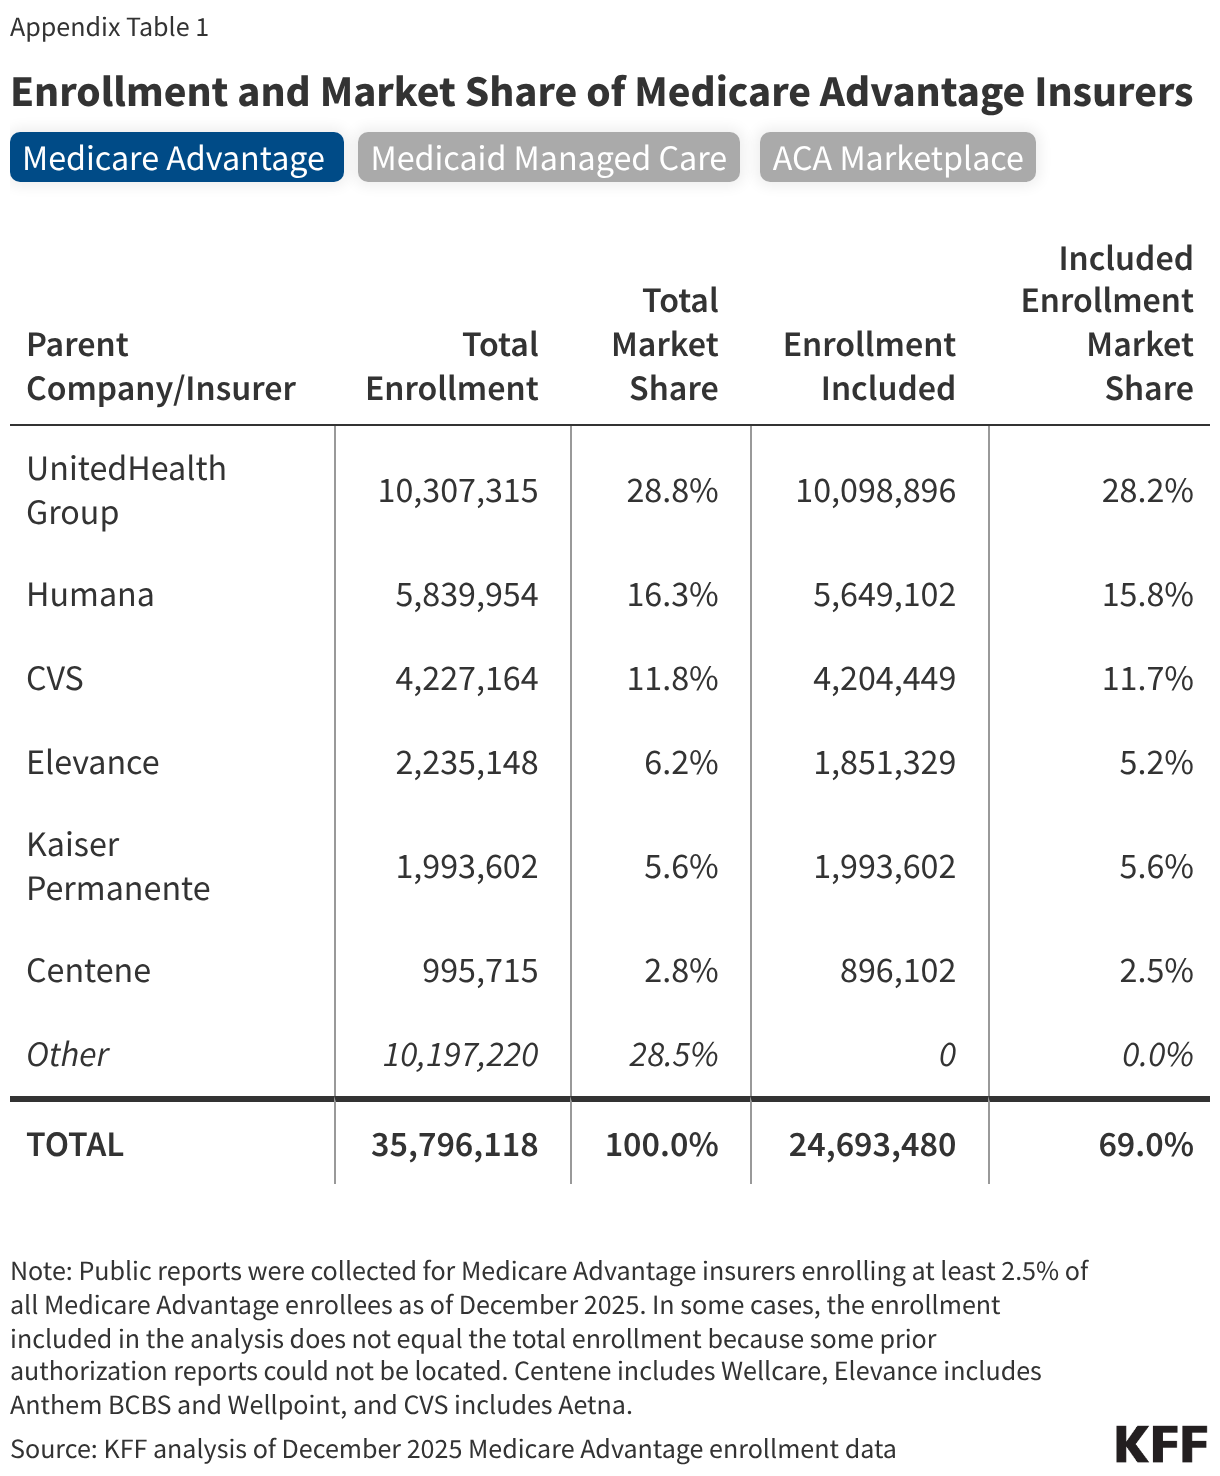
Most States Have Expanded Coverage to Lawfully Residing Immigrant Children (Choropleth map)

Health Coverage Among Noncitizen Children

As of 2024, there were approximately 2.6 million noncitizen children ages 0 to 18 residing in the U.S. This includes 61% or 1.6 million who are recent noncitizen children in the U.S. for less than five years and 39% or 1 million who have been in the U.S for five or more years. This group includes both lawfully present and undocumented immigrants, although other research suggests there are very few undocumented children in the U.S. overall.

Noncitizen children are significantly more likely to be uninsured than their citizen counterparts (Figure 2). Recent noncitizen children are at the highest risk of being uninsured, with 28% lacking coverage compared to 22% of their longer-term noncitizen counterparts and 5% of citizens. The higher uninsured rate among noncitizen children reflects a lower rate of private coverage. Rates of public coverage for children are similar across citizenship status and length of time in the country. However, noncitizen children are more likely than their citizen counterparts to live in a low-income family and, therefore, are more likely to be eligible for public coverage yet enrolled at lower rates.

Noncitizen Children are More Likely to Be Uninsured Than Their Citizen Counterparts (Stacked Bars)

The uninsured rate for noncitizen children is significantly lower in states that have adopted the ICHIA option for children compared to the rate for noncitizen children in states that have not adopted this option (25% vs. 37%). This pattern holds true across both recent noncitizen children (27% vs. 35%) as well as longer-term noncitizen children (21% vs. 40%). The lower uninsured rate in these states is largely driven by higher rates of public coverage, particularly among recent noncitizen children. This likely reflects the expanded coverage to recent lawfully residing immigrant children who would otherwise be in the five-year waiting period as well as broader groups of lawfully residing immigrant children who do not have “qualified status.” Additionally, as noted, some of these states have implemented other coverage expansions for immigrant children, such as fully state-funded programs, as well as broader expansions for the low-income population, including the ACA Medicaid expansion to low-income adults, which may have spillover effects on children’s coverage. States with ICHIA coverage for children also cover a much larger number of noncitizen children than states without ICHIA, as over nine in ten (92%) of noncitizen children live in these 38 states.

Noncitizen Children in States with ICHIA Coverage Are Less Likely to be Uninsured than Those in States Without ICHIA Coverage (Stacked Bars)

ICHIA Coverage Under the 2025 Reconciliation Law

The 2025 reconciliation law limits eligibility for federally funded coverage, including Medicaid, CHIP, subsidized ACA Marketplace, and Medicare coverage, to LPRs (green card holders), certain Cuban and Haitian entrants, and people residing in the U.S. under COFA. This change eliminates eligibility for many groups of lawfully present immigrants such as refugees, U visa holders and applicants, and people with Temporary Protected Status, and is expected to lead to 1.4 million lawfully present immigrants becoming uninsured by 2034. The Medicaid and CHIP eligibility restrictions will take effect as of October 1, 2026, and are expected to lead to 100,000 individuals becoming uninsured by 2034.

The 2025 reconciliation law did not eliminate optional Medicaid and CHIP coverage for lawfully residing children and/or pregnant people under ICHIA. ICHIA coverage provides eligibility for a broader group of lawfully present immigrants in these groups who would otherwise no longer be eligible under the reconciliation law and also extends eligibility to recent immigrants who would otherwise be subject to the five-year waiting period for Medicaid and CHIP.

States could mitigate coverage losses for lawfully present immigrant children and pregnant people by maintaining or expanding ICHIA coverage. Overall, 11 states have not taken up ICHIA coverage for either children or pregnant people, 8 states have taken up the option for children but could expand it to pregnant people, and 2 states have taken up the option for pregnant people only but could expand it to children. Conversely, elimination of ICHIA coverage could exacerbate coverage losses for these groups. Some states facing budget pressures have recently cut back on state-funded coverage for immigrants. While no state has eliminated ICHIA coverage to date, states continue to face increasing budget pressures. ICHIA cannot mitigate coverage losses among non-pregnant adults who will no longer be eligible for Medicaid based on their immigration status.

Even with ICHIA coverage in place, outreach and education to families and effective eligibility screening processes will be important to prevent administrative losses among those still eligible as the reconciliation law changes are implemented. For example, as states implement new eligibility restrictions, it will be important to effectively screen people for eligibility under the ICHIA option to make sure they do not lose coverage if they are still eligible. Families may also be confused about shifting eligibility rules, which may be compounded by confusion and fears stemming from recent changes to public charge policies. Additionally, a couple of states almost inadvertently eliminated this coverage through state legislation to implement the 2025 reconciliation law, although these changes were eventually avoided. 

Methods

Data sources: This brief is based on KFF analysis of federal survey data, namely the American Community Survey 1-year Public Use Microdata Sample. The ACS is a nationally representative household survey conducted by the U.S. Census Bureau. ACS PUMS data are available on a yearly basis. State-level data on immigrant subpopulations were excluded due to sample size.

Identifying citizenship status: U.S. citizens were defined as naturalized citizens or U.S.-born citizens. Naturalized citizens are individuals who indicate becoming a U.S. citizen by naturalization. Noncitizen immigrants are individuals who say that they are not a U.S. citizen, including both lawfully present and undocumented immigrants.

Defining insurance coverage categories: Private insurance coverage included employer-sponsored and direct purchase insurance plans. Public insurance coverage included Medicare, Medicaid, and military-sponsored insurance plans.

Defining state take-up of ICHIA: Information on state take-up of ICHIA is based on KFF and Georgetown University’s 2026 Medicaid Eligibility and Enrollment Survey. For the purposes of this analysis, the 38 states that have taken up ICHIA for lawfully residing children were grouped into “States with ICHIA Coverage” for children.

Appendix Table 1: State Take-Up of Health Coverage Expansions
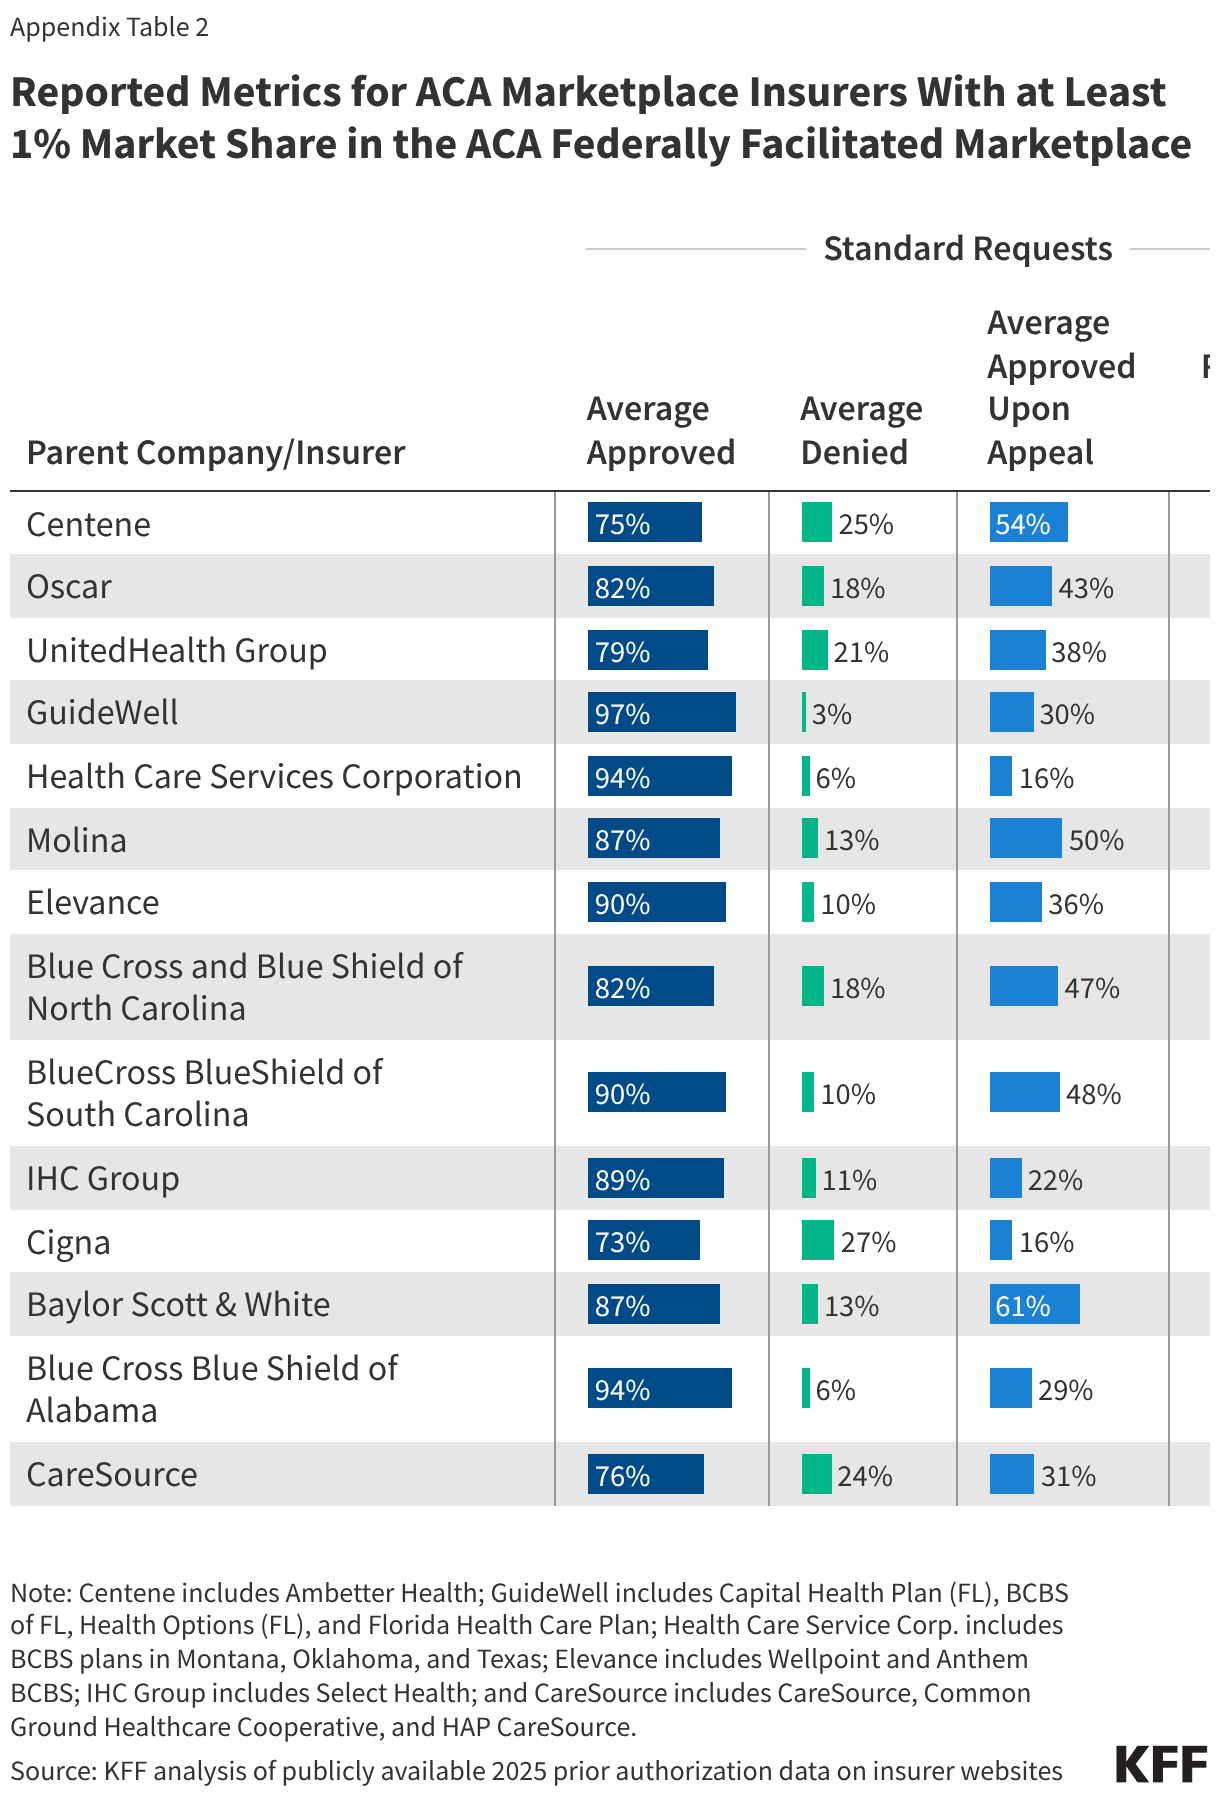
StateICHIA OptionACA Medicaid ExpansionFCEP OptionState-Funded Coverage
ChildrenPregnant PeopleChildren or Pregnant PeopleAdults
States That Have Adopted ICHIA Coverage for Children
ArkansasYesYesYesYesNoNo
CaliforniaYesYesYesYesYesYes
ColoradoYesYesYesYesYesYes
ConnecticutYesYesYesYesYesNo
DelawareYesYesYesNoNoNo
District of ColumbiaYesYesYesYesYesYes
FloridaYesNoNoNoNoNo
GeorgiaYesYesNoNoNoNo
HawaiiYesYesYesNoNoNo
IllinoisYesNoYesYesYesYes
IowaYesNoYesNoNoNo
KentuckyYesYesYesNoNoNo
LouisianaYesNoYesYesNoNo
MaineYesYesYesYesYesNo
MarylandYesYesYesYesNoNo
MassachusettsYesYesYesYesYesNo
MichiganYesYesYesYesNoNo
MinnesotaYesYesYesYesYesNo
MontanaYesNoYesNoNoNo
NebraskaYesYesYesYesNoNo
NevadaYesYesYesNoNoNo
New HampshireYesYesYesNoNoNo
New JerseyYesYesYesNoYesNo
New MexicoYesYesYesNoNoNo
New YorkYesYesYesYesYesYes*
North CarolinaYesYesYesNoNoNo
OhioYesYesYesNoNoNo
OregonYesNoYesYesYesYes
PennsylvaniaYesYesYesNoNoNo
Rhode IslandYesYesYesYesYesNo
South CarolinaYesYesNoNoNoNo
TexasYesNoNoYesNoNo
UtahYesNoYesNoYesNo
VermontYesYesYesNoYesNo
VirginiaYesYesYesYesNoNo
WashingtonYesYesYesYesYesYes
West VirginiaYesYesYesNoNoNo
WisconsinYesYesNoYesNoNo
States that Have Not Adopted ICHIA Coverage for Children
AlabamaNoNoNoYesNoNo
AlaskaNoNoYesNoNoNo
ArizonaNoNoYesNoNoNo
IdahoNoNoYesNoNoNo
IndianaNoNoYesNoNoNo
KansasNoNoNoNoNoNo
MississippiNoNoNoNoNoNo
MissouriNoNoYesYesNoNo
North DakotaNoYesYesNoNoNo
OklahomaNoNoYesYesNoNo
South DakotaNoNoYesYesNoNo
TennesseeNoNoNoYesNoNo
WyomingNoYesNoNoNoNo
Note: "ICHIA Option" for children or pregnant people includes states that implement ICHIA for these populations as of January 2026. "Medicaid Expansion" includes states that have adopted the Affordable Care Act’s (ACA) expanded Medicaid coverage to nearly all adults with incomes up to 138% of the Federal Poverty Level as of May 2026. "FCEP Option" includes states that adopted the CHIP From-Conception-to-End-of-Pregnancy (FCEP) option. "State-Funded" includes states that provide any state-funded health coverage to income-eligible adults or children regardless of immigration status as of April 2026. State-funded coverage for adults in New York is limited to individuals 65 or older.
Source: KFF/Georgetown University, 2026 Medicaid Eligibility and Enrollment Survey (April 2026); KFF, “Status of State Medicaid Expansion Decisions” (May 2026); KFF, “Medicaid and CHIP Income Eligibility Limits for Pregnant Women as a Percent of the Federal Poverty Level” (January 2026); KFF, “State Health Coverage for Immigrants and Implications for Health Coverage and Care” (May 2026).

VOLUME 52

Many Adults Are Unaware of the Abortion Pill’s Safety and Prevalence as Misleading Claims Link the Medication to Wastewater Contamination


Highlights

Recently released findings from KFF’s July Health Tracking Poll show that much of the public is unsure of the abortion pill mifepristone’s safety, and most lack awareness that most abortions in the U.S. are performed via medications. These findings come as some groups opposed to abortion are citing a misleading paper in an effort to classify mifepristone as a water contaminant, despite criticism of the paper’s methodology and a lack of evidence demonstrating the drug poses an environmental risk.


The latest KFF Health Tracking Poll examines the public’s knowledge and views of mifepristone – or medication abortion – amid an ongoing FDA re-review of the medication’s safety.

Much of the public is unaware of mifepristone’s long-standing safety record. While larger shares of adults say medication abortion is safe (44%) than say it is unsafe (15%) when taken as directed by a health care provider, about four in ten (41%) say they are unsure. This uncertainty is higher among Black women, with half (51%) saying they are unsure whether abortion pills are safe. Among women of reproductive age – or those ages 18-49 – roughly half (52%) view the abortion pills as safe while three in ten are not sure.

Republicans (50%) and independents (42%) are most likely to be uncertain about mifepristone’s safety, while a majority of Democrats (61%) view the medication as safe.

Stacked bar chart showing share of adults who believe abortion bills are very safe, somewhat safe, somewhat unsafe, very unsafe, or are unsure of the correct answer. Results shown by total, women of reproductive age, and party.

In addition to the lack of awareness of mifepristone’s safety record, just about a quarter (26%) of the public is aware that most abortions in the U.S. are performed via abortion pills, while 26% incorrectly say most abortions are performed via medical procedure and about half of the public (48%) are unsure. Larger shares of Democrats, independents, women of reproductive age, and those who identify as “pro-choice” correctly say that most U.S. abortions are performed with abortion pills, though uncertainty is still high among these groups, with roughly half saying they are unsure. 

Stacked bar chart showing share of adults who believe most abortions in the United States are done using abortion pills, a medical procedure, or are unsure of the correct answer. Results shown by total, women of reproductive age, party, and view on abortion.

As the FDA undertakes a re-evaluation of mifepristone’s safety, slightly more than half (54%) of the public say they have little to no confidence in the FDA to make decisions based on science when it comes to reviewing the drug’s safety. This lack of confidence is shared among roughly half of Democrats (47%) and Republicans (53%), while nearly six in ten (57%) independents lack confidence in the agency in this regard. These findings are in line with KFF’s past health information and trust polling, which has found that fewer than half of the public and partisans express confidence in federal health agencies to carry out core responsibilities, such as acting independently or making decisions based on science rather than personal views of officials. Trust in federal agencies such as the FDA and CDC as health information sources declined precipitously after the onset of the COVID-19 pandemic.


What We’re Watching

Misleading Wastewater Claims Cited in Effort to Classify Mifepristone as a Contaminant

A paper purporting to show mifepristone contaminating wastewater in three U.S. cities is being cited by an activist group opposed to abortion as the group attempts to persuade the Environmental Protection Agency (EPA) to classify the drug as a water contaminant and to push the Food and Drug Administration (FDA) to restrict or pull it from the market.

The paper was posted as a preprint in a journal run by physicians who oppose abortion. Environmental health scientists, including a former scientist at the EPA’s Office of Water, have said that it uses a testing method that does not distinguish between compounds that interact with progesterone receptors. Because of this limitation, the paper cannot accurately distinguish mifepristone from other chemicals, like bisphenol A (BPA), which is found in many plastics. An FDA environmental assessment of mifepristone conducted during the drug’s approval process estimated its environmental concentration at less than one part per billion, a level that the agency described as a likely overestimate and still too low to affect standard test organisms.

Using environmental claims to call for new restrictions on access to mifepristone is among the latest efforts in ongoing attempts to portray the drug as unsafe, despite those claims not being supported by evidence. Mifepristone’s safety has been extensively studied, with serious adverse events occurring in fewer than 0.5% of patients. Still, though, a report published by a group opposed to abortion last year that claimed to show a much higher rate of adverse events is still being cited in legislative challenges to mifepristone access, despite that report similarly being met with criticism over its methodology.


AI & Emerging Technology

AI-Generated “Doctors” and Deepfakes of Real Physicians Are Being Used to Sell Supplements Online

A series of recent investigations have found networks of AI-generated “doctors” across social media platforms promoting supplements and unproven treatments as supposed “miracle cures” for a range of conditions. A New York Times video investigation found hundreds of entirely AI-generated wellness influencers and doctors on social media, not based on any real person and with fabricated names, faces, and credentials. These videos often target older women with before-and-after transformation videos and fake diplomas displayed in fake offices. In Spain, the fact-checking organization Maldita.es found more than 1,000 AI-generated “doctor” channels on YouTube and 25 similar accounts on Instagram, often promoting the same types of unproven cures.

One 71-year-old woman interviewed by the Times said she began taking a supplement after seeing an AI-generated ad for a product she was led to believe could help treat symptoms of an autoimmune disease. The product was later recalled after being linked to salmonella contamination. In other cases, ads made dangerous health claims, including that a supplement could be more effective in treating Stage 3 kidney disease than medication. In addition to these synthetic personas, deepfake videos of actual, named physicians have also been used to promote unproven treatments.

Medical Organizations Call for Legislative Protections Against AI Physician Deepfakes

Legislative efforts to prevent such impersonation have been introduced at both the federal and state level, with the American Medical Association (AMA) endorsing a bill that would hold individuals or platforms liable for distributing an unauthorized digital replica of a person’s voice or likeness. In California, a bill supported by the California Medical Association would require ads using an AI-generated or altered likeness of a real person to include a clear disclosure that the content was AI-generated.

Social Media Platform Enforcement of AI-Generated Content Remains Inconsistent

Social media platforms, including Meta and TikTok, have said that they label AI-generated content and remove ads making misleading health claims, but the Times investigation found uneven enforcement. Maldita.es found some flagged Instagram accounts carrying the platform’s blue verification badge, typically reserved for confirming a user’s identity. A separate audit that posted more than 200 AI-generated images and videos across five platforms similarly found inconsistent labeling, with Instagram correctly labeling only 15 of 105 synthetic images posted to the platform, while TikTok labeled about a third.

Why This Matters

AI-generated videos that imitate the credibility of real or fabricated health professionals may exploit both the public’s high trust in doctors as purveyors of health information and the confidence that some social media users have in their ability to discern false health claims. June KFF polling found that fewer than four in ten (36%) adults who seek health information on social media follow up with a doctor or health professional at least most of the time to verify what they’ve seen, and a majority of those who use social media for health (65%) say they’re confident in their ability to tell whether health information posted on these platforms is true or false.

About The Health Information and Trust Initiative: the Health Information and Trust Initiative is a KFF program aimed at tracking health misinformation in the U.S., analyzing its impact on the American people, and mobilizing media to address the problem. Our goal is to be of service to everyone working on health misinformation, strengthen efforts to counter misinformation, and build trust. 


View all KFF Monitors

The Monitor is a report from KFF’s Health Information and Trust initiative that focuses on recent developments in health information. It’s free and published twice a month.

Sign up to receive KFF Monitor
email updates


Support for the Health Information and Trust initiative is provided by the Robert Wood Johnson Foundation (RWJF). The views expressed do not necessarily reflect the views of RWJF and KFF maintains full editorial control over all of its policy analysis, polling, and journalism activities. The data shared in the Monitor is sourced through media monitoring research conducted by KFF.

Prior Authorization Metrics Provide New Insights into Insurer Practices, but Gaps Remain

Published: Aug 13, 2026

The use of prior authorization by health insurers has come under increased scrutiny in recent years, as nearly 7 in 10 insured adults say prior authorization is a burden when it comes to getting health care. Health insurers use prior authorization to reduce the use of low-value or unnecessary care, and in the complex and fragmented U.S. health care system is one of the primary tools used to restrain costs. Nevertheless, this practice may result in delays or denials in receiving necessary care, as well as administrative burdens for patients and providers.

In 2024, the Centers for Medicare and Medicaid Services (CMS) published a final rule (“2024 regulation”) aimed at streamlining and automating the prior authorization process for almost all insurance programs it oversees: Medicare Advantage, Medicaid and CHIP fee-for-service and managed care plans, and Affordable Care Act (ACA) Marketplaces on the federally facilitated exchanges (HealthCare.gov). As part of these requirements, every year, payers in these programs are now required to publicly post on their websites specified prior authorization metrics, including approval and denial rates and response times, aggregated for all medical items and services (excluding prescription drugs) for the previous calendar year.

Insurers were required to post the first year of data, for the 2025 calendar year, by March 31, 2026. KFF collected and analyzed these metrics from the largest insurers in most market segments for which reporting is required, including Medicare Advantage, Medicaid managed care, and the Affordable Care Act (ACA) federally facilitated Marketplace. This issue brief summarizes the data by market segment and insurer and discusses the challenges interpreting the data as well as emerging policy changes that may address some of them.

  • Medicare Advantage insurers denied 12% of standard prior authorization requests, Medicaid managed care insurers denied 14%, and ACA Marketplace insurers denied 18%. Denial rates for expedited requests were slightly lower. However, the aggregated approval statistics do not allow for further analysis into which services are being denied.
  • Prior authorization denials are rarely appealed, but when they are, a considerable share are overturned. Sixty-seven percent of prior authorization denials were overturned upon appeal in Medicare Advantage, 47% were overturned upon appeal in Medicaid managed care, and 43% were overturned in the ACA federally facilitated Marketplace.
  • Median response times in all markets were about 1 day for standard prior authorization requests, and about half a day for expedited prior authorization requests for Medicare Advantage, and approximately 1 day for Medicaid managed care and the ACA Marketplace. Insurers are not required to report response time ranges or differences by service category.  
  • Despite the regulatory intent to make insurer prior authorization practices more transparent, difficulty locating and interpreting metrics on insurer websites and gaps in how (e.g., a standardized template that insurers are required to use) and what metrics (e.g., denominators and breakouts by service category) must be reported limit the usability of this information directly by the public.

Overview of the 2024 Regulation’s Prior Authorization Metrics Requirements

The regulation states that the overall goal of this public reporting requirement is to promote “accountability for payer prior authorization practices” and envisions consumers using the data when shopping for health insurance. The regulation requires payers to which it applies — Medicare Advantage organizations, Medicaid and CHIP fee-for-service and managed care plans, and insurers on the ACA federally facilitated Marketplace (FFM), hereafter collectively referred to as insurers — to provide a list of all medical items and services that require prior authorization (excluding prescription drugs) and report the following metrics aggregated for all medical items and services (excluding prescription drugs) for each line of business:

  • Percentage of standard and expedited prior authorization requests that were approved and denied
  • Percentage of standard prior authorization requests that were approved after appeal (i.e., overturned denials)
  • Percentage of all prior authorization requests where review timeframes were extended and the request was approved
  • Average (i.e., mean) and median timeframes between submission of a prior authorization request and determination for standard and expedited prior authorization requests

Additional metrics were made optional, including:

  • Percentage of expedited prior authorization requests that were approved after appeal
  • Percentage of prior authorization requests where decision timeframes were extended and then the requests were approved, broken out by standard and expedited requests
  • Percentage of prior authorization requests approved within 7 days for standard requests and 72 hours for expedited requests
  • Numeric counts for metrics, including total number of requests and appeals received

Describing “Standard” and “Expedited” Prior Authorization Requests

The 2024 regulation refers to “standard” prior authorization as non-expedited, non-urgent requests and to ‘‘expedited’’ prior authorization as urgent requests. Other federal regulations generally base these terms on whether the standard timeframe could seriously jeopardize an enrollee’s life, health, or ability to regain maximum function. In 2025, the year for which prior authorization metrics are reported, insurers were required to send a determination for standard requests within 14 calendar days for Medicare Advantage and Medicaid managed care and within 15 days for the ACA Marketplace. Determinations for expedited requests had to be sent within 72 hours for insurers in all three markets.1

The 2024 regulation introduced new prior authorization reporting requirements for some business segments and expanded them for others.

  • For Medicare Advantage, insurers have been required to report information about the use of prior authorization – including the number of requests, denials, and appeals – for several years, with data available to researchers for 2019 through 2024. Data on the share of prior authorizations approved, denied, and approved upon appeal are largely duplicative of the information Medicare Advantage insurers already report. The regulation adds new requirements to provide information on response times and to report metrics separately for standard and expedited requests.
  • For Medicaid and the ACA FFM, uniform federal reporting requirements for prior authorization are new,2 though an existing patchwork of state laws and regulations has required some insurers to report certain prior authorization data at the state level.

Prior Authorization Metrics

Data collected for this analysis represent the largest insurers in each business segment — those with at least 2.5% market share in each of their respective markets: Medicare Advantage, Medicaid managed care, and the ACA FFM.3,4 In total, this analysis includes data from 14 unique insurers, representing 25 million Medicare Advantage enrollees (69% of all enrollment), more than 35 million Medicaid managed care organization (MCO) enrollees (54% of all enrollment), and nearly 11 million enrollees in the ACA FFM (hereafter referred to as the ACA Marketplace for simplicity), which included 28 states in 2025 (74% of all enrollment in FFM states). KFF weighted the data by enrollment within each market segment. See the Methodology section for more details.

This analysis includes the share of standard and expedited prior authorization requests that were approved and denied, the share of standard prior authorization requests that were approved after appeal, and the median response times for standard and expedited prior authorization requests. We do not report the share of prior authorization requests approved after extension because some insurers reported the data only for standard requests, while others reported data separately for standard and expedited. Optional metrics are not included because they were not consistently reported by insurers.

Approval and Denial Rates

Across market segments, insurers denied between 12% and 18% of standard prior authorization requests in 2025. On average, 12% of standard prior authorization requests and 10% of expedited prior authorization requests were denied in Medicare Advantage; 14% of standard requests and 12% of expedited requests were denied in Medicaid managed care; and 18% of standard prior authorization requests and 16% of expedited prior authorization requests were denied in the ACA Marketplace (Figure 1). Across all markets, the share of standard prior authorization requests that were denied was similar to or slightly higher than the share of expedited prior authorization requests that were denied.

Figure 1

Prior authorization denial rates varied widely across the largest insurers (Figure 2).

Medicare Advantage: Among the six Medicare Advantage insurers examined, the share of standard prior authorization requests that were denied ranged from 5% (Elevance) to 17% (UnitedHealth Group), and the share of expedited requests that were denied ranged from 3% (Elevance) to 13% (Centene). UnitedHealth Group, Centene, Kaiser Permanente, and Elevance all had somewhat higher denial rates for standard requests than expedited requests, while CVS and Humana had higher denial rates for expedited requests than standard requests. These are similar to the overall denial rates found in a previous KFF analysis across Medicare Advantage insurers.5

Medicaid Managed Care: Among the eight Medicaid managed care insurers examined, the share of standardprior authorization requests that were denied ranged from 2% (L.A. Care Health Plan) to 23% (Independence Health Group). For expedited requests, denial rates ranged from 4% (L.A. Care Health Plan) to 21% (CareSource). Three insurers (Centene, Independence Health Group, and UnitedHealth Group) reported higher denial rates for standard requests compared to expedited requests, while three insurers (CVS Health, CareSource, and L.A. Care Health Plan) reported slightly higher denial rates for expedited requests.6

ACA Marketplace: Among the eight ACA Marketplace insurers included in this analysis, the share of standard prior authorization requests that were denied ranged from an average of 3% (GuideWell) to 25% (Centene). Denial rates for expedited requests ranged from 3% (GuideWell) to 23% (Centene). Four insurers (Centene, UnitedHealth Group, Blue Cross and Blue Shield of North Carolina, and Molina) reported higher denial rates for standard requests compared to expedited requests, while two insurers (Elevance and Health Care Service Corporation) reported higher denial rates for expedited requests.7 The remaining two insurers (Oscar and GuideWell) in this analysis had virtually the same rates of denials for both standard and expedited requests.

Market segments inherently have many differences, and the share of prior authorization requests denied also varied for the same insurer participating in multiple markets. For example, UnitedHealth denied 17% of standard requests in Medicare Advantage, 11% in Medicaid managed care, and 21% in the ACA Marketplace.

Figure 2

Appeals Data

Insurers overturned a considerable share of denials upon appeal, with variation by market. Although enrollees or their providers can appeal denied prior authorization requests, research shows that denials are rarely appealed in Medicare Advantage, Medicaid MCOs, or the ACA Marketplace. However, the prior authorization data demonstrate that when denials are appealed, a considerable share are overturned.

The share of standard prior authorization requests initially denied that were then overturned upon appeal8 (referred to in the CMS template as “Requests Approved After Appeal”) was 67% for Medicare Advantage, 47% for Medicaid managed care, and 43% in the ACA Marketplace (Figure 3). We do not present appeals data for expedited requests because that metric is optional, and most insurers did not provide this information. High overturn rates could raise questions about whether the initial request should have been approved or could indicate that the initial request was missing the required documentation to justify the service. Either way, the appeals process can be complicated and time-consuming for providers and patients.

In Medicare Advantage, if the plan upholds its original denial, the case is automatically sent to an independent review entity. In contrast, there is no automatic external medical review of upheld denials in Medicaid managed care and the ACA Marketplace. HHS OIG has suggested that the presence of automatic, independent review could incentivize Medicare Advantage plans to closely review their denials at the first level of appeal and may help explain higher appeal overturn rates in Medicare Advantage compared to Medicaid managed care and the ACA Marketplace.

Stacked bar chart showing the share of appealed standard prior authorization denials that were overturned or upheld in Medicare Advantage, Medicaid managed care and the ACA Marketplace. The chart shows that insurers reversed a substantial share of denied requests when patients or providers appealed, though the likelihood of reversal varied by market segment. In Medicare Advantage, 67% of appealed denials were overturned and 33% were upheld. In Medicaid managed care, appeals were nearly evenly split, with 47% overturned and 53% upheld. In the ACA Marketplace, 43% of appealed denials were overturned and 57% were upheld. Overall, the figure shows that many denials are eventually reversed on appeal, particularly in Medicare Advantage, suggesting that initial prior authorization decisions are not always final.

Appealed prior authorization denials were overturned more often by some large insurers than others (Figure 4).

Medicare Advantage: Across the six largest Medicare Advantage insurers, the share of denied standard prior authorization requests that were approved varied substantially. Denials were overturned upon appeal more than 90% of the time by Centene, while Kaiser Permanente overturned denials upon appeal 40% of the time.

Medicaid Managed Care: Among the Medicaid managed care insurers examined, UnitedHealth Group overturned 81% of denials upon appeal. The remaining insurers overturned between 22% (CVS) and 48% (Molina) of denials upon appeal. (One Medicaid managed care insurer included in this analysis (L.A. Care Health Plan) did not report overturned prior authorization denials as a percentage of standard prior authorization requests that were appealed; therefore, its appeals data are not included here.)

ACA Marketplace: On average, Health Care Service Corporation overturned just 16% of denials upon appeal, while Centene overturned just over half (54%) of denials upon appeal. Six of the eight large insurers reported overturning denials upon appeal less than half the time.

Figure 4

Median Response Times

Median response times for prior authorization determinations were about 1 day for standard requests, with slightly more variation for expedited requests (Figure 5).

The median time between the submission of a prior authorization request and the determination by the insurer, or response time, for standard requests was about 1 day for Medicare Advantage, Medicaid managed care, and the ACA Marketplace (0.9 days or just under 22 hours), substantially less than the federally required maximum time permitted for standard requests.9 The median response time for expedited requests was about half a day (0.4 days or just under 10 hours) for Medicare Advantage, just under 1 day (0.8 days or approximately 19 hours) for Medicaid managed care, and 1 day for the ACA Marketplace. Federal regulations in 2025 required insurers to send a determination for standard requests within 14 calendar days for Medicare Advantage and Medicaid managed care and within 15 days for the ACA Marketplace. Determinations for expedited requests had to be sent within 72 hours for insurers in all three markets.10

Grouped bar chart comparing median prior authorization response times for standard and expedited requests across Medicare Advantage, Medicaid managed care and the ACA Marketplace. The chart shows that insurers typically made prior authorization decisions within about one day regardless of market segment. Median response times for standard requests were 1 day in Medicare Advantage and Medicaid managed care and 0.9 days in the ACA Marketplace. Expedited requests were decided even more quickly in Medicare Advantage, with a median response time of 0.4 days, while response times were 0.8 days in Medicaid managed care and 1 day in the ACA Marketplace. Overall, the figure shows relatively fast prior authorization decision-making across markets, with little variation in standard requests and somewhat greater variation in expedited requests.

Median response times likely reflect (at least in part) the increasing use of technology in the prior authorization process, such as artificial intelligence and electronic prior authorization systems. Still, nearly one-quarter (24%) of insured adults reported in a July 2025 KFF poll that their health insurance company had delayed their ability to get a requested health care service, treatment, or medication in the past two years.And other research and media reports demonstrate that some patients experience much longer response times, sometimes with serious health consequences. In addition to the 2024 regulation’s provisions aimed at streamlining and automating the prior authorization process, in June 2025, a group of health insurers voluntarily pledged to expand real-time responses for prior authorization approvals by 2027.

Median response times for prior authorization determinations varied somewhat among large insurers (Figure 6).

Medicare Advantage: The median response time for standard requests varied from less than 1 day (CVS, Humana, and Kaiser Permanente) to 2 days (Centene). Across the six insurers examined, the response times for expedited requests were similar or slightly shorter than the response times for standard requests.

Medicaid Managed Care: The median response time for standard prior authorization requests varied from 1 day (Centene, Elevance, and Molina) to 4 days (CareSource). Elevance had the same median response time for standard and expedited requests, while the other insurers reported shorter response times for expedited requests.

ACA Marketplace: Among the eight large insurers included in this analysis, median response times for standard requests ranged from less than 1 day (UnitedHealth Group, GuideWell, and Health Care Service Corporation) to 4 days (Molina). All but one insurer reported similar or shorter median response times for expedited requests than standard requests.

Figure 6

Challenges for Consumers Accessing and Interpreting Prior Authorization Data

Uniform federal reporting requirements represent a step toward better understanding insurer prior authorization metrics across insurance markets. While the data provide new insights, particularly for Medicaid managed care and the ACA Marketplace insurers, gaps remain. Although a target audience of prior authorization reporting is consumers, those who do not have a deep understanding of health insurance terminology and concepts may struggle to interpret these reports. In previous KFF research, one-quarter of insured adults reported difficulty understanding specific terms their health insurer uses. Difficulty locating metrics on insurer websites, an absence of more detailed data, and unclear reporting standards could additionally pose challenges for consumers wishing to use the data directly to compare health insurers, as envisioned in the 2024 regulation. However, intermediaries may aggregate and explain the data to make it more accessible for consumers.

Insurers are not required to report the number of prior authorization requests for each metric (only percentages), which limits the ability to make useful comparisons and gauge the scale of requests, denials, and approvals behind reported percentages. For instance, a low denial rate could translate into a large number of denials if the insurer received a substantial number of prior authorization requests. Conversely, a high denial rate might be seen with a relatively low number of prior authorization requests if many of those requests were denied (which could indicate the prior authorization process is better tailored, rather than a concerning number of denials). In a previous KFF analysis of the use of prior authorization in Medicare Advantage, for example, the number of prior authorization determinations per enrollee was inversely related to the share of requests that were denied (i.e., insurers with more prior authorization requests denied a smaller share of the requests than those with fewer requests). As a result, the absolute number of denied prior authorization requests per enrollee was similar across insurers with different denial rates.

Numeric counts would provide more context for understanding whether an apparently high or low denial rate reflects a meaningful volume of prior authorization requests. Additionally, they are also necessary to distinguish a true zero from missing data or inapplicable statistics. For example, the “Approved upon appeal” metric does not include the number of appeals an insurer received. Insurers that report 0% of appeals were approved are not required to indicate whether they received no appeals or that none of the appeals were approved. Furthermore, insurers were not required to report the appeal outcome by service or the reason(s) for the decision, making it difficult to interpret differences across and within markets.

Making comparisons between insurers also requires an understanding of policy nuances.  An insurer might have a high prior authorization approval rate because there are many services requiring prior authorization that are almost always approved. Some insurers exempt providers from at least some prior authorization requirements if they consistently have a high prior authorization approval rate (e.g., 90%), known as “gold card” programs. These programs can further complicate comparisons, as the approval rate no longer reflects the entirety of the procedures that might otherwise have required prior authorization. Insurers that rely heavily on gold carding may, in turn, report lower approval rates: since providers that are most clinically compliant are exempt from prior authorization, reported statistics from these insurers include only providers that may inherently have lower approval rates.

Comparisons between issuers are also challenging because of inconsistencies in how metrics are reported. Although CMS published an example template for reporting the prior authorization metrics, its use by insurers is not mandatory, and most insurers used different formats, which could make comparing metrics across insurers burdensome for the public. Some inconsistencies in reporting level could make comparisons difficult. For example, some ACA Marketplace insurers reported prior authorization metrics at the national level, as opposed to separating their reporting by state, so it is not possible to understand geographic variation in prior authorization practices from the same insurer. A national average denial rate for one insurer may or may not reflect the insurer’s denial rate in the state where the consumer lives.

Response times are difficult to interpret. Comparing response timeframes by type of request can provide some insight into the extent to which insurers are meeting the regulatory timeframe requirements. However, insurers are only required to report median and average response times, which limits the ability to determine how often decisions exceed those timeframes. Also, without a required reporting unit, some insurers reported time in hours, while others used days or fractional days. Although median response times across all three markets were typically well below the required maximums, additional information — such as optional metrics on the percentage of requests approved or denied within the required timeframe and ranges of response times — would allow for a more complete picture of how quickly prior authorization decisions are made and how frequently decision times exceed the required timeframes. Additionally, consumers may not always understand how to interpret the median – that is, by definition, half of the prior authorization requests exceed the median time reported.

Comparing insurers across lines of business requires consideration of differences between enrollee populations. Case mix (how sick the enrollee population is) and service mix (which services are most commonly provided for enrollees) likely vary substantially between lines of business, and potentially between insurers. For example, the older Medicare Advantage population likely differs substantially from the general population covered by ACA Marketplaces and the higher-need populations of Medicaid. If denial rates vary by service type and the services for which denials are more common comprise a larger share of prior authorization requests in a given business segment, the higher denial rate would reflect that difference in service use. However, without more detailed information, it is not possible to identify what is driving the differences.

In July 2026, CMS published an updated metrics reporting overview and template for insurers with changes that address some of the gaps addressed above for the 2027 reporting period. It specifies that posting metrics in locations on insurers’ websites that cannot be reached through ordinary navigation is not considered to meet the regulation’s requirement that the information be “publicly accessible.” While still not required, the updated overview does stress that the numerators and denominators specified in the template are “expected.” It notes that median determination response times that are less than one day must be reported in hours, not rounded to “0 days.” It also recommends that insurers identify and explain in their report any data quality issues or concerns.

In addition, the 2026 CMS Interoperability Standards and Prior Authorization for Drugs proposed rule (“2026 proposed rule”) attempts to address some of the data gaps in the 2024 regulation by expanding the prior authorization data that must be publicly reported. The proposed rule would require the same CMS-regulated insurers to publish new metrics for non-drug items and services (e.g., for both standard and expedited prior authorization requests, the number and percentage of requests that remain denied after appeal), as well as the numeric counts for both the new and existing metrics. Also, while CMS currently provides suggested denominators (or universe of prior authorization determinations to include), the proposed rule would standardize the denominators that insurers must use when calculating different metrics. Together, these changes would provide more insight into prior authorization requests, denials, and appeals; make the data easier to interpret; and improve the ability to make comparisons across insurers. More detailed prior authorization metrics could help assess whether initiatives to improve the prior authorization process more broadly, such as the voluntary commitments made by several insurers in June 2025, are leading to meaningful change. However, the proposed rule does not include a requirement that insurers report prior authorization metrics by service category.

Another significant proposed change would require insurers to report prior authorization metrics for prescription drugs, separate from non-drug items and services, for both standard and expedited requests. (This requirement does not apply to insurers offering Medicare Part D prescription drug plans, where separate reporting requirements for coverage determinations already apply.)

There are additional emerging federal and state data reporting policies that are market-specific:

Medicare Advantage

CMS has announced a pilot program where Medicare Advantage insurers can voluntarily submit more detailed prior authorization data, including data for specific service categories. The Trump administration has indicated that it intends to make more detailed reporting mandatory starting with the 2027 plan year. While that may help understand the impact of prior authorization in Medicare Advantage, the data will not be available for several years.

Federal legislation entitled “Improving Seniors’ Timely Access to Care Act of 2025” aims to improve prior authorization in Medicare Advantage. The bill would require Medicare Advantage plans to report certain prior authorization metrics annually to the Secretary of Health and Human Services, who would publish them on a public website. Some required metrics are similar to those required by CMS under the 2024 regulation, but the bill would also require plans to report the percentage and number of specified requests denied or approved during the previous plan year through the use of technology (e.g., artificial intelligence technology).

Medicaid Managed Care

Beginning July 2026, CMS requires states to collect and report prior authorization metrics for Medicaid managed care plans in Managed Care Program Annual Reports (MCPARs) submitted to CMS. In addition to the metrics required by the 2024 regulation, states are required to include the total number of standard and expedited prior authorization requests received. CMS makes MCPARs publicly available on Medicaid.gov, which may make data easier to locate in the future, though there will be a lag between state submission and CMS public posting.

The 2026 proposed rule would align prior authorization metric reporting for Medicaid and CHIP managed care with contract rating periods (which vary across states) and would require Medicaid and CHIP managed care plans to publicly post metrics no later than 90 days after each rating period ends. The rule would also require plans to report metrics by program (defined by a specified set of benefits and eligibility criteria identified in managed care plan contracts), as well as by plan. This proposal aligns with MCPAR reporting requirements and could provide more meaningful information on prior authorization performance by plan and program than aggregate information across programs within a state.

Private Insurance Market

Federal efforts to increase transparency into prior authorization practices in commercial coverage have so far been limited to ACA plans on the FFM. There is no publicly available prior authorization data for self-funded plans sponsored by private employers, which cover the majority of workers with employer-sponsored health insurance. Some states have taken action to increase transparency into prior authorization practices, including by collecting more granular prior authorization data from state-regulated insurers than the 2024 federal regulation requires and using the data to inform future actions aimed at curbing certain insurer practices.

For example, in 2025, Massachusetts conducted a special examination requiring insurers offering fully insured health plans in the state’s private insurance market to submit detailed prior authorization data (including numeric counts and prescription drugs) broken out by service category. The state published an analysis of the data in 2026, noting that it intended to use the data to inform future regulatory guidance. Following this examination, the state updated its insurance regulations to prohibit prior authorization requirements for a wide variety of services provided in-network, including some identified in the state’s analysis as having the most prior authorization requests and high approval rates, such as radiology (for enrollees with cancer) and physical, occupational, and speech therapy.

Similarly, in 2025, Iowa enacted a law requiring state-regulated insurers to submit certain prior authorization data to the state annually, which will be made available to the public, and requiring utilization review organizations to eliminate prior authorization requirements for health care services that meet certain criteria.

Going forward, more states may build upon the federal requirements by requiring insurers in their state to provide more detailed information about prior authorization practices and use that information to address the scope of prior authorization requirements.

This analysis includes data collected from the websites of Medicare Advantage, Medicaid managed care, and ACA federally facilitated Marketplace (FFM) insurers that each had at least 2.5% market share of enrollment in their respective market segments. In total, we collected data from 14 unique insurers in these markets, representing approximately 71 million enrollees. See Appendix Table 1 for more details.

We reported prior authorization metrics at the parent company level. Subsidiary insurers may have a different name from the parent company, and the parent company may own more than one insurer. For ease of reading, we refer to the parent company as the “insurer” in this analysis.

Medicare Advantage

Public reports were collected for Medicare Advantage insurers enrolling at least 2.5% of all Medicare Advantage enrollees in 2025. Altogether, these insurers comprised 72% of Medicare Advantage enrollment in 2025. In some cases, reports could not be located, and so the data included in this analysis reflects information provided for Medicare Advantage contracts covering 69% (25 million) of Medicare Advantage enrollees in 2025. Specifically, reports covering at least 95% of enrollment were identified for each insurer included in the analysis, with the exception of Elevance-sponsored plans, where reports covering 83% of enrollment were identified. Medicare Advantage organizations are required to report metrics at the contract level. CMS December 2025 enrollment was used to weight contract-level data when aggregating to the insurer and total market level.

Medicaid Managed Care

Public reports were collected for Medicaid MCO insurers enrolling at least 2.5% of all Medicaid MCO enrollees as of July 2024 (the latest available national Medicaid managed care enrollment data). Reports for limited benefit prepaid ambulatory health plans (PAHPs) and prepaid inpatient health plans (PIHPs) were not included. Altogether, these insurers comprised 57% of Medicaid MCOs as of July 2024. In some cases, reports could not be located, and so the data included in this analysis reflects information provided for Medicaid MCO contracts covering 54% (nearly 36 million) of Medicaid MCO enrollees as of July 2024. Specifically, reports covering at least 92% of enrollment were identified for each insurer included in the analysis, with the exception of Molina and Independence Health Group plans, where reports covering 87% and 84% of enrollment, respectively, were identified. CMS July 2024 enrollment was used to weight plan-level data when aggregating to the insurer and total market level.

Although the 2024 regulations require Medicaid and CHIP fee-for-service (FFS) programs and CHIP managed care plans to publicly report prior authorization metrics, these entities are not included in this analysis because reports were difficult to locate and comprehensive national plan-level enrollment data are not available for CHIP managed care. Additionally, the populations and services covered under FFS vary substantially across states, limiting comparability.

ACA Marketplace

We searched for public reports for the nine ACA Marketplace insurers with at least 2.5% market share in the 28 states that used the FFM (HealthCare.gov) in 2025. (Federal reporting requirements do not extend to states that operate their own Marketplaces, including state-based Marketplaces that use the HealthCare.gov platform). Prior authorization metrics could not be located for one of these insurers (CVS, which had 5% market share). UnitedHealth Group, which reported prior authorization data at the state level, did not include data for its plans sold in Oklahoma (less than 1% of its enrollment). Altogether, the data in this analysis reflect information provided for Marketplace insurers covering 74% (10.8 million) of ACA FFM enrollees in 2025.

Marketplace insurers are required to report metrics at the issuer level. Some insurers broke out their prior authorization metrics by state, while others provided national averages. ACA Marketplace enrollment was obtained from Mark Farrah Associates Health Coverage Portal, including mapping insurers to parent companies. To weight insurer-level data to the total market, enrollment was first filtered to FFM states and then aggregated to parent company.

Due to the large number of smaller insurers in the ACA Marketplace, relative to Medicare Advantage and Medicaid managed care, we also collected and analyzed data for ACA FFM insurers that had at least 1% market share in 2025, compiled in Table 2 of the Appendix. For consistency across market segments, however, only data from insurers with at least 2.5% market share were included in the overall analysis.

Table showing enrollment and market share for major Medicare Advantage insurers and the share of enrollment included in KFF’s prior authorization analysis. UnitedHealth Group is the largest Medicare Advantage insurer, with 10.3 million enrollees and a 28.8% market share, followed by Humana at 16.3% and CVS at 11.8%. The analysis includes data representing 24.7 million enrollees, or 69.0% of the Medicare Advantage market. The included insurers account for nearly all of the enrollment attributed to UnitedHealth Group, Humana, CVS and Kaiser Permanente, while included enrollment is somewhat lower for Elevance and Centene. Overall, the table shows that the prior authorization analysis covers insurers representing more than two-thirds of total Medicare Advantage enrollment.
Table comparing reported prior authorization metrics for ACA Marketplace insurers with at least a 1% market share in HealthCare.gov states. The table presents approval rates, denial rates, appeal overturn rates and median response times for standard and expedited prior authorization requests. Across insurers, standard request approval rates range from 73% to 97%, while denial rates range from 3% to 27%. The share of denied requests approved on appeal ranges from 16% to 61%, indicating substantial variation in appeal outcomes. Median response times for standard requests range from 0 to 4 days. Expedited requests generally have higher approval rates, ranging from 77% to 97%, and lower denial rates, ranging from 3% to 23%, with median response times typically 0 to 1 day. Overall, the table shows that most prior authorization requests are approved, but denial rates, appeal success rates and response times vary considerably across ACA Marketplace insurers.
  1. The turnaround time for standard requests in Medicare Advantage and Medicaid managed care was shortened to 7 calendar days beginning in 2026. Timeframes for the ACA Marketplace remain the same. ↩︎
  2. CMS makes data on post-service (not pre-service/prior authorization) claims denials available for plans on the ACA FFM. ↩︎
  3. Except CVS (which had 5% market share on the ACA FFM in 2025), as the company’s prior authorization metrics for that market could not be located. ↩︎
  4. Due to the large number of smaller insurers in the ACA Marketplace, relative to Medicare Advantage and Medicaid managed care, we collected data for ACA FFM insurers that have at least 1% market share, compiled in Appendix Table 2. For consistency across market segments, only data from insurers with at least 2.5% market share were included in this analysis. ↩︎
  5. Centene includes Wellcare, Elevance includes Anthem BCBS and Wellpoint, and CVS includes Aetna. ↩︎
  6. Elevance includes Amerigroup, Independence Health Group includes AmeriHealth Caritas, and CVS includes Aetna. ↩︎
  7. Centene includes Ambetter Health; GuideWell includes Capital Health Plan (FL), BCBS of FL, Health Options (FL), and Florida Health Care Plan; Health Care Service Corp. includes BCBS plans in Montana, Oklahoma, and Texas; Elevance includes Wellpoint and Anthem BCBS. ↩︎
  8. FAQs currently on the CMS website indicate that appeals metrics should aggregate all levels of appeals, including internal and external reviews. Note that this clarification appears to have been added in early 2026. ↩︎
  9. Some insurers reported response times in days while others used hours. To standardize, we converted hours to days and report time in days. ↩︎
  10. The turnaround time for standard requests in Medicare Advantage and Medicaid managed care was shortened to 7 calendar days beginning in 2026. Timeframes for the ACA Marketplace remain the same. ↩︎