
Prior Authorization Metrics Provide New Insights into Insurer Practices, but Gaps Remain
Introduction
The use of prior authorization by health insurers has come under increased scrutiny in recent years, as nearly 7 in 10 insured adults say prior authorization is a burden when it comes to getting health care. Health insurers use prior authorization to reduce the use of low-value or unnecessary care, and in the complex and fragmented U.S. health care system is one of the primary tools used to restrain costs. Nevertheless, this practice may result in delays or denials in receiving necessary care, as well as administrative burdens for patients and providers.
In 2024, the Centers for Medicare and Medicaid Services (CMS) published a final rule (“2024 regulation”) aimed at streamlining and automating the prior authorization process for almost all insurance programs it oversees: Medicare Advantage, Medicaid and CHIP fee-for-service and managed care plans, and Affordable Care Act (ACA) Marketplaces on the federally facilitated exchanges (HealthCare.gov). As part of these requirements, every year, payers in these programs are now required to publicly post on their websites specified prior authorization metrics, including approval and denial rates and response times, aggregated for all medical items and services (excluding prescription drugs) for the previous calendar year.
Insurers were required to post the first year of data, for the 2025 calendar year, by March 31, 2026. KFF collected and analyzed these metrics from the largest insurers in most market segments for which reporting is required, including Medicare Advantage, Medicaid managed care, and the Affordable Care Act (ACA) federally facilitated Marketplace. This issue brief summarizes the data by market segment and insurer and discusses the challenges interpreting the data as well as emerging policy changes that may address some of them.
Key Takeaways
- Medicare Advantage insurers denied 12% of standard prior authorization requests, Medicaid managed care insurers denied 14%, and ACA Marketplace insurers denied 18%. Denial rates for expedited requests were slightly lower. However, the aggregated approval statistics do not allow for further analysis into which services are being denied.
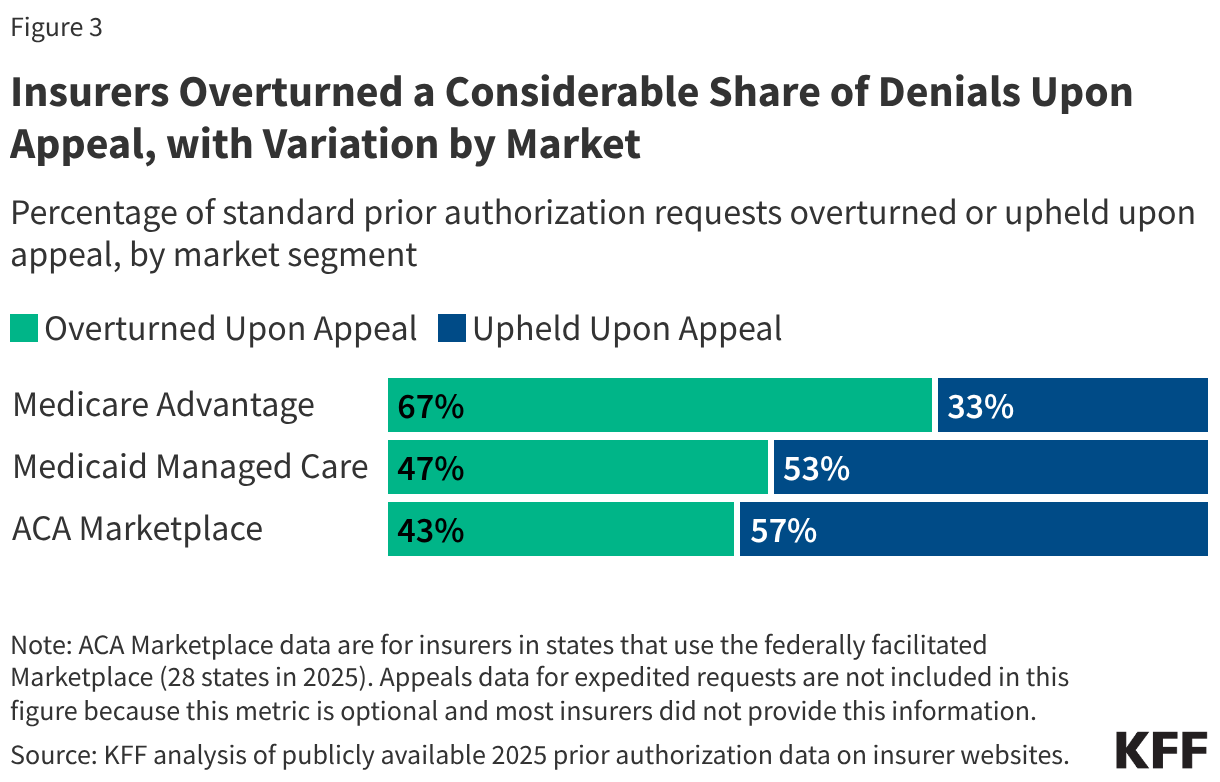
- Prior authorization denials are rarely appealed, but when they are, a considerable share are overturned. Sixty-seven percent of prior authorization denials were overturned upon appeal in Medicare Advantage, 47% were overturned upon appeal in Medicaid managed care, and 43% were overturned in the ACA federally facilitated Marketplace.
- Median response times in all markets were about 1 day for standard prior authorization requests, and about half a day for expedited prior authorization requests for Medicare Advantage, and approximately 1 day for Medicaid managed care and the ACA Marketplace. Insurers are not required to report response time ranges or differences by service category.
- Despite the regulatory intent to make insurer prior authorization practices more transparent, difficulty locating and interpreting metrics on insurer websites and gaps in how (e.g., a standardized template that insurers are required to use) and what metrics (e.g., denominators and breakouts by service category) must be reported limit the usability of this information directly by the public.
Overview of the 2024 Regulation’s Prior Authorization Metrics Requirements
The regulation states that the overall goal of this public reporting requirement is to promote “accountability for payer prior authorization practices” and envisions consumers using the data when shopping for health insurance. The regulation requires payers to which it applies — Medicare Advantage organizations, Medicaid and CHIP fee-for-service and managed care plans, and insurers on the ACA federally facilitated Marketplace (FFM), hereafter collectively referred to as insurers — to provide a list of all medical items and services that require prior authorization (excluding prescription drugs) and report the following metrics aggregated for all medical items and services (excluding prescription drugs) for each line of business:
- Percentage of standard and expedited prior authorization requests that were approved and denied
- Percentage of standard prior authorization requests that were approved after appeal (i.e., overturned denials)
- Percentage of all prior authorization requests where review timeframes were extended and the request was approved
- Average (i.e., mean) and median timeframes between submission of a prior authorization request and determination for standard and expedited prior authorization requests
Additional metrics were made optional, including:
- Percentage of expedited prior authorization requests that were approved after appeal
- Percentage of prior authorization requests where decision timeframes were extended and then the requests were approved, broken out by standard and expedited requests
- Percentage of prior authorization requests approved within 7 days for standard requests and 72 hours for expedited requests
- Numeric counts for metrics, including total number of requests and appeals received
Describing “Standard” and “Expedited” Prior Authorization Requests
The 2024 regulation refers to “standard” prior authorization as non-expedited, non-urgent requests and to ‘‘expedited’’ prior authorization as urgent requests. Other federal regulations generally base these terms on whether the standard timeframe could seriously jeopardize an enrollee’s life, health, or ability to regain maximum function. In 2025, the year for which prior authorization metrics are reported, insurers were required to send a determination for standard requests within 14 calendar days for Medicare Advantage and Medicaid managed care and within 15 days for the ACA Marketplace. Determinations for expedited requests had to be sent within 72 hours for insurers in all three markets.1
The 2024 regulation introduced new prior authorization reporting requirements for some business segments and expanded them for others.
- For Medicare Advantage, insurers have been required to report information about the use of prior authorization – including the number of requests, denials, and appeals – for several years, with data available to researchers for 2019 through 2024. Data on the share of prior authorizations approved, denied, and approved upon appeal are largely duplicative of the information Medicare Advantage insurers already report. The regulation adds new requirements to provide information on response times and to report metrics separately for standard and expedited requests.
- For Medicaid and the ACA FFM, uniform federal reporting requirements for prior authorization are new,2 though an existing patchwork of state laws and regulations has required some insurers to report certain prior authorization data at the state level.
Prior Authorization Metrics
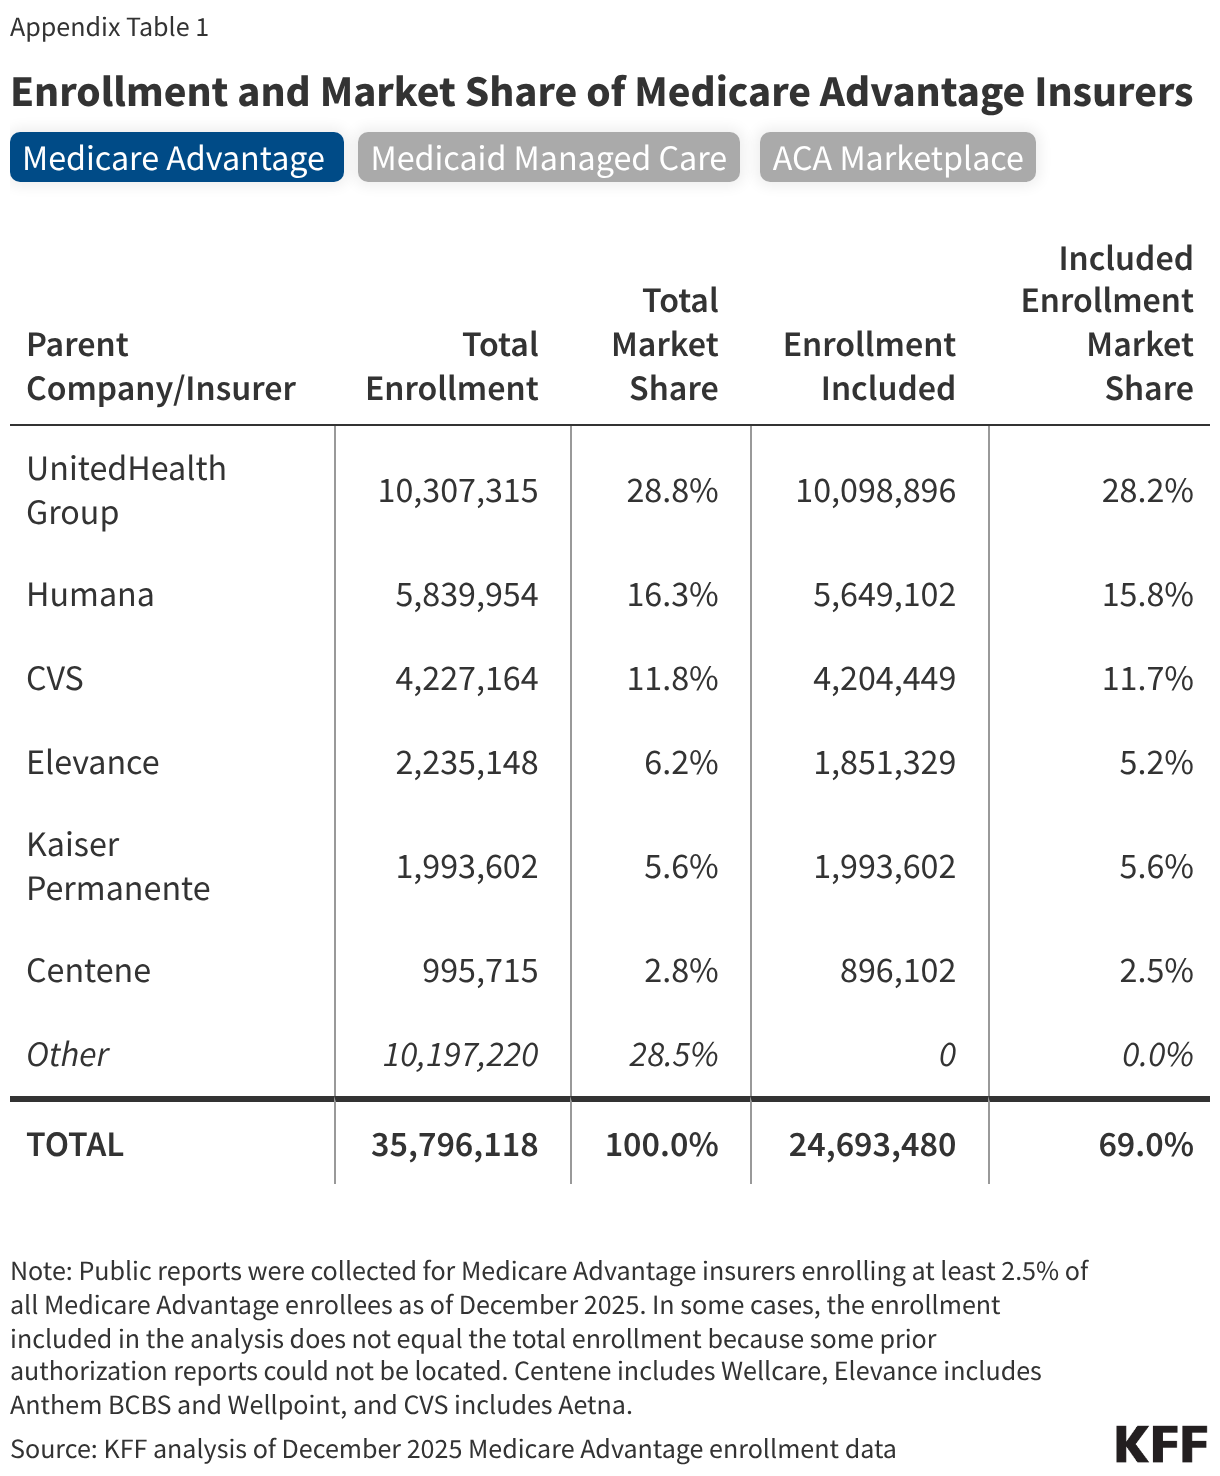
Data collected for this analysis represent the largest insurers in each business segment — those with at least 2.5% market share in each of their respective markets: Medicare Advantage, Medicaid managed care, and the ACA FFM.3,4 In total, this analysis includes data from 14 unique insurers, representing 25 million Medicare Advantage enrollees (69% of all enrollment), more than 35 million Medicaid managed care organization (MCO) enrollees (54% of all enrollment), and nearly 11 million enrollees in the ACA FFM (hereafter referred to as the ACA Marketplace for simplicity), which included 28 states in 2025 (74% of all enrollment in FFM states). KFF weighted the data by enrollment within each market segment. See the Methodology section for more details.
This analysis includes the share of standard and expedited prior authorization requests that were approved and denied, the share of standard prior authorization requests that were approved after appeal, and the median response times for standard and expedited prior authorization requests. We do not report the share of prior authorization requests approved after extension because some insurers reported the data only for standard requests, while others reported data separately for standard and expedited. Optional metrics are not included because they were not consistently reported by insurers.
Approval and Denial Rates
Across market segments, insurers denied between 12% and 18% of standard prior authorization requests in 2025. On average, 12% of standard prior authorization requests and 10% of expedited prior authorization requests were denied in Medicare Advantage; 14% of standard requests and 12% of expedited requests were denied in Medicaid managed care; and 18% of standard prior authorization requests and 16% of expedited prior authorization requests were denied in the ACA Marketplace (Figure 1). Across all markets, the share of standard prior authorization requests that were denied was similar to or slightly higher than the share of expedited prior authorization requests that were denied.
Prior authorization denial rates varied widely across the largest insurers (Figure 2).
Medicare Advantage: Among the six Medicare Advantage insurers examined, the share of standard prior authorization requests that were denied ranged from 5% (Elevance) to 17% (UnitedHealth Group), and the share of expedited requests that were denied ranged from 3% (Elevance) to 13% (Centene). UnitedHealth Group, Centene, Kaiser Permanente, and Elevance all had somewhat higher denial rates for standard requests than expedited requests, while CVS and Humana had higher denial rates for expedited requests than standard requests. These are similar to the overall denial rates found in a previous KFF analysis across Medicare Advantage insurers.5
Medicaid Managed Care: Among the eight Medicaid managed care insurers examined, the share of standardprior authorization requests that were denied ranged from 2% (L.A. Care Health Plan) to 23% (Independence Health Group). For expedited requests, denial rates ranged from 4% (L.A. Care Health Plan) to 21% (CareSource). Three insurers (Centene, Independence Health Group, and UnitedHealth Group) reported higher denial rates for standard requests compared to expedited requests, while three insurers (CVS Health, CareSource, and L.A. Care Health Plan) reported slightly higher denial rates for expedited requests.6
ACA Marketplace: Among the eight ACA Marketplace insurers included in this analysis, the share of standard prior authorization requests that were denied ranged from an average of 3% (GuideWell) to 25% (Centene). Denial rates for expedited requests ranged from 3% (GuideWell) to 23% (Centene). Four insurers (Centene, UnitedHealth Group, Blue Cross and Blue Shield of North Carolina, and Molina) reported higher denial rates for standard requests compared to expedited requests, while two insurers (Elevance and Health Care Service Corporation) reported higher denial rates for expedited requests.7 The remaining two insurers (Oscar and GuideWell) in this analysis had virtually the same rates of denials for both standard and expedited requests.
Market segments inherently have many differences, and the share of prior authorization requests denied also varied for the same insurer participating in multiple markets. For example, UnitedHealth denied 17% of standard requests in Medicare Advantage, 11% in Medicaid managed care, and 21% in the ACA Marketplace.
Appeals Data
Insurers overturned a considerable share of denials upon appeal, with variation by market. Although enrollees or their providers can appeal denied prior authorization requests, research shows that denials are rarely appealed in Medicare Advantage, Medicaid MCOs, or the ACA Marketplace. However, the prior authorization data demonstrate that when denials are appealed, a considerable share are overturned.
The share of standard prior authorization requests initially denied that were then overturned upon appeal8 (referred to in the CMS template as “Requests Approved After Appeal”) was 67% for Medicare Advantage, 47% for Medicaid managed care, and 43% in the ACA Marketplace (Figure 3). We do not present appeals data for expedited requests because that metric is optional, and most insurers did not provide this information. High overturn rates could raise questions about whether the initial request should have been approved or could indicate that the initial request was missing the required documentation to justify the service. Either way, the appeals process can be complicated and time-consuming for providers and patients.
In Medicare Advantage, if the plan upholds its original denial, the case is automatically sent to an independent review entity. In contrast, there is no automatic external medical review of upheld denials in Medicaid managed care and the ACA Marketplace. HHS OIG has suggested that the presence of automatic, independent review could incentivize Medicare Advantage plans to closely review their denials at the first level of appeal and may help explain higher appeal overturn rates in Medicare Advantage compared to Medicaid managed care and the ACA Marketplace.
Appealed prior authorization denials were overturned more often by some large insurers than others (Figure 4).
Medicare Advantage: Across the six largest Medicare Advantage insurers, the share of denied standard prior authorization requests that were approved varied substantially. Denials were overturned upon appeal more than 90% of the time by Centene, while Kaiser Permanente overturned denials upon appeal 40% of the time.
Medicaid Managed Care: Among the Medicaid managed care insurers examined, UnitedHealth Group overturned 81% of denials upon appeal. The remaining insurers overturned between 22% (CVS) and 48% (Molina) of denials upon appeal. (One Medicaid managed care insurer included in this analysis (L.A. Care Health Plan) did not report overturned prior authorization denials as a percentage of standard prior authorization requests that were appealed; therefore, its appeals data are not included here.)
ACA Marketplace: On average, Health Care Service Corporation overturned just 16% of denials upon appeal, while Centene overturned just over half (54%) of denials upon appeal. Six of the eight large insurers reported overturning denials upon appeal less than half the time.
Median Response Times
Median response times for prior authorization determinations were about 1 day for standard requests, with slightly more variation for expedited requests (Figure 5).
The median time between the submission of a prior authorization request and the determination by the insurer, or response time, for standard requests was about 1 day for Medicare Advantage, Medicaid managed care, and the ACA Marketplace (0.9 days or just under 22 hours), substantially less than the federally required maximum time permitted for standard requests.9 The median response time for expedited requests was about half a day (0.4 days or just under 10 hours) for Medicare Advantage, just under 1 day (0.8 days or approximately 19 hours) for Medicaid managed care, and 1 day for the ACA Marketplace. Federal regulations in 2025 required insurers to send a determination for standard requests within 14 calendar days for Medicare Advantage and Medicaid managed care and within 15 days for the ACA Marketplace. Determinations for expedited requests had to be sent within 72 hours for insurers in all three markets.10
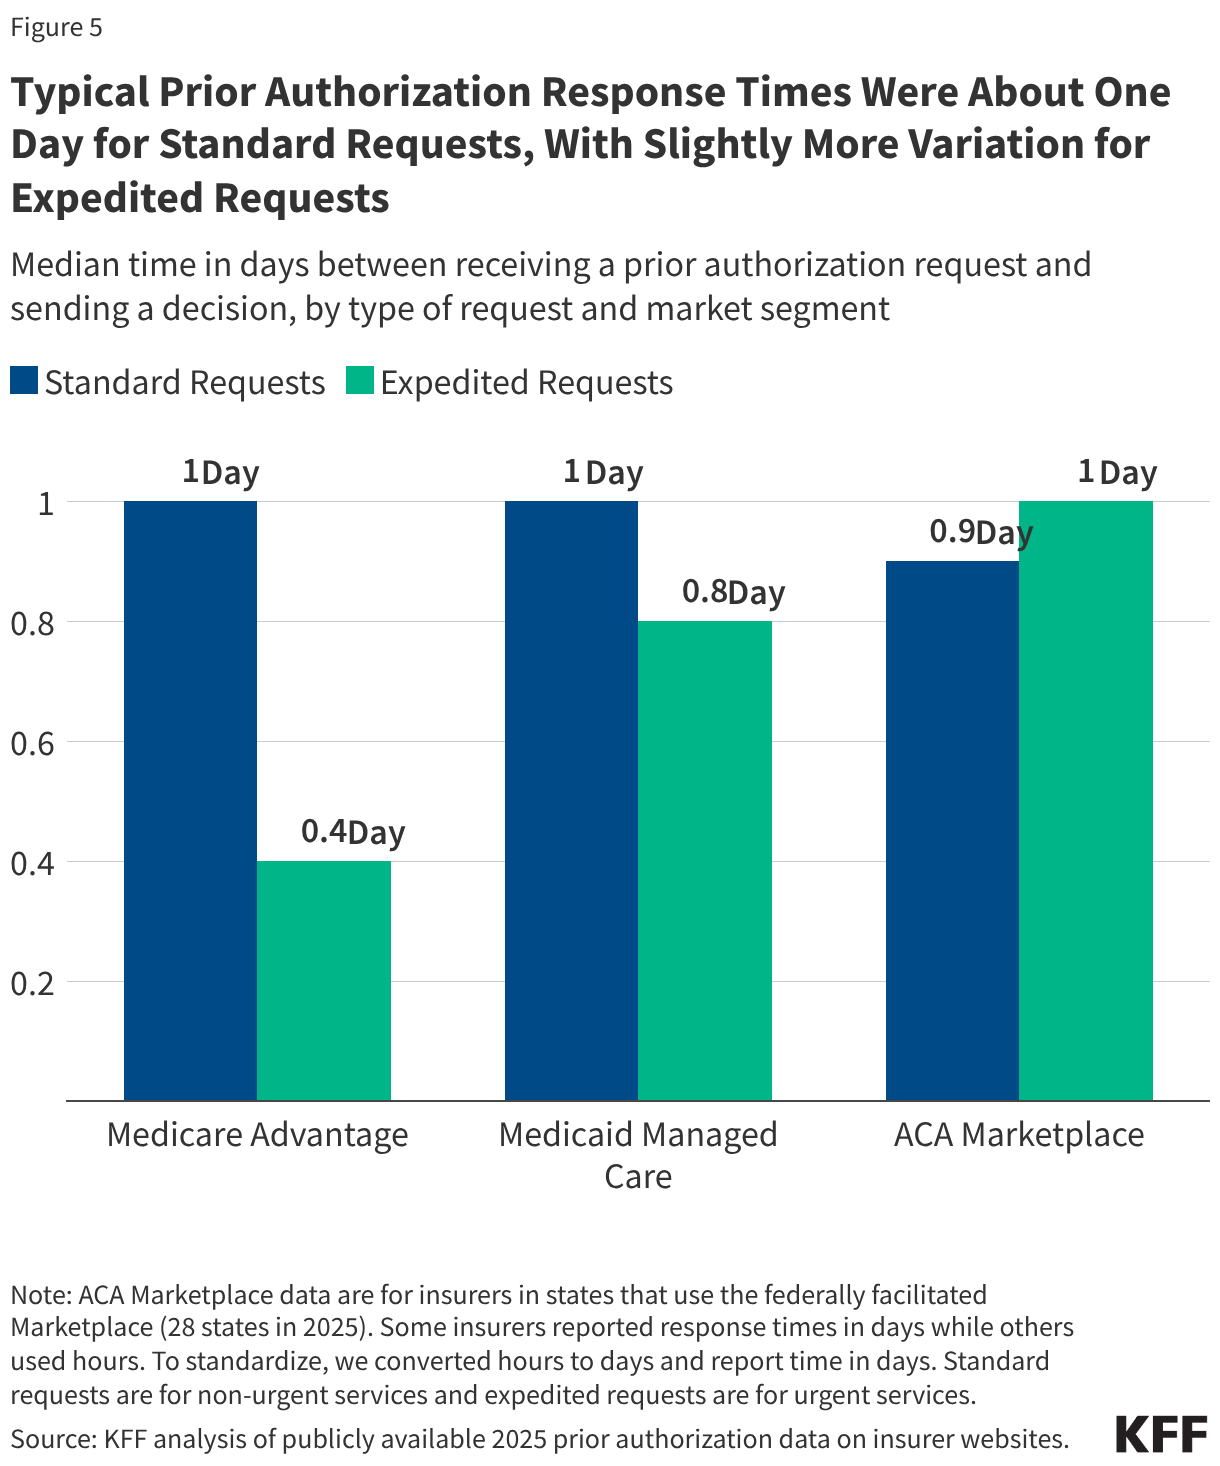
Median response times likely reflect (at least in part) the increasing use of technology in the prior authorization process, such as artificial intelligence and electronic prior authorization systems. Still, nearly one-quarter (24%) of insured adults reported in a July 2025 KFF poll that their health insurance company had delayed their ability to get a requested health care service, treatment, or medication in the past two years.And other research and media reports demonstrate that some patients experience much longer response times, sometimes with serious health consequences. In addition to the 2024 regulation’s provisions aimed at streamlining and automating the prior authorization process, in June 2025, a group of health insurers voluntarily pledged to expand real-time responses for prior authorization approvals by 2027.
Median response times for prior authorization determinations varied somewhat among large insurers (Figure 6).
Medicare Advantage: The median response time for standard requests varied from less than 1 day (CVS, Humana, and Kaiser Permanente) to 2 days (Centene). Across the six insurers examined, the response times for expedited requests were similar or slightly shorter than the response times for standard requests.
Medicaid Managed Care: The median response time for standard prior authorization requests varied from 1 day (Centene, Elevance, and Molina) to 4 days (CareSource). Elevance had the same median response time for standard and expedited requests, while the other insurers reported shorter response times for expedited requests.
ACA Marketplace: Among the eight large insurers included in this analysis, median response times for standard requests ranged from less than 1 day (UnitedHealth Group, GuideWell, and Health Care Service Corporation) to 4 days (Molina). All but one insurer reported similar or shorter median response times for expedited requests than standard requests.
Challenges for Consumers Accessing and Interpreting Prior Authorization Data
Uniform federal reporting requirements represent a step toward better understanding insurer prior authorization metrics across insurance markets. While the data provide new insights, particularly for Medicaid managed care and the ACA Marketplace insurers, gaps remain. Although a target audience of prior authorization reporting is consumers, those who do not have a deep understanding of health insurance terminology and concepts may struggle to interpret these reports. In previous KFF research, one-quarter of insured adults reported difficulty understanding specific terms their health insurer uses. Difficulty locating metrics on insurer websites, an absence of more detailed data, and unclear reporting standards could additionally pose challenges for consumers wishing to use the data directly to compare health insurers, as envisioned in the 2024 regulation. However, intermediaries may aggregate and explain the data to make it more accessible for consumers.
Insurers are not required to report the number of prior authorization requests for each metric (only percentages), which limits the ability to make useful comparisons and gauge the scale of requests, denials, and approvals behind reported percentages. For instance, a low denial rate could translate into a large number of denials if the insurer received a substantial number of prior authorization requests. Conversely, a high denial rate might be seen with a relatively low number of prior authorization requests if many of those requests were denied (which could indicate the prior authorization process is better tailored, rather than a concerning number of denials). In a previous KFF analysis of the use of prior authorization in Medicare Advantage, for example, the number of prior authorization determinations per enrollee was inversely related to the share of requests that were denied (i.e., insurers with more prior authorization requests denied a smaller share of the requests than those with fewer requests). As a result, the absolute number of denied prior authorization requests per enrollee was similar across insurers with different denial rates.
Numeric counts would provide more context for understanding whether an apparently high or low denial rate reflects a meaningful volume of prior authorization requests. Additionally, they are also necessary to distinguish a true zero from missing data or inapplicable statistics. For example, the “Approved upon appeal” metric does not include the number of appeals an insurer received. Insurers that report 0% of appeals were approved are not required to indicate whether they received no appeals or that none of the appeals were approved. Furthermore, insurers were not required to report the appeal outcome by service or the reason(s) for the decision, making it difficult to interpret differences across and within markets.
Making comparisons between insurers also requires an understanding of policy nuances. An insurer might have a high prior authorization approval rate because there are many services requiring prior authorization that are almost always approved. Some insurers exempt providers from at least some prior authorization requirements if they consistently have a high prior authorization approval rate (e.g., 90%), known as “gold card” programs. These programs can further complicate comparisons, as the approval rate no longer reflects the entirety of the procedures that might otherwise have required prior authorization. Insurers that rely heavily on gold carding may, in turn, report lower approval rates: since providers that are most clinically compliant are exempt from prior authorization, reported statistics from these insurers include only providers that may inherently have lower approval rates.
Comparisons between issuers are also challenging because of inconsistencies in how metrics are reported. Although CMS published an example template for reporting the prior authorization metrics, its use by insurers is not mandatory, and most insurers used different formats, which could make comparing metrics across insurers burdensome for the public. Some inconsistencies in reporting level could make comparisons difficult. For example, some ACA Marketplace insurers reported prior authorization metrics at the national level, as opposed to separating their reporting by state, so it is not possible to understand geographic variation in prior authorization practices from the same insurer. A national average denial rate for one insurer may or may not reflect the insurer’s denial rate in the state where the consumer lives.
Response times are difficult to interpret. Comparing response timeframes by type of request can provide some insight into the extent to which insurers are meeting the regulatory timeframe requirements. However, insurers are only required to report median and average response times, which limits the ability to determine how often decisions exceed those timeframes. Also, without a required reporting unit, some insurers reported time in hours, while others used days or fractional days. Although median response times across all three markets were typically well below the required maximums, additional information — such as optional metrics on the percentage of requests approved or denied within the required timeframe and ranges of response times — would allow for a more complete picture of how quickly prior authorization decisions are made and how frequently decision times exceed the required timeframes. Additionally, consumers may not always understand how to interpret the median – that is, by definition, half of the prior authorization requests exceed the median time reported.
Comparing insurers across lines of business requires consideration of differences between enrollee populations. Case mix (how sick the enrollee population is) and service mix (which services are most commonly provided for enrollees) likely vary substantially between lines of business, and potentially between insurers. For example, the older Medicare Advantage population likely differs substantially from the general population covered by ACA Marketplaces and the higher-need populations of Medicaid. If denial rates vary by service type and the services for which denials are more common comprise a larger share of prior authorization requests in a given business segment, the higher denial rate would reflect that difference in service use. However, without more detailed information, it is not possible to identify what is driving the differences.
Looking Forward
In July 2026, CMS published an updated metrics reporting overview and template for insurers with changes that address some of the gaps addressed above for the 2027 reporting period. It specifies that posting metrics in locations on insurers’ websites that cannot be reached through ordinary navigation is not considered to meet the regulation’s requirement that the information be “publicly accessible.” While still not required, the updated overview does stress that the numerators and denominators specified in the template are “expected.” It notes that median determination response times that are less than one day must be reported in hours, not rounded to “0 days.” It also recommends that insurers identify and explain in their report any data quality issues or concerns.
In addition, the 2026 CMS Interoperability Standards and Prior Authorization for Drugs proposed rule (“2026 proposed rule”) attempts to address some of the data gaps in the 2024 regulation by expanding the prior authorization data that must be publicly reported. The proposed rule would require the same CMS-regulated insurers to publish new metrics for non-drug items and services (e.g., for both standard and expedited prior authorization requests, the number and percentage of requests that remain denied after appeal), as well as the numeric counts for both the new and existing metrics. Also, while CMS currently provides suggested denominators (or universe of prior authorization determinations to include), the proposed rule would standardize the denominators that insurers must use when calculating different metrics. Together, these changes would provide more insight into prior authorization requests, denials, and appeals; make the data easier to interpret; and improve the ability to make comparisons across insurers. More detailed prior authorization metrics could help assess whether initiatives to improve the prior authorization process more broadly, such as the voluntary commitments made by several insurers in June 2025, are leading to meaningful change. However, the proposed rule does not include a requirement that insurers report prior authorization metrics by service category.
Another significant proposed change would require insurers to report prior authorization metrics for prescription drugs, separate from non-drug items and services, for both standard and expedited requests. (This requirement does not apply to insurers offering Medicare Part D prescription drug plans, where separate reporting requirements for coverage determinations already apply.)
There are additional emerging federal and state data reporting policies that are market-specific:
Medicare Advantage
CMS has announced a pilot program where Medicare Advantage insurers can voluntarily submit more detailed prior authorization data, including data for specific service categories. The Trump administration has indicated that it intends to make more detailed reporting mandatory starting with the 2027 plan year. While that may help understand the impact of prior authorization in Medicare Advantage, the data will not be available for several years.
Federal legislation entitled “Improving Seniors’ Timely Access to Care Act of 2025” aims to improve prior authorization in Medicare Advantage. The bill would require Medicare Advantage plans to report certain prior authorization metrics annually to the Secretary of Health and Human Services, who would publish them on a public website. Some required metrics are similar to those required by CMS under the 2024 regulation, but the bill would also require plans to report the percentage and number of specified requests denied or approved during the previous plan year through the use of technology (e.g., artificial intelligence technology).
Medicaid Managed Care
Beginning July 2026, CMS requires states to collect and report prior authorization metrics for Medicaid managed care plans in Managed Care Program Annual Reports (MCPARs) submitted to CMS. In addition to the metrics required by the 2024 regulation, states are required to include the total number of standard and expedited prior authorization requests received. CMS makes MCPARs publicly available on Medicaid.gov, which may make data easier to locate in the future, though there will be a lag between state submission and CMS public posting.
The 2026 proposed rule would align prior authorization metric reporting for Medicaid and CHIP managed care with contract rating periods (which vary across states) and would require Medicaid and CHIP managed care plans to publicly post metrics no later than 90 days after each rating period ends. The rule would also require plans to report metrics by program (defined by a specified set of benefits and eligibility criteria identified in managed care plan contracts), as well as by plan. This proposal aligns with MCPAR reporting requirements and could provide more meaningful information on prior authorization performance by plan and program than aggregate information across programs within a state.
Private Insurance Market
Federal efforts to increase transparency into prior authorization practices in commercial coverage have so far been limited to ACA plans on the FFM. There is no publicly available prior authorization data for self-funded plans sponsored by private employers, which cover the majority of workers with employer-sponsored health insurance. Some states have taken action to increase transparency into prior authorization practices, including by collecting more granular prior authorization data from state-regulated insurers than the 2024 federal regulation requires and using the data to inform future actions aimed at curbing certain insurer practices.
For example, in 2025, Massachusetts conducted a special examination requiring insurers offering fully insured health plans in the state’s private insurance market to submit detailed prior authorization data (including numeric counts and prescription drugs) broken out by service category. The state published an analysis of the data in 2026, noting that it intended to use the data to inform future regulatory guidance. Following this examination, the state updated its insurance regulations to prohibit prior authorization requirements for a wide variety of services provided in-network, including some identified in the state’s analysis as having the most prior authorization requests and high approval rates, such as radiology (for enrollees with cancer) and physical, occupational, and speech therapy.
Similarly, in 2025, Iowa enacted a law requiring state-regulated insurers to submit certain prior authorization data to the state annually, which will be made available to the public, and requiring utilization review organizations to eliminate prior authorization requirements for health care services that meet certain criteria.
Going forward, more states may build upon the federal requirements by requiring insurers in their state to provide more detailed information about prior authorization practices and use that information to address the scope of prior authorization requirements.
Methodology
This analysis includes data collected from the websites of Medicare Advantage, Medicaid managed care, and ACA federally facilitated Marketplace (FFM) insurers that each had at least 2.5% market share of enrollment in their respective market segments. In total, we collected data from 14 unique insurers in these markets, representing approximately 71 million enrollees. See Appendix Table 1 for more details.
We reported prior authorization metrics at the parent company level. Subsidiary insurers may have a different name from the parent company, and the parent company may own more than one insurer. For ease of reading, we refer to the parent company as the “insurer” in this analysis.
Medicare Advantage
Public reports were collected for Medicare Advantage insurers enrolling at least 2.5% of all Medicare Advantage enrollees in 2025. Altogether, these insurers comprised 72% of Medicare Advantage enrollment in 2025. In some cases, reports could not be located, and so the data included in this analysis reflects information provided for Medicare Advantage contracts covering 69% (25 million) of Medicare Advantage enrollees in 2025. Specifically, reports covering at least 95% of enrollment were identified for each insurer included in the analysis, with the exception of Elevance-sponsored plans, where reports covering 83% of enrollment were identified. Medicare Advantage organizations are required to report metrics at the contract level. CMS December 2025 enrollment was used to weight contract-level data when aggregating to the insurer and total market level.
Medicaid Managed Care
Public reports were collected for Medicaid MCO insurers enrolling at least 2.5% of all Medicaid MCO enrollees as of July 2024 (the latest available national Medicaid managed care enrollment data). Reports for limited benefit prepaid ambulatory health plans (PAHPs) and prepaid inpatient health plans (PIHPs) were not included. Altogether, these insurers comprised 57% of Medicaid MCOs as of July 2024. In some cases, reports could not be located, and so the data included in this analysis reflects information provided for Medicaid MCO contracts covering 54% (nearly 36 million) of Medicaid MCO enrollees as of July 2024. Specifically, reports covering at least 92% of enrollment were identified for each insurer included in the analysis, with the exception of Molina and Independence Health Group plans, where reports covering 87% and 84% of enrollment, respectively, were identified. CMS July 2024 enrollment was used to weight plan-level data when aggregating to the insurer and total market level.
Although the 2024 regulations require Medicaid and CHIP fee-for-service (FFS) programs and CHIP managed care plans to publicly report prior authorization metrics, these entities are not included in this analysis because reports were difficult to locate and comprehensive national plan-level enrollment data are not available for CHIP managed care. Additionally, the populations and services covered under FFS vary substantially across states, limiting comparability.
ACA Marketplace
We searched for public reports for the nine ACA Marketplace insurers with at least 2.5% market share in the 28 states that used the FFM (HealthCare.gov) in 2025. (Federal reporting requirements do not extend to states that operate their own Marketplaces, including state-based Marketplaces that use the HealthCare.gov platform). Prior authorization metrics could not be located for one of these insurers (CVS, which had 5% market share). UnitedHealth Group, which reported prior authorization data at the state level, did not include data for its plans sold in Oklahoma (less than 1% of its enrollment). Altogether, the data in this analysis reflect information provided for Marketplace insurers covering 74% (10.8 million) of ACA FFM enrollees in 2025.
Marketplace insurers are required to report metrics at the issuer level. Some insurers broke out their prior authorization metrics by state, while others provided national averages. ACA Marketplace enrollment was obtained from Mark Farrah Associates Health Coverage Portal, including mapping insurers to parent companies. To weight insurer-level data to the total market, enrollment was first filtered to FFM states and then aggregated to parent company.
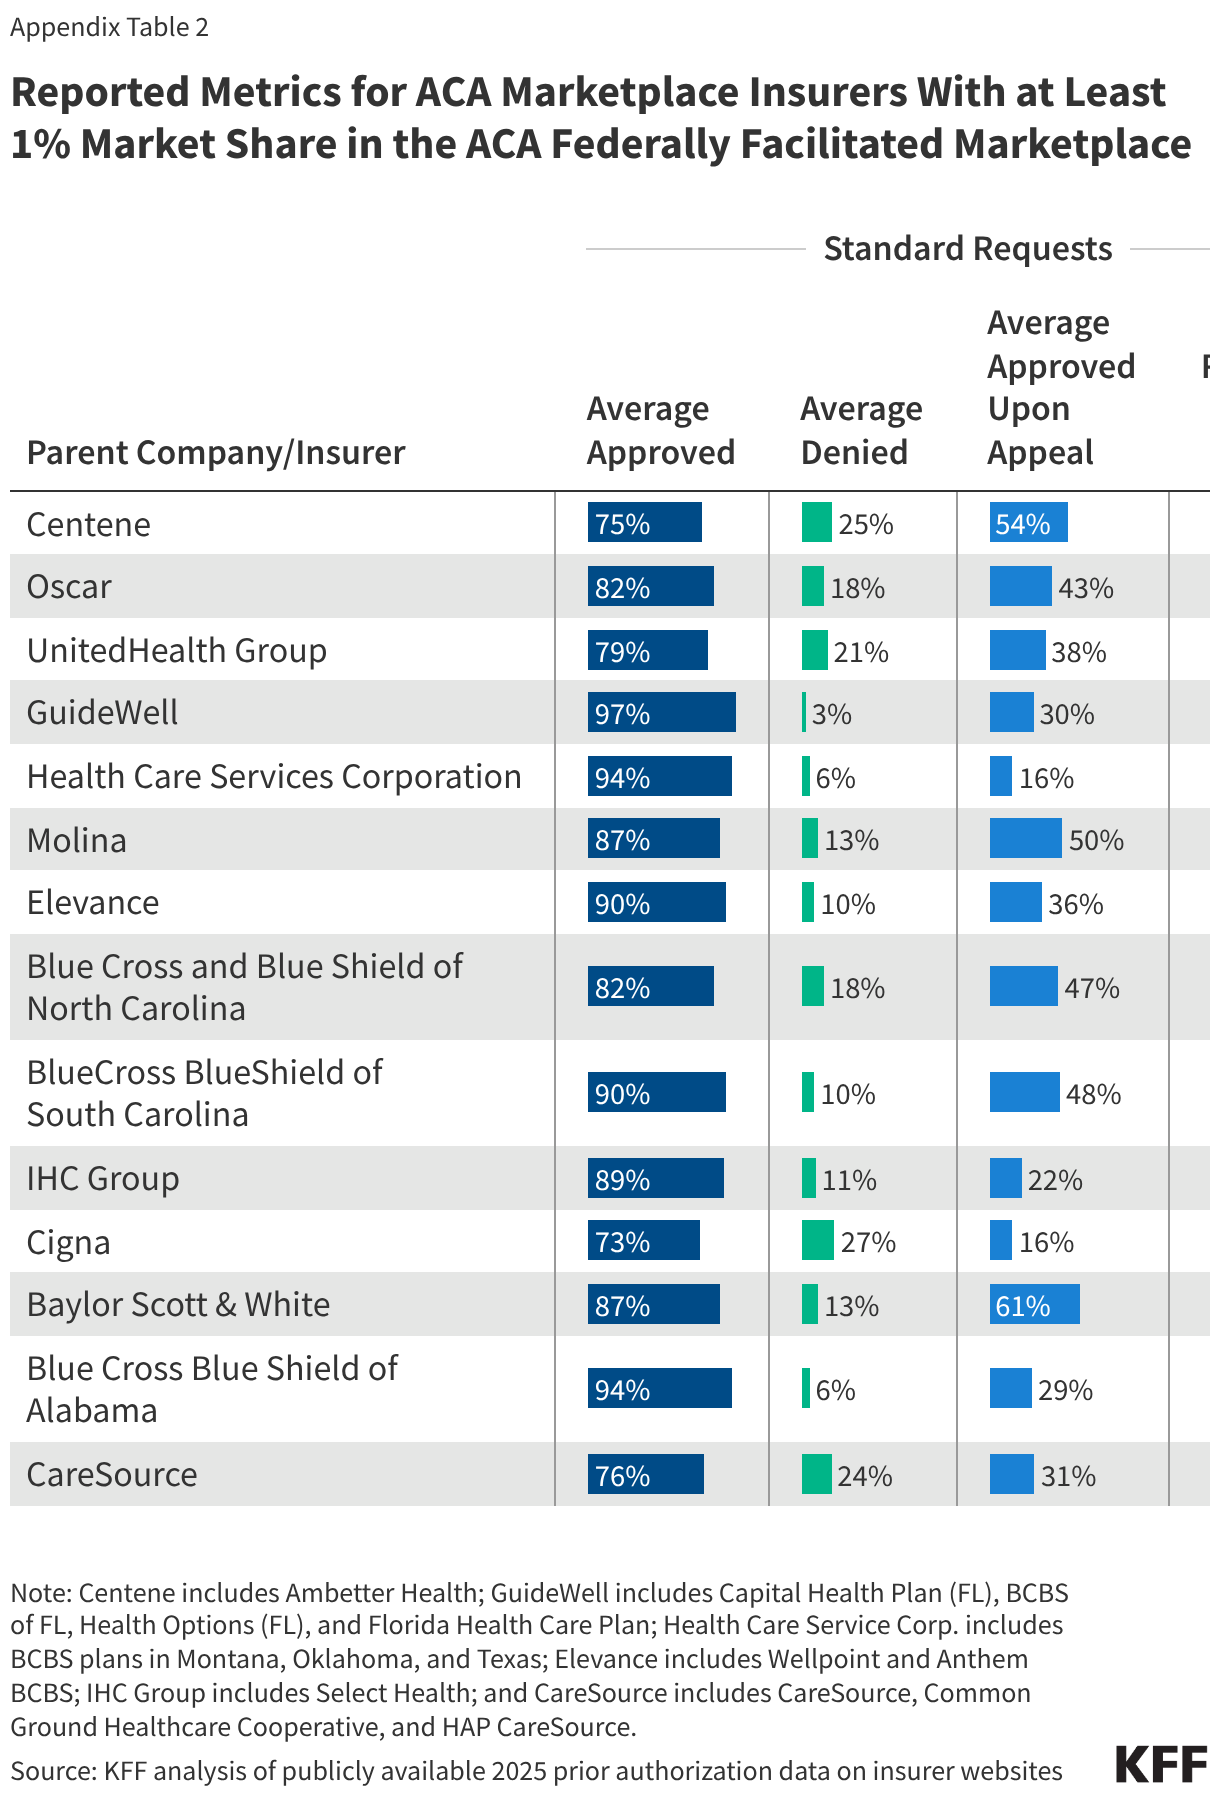
Due to the large number of smaller insurers in the ACA Marketplace, relative to Medicare Advantage and Medicaid managed care, we also collected and analyzed data for ACA FFM insurers that had at least 1% market share in 2025, compiled in Table 2 of the Appendix. For consistency across market segments, however, only data from insurers with at least 2.5% market share were included in the overall analysis.
Appendix
Endnotes
- The turnaround time for standard requests in Medicare Advantage and Medicaid managed care was shortened to 7 calendar days beginning in 2026. Timeframes for the ACA Marketplace remain the same. ↩︎
- CMS makes data on post-service (not pre-service/prior authorization) claims denials available for plans on the ACA FFM. ↩︎
- Except CVS (which had 5% market share on the ACA FFM in 2025), as the company’s prior authorization metrics for that market could not be located. ↩︎
- Due to the large number of smaller insurers in the ACA Marketplace, relative to Medicare Advantage and Medicaid managed care, we collected data for ACA FFM insurers that have at least 1% market share, compiled in Appendix Table 2. For consistency across market segments, only data from insurers with at least 2.5% market share were included in this analysis. ↩︎
- Centene includes Wellcare, Elevance includes Anthem BCBS and Wellpoint, and CVS includes Aetna. ↩︎
- Elevance includes Amerigroup, Independence Health Group includes AmeriHealth Caritas, and CVS includes Aetna. ↩︎
- Centene includes Ambetter Health; GuideWell includes Capital Health Plan (FL), BCBS of FL, Health Options (FL), and Florida Health Care Plan; Health Care Service Corp. includes BCBS plans in Montana, Oklahoma, and Texas; Elevance includes Wellpoint and Anthem BCBS. ↩︎
- FAQs currently on the CMS website indicate that appeals metrics should aggregate all levels of appeals, including internal and external reviews. Note that this clarification appears to have been added in early 2026. ↩︎
- Some insurers reported response times in days while others used hours. To standardize, we converted hours to days and report time in days. ↩︎
- The turnaround time for standard requests in Medicare Advantage and Medicaid managed care was shortened to 7 calendar days beginning in 2026. Timeframes for the ACA Marketplace remain the same. ↩︎