
At Least 37 States Have Medicaid State Directed Payments for Hospital Services That Could Be Reduced by the 2025 Reconciliation Law Limits
The 2025 reconciliation law reduced federal Medicaid spending by an estimated $911 billion from 2025 through 2034, some of which stems from new restrictions on Medicaid state directed payments (SDPs) for hospital and other health care services. While states are generally prohibited from directing how managed care organizations (MCOs) pay for care, states can implement SDPs that require MCOs to increase rates or set minimum rates for specified Medicaid services. In authorizing SDPs and allowing states to require payments up to the rates paid by private insurers, the Centers for Medicare and Medicaid Services (CMS) aimed to help states improve access to care and provider participation. A 2024 rule on Medicaid managed care that codified rules for SDPs increased states’ use of SPDs and associated federal spending, spurring opponents to argue that private insurance rates were too high a threshold. Many states that contract with MCOs use SDPs to make uniform rate increases that function like supplemental payments in fee-for-service (FFS) Medicaid. This issue brief explores the state-level implications of forthcoming restrictions for SDPs, focusing on SDPs that pay for hospital services because KFF estimates that 84% of SDP spending is directed toward hospital services. Two companion issue briefs provide a summary of forthcoming changes and estimate current SDP spending before forthcoming restrictions take effect.
The analysis estimates the amount of current federal spending on SDPs for hospital services that exceeds the new limits established by the 2025 reconciliation law. In practice, the new limits will be gradually phased in over time for existing SDPs. In some cases, spending on SDPs could also be affected by new limits on provider taxes prior to the SDP limits taking effect, or the two changes will affect SDPs concurrently. The findings of this analysis demonstrate the potential amount of federal funding for hospital services that would be above the new limits (when fully implemented), providing a sense of the eventual magnitude of the changes and how they vary by state. The focus is federal funding because many states finance SDPs through either provider taxes or intergovernmental transfers (IGTs), making it difficult to determine the amount of net revenues health care providers receive. This analysis finds that:
- At least 37 states have Medicaid state directed payments for hospital services that could be reduced by the 2025 reconciliation law limits based on their current payment policies (Figure 1).
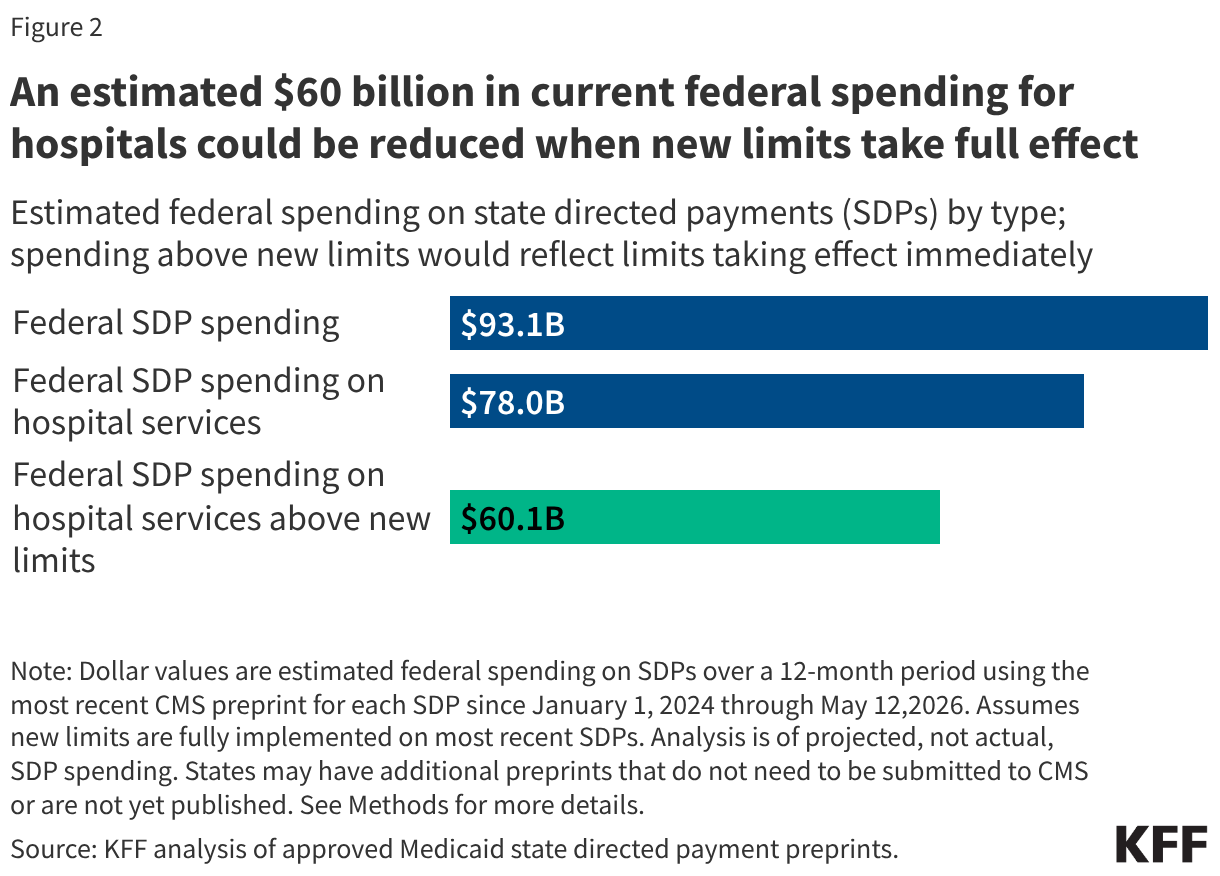
- An estimated $60 billion in current federal spending for hospital services through SDPs is above new limits and could be reduced when the new limits on SDPs are fully implemented.
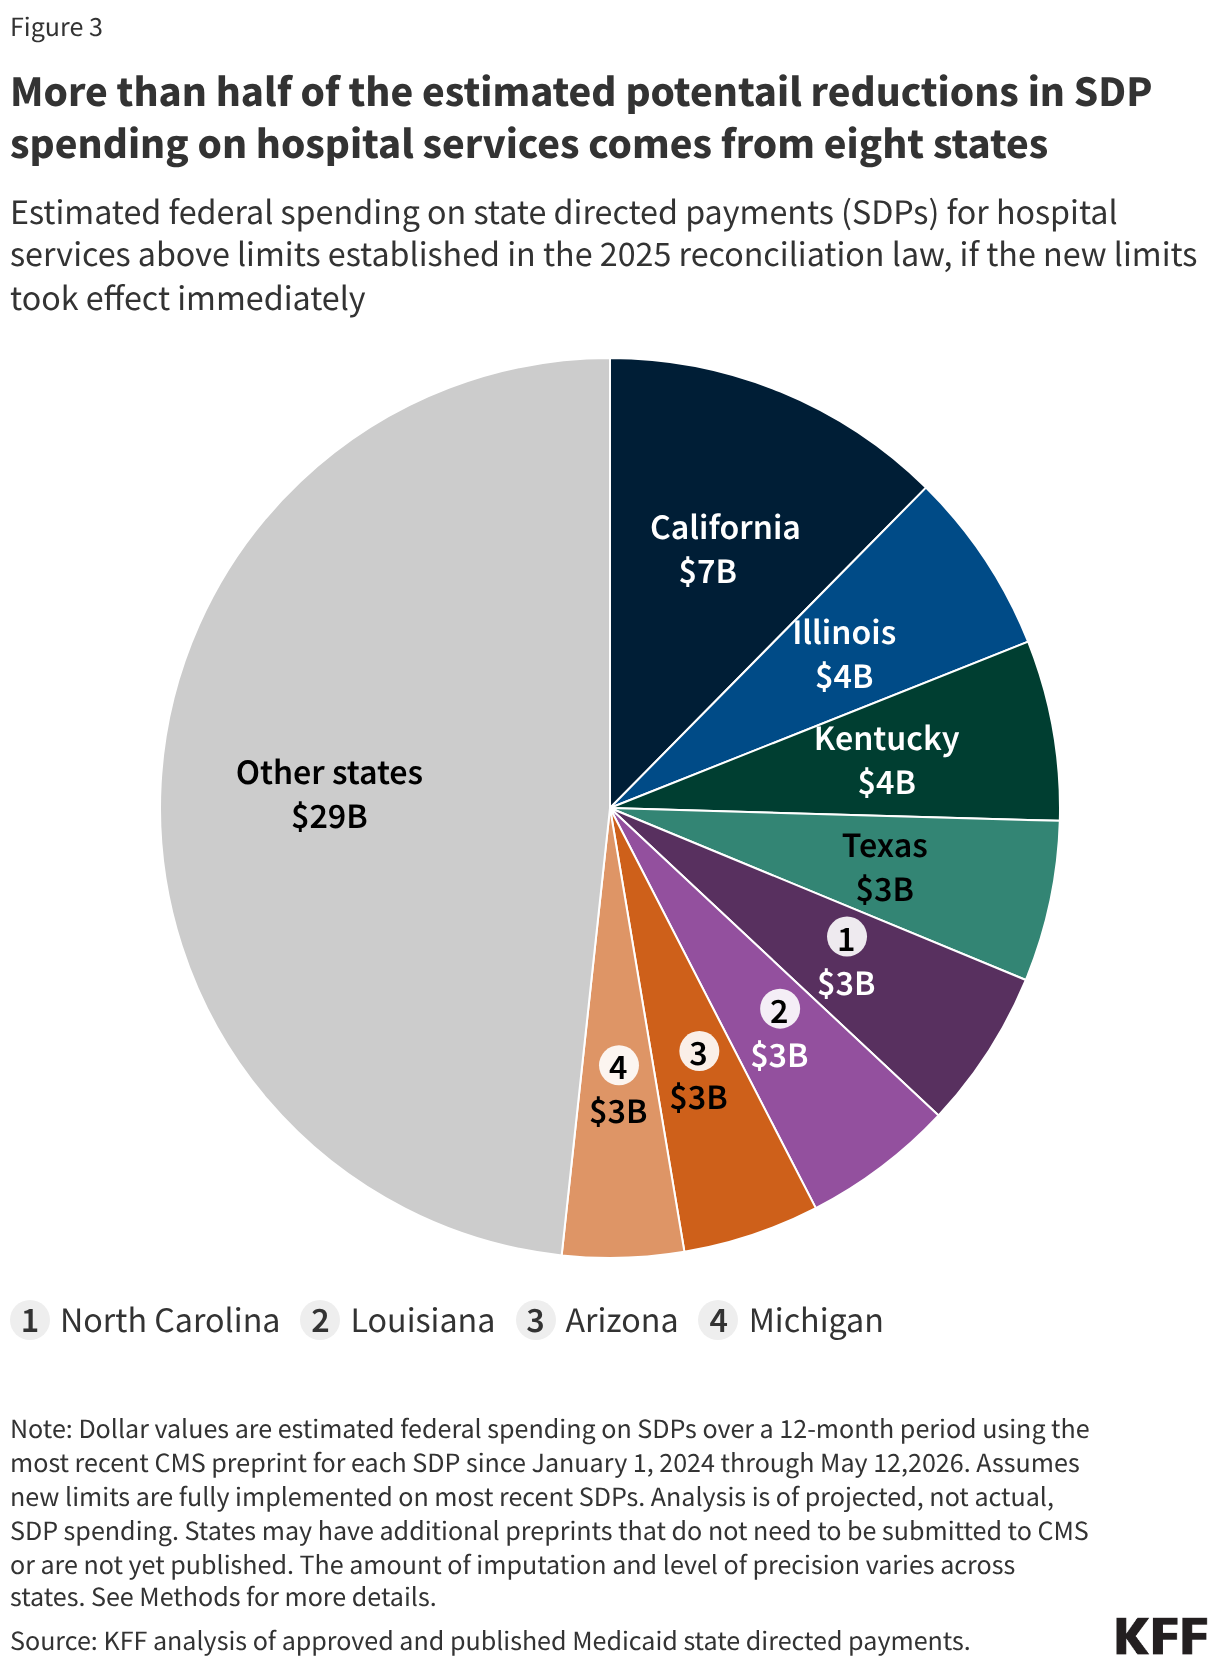
- More than half of the estimated potential reductions in federal SDP spending on hospital services above new limits comes from eight states (CA, IL, KY, TX, NC, LA, AZ and MI).
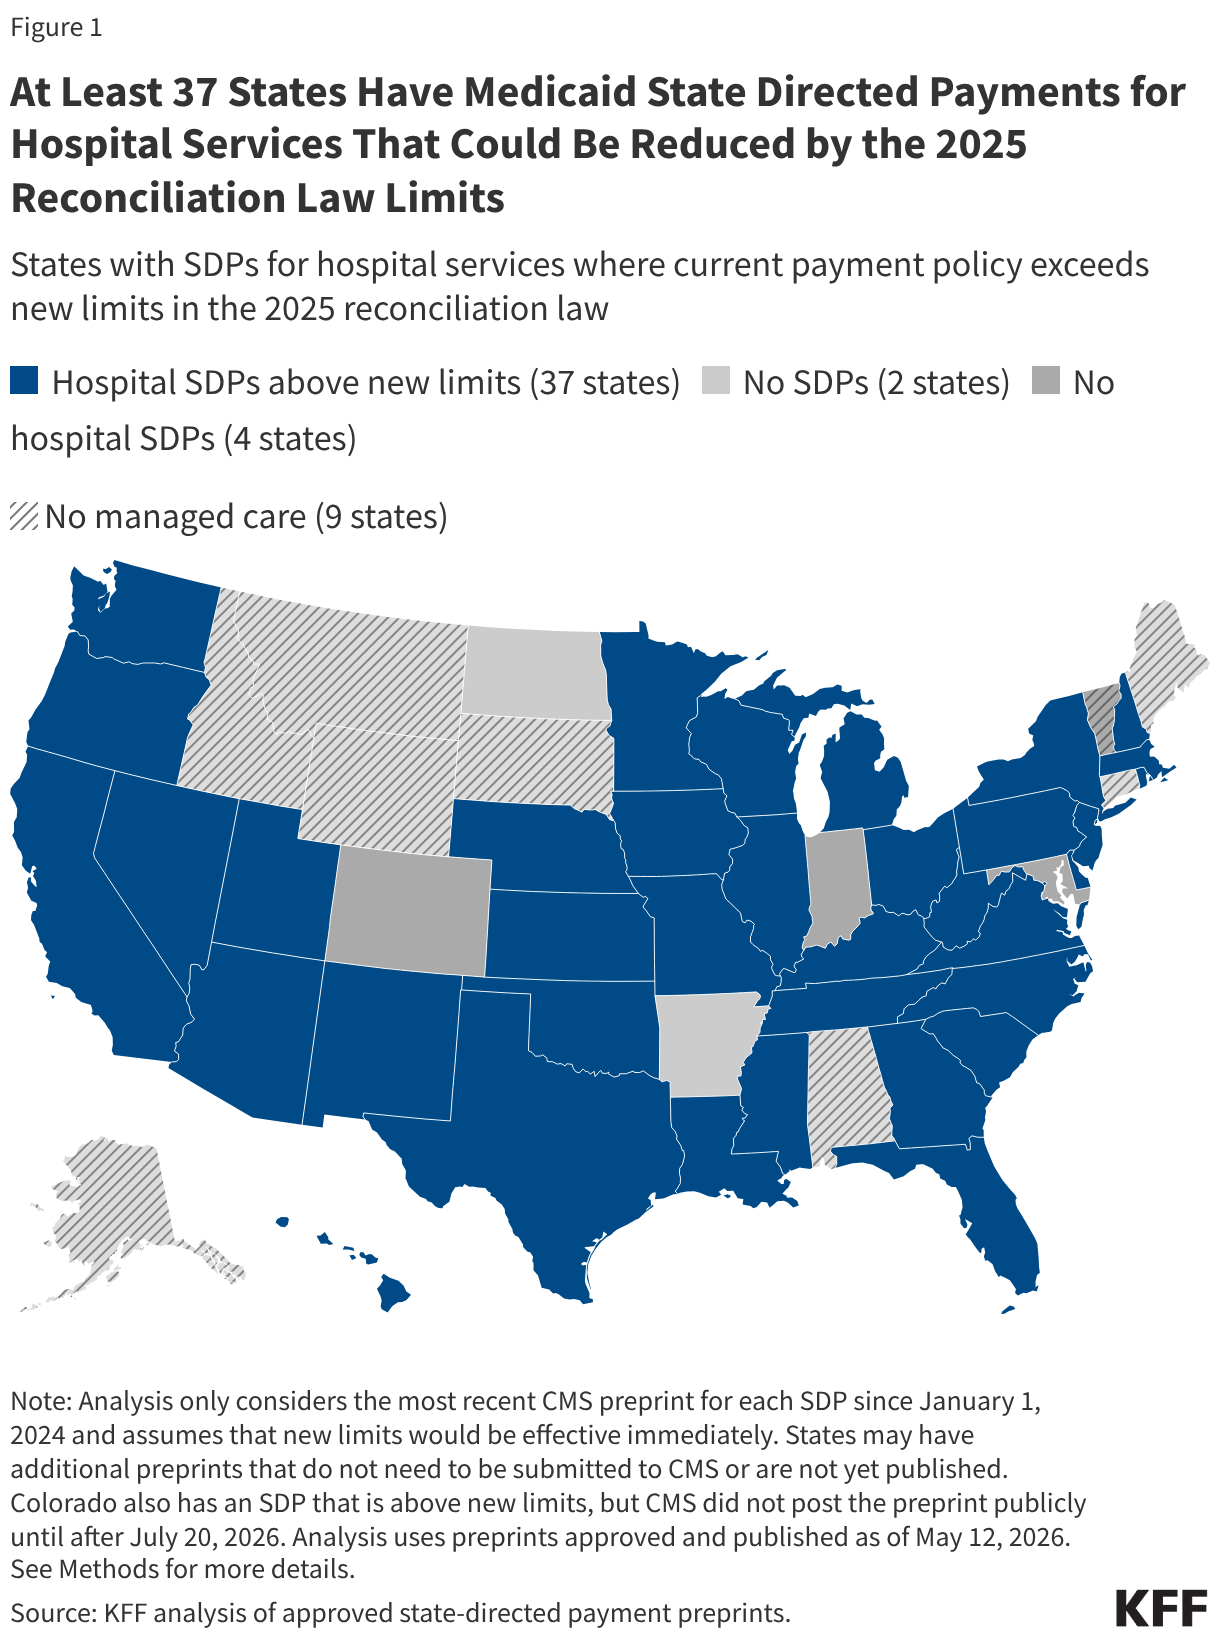
Among SDPs which started on January 1, 2024 or later and were approved through May 12, 2026, KFF estimates that SDPs with payments for hospital services in 37 states are likely affected by the limits. Of those SDPs, KFF was able to estimate the amount of spending directed to hospitals that exceeded the new payment limits in 131 “preprints” filed by 35 states (see Methods for a description of KFF’s criteria for including preprints in the analysis). Preprints are application forms that document how states direct Medicaid managed care plans to pay providers using SDPs. Preprints are the only national source of data on SDPs but are limited because there are gaps in data provided by the preprints. For example, the preprints include states’ projected spending on SDPs but not actual spending, do not document how total spending is allocated across different services when a single SDP governs payments for multiple services, and omit details about the required payment rates for about half ($39.6 billion) of all hospital spending in this analysis. Such data gaps required KFF to impute missing data in several cases and rely on the best available sources of data in others, contributing to uncertainty in the estimates (see Methods). Although the estimated amounts of spending above new limits are uncertain, there are 37 states with SDPs that pay for hospital services using a rate that is based on average commercial rates. Those SDPs will likely no longer be permissible at current rates under the new law.
The 2025 reconciliation law established new payment limits for SDPs, capping them at or near Medicare rates instead of average commercial rates (ACR). The new limits are set in relation to a “benchmark,” which is a standardized rate that measures MCO rates relative to other payment rates such as Medicaid FFS, Medicare FFS, and average commercial (private) rates. Before the reconciliation law passed, CMS capped SDP payment limits at average commercial rates, which average about double what Medicare pays. (Prior federal rules specified average commercial rates were the limit for hospital services, nursing facility services and professional services at academic medical centers. CMS informally applied the same limit to other services.) Under the reconciliation law limits, SDP payment rates may not exceed 100% of the Medicare payment rate in states that have adopted the Affordable Care Act (ACA) Medicaid expansion (“expansion states”) and 110% of the Medicare payment rate for non-expansion states. In June 2025, CMS released a proposed rule that would implement the new changes.
To estimate the share of hospital spending above new limits, KFF started with estimated SDP spending for hospital services from its prior analysis, which also captured states’ estimated base payment rates for hospital services (e.g., without the SDP) and the final payment rates after accounting for SDPs. As noted in the prior brief, many SDPs indicate the type of benchmark used (e.g., average commercial rates or Medicare rates) but do not provide the payment level (e.g., 100% or 80% of average commercial rates). For hospital services with SDPs benchmarked to commercial rates, KFF estimated the Medicare-equivalent rates using RAND’s state-level inpatient and outpatient ratios of commercial to Medicare rates. KFF compared the base and final payment rates to the Medicare-based limits to estimate the amount of SDP spending that would fall above the new Medicare-related limits when the law is fully implemented (see Methods). Making assumptions about missing payment rate information and about conversions to Medicare rates contributes to the uncertainty of KFF estimates.
New limits on SDPs are likely to decrease Medicaid payments for hospital services in at least 37 states (Figure 1). There are 37 states with SDPs that direct payments for hospital services, all of which have at least one SDP with established payment rates for hospital services estimated to exceed the new limits established by the 2025 reconciliation law. Additional states could be affected by the new limits if there are SDP preprints that CMS has not yet approved or published, and all states are limited in their ability to create new SDPs. Some states may not know whether they will be able to implement planned SDPs. For instance, Colorado submitted an SDP proposal to CMS on June 27, 2025 that would pay hospitals using average commercial rates. The proposal notes that the program could represent an additional $378 million in reimbursements to Colorado hospitals. However, as of July 20, 2026, CMS had not published the preprint on its approved list (although it was posted as of August 11, 2026).
An estimated $60 billion in current federal spending for hospitals through SDPs could be reduced once the new limits take full effect (Figure 2). This represents 64% of federal spending on SDPs and 77% of federal spending on SDPs for hospital services. The $60 billion is an estimate of the amount by which federal payments would currently be above the new limits if those limits were in effect today. It does not represent the amount by which federal payments would be reduced in any given year, since these limits will be phased in over time starting in January 2028 and will fully take effect at different times in different states.
The $60 billion in federal SDP spending above new limits does not represent annual estimates of hospitals’ Medicaid revenue losses. Although the new limits on SDPs have major implications for hospital finances, spending above the new limits is not equivalent to the yearly change in revenues hospitals might expect. Actual revenue losses for hospitals could be higher or lower because of interaction with other policy changes and state and hospital behavioral responses:
- Additional Medicaid policy changes. The 2025 reconciliation law is estimated to reduce federal Medicaid spending by $911 billion, with several policies expected to reduce hospital revenues. For example, changes to provider taxes could affect how states finance the state share of Medicaid. In a proposed rule on the provider tax changes, CMS reports that the changes to SDPs in total (which include providers other than hospitals) are estimated to reduce federal Medicaid spending by $510 billion from 2026-2034, but that $155 billion of those reductions are also part of the reduced spending stemming from changes to provider tax rules. Beyond provider tax changes, hospital revenues will be affected by new work requirements and other provisions that could result in fewer patients being covered by Medicaid, and more people being uninsured.
- State Medicaid dollars above new limits. New SDP spending limits may also reduce state spending, but this analysis only includes the federal share. The state share is excluded because states fund some or all the state share for SDPs with provider taxes or intergovernmental transfers from entities such as public hospitals. In such cases, it is unclear how much the state share represents new revenues to hospitals in aggregate.
- Possible offsets from states. States might offset some of the reductions in SDP revenues by increasing base payment rates for hospital services, although their ability to do so may be limited given new restrictions on financing mechanisms like provider taxes.
More than half of the estimated potential reductions in federal SDP spending on hospital services comes from eight states (Figure 3). California ($7.4 billion), Illinois ($4.0 billion), Kentucky ($3.9 billion), Texas ($3.5 billion), North Carolina ($3.4 billion), Louisiana ($3.3 billion), Arizona ($3.0 billion), and Michigan ($2.6 billion) have the largest estimated amounts of federal SDP spending for hospital services above new limits. Although the analysis focused on federal spending, if total spending were instead used, the same eight states would still account for more than half of spending above the new limits. Rhode Island, Delaware, and New Hampshire have the smallest estimated amounts of federal SDP spending for hospital services above new limits (accounting for a combined total of $0.4 billion in federal spending).
The dollar amount of SDP spending above new limits may not indicate which states could have the biggest proportional effects when the law is fully implemented. For instance, although California has the largest estimated amount of hospital SDP spending above new limits, it also had the highest Medicaid spending in 2024. It is possible that other states’ spending over the new limits may account for a larger share of those states’ Medicaid spending. Data for Medicaid hospital spending by state in 2025 and 2026 are not yet available, making it difficult to look at SDP spending as a share of total Medicaid spending across states.
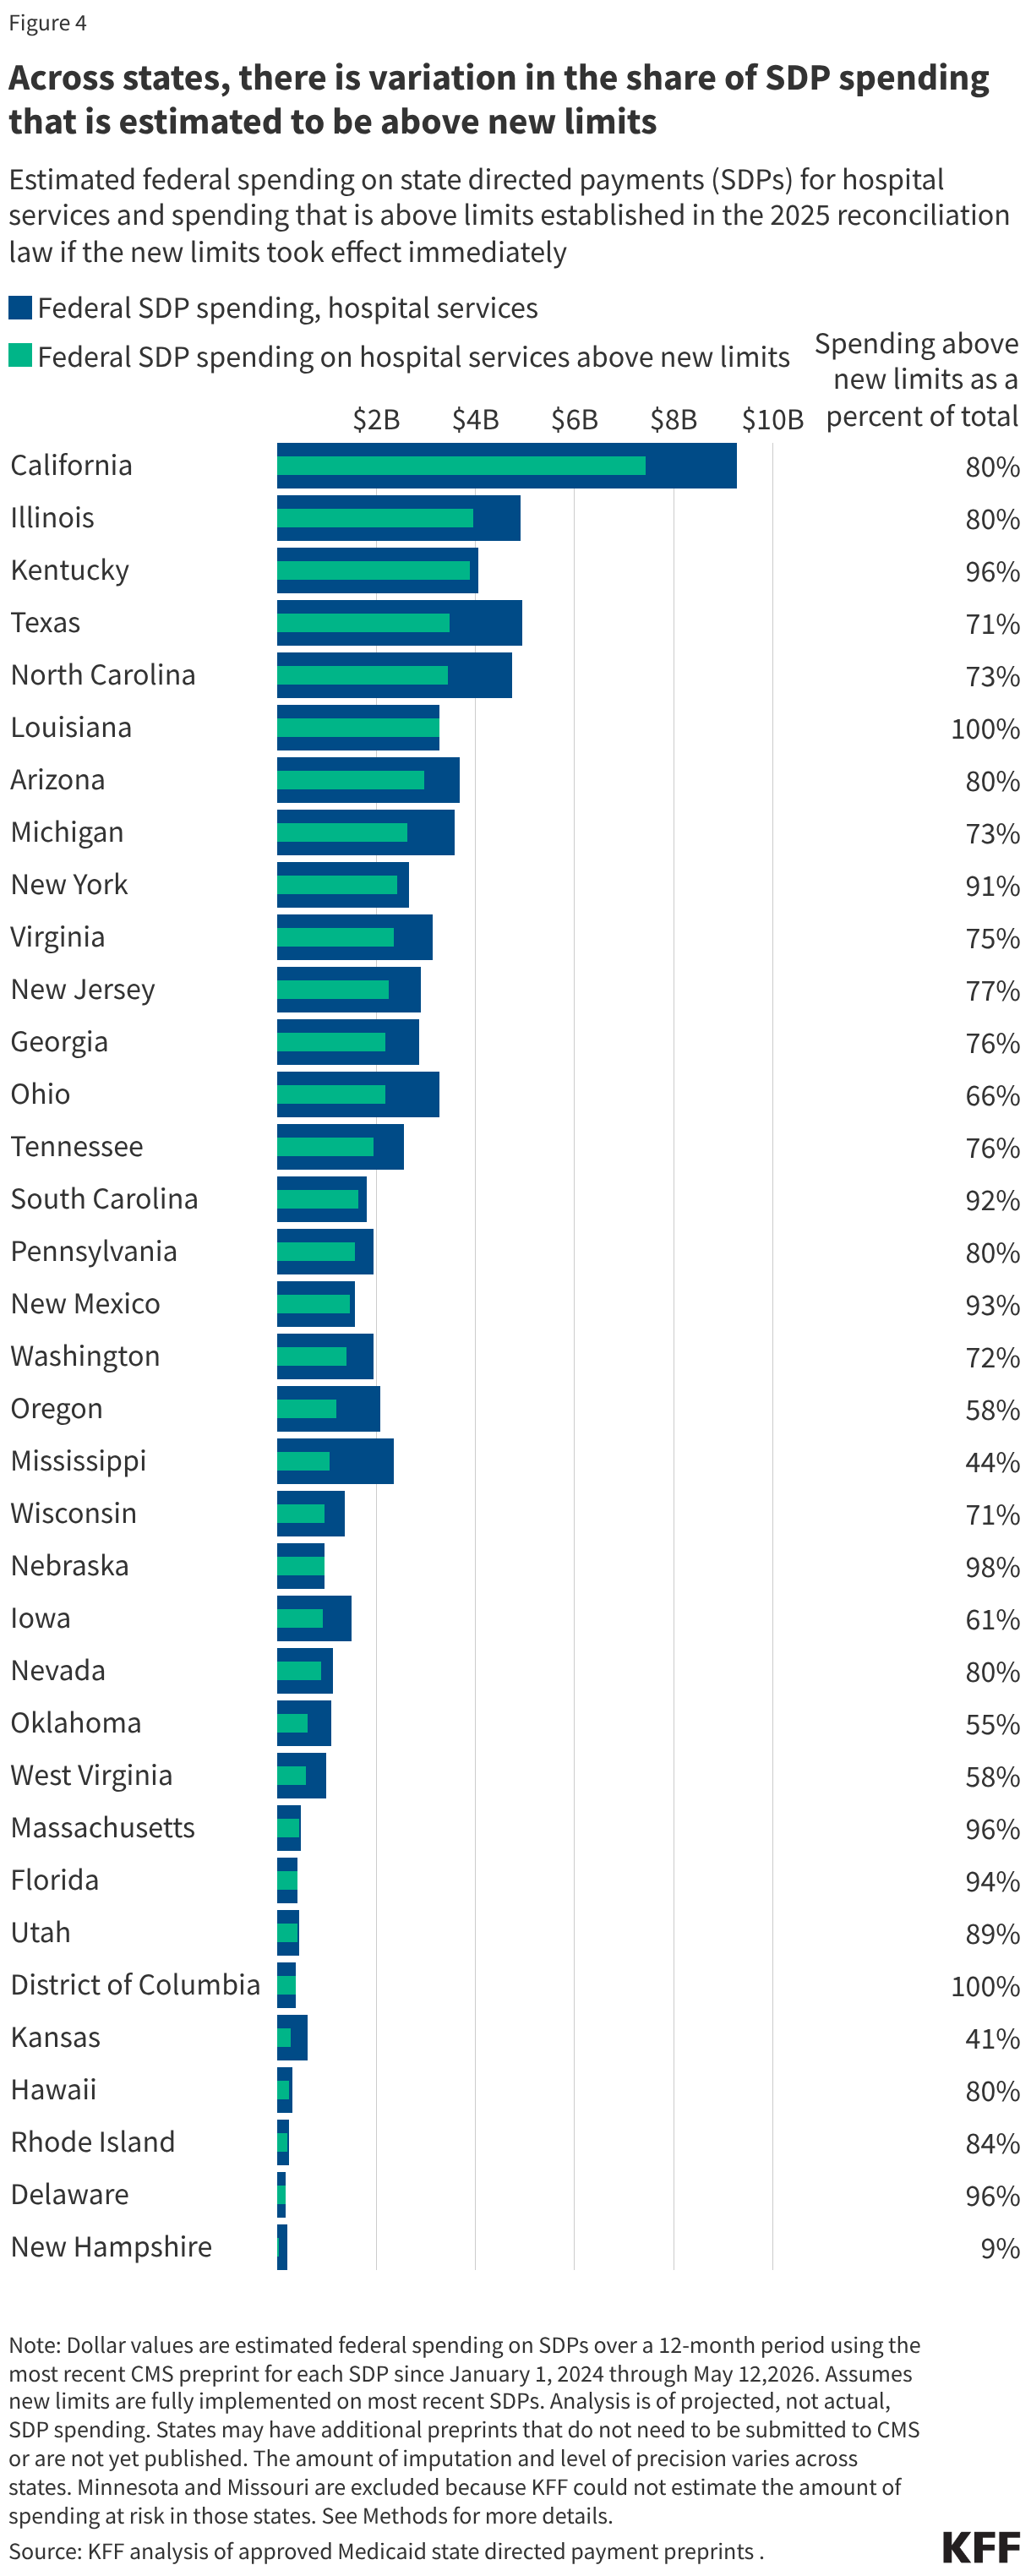
Across states, there is variation in the share of SDP spending that is estimated to be above new limits (Figure 4). Estimated spending above new limits as a share of all hospital SDP spending range from 9% in New Hampshire to 100% in two states (Louisiana and DC). In KFF’s analysis of SDP spending for hospital services above new limits, in 27 states at least 70% of SDP spending for hospital services is above the new limits.
KFF includes Minnesota and Missouri in the 37 states that are likely affected because they both have SDPs that pay for hospital services using a benchmark linked to average commercial rates. However, the preprints for those SDPs did not meet KFF’s inclusion criteria for this analysis because data were insufficient to estimate the amount of spending at risk under the new limits. As a result, Minnesota and Missouri are excluded from the analyses of the amount of SDP spending at risk under the new limits (see Methods).
A key factor in determining how much of the SDP spending exceeds the new payment limits is the level of base payment rates. States with lower base rates may be spending more through SDPs to bring total payment rates up to 100% or 110% of Medicare rates, and therefore, more of the SDP will fall below the new limits established by the 2025 reconciliation law. Conversely, in states where the vast majority of estimated SDP spending exceeds the new limits, base payments are estimated to be at or near the reconciliation law limits.
Hospitals will likely vary in how they are impacted by lower SDP spending, and it is unknown how the new limits will affect access to care among Medicaid enrollees. The effects for specific hospitals will depend on how much they are currently receiving in SDPs, how much their revenues decline as the new limits take effect, the interaction with changes to provider taxes, and how dependent they are on SDP revenues. Effects will vary across states but also within states because states may direct SDPs to a subset of hospitals, or sometimes a single hospital, and among eligible hospitals, SDPs vary with Medicaid patient volume. Hospitals’ ability to absorb reduced payment rates also varies. For hospitals with relatively high operating margins (such as for-profit hospitals and those serving relatively large shares of commercial patients), changes to SDP revenues might be more easily absorbed. On the other hand, hospitals with relatively low operating margins (like rural hospitals and those serving relatively large shares of Medicaid patients) may adapt in ways that affect Medicaid enrollees’ access to care, such as by cutting service lines or closing.
This work was supported in part by Arnold Ventures. KFF maintains full editorial control over all of its policy analysis, polling, and journalism activities.
Patrick Drake, an independent consultant, contributed to the analysis of SDP data.
KFF appreciates the contributions of external reviewers who provided comments on earlier versions of this analysis.
Methods
Data source: This analysis uses data available from the list of approved state directed payment preprints published by the Centers for Medicare and Medicaid Services (CMS) as of May 12, 2026. The approved state directed payment (SDP) preprints are PDF versions of forms that are completed by states and approved by CMS. States are required to seek approval using such a preprint for any SDP that requires managed care organizations (MCOs) to pay for services at any rate other than fee-for-service (FFS) Medicare or Medicaid rates. The approved preprints are often posted online 6–12 months after their start date, although some approved preprints are posted online much later.
KFF developed a Python script to download the available PDFs, extract relevant data from them, and standardize certain fields. Each preprint was turned into one row in a spreadsheet. Data from tables within the preprint were extracted and converted into separate tables in KFF’s data file with each row in the preprint table converted into a row in the spreadsheet table.
SDP preprint inclusion criteria: KFF included all SDPs in the analysis with a rating period start date of January 1, 2024, onward for the 50 states and Washington DC (hereafter referred to as a state). Puerto Rico was the only territory that had published SDPs, which were excluded. In each case, KFF only kept the most recent preprint for any given SDP. For example, if an SDP had an initial approval in 2024 and then renewals in 2025 and 2026, KFF would only include the 2026 renewal in the final dataset. Out of the 304 preprints included in this analysis, 23 (totaling $8.6 billion in federal spending) ended in calendar year 2024.
A small number of SDP preprints were excluded due to file formatting or data validity issues. Specifically:
- Data from five preprints were encoded differently, so the data could not be programmatically extracted into the dataset and were therefore excluded from the analysis (two from New Hampshire, one from Ohio, and two from Florida, totaling $89 million in federal spending for one year).
- Data from preprints that had obvious data quality issues were excluded from this sample. For instance, two were from Illinois (which projected total annual spending of more than $100 billion) while one from Minnesota did not report spending data in the preprint.
KFF also reviewed all preprints with end dates prior to July 1, 2025, and excluded preprints for the following reasons.
- The preprint was likely funded from COVID-19 relief dollars (including the increased federal funding for home care from the American Rescue Plan Act) and so unlikely to still be in place.
- The preprint was likely combined into a different preprint when renewed or was otherwise renamed when renewed.
- The preprint ended in 2024, and online research suggests that the payment was discontinued.
For purposes of identifying which states are likely affected by new limits, KFF manually reviewed SDPs in Minnesota and Missouri, which were the only two states with at least one preprint directed to hospital services but which did not meet the inclusion criteria. Upon review, KFF determined that preprints for hospital services in these states would also likely be affected.
See Methods Table 1 for a list of the inclusion criteria, the counts of preprints after each criterion was applied, and the federal spending for preprints that were retained at each stage.
Calculating total spending on SDPs: This analysis used the states’ projected total, federal, and state spending from the preprint. Most preprints are for a one-year period, but some are for longer or shorter periods. In such cases, KFF adjusted the data to be a one-year equivalent. When preprints were for periods shorter than 12 months, dollars were scaled up (e.g., if the preprint was for 6 months, the spending was multiplied by two) and for preprints that were for periods longer than 12 months, spending was scaled down (e.g., retaining two-thirds of spending if the preprint extended for 18 months).
KFF also manually reviewed the federal spending numbers because some states reported them as percentages of total spending and others reported them as dollar amounts. Manual review ensured the Python script had adequately handled the different reporting structures.
Calculating SDP spending by service type: For preprints that made payments for multiple service types (which accounted for $32.4 billion in federal spending), spending was apportioned across service types.
- For SDPs directed to hospital and non-hospital services, 90% of spending was allocated to hospital services.
- For SDPs directed to both inpatient and outpatient hospital services, 68% of hospital spending was allocated to inpatient services and 32% was allocated to outpatient services. Distinguishing between the two is important because states sometimes use different benchmark rates for each.
Apportioning spending across service types is difficult, and KFF used a variety of sources to develop the most realistic assumptions feasible. KFF analyzed data on Medicaid spending, including CMS-64 spending by service type, data on Medicaid spending by service type from the National Health Expenditures, the Congressional Budget Office Medicaid baseline, and existing studies on hospital payment policies such as those from the Medicaid and CHIP Payment and Access Commission (MACPAC). All of those data points suggest that the vast majority of SDP spending pays for hospital services, and $53.1 billion out of the $60.5 billion in federal spending from preprints directed to a single provider type went to hospital services. KFF also strove to use an assumption that resulted in estimates of hospital SDP spending that are similar to what could be expected on the basis of other data and research as described above.
When identifying the service types in the preprints, the Python script attempted to align service types between preprint Table 2 (which specifies payment rates for sets of providers) and preprint Question 20 (a checklist of services included in the SDP). In many cases, this alignment involved some uncertainty, requiring manual review and classification of service types.
Identifying benchmarks for MCO payments: The most common type of SDPs requires MCOs to make payments that are on top of the regular base payment rate (as opposed to limiting or replacing the negotiated rate). In such cases, payments are measured using a “benchmark” or standardized rate to compare the MCO rates to other payment rates, such as those of Medicaid FFS, Medicare FFS, or the average among commercial payers (“average commercial rates”). KFF used the Python script to identify the applicable benchmark type from the preprint but also manually reviewed the data since states sometimes used inconsistent terminology to report the same benchmarks.
Identifying payment levels: To identify how current payment rates align with the new limits on SDPs in the reconciliation law, KFF first needed to identify payment levels in the preprints. The level is specified as a percentage of the benchmark (e.g., 90% of average commercial rates or 140% of Medicare rates). Both types of payments were pulled from Table 2 when available. Payment rates for inpatient and outpatient hospital services were tracked separately with each row in Table 2 when applicable.
Hospital analysis: The methods above were used in a previous KFF analysis to estimate current SDP spending before new limits take effect. Additional methods below were incorporated into this analysis.
Hospital analysis inclusion criteria: For the analysis of how SDP spending levels align with new limits on SDPs in the 2025 reconciliation law, KFF further limited the analysis to:
- SDPs with inpatient or outpatient hospital services as a service type in Question 20,
- Those required to report a benchmark, and
- Those benchmarked to Medicare or average commercial rates.
Of the 131 preprints included in the hospital spending analysis (accounting for $78.0 billion in federal spending on hospital services), 35 did not include payment levels in Table 2 (accounting for $39.6 billion in federal spending on hospital services). Payment rates were missing for the relevant preprints because states left Table 2 incomplete and instead noted that rates were reported in attached addendums, which CMS generally does not make publicly available (some rate description addendums were at the end of the preprint, but they were not included in this analysis because they were not in a machine-readable format). KFF submitted a Freedom of Information Act request to access the addendum data on August 25, 2025, but, as of July 21, 2026, had not received the addendums or any information about whether the addendums would be available or the timing of their availability.
Comparing payment levels to new limits in the 2025 reconciliation law. In cases where rates were benchmarked to commercial rates, KFF first converted the rates to a Medicare-equivalent rate using state inpatient and outpatient commercial-to-Medicare price ratios from the 2024 RAND Price Transparency Study. The RAND price ratios are approximations, and actual commercial-to-Medicare price ratios may be higher or lower than what was used in the KFF analysis. For instance, RAND price ratios were derived from claims data from 2020–2022, and so may have changed between then and the sample period. RAND price ratios were also based on a sample of claims and are higher than some from other estimates at a national level, but have been used by other researchers to analyze state directed payments.
For SDP preprints that were missing the payment level, KFF estimated the payment rates for hospital services using the payment levels in other preprints. KFF first created national and state-specific (when possible) median payment rates for the following measures:
- Inpatient rates among SDP preprints that are benchmarked to average commercial rates and Medicare rates, and
- Outpatient rates among SDP preprints that are benchmarked to average commercial rates and Medicare rates
Where feasible, the analysis used the applicable state-specific rate (eight states—Georgia, Kentucky, Louisiana, New Mexico, Nevada, New York, Pennsylvania, and Washington). In other cases, the analysis used the applicable national rate (six states—Arizona, California, Hawaii, Illinois, Texas, and Wisconsin). Additionally, for North Carolina, KFF used the state-specific rate for outpatient services and the national rate for inpatient services. KFF’s imputed benchmark rates were more conservative than a RAND analysis of SDPs, in which all missing rates benchmarked to commercial rates are assumed to be 100% of average commercial rates. For the remaining states, KFF had complete payment rate information from the preprints.
Estimating spending on hospital services above new limits: When the total payment rate (accounting for base payments and the SDP) was below the new limit (100% in expansion states or 110% in non-expansion states; expansion status was pulled from KFF’s Status of State Medicaid Expansion Decision tracker), the SDP was assumed to already be under the new limit and so would not need to be reduced. This was the case for 27 preprints, representing $2.2 billion in federal hospital spending. All other SDPs were assumed to be affected. When the base rate was above the new limit, 100% of the SDP was estimated to be above the new limit (this was the case in 50 SDPs, accounting for $15.0 billion in federal hospital spending).
For SDPs where the base rate was below the new limit, but the total rate of the SDP was above the new limit (a little less than half of preprints in the sample), KFF estimated the amount of federal spending above new limits as detailed below and in Formula 1.
- The calculation was done separately for each provider row in Table 2, using the federal spending apportioned to each service line (as described above in “Calculating SDP spending by service type”) to calculate the estimated spending above new limits.
- KFF estimated the difference between the total rate and the maximum rate allowed under the 2025 reconciliation law (both measured relative to Medicare payment rates, as described above), which represents the “portion of increase from the SDP above limit.”
- KFF also estimated the difference between the total rate and the base rate, which represents the “increase from SDP.”
- Those two rates were used to estimate the percentage of the SDP spending that would be above new limits.
- That share was multiplied by the “apportioned federal spending” for the specific service line (i.e., the amount of SDP spending calculated by service type) to estimate the amount of SDP spending above new limits.
- The total rate comes from the “Total Payment Level” column of Table 2 (converted into a Medicare-equivalent rate when benchmarked to ACR) and the base rate comes from the “Average Base Payment Level from Plans to Providers” column (converted into a Medicare-equivalent rate when benchmarked to ACR).
Formula 1:
![[(Total rate - New limit)/(Total rate - Base rate)=(Portion of increase from SDP above limit)/(Increase from SDP)]*Apportioned federal spending](https://www.kff.org/wp-content/uploads/sites/7/2026/08/image.png)
Appendix Table 1
| Analysis Step | Count of Preprints | Federal Spending Among Preprints (billion $) | Federal Hospital Spending Among Preprints (billion $) | Notes |
| Preprints listed on CMS’s website as of May 12, 2026 | 1,038 |
|
| |
| All preprints pulled from CMS website | 987 | 246.4 | 202.1 | Some links are broken or duplicates |
| Preprints in time period and states | 570 | 166.1 | 137.8 | Includes the preprint for each state directed payment (SDP) from January 2024 onward for the 50 states and DC |
| Most recent SDP submission or renewal | 358 | 99.6 | 82.2 | Limits to the most recent preprint where the sample previous included renewals |
| Preprints without data quality issues | 352 | 99.6 | 82.2 | KFF dropped preprints that were missing information about the start date, end date, spending amounts, etc. |
| Preprints manually reviewed and dropped (sample for previous KFF analysis) | 305 | 93.1 | 78.0 | KFF dropped preprints from older years that were subsumed into newer preprints and those that were temporary policies started during the COVID-19 pandemic |
| Include hospital services | 139 | 87.9 | 78.0 |
|
| Preprints that require a benchmark | 133 | 80.1 | 77.8 | Benchmarks are only required for SDPs that require managed care organizations to make payments that are on top of the negotiated rates. |
| Use Medicare or average commercial rates as benchmark | 131 | 80.1 | 77.8 |
|