Medicare 101

0:00
0:00

KFF Authors:

Table of Contents

What Is Medicare?

Copy link to What Is Medicare?

Medicare is the federal health insurance program established in 1965 under Title XVIII of the Social Security Act for people age 65 or older, regardless of income or medical history, and later expanded to cover people under age 65 with long-term disabilities. Today, Medicare provides health insurance coverage to 68 million people, including 61 million people age 65 or older and 7 million people under age 65. Medicare covers a comprehensive set of health care services, including hospitalizations, physician visits, and prescription drugs, along with post-acute care, skilled nursing facility care, home health care, hospice, and preventive services. People with Medicare can choose to get coverage under traditional Medicare or Medicare Advantage private plans.

Medicare spending comprised 13.5% of the federal budget in 2024 and 21.2% of national health care spending in 2023. Funding for Medicare comes primarily from government contributions, payroll tax revenues, and premiums paid by beneficiaries. Over the longer term, the Medicare program faces financial pressures associated with higher health care costs, growing enrollment, and an aging population.

Who Is Covered by Medicare?

Copy link to Who Is Covered by Medicare?

Most people become eligible for Medicare when they reach age 65, regardless of income, health status, or medical conditions. Residents of the U.S., including citizens and permanent residents, are eligible for premium-free Medicare Part A if they have worked at least 40 quarters (10 years) in jobs where they or their spouses paid Medicare payroll taxes and are at least 65 years old. People under age 65 who receive Social Security Disability Insurance (SSDI) payments generally become eligible for Medicare after a two-year waiting period. People diagnosed with end-stage renal disease (ESRD) and amyotrophic lateral sclerosis (ALS) become eligible for Medicare with no waiting period.

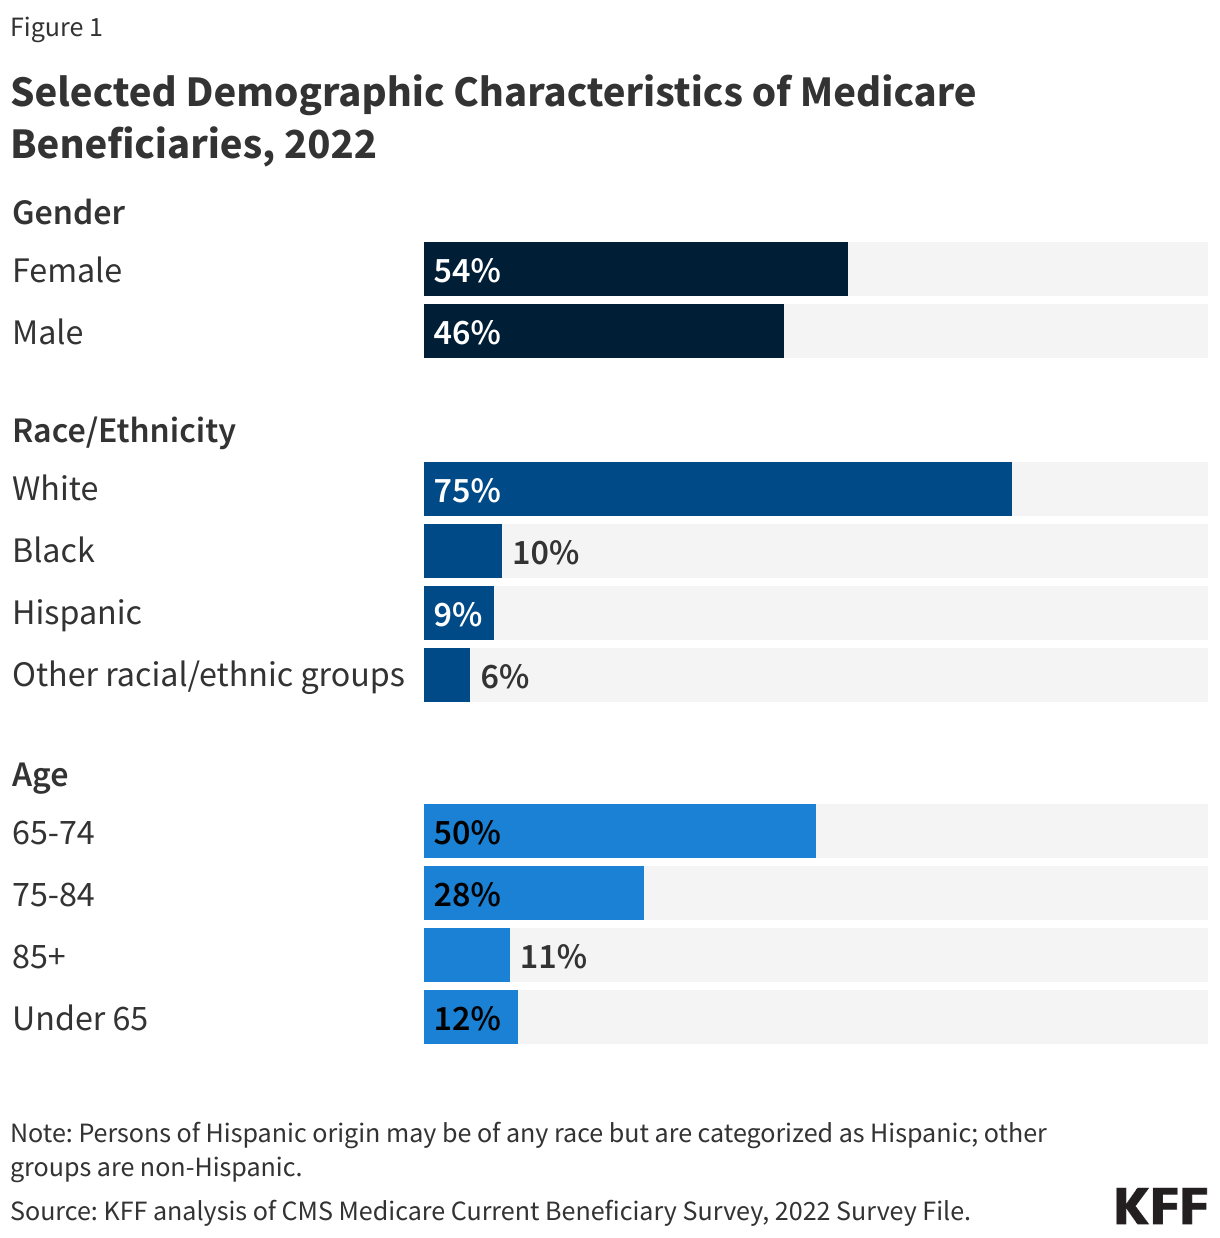
Medicare covers a diverse population in terms of demographics and health status, and this population is expected to grow larger and more diverse in the future as the U.S. population ages. Currently, most people with Medicare are White, female, and between the ages of 65 and 84 (Figure 1). The share of U.S. adults who are age 65 or older is projected to grow from 17% in 2022 to nearly a quarter of the nation’s total population (24%) in 2060. Among people ages 65 and older, the share of people ages 80 and older will increase from 23% in 2022 to 34% in 2060. As the U.S. population ages, the number of Medicare beneficiaries is projected to grow by more than one-third from 68 million people in 2024 to more than 93 million people in 2060. The Medicare population will also grow more racially and ethnically diverse. By 2060, people of color will comprise 44% of the U.S. population ages 65 and older, up from a quarter in 2022.

Selected Demographic Characteristics of Medicare Beneficiaries, 2022

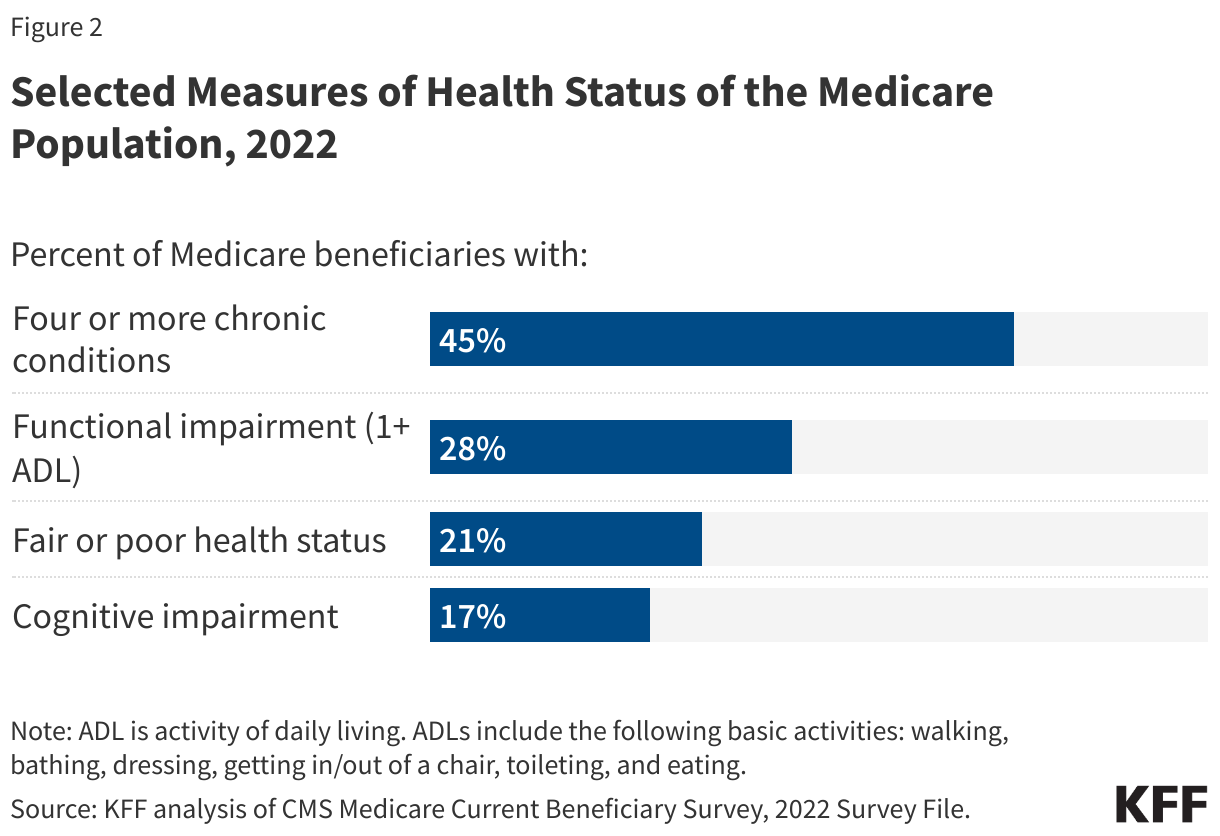
While many Medicare beneficiaries enjoy good health, others live with health problems that affect their quality of life, including multiple chronic conditions, limitations in their activities of daily living, and cognitive impairments. In 2022, nearly half (45%) of Medicare beneficiaries had four or more chronic conditions, more than a quarter (28%) had a functional impairment, and 17% had a cognitive impairment (Figure 2).

Selected Measures of Health Status of the Medicare Population, 2022

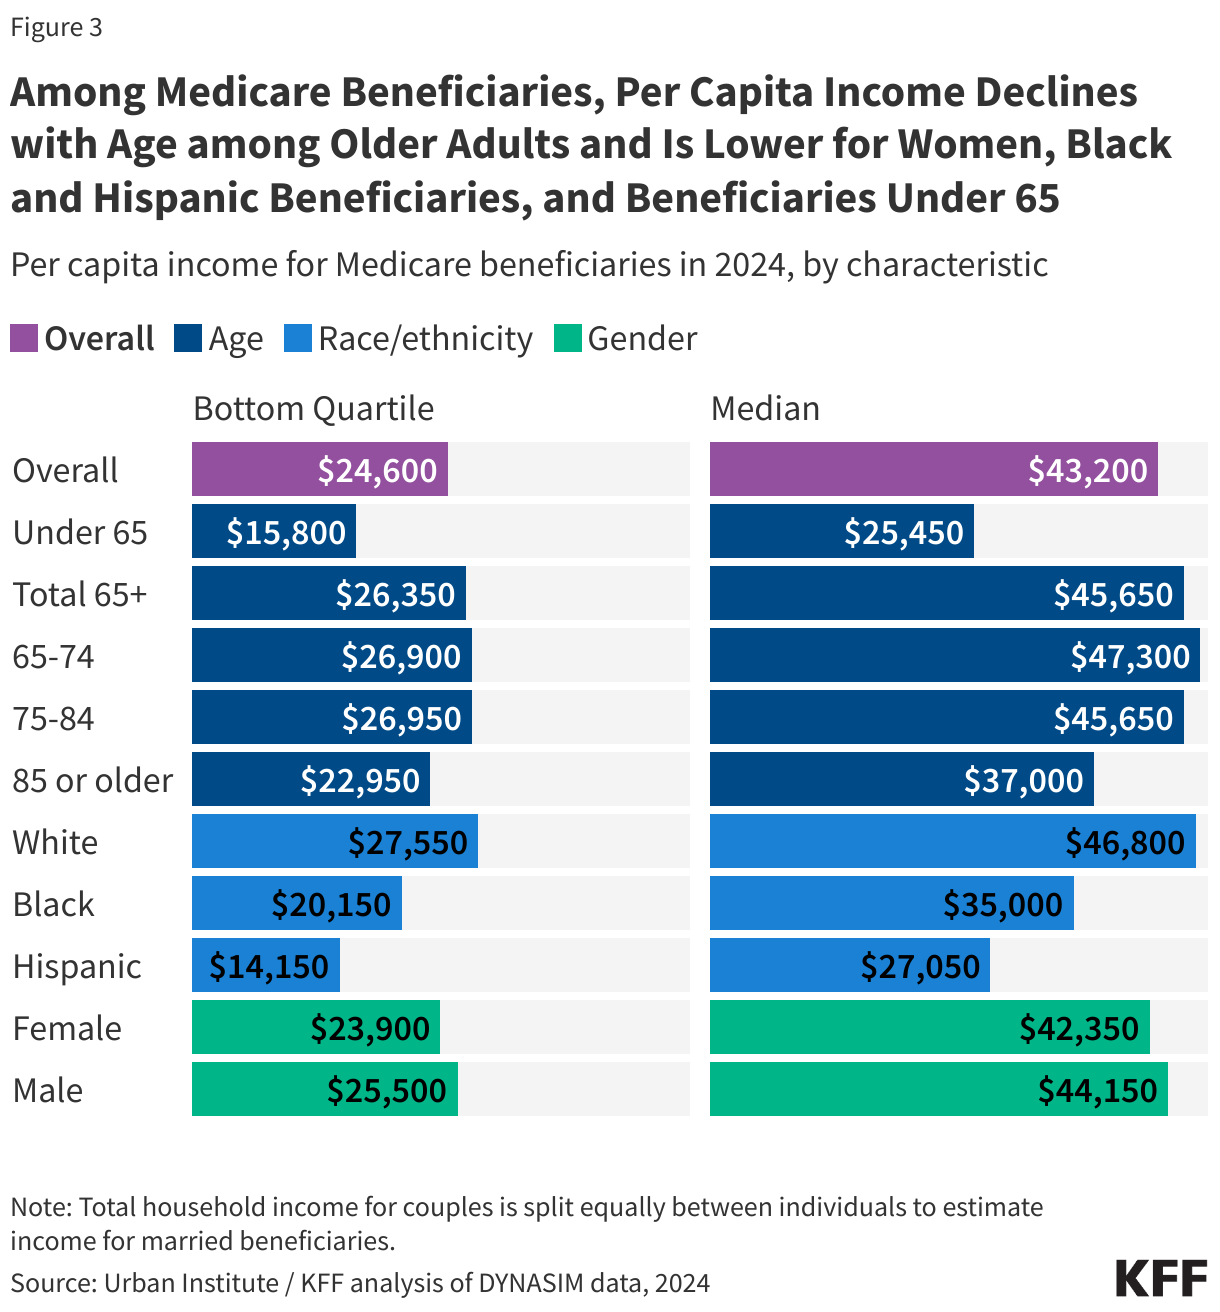
Most Medicare beneficiaries have limited financial resources, including income and assets. In 2024, one in four Medicare beneficiaries - 16.5 million people with Medicare - lived on incomes below $24,600 per person, and half (32.9 million) of all Medicare beneficiaries lived on incomes below $43,200 per person; one in four Medicare beneficiaries had savings below $18,950 per person in 2024, while half had savings below $110,100 per person. Income among Medicare beneficiaries is generally lower for women than men, for people of color than White beneficiaries, and for beneficiaries under age 65 with disabilities than older beneficiaries (Figure 3).

Among Medicare Beneficiaries, Per Capita Income Declines with Age among Older Adults and Is Lower for Women, Black and Hispanic Beneficiaries, and Beneficiaries Under 65 (Split Bars)

What Does Medicare Cover and How Much Do People Pay for Medicare Benefits?

Copy link to What Does Medicare Cover and How Much Do People Pay for Medicare Benefits?

Benefits. Medicare covers a comprehensive set of medical care services, including hospital stays, physician visits, and prescription drugs. Medicare benefits are divided into four parts: 

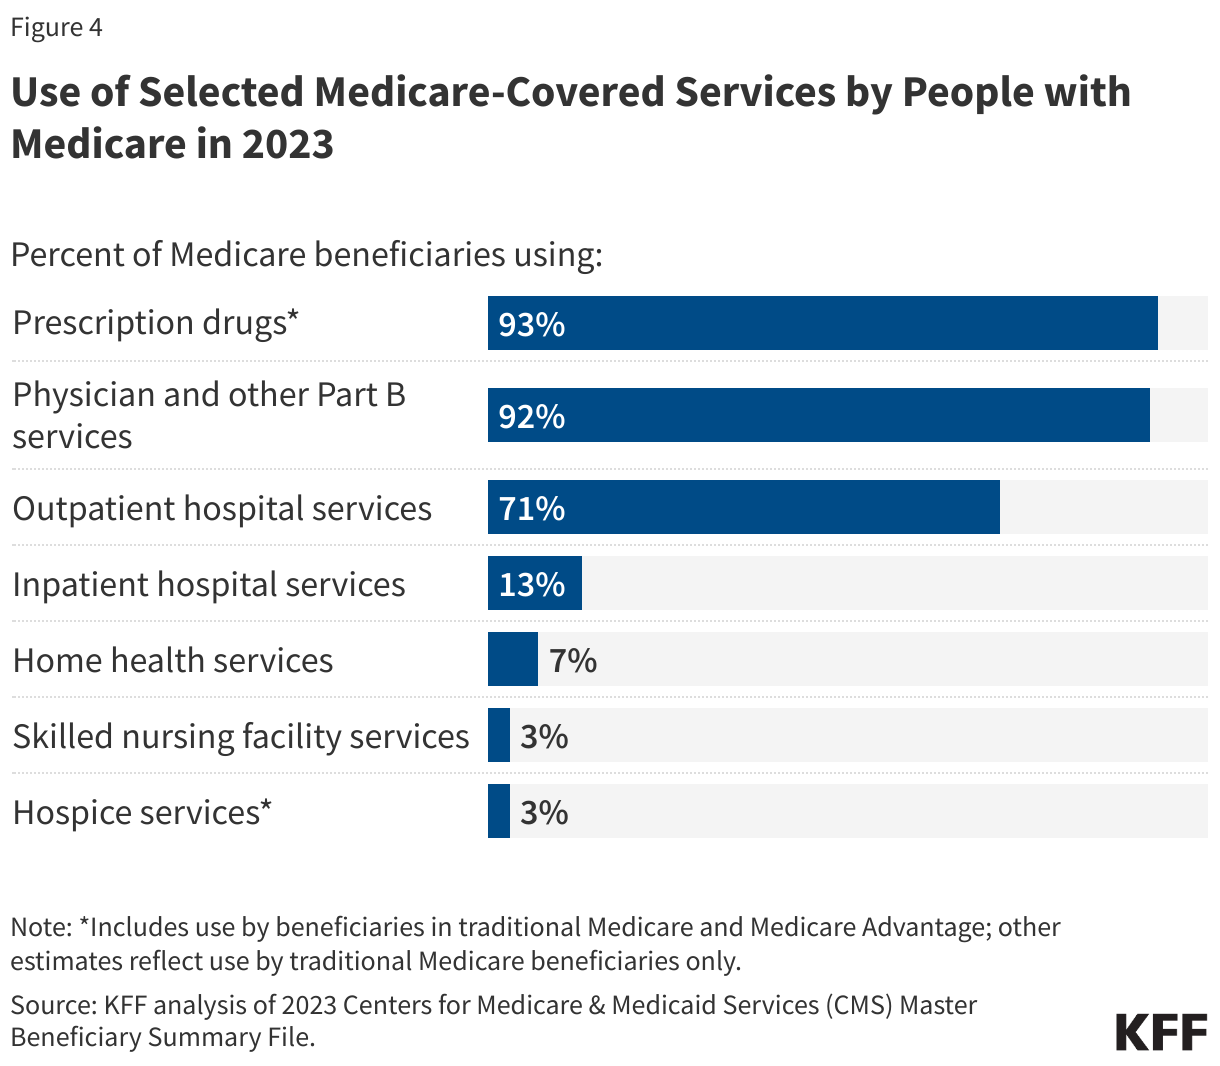
  • Part A, also known as the Hospital Insurance (HI) program, covers inpatient care provided in hospitals and short-term stays in skilled nursing facilities, hospice care, post-acute home health care, and pints of blood received at a hospital or skilled nursing facility. An estimated 67.5 million people were enrolled in Part A in 2024. In 2023, 13% of beneficiaries in traditional Medicare had an inpatient hospital stay, while 7% used home health care services (which are also covered under Part B), and 3% had a skilled nursing facility stay (Figure 4). (Comparable utilization data for beneficiaries in Medicare Advantage is not available.)
  • Part B,the Supplementary Medical Insurance (SMI) program, covers outpatient services such as physician visits, outpatient hospital care, and preventive services (e.g., mammography and colorectal cancer screening), among other medical benefits. An estimated 62 million people were enrolled in Part B in 2024. A larger share of beneficiaries use Part B services compared to Part A services. For example, in 2023, more than 9 in 10 (92%) traditional Medicare beneficiaries used physician and other services covered under Part B and 59% used outpatient hospital services.
  • Part C, more commonly referred to as the Medicare Advantage program, allows beneficiaries to enroll in a private plan, such as a health maintenance organization (HMO) or preferred provider organization (PPO), as an alternative to traditional Medicare. Medicare Advantage plans cover all benefits under Medicare Part A, Part B, and, in most cases, Part D (Medicare’s outpatient prescription drug benefit), and typically offer extra benefits, such as dental services, eyeglasses, and hearing exams. In 2025, 34.1 million beneficiaries are enrolled in Medicare Advantage, which is 54% of Medicare beneficiaries who are eligible to enroll in Medicare Advantage plans. (See “What Is Medicare Advantage and How Is It Different From Traditional Medicare?” for additional information.) 
  • Part D is a voluntary outpatient prescription drug benefit delivered through private plans that contract with Medicare, either stand-alone prescription drug plans (PDPs) or Medicare Advantage prescription drug (MA-PD) plans. In 2025, 54.8 million beneficiaries are enrolled in Part D, with 58% enrolled in MA-PDs and 42% enrolled in PDPs. In 2023, over 9 in 10 Medicare beneficiaries enrolled in Part D (93%) used prescription drugs. (See “What Is the Medicare Part D Prescription Drug Benefit?” for additional information.)
Use of Selected Medicare-Covered Services by People with Medicare in 2023

Although Medicare covers a comprehensive set of medical benefits, Medicare does not cover long-term care services. Additionally, coverage of vision services, dental care, and hearing aids is not part of the standard benefit, though most Medicare Advantage plans offer some coverage of these services.

Premiums and cost sharing. Medicare has varying premiums, deductibles, and coinsurance amounts that typically change each year to reflect program cost changes.

  • Part A: Most beneficiaries do not pay a monthly premium for Part A services, but are required to pay a deductible for inpatient hospitalizations ($1,676 in 2025). (People who are working contribute payroll taxes to Medicare and qualify for premium-free Part A at age 65 based on having paid 1.45% of their earnings over at least 40 quarters.) Beneficiaries are generally subject to cost sharing for Part A benefits, including extended inpatient stays in a hospital ($419 per day for days 61-90 and $838 per day for days 91-150 in 2025) or skilled nursing facility ($209.50 per day for days 21-100 in 2025). There is no cost sharing for home health visits.
  • Part B: Beneficiaries enrolled in Part B, including those in traditional Medicare and Medicare Advantage plans, are generally required to pay a monthly premium ($185 in 2025). Beneficiaries with annual incomes greater than $106,000 for a single person or $212,000 for a married couple in 2025 pay a higher, income-related monthly Part B premium, ranging from $259 to $628.90. Approximately 8% of Medicare beneficiaries with Part B coverage are expected to pay income-related Part B premiums in 2025. Part B benefits are subject to an annual deductible ($257 in 2025), and most Part B services are subject to coinsurance of 20 percent.
  • Part C: In addition to paying the Part B premium, Medicare Advantage enrollees may be charged a separate monthly premium for their Medicare Advantage plan, although three-quarters (76%) of enrollees are in plans that charge no additional premium in 2025. Medicare Advantage plans are generally prohibited from charging more than traditional Medicare, but vary in the deductibles and cost-sharing amounts they charge. Medicare Advantage plans typically establish provider networks and may require higher cost sharing for services received from non-network providers.
  • Part D: Part D plans vary in terms of premiums, deductibles, and cost sharing. People in traditional Medicare who are enrolled in a separate stand-alone Part D plan generally pay a monthly Part D premium unless they qualify for full benefits through the Part D Low-Income Subsidy (LIS) program and are enrolled in a premium-free (benchmark) plan. In 2025, the average enrollment-weighted premium for stand-alone Part D plans is $39 per month, substantially higher than the enrollment-weighted average monthly portion of the premium for drug coverage in MA-PDs ($7 in 2025).

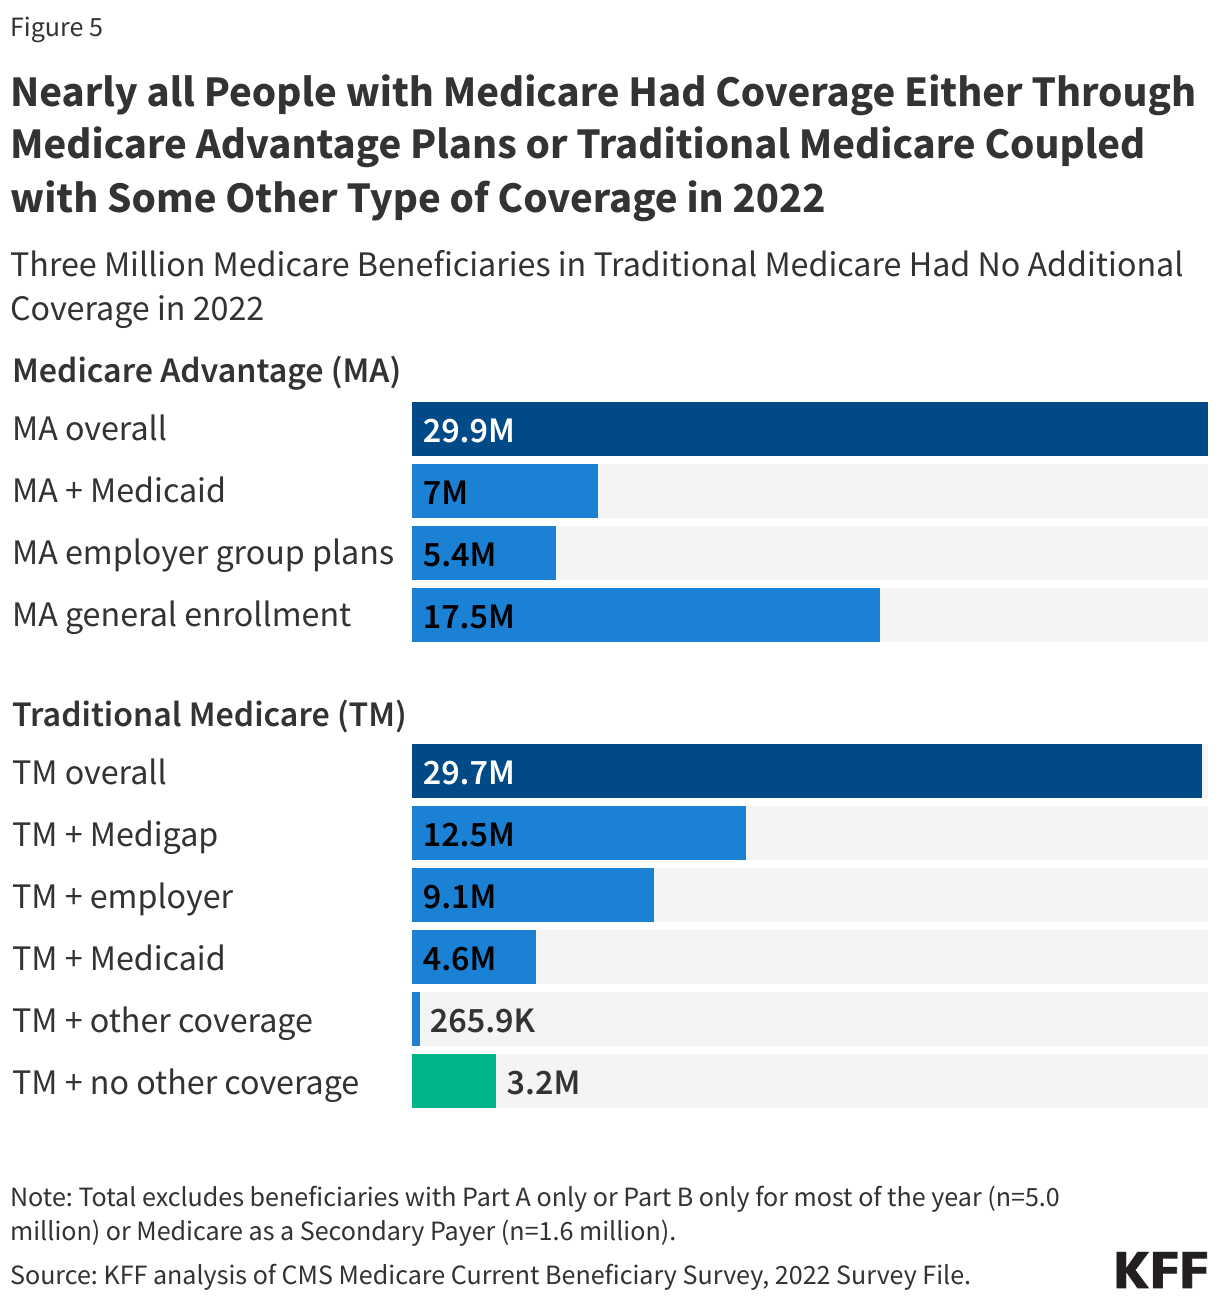
Sources of coverage. Most people with Medicare have some type of coverage that may protect them from unlimited out-of-pocket costs and may offer additional benefits, whether it’s coverage in addition to traditional Medicare or coverage from Medicare Advantage plans, which are required to have an out-of-pocket cap and typically offer supplemental benefits (Figure 5). However, based on KFF analysis of data from the 2022 Medicare Current Beneficiary Survey, 3.2 million people with Medicare have no additional coverage, which places them at risk of facing high out-of-pocket spending or going without needed medical care due to costs. 

  • Medicare Advantage plans now cover more than half (54%) of all Medicare beneficiaries enrolled in both Part A and Part B, or 34 million people (in 2022, Medicare Advantage enrollment was just under half of beneficiaries, or 29.9 million people). (See “What Is Medicare Advantage and How Is It Different From Traditional Medicare?” for additional information.)
  • Employer and union-sponsored plans provided some form of coverage to 14.5 million Medicare beneficiaries – nearly a quarter (24%) of Medicare beneficiaries overall in 2022. Of the total number of beneficiaries with employer coverage, 9.1 million beneficiaries had this coverage in addition to traditional Medicare (31% of beneficiaries in traditional Medicare), while 5.4 million beneficiaries were enrolled in Medicare Advantage employer group plans. (These estimates exclude 5.6 million Medicare beneficiaries with Part A only in 2022, primarily because they or their spouse were active workers and had primary coverage from an employer plan and Medicare as a secondary payer.) 
  • Medicare supplement insurance, also known as Medigap, covered 2 in 10 (21%) Medicare beneficiaries overall, or 42% of those in traditional Medicare (12.5 million beneficiaries) in 2022. Medigap policies, sold by private insurance companies, fully or partially cover Medicare Part A and Part B cost-sharing requirements, including deductibles, copayments, and coinsurance. 
  • Medicaid, the federal-state program that provides health and long-term services and supports coverage to low-income people, was a source of coverage for 11.6 million Medicare beneficiaries with low incomes and modest assets in 2022 (19% of all Medicare beneficiaries), including 7.0 million enrolled in Medicare Advantage and 4.6 million in traditional Medicare. (This estimate is somewhat lower than KFF estimates published elsewhere due to different data sources and methods used.) For these beneficiaries, referred to as dual-eligible individuals, Medicaid typically pays the Medicare Part B premium and may also pay a portion of Medicare deductibles and other cost-sharing requirements. Most dual-eligible individuals are eligible for full Medicaid benefits, including long-term services and supports.
Nearly all People with Medicare Had Coverage Either Through Medicare Advantage Plans or Traditional Medicare Coupled with Some Other Type of Coverage in 2022

What Is Medicare Advantage and How Is It Different From Traditional Medicare?

Copy link to What Is Medicare Advantage and How Is It Different From Traditional Medicare?

Medicare Advantage, also known as Medicare Part C, allows beneficiaries to receive their Medicare benefits from a private health plan, such as a health maintenance organization (HMO) or preferred provider organization (PPO). Medicare pays private insurers to provide Medicare-covered benefits (Part A and B, and often Part D) to enrollees. Virtually all Medicare Advantage plans include an out-of-pocket limit for benefits covered under Parts A and B, and most offer additional benefits not covered by traditional Medicare, such as vision, hearing, and dental. The average Medicare beneficiary can choose from 34 Medicare Advantage plans with prescription drug coverage offered by eight insurance companies in 2025. These plans vary across many dimensions, including premiums, cost-sharing requirements, out-of-pocket limits, extra benefits, provider networks, prior authorization and referral requirements, denial rates, and prescription drug coverage.

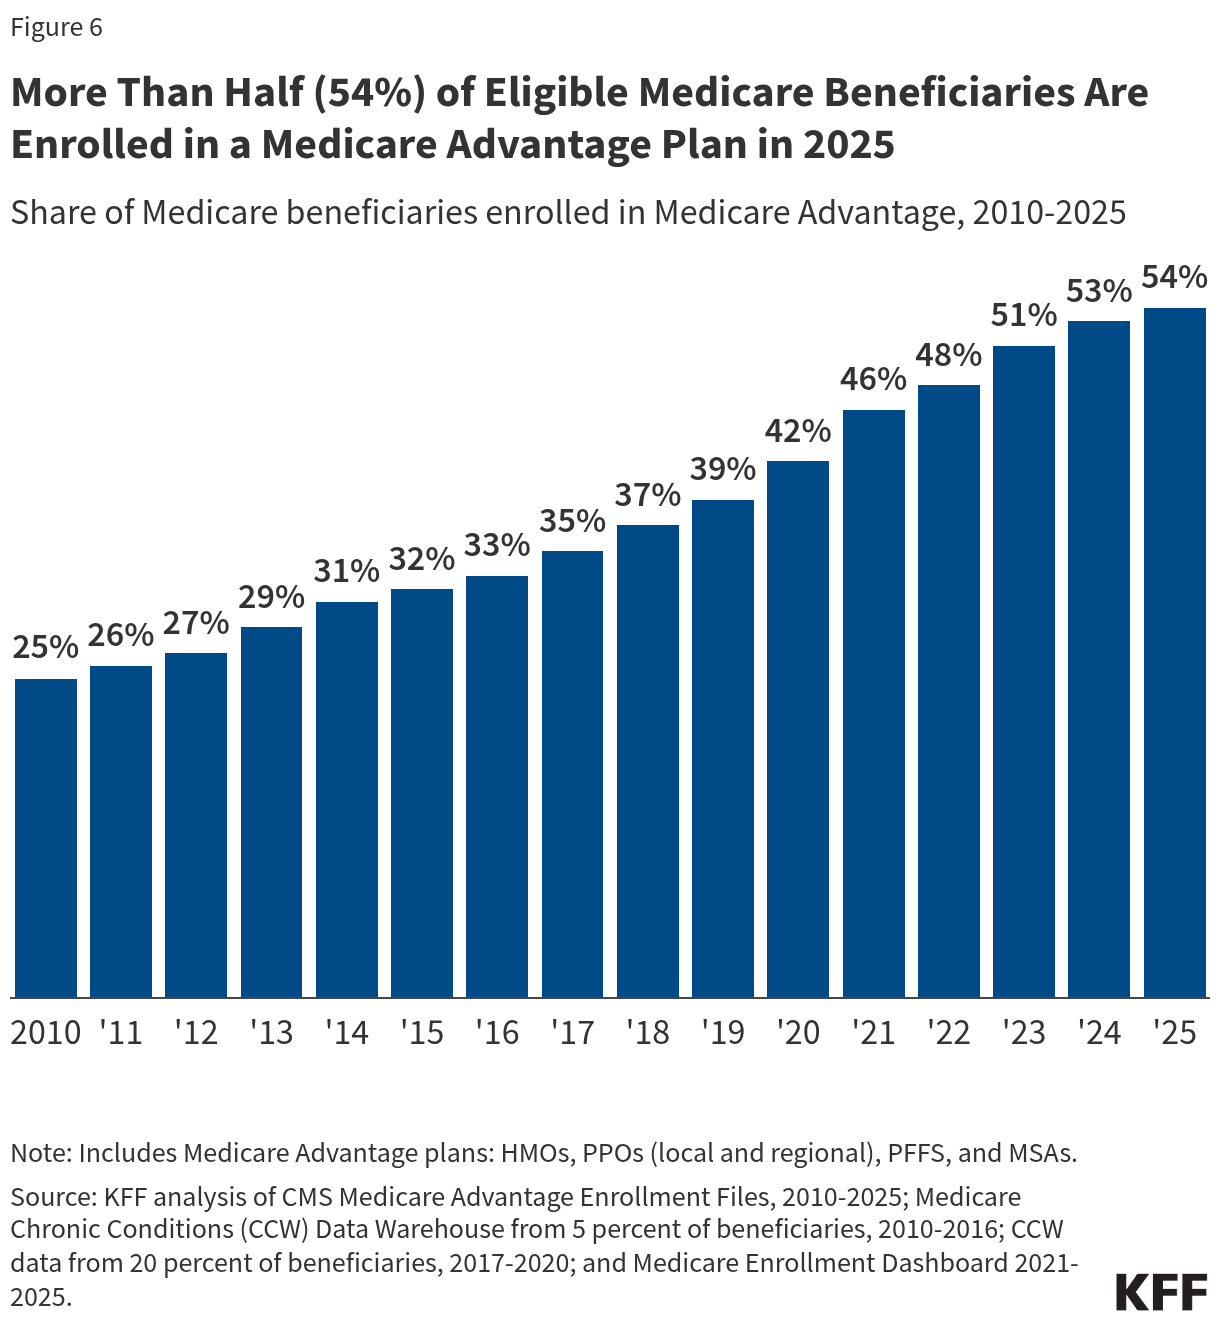
More than half of all eligible Medicare beneficiaries (54%) are currently enrolled in a Medicare Advantage plan, up from 25% in 2010 (Figure 6). The share of eligible Medicare beneficiaries in Medicare Advantage plans varies across states, ranging from 2% in Alaska to 63% in Alabama and Michigan.  Growth in Medicare Advantage enrollment is due to a number of factors. Medicare beneficiaries are attracted to Medicare Advantage due to the multitude of extra benefits, the simplicity of one-stop shopping (in contrast to traditional Medicare where beneficiaries might also purchase a Part D plan and a Medigap plan), and the availability of plans with no premiums beyond the Part B premium, driven in part by the current payment system that generates high gross margins in this market (see “How Does Medicare Pay Private Plans in Medicare  Advantage and Medicare Part D?” for additional information). Insurers market these plans aggressively, airing thousands of TV ads for Medicare Advantage during the Medicare open enrollment period. In some cases, Medicare beneficiaries have no choice but to be enrolled in a Medicare Advantage plan for their retiree health benefits as some employers are shifting their retirees into these plans; if they are dissatisfied with this option, they may have to give up retiree benefits altogether, although they would retain Medicare and have the option to choose traditional Medicare (potentially with a Medigap supplement).

More Than Half (54%) of Eligible Medicare Beneficiaries Are Enrolled in a Medicare Advantage Plan in 2025

There are several differences between Medicare Advantage and traditional Medicare. Medicare Advantage plans can establish provider networks, the size of which can vary considerably for both physicians and hospitals, depending on the plan and the county where it is offered. These provider networks may also change over the course of the year. Medicare Advantage enrollees who seek care from an out-of-network provider might be required to pay higher cost sharing or pay in full out of pocket for their care. In contrast, traditional Medicare beneficiaries can see any provider that accepts Medicare and is accepting new patients. In 2019, 89% of non-pediatric office-based physicians accepted new Medicare patients, with little change over time. Only 1% of all non-pediatric physicians formally opted out of the Medicare program in 2024.

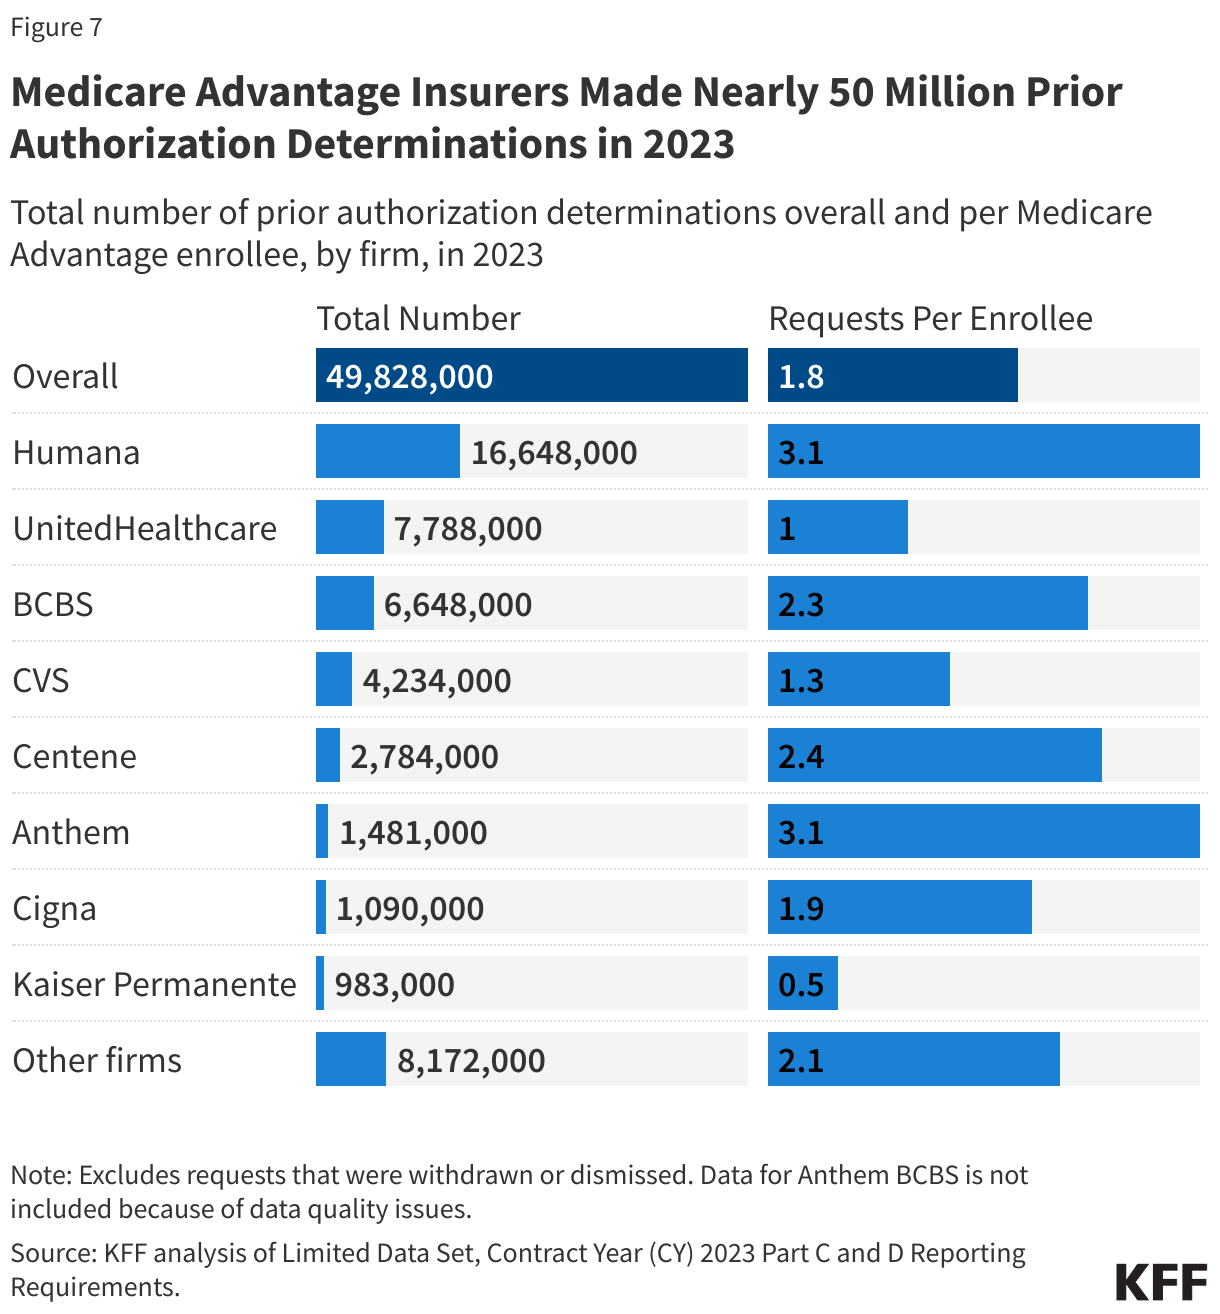
Medicare Advantage plans also often use tools to manage utilization and costs, such as requiring enrollees to receive prior authorization before a service will be covered and requiring enrollees to obtain a referral for specialists or mental health providers. In 2024, virtually all Medicare Advantage enrollees were in plans that required prior authorization for some services, most often higher-cost services. Medicare Advantage insurers made nearly 50 million prior authorization determinations in 2023 (Figure 7). Prior authorization and referrals to specialists are used less frequently in traditional Medicare, with prior authorization generally applying to a limited set of services.

Medicare Advantage Insurers Made Nearly 50 Million Prior Authorization Determinations in 2023

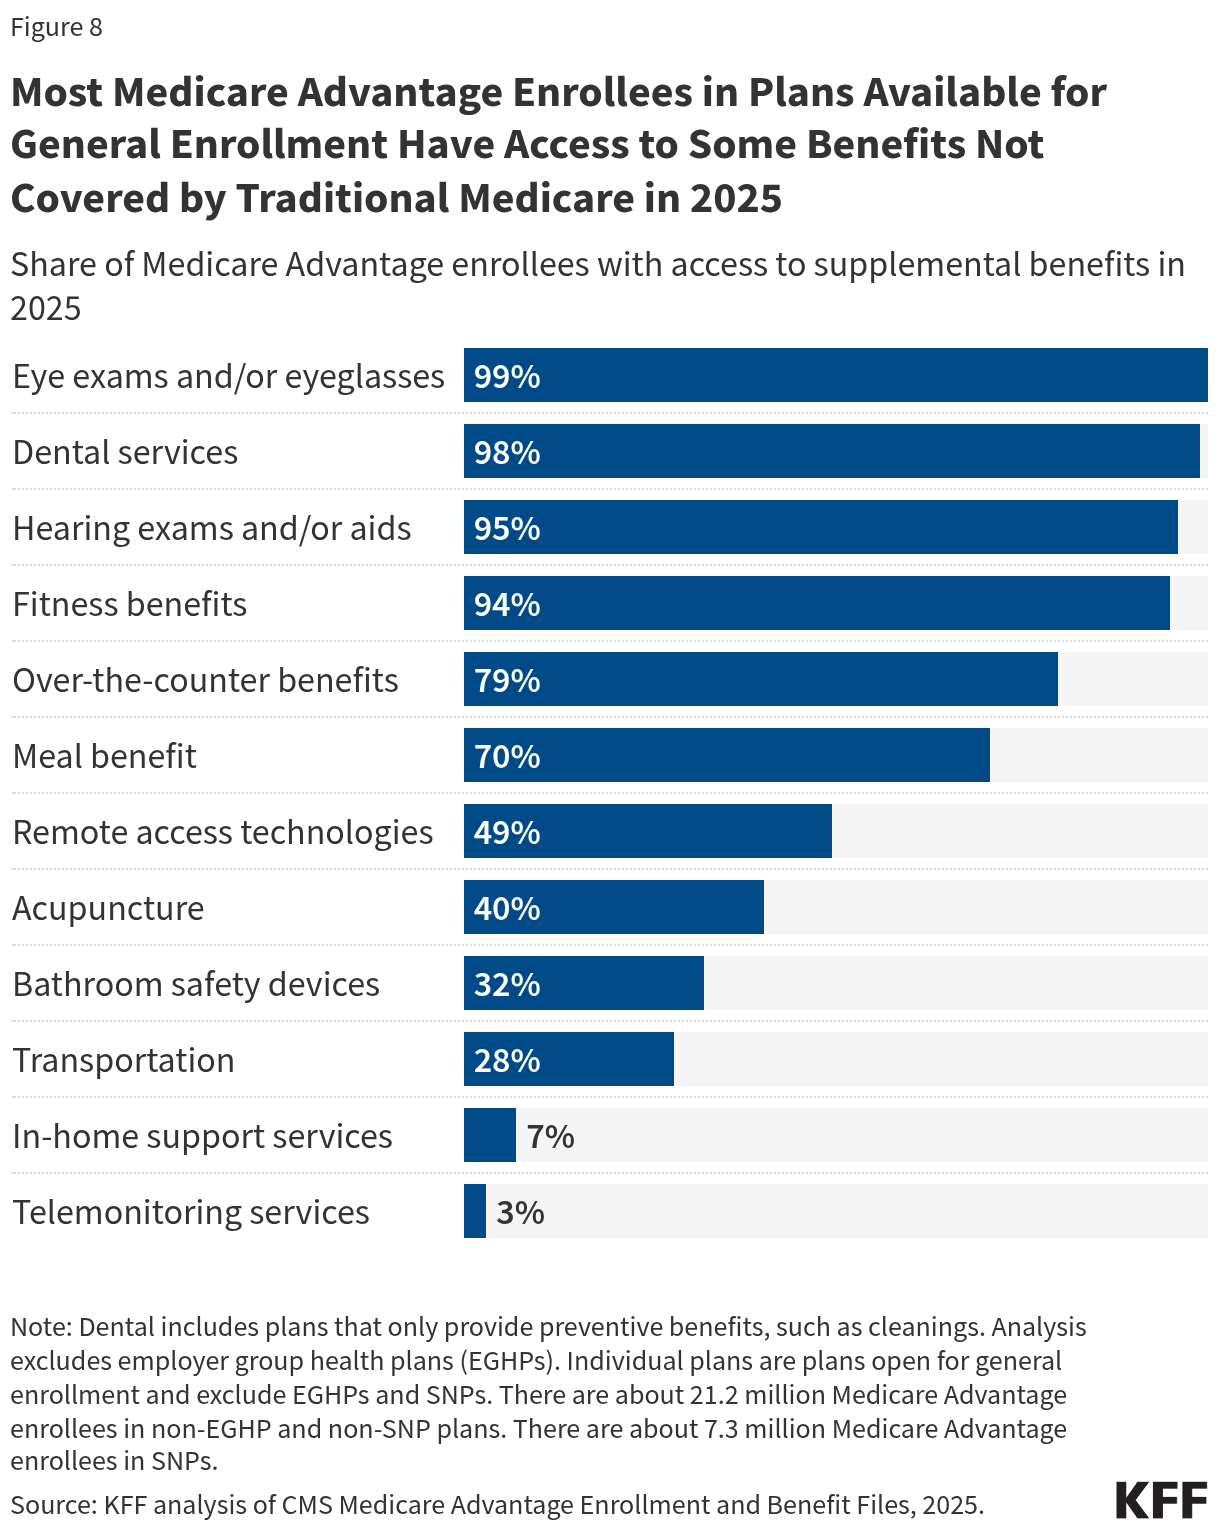
Medicare Advantage plans are required to use payments from the federal government that exceed their costs of covering Part A and B services (known as rebates) to provide supplemental benefits to enrollees, such as lower cost sharing, extra benefits not covered by traditional Medicare, or reducing the amount of Part B and/or Part D premiums. Examples of extra benefits include eyeglasses, hearing exams, preventive dental care, and gym memberships (Figure 8). (See “How Does Medicare Pay Private Plans in Medicare Advantage and Medicare Part D?” for a discussion of how Medicare pays Medicare Advantage plans.) Medicare Advantage plans must also include a cap on out-of-pocket spending, which provides protection from catastrophic medical expenses. Traditional Medicare does not have an out-of-pocket limit, though purchasing a Medigap policy effectively provides protection from catastrophic costs for beneficiaries in traditional Medicare. (See “What Does Medicare Cover and How Much Do People Pay for Medicare Benefits?” for a brief discussion of Medigap.)

Most Medicare Advantage Enrollees in Plans Available for General Enrollment Have Access to Some Benefits Not Covered by Traditional Medicare in 2025

What Is the Medicare Part D Prescription Drug Benefit?

Copy link to What Is the Medicare Part D Prescription Drug Benefit?

Medicare Part D, Medicare’s voluntary outpatient prescription drug benefit, was established by the Medicare Modernization Act of 2003 (MMA) and launched in 2006. Before the addition of the Part D benefit, Medicare did not cover the cost of outpatient prescription drugs. Under Part D, Medicare helps cover prescription drug costs through private plans that contract with Medicare to offer the Part D benefit to enrollees, which is unlike coverage of Part A and Part B benefits under traditional Medicare, and beneficiaries must enroll in a Part D plan if they want this benefit.

A total of 54.8 million people with Medicare are currently enrolled in plans that provide the Medicare Part D drug benefit, including plans open to everyone with Medicare (stand-alone prescription drug plans, or PDPs, and Medicare Advantage drug plans, or MA-PDs) and plans for specific populations (including retirees of a former employer or union and Medicare Advantage Special Needs Plans, or SNPs). Nearly 6 in 10 Part D enrollees are in MA-PDs, as overall enrollment in Medicare Advantage plans has grown in recent years. Just over 13 million low-income beneficiaries receive extra help with their Part D plan premiums and cost sharing through the Part D Low-Income Subsidy Program (LIS).

For 2025, the average Medicare beneficiary has a choice of 14 stand-alone Part D plans and 34 Medicare Advantage drug plans. These plans vary in terms of premiums, deductibles and cost sharing, the drugs that are covered, any utilization management restrictions that apply, and pharmacy networks. People in traditional Medicare who are enrolled in a separate stand-alone Part D plan generally pay a monthly Part D premium unless they qualify for full benefits through the Part D LIS program and are enrolled in a premium-free (benchmark) plan. In 2025, the average enrollment-weighted premium for stand-alone Part D plans is $39 per month. In 2025, most stand-alone Part D plans include a deductible, averaging $491. Plans generally impose a tiered structure to define cost-sharing requirements and cost-sharing amounts charged for covered drugs, typically charging lower cost-sharing amounts for generic drugs and preferred brands and higher amounts for non-preferred and specialty drugs, and a mix of flat dollar copayments and coinsurance (based on a percentage of a drug’s list price) for covered drugs.

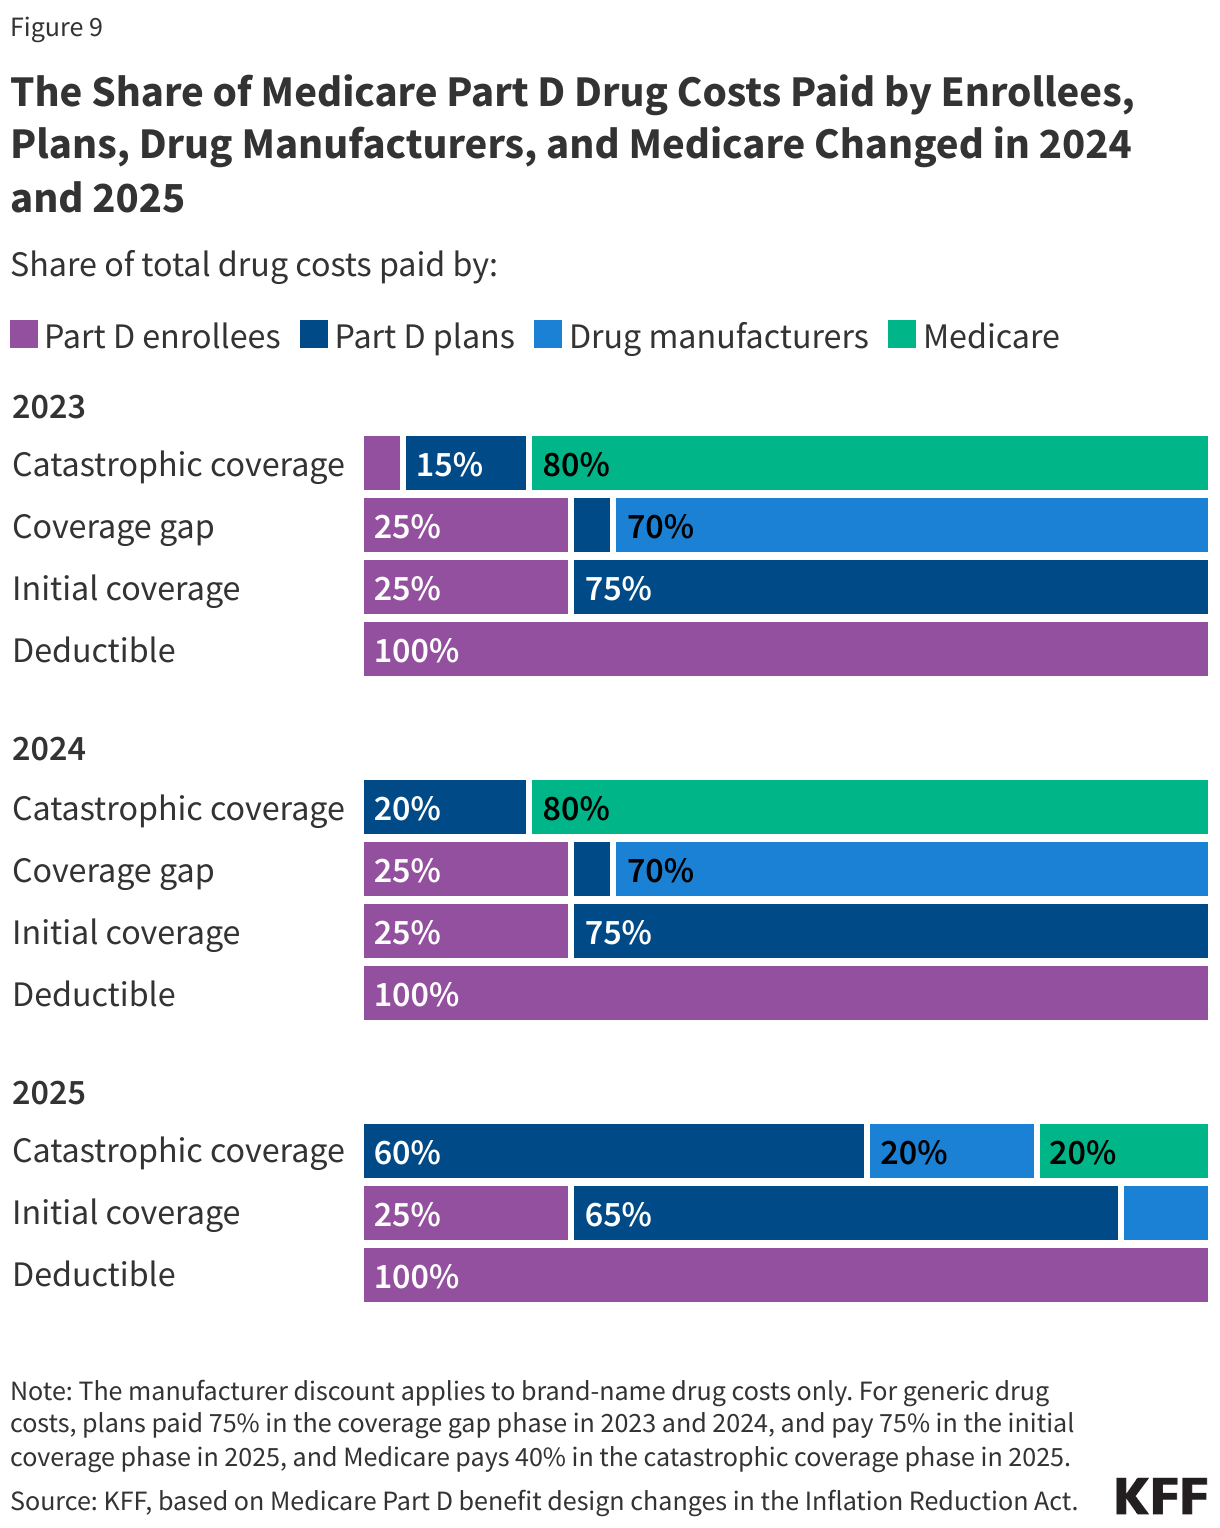
The standard design of the Medicare Part D benefit currently has three distinct phases, where the share of drug costs paid by Part D enrollees, Part D plans, drug manufacturers, and Medicare varies. Based on changes in the Inflation Reduction Act, these shares changed in 2024 and 2025 (Figure 9). Most notably, the Part D benefit now includes a $2,000 out-of-pocket spending cap, meaning Part D enrollees face no additional costs once their out-of-pocket costs exceed $2,000 in 2025. Previously, enrollees with high drug costs who did not receive low-income subsidies were responsible for paying 5% of their total drug costs when they reached the catastrophic coverage phase. This new out-of-pocket spending cap is projected to help an estimated 11 million Part D enrollees in 2025, including 6.1 million enrollees not receiving low-income subsidies.

The Share of Medicare Part D Drug Costs Paid by Enrollees, Plans, Drug Manufacturers, and Medicare Changed in 2024 and 2025

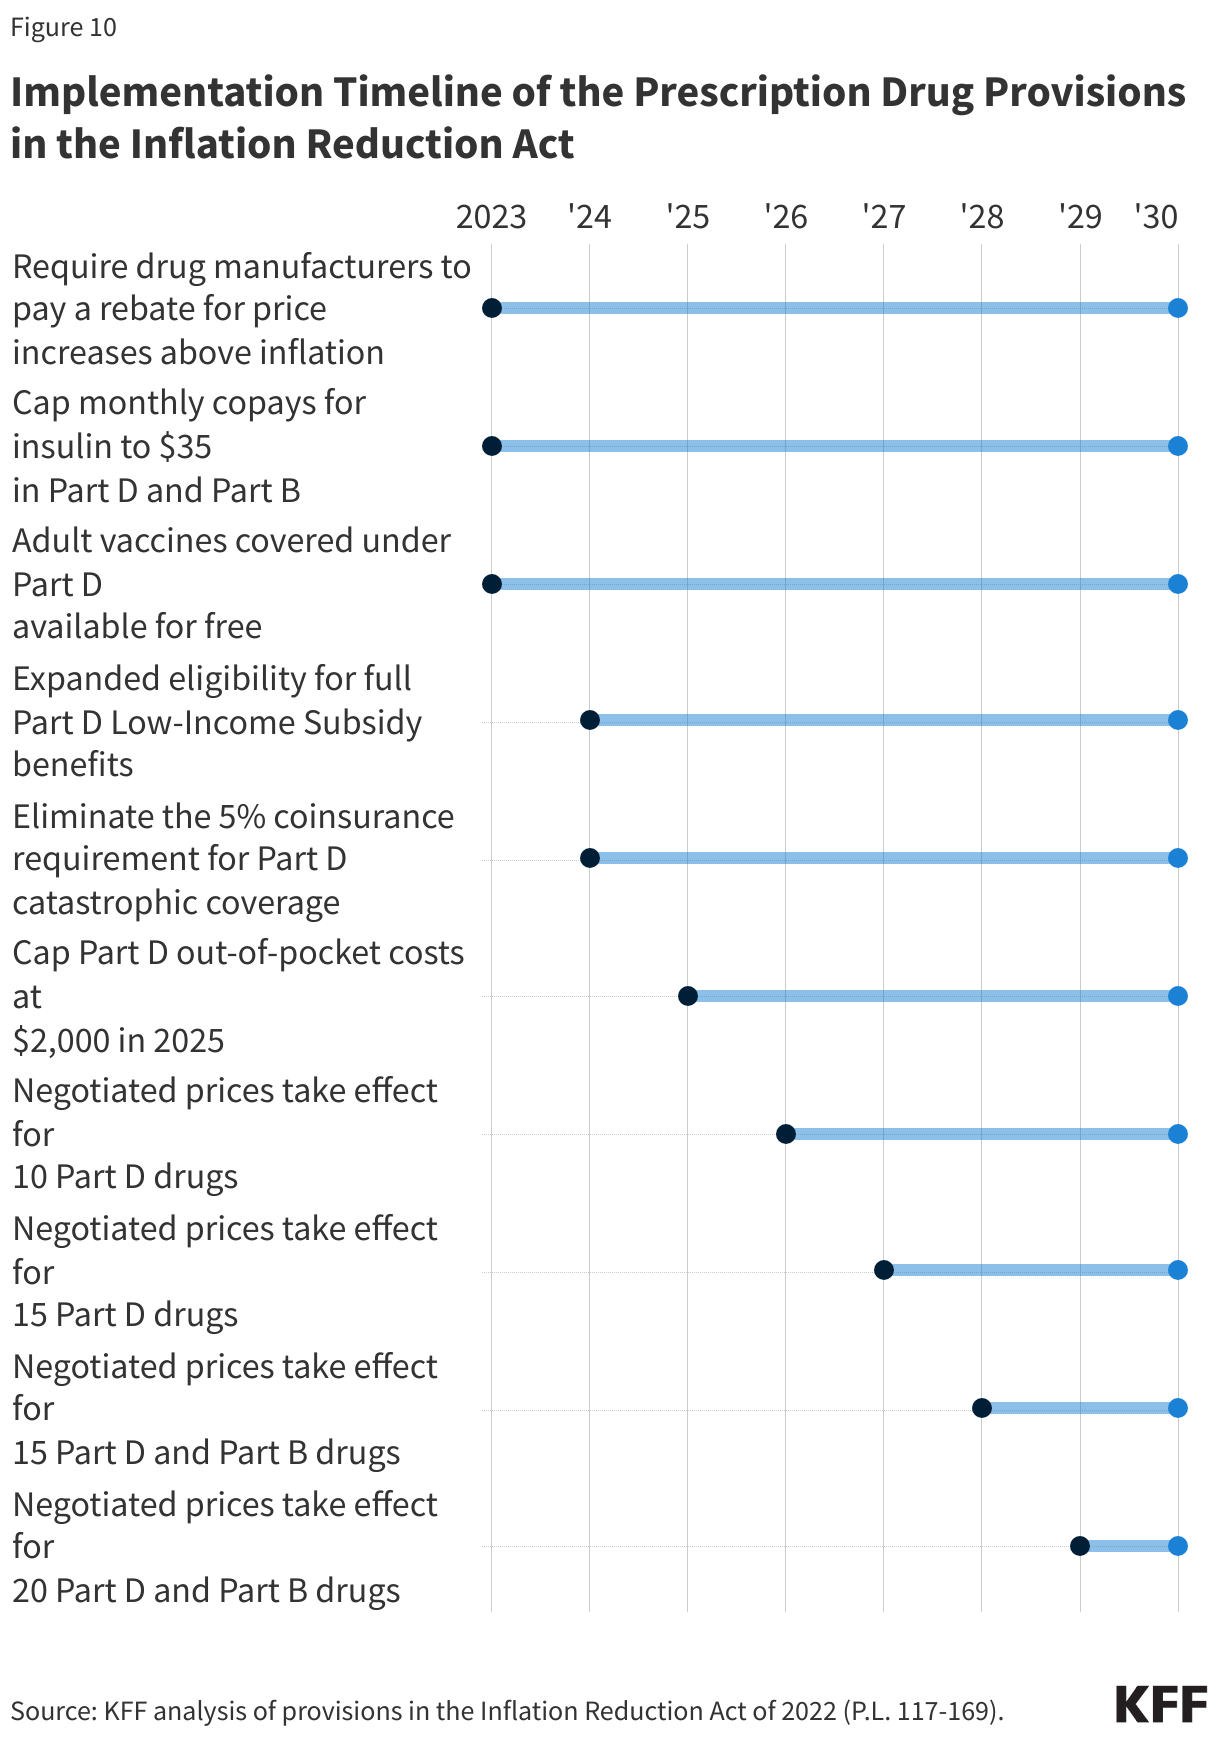
The Inflation Reduction Act of 2022, signed into law by President Biden on August 16, 2022, includes several provisions to lower prescription drug costs for people with Medicare and reduce drug spending by the federal government, including several changes related to the Part D benefit. These provisions include (but are not limited to) (Figure 10):

  • Requiring the Secretary of the Department of Health and Human Services to negotiate the price of some Part D and Part B drugs covered under Medicare. The law that established the Part D benefit included a provision known as the “noninterference” clause, which prevented the HHS Secretary from being involved in price negotiations between drug manufacturers and pharmacies and Part D plan sponsors. In addition, the Secretary of HHS does not currently negotiate prices for drugs covered under Medicare Part B (administered by physicians). To date, Medicare has completed one round of price negotiation on 10 Part D drugs, with negotiated prices available in 2026, and selected 15 more Part D drugs for price negotiation in the second round, with negotiated prices available in 2027.
  • Adding a hard cap on out-of-pocket drug spending under Part D, which phased in beginning in 2024, and was limited to $2,000 in 2025 (increasing to $2,100 in 2026). As noted above, under the original design of the Part D benefit, enrollees had catastrophic coverage for high out-of-pocket drug costs, but there was no limit on the total amount that beneficiaries paid out of pocket each year.  
  • Limiting the out-of-pocket cost of insulin products to no more than $35 per month in all Part D plans and in Part B and making adult vaccines covered under Part D available for free as of 2023. Until these provisions took effect, beneficiary costs for insulin and adult vaccines were subject to varying cost-sharing amounts.
  • Expanding eligibility for full benefits under the Part D Low-Income Subsidy program in 2024, eliminating the partial LIS benefit for individuals with incomes between 135% and 150% of poverty. Beneficiaries who receive full LIS benefits pay no Part D premium or deductible and only modest copayments for prescription drugs until they reach the catastrophic threshold, at which point they face no additional cost sharing.
  • Requiring drug manufacturers to pay a rebate to the federal government if prices for drugs covered under Part D and Part B increase faster than the inflation rate, with the initial period for measuring Part D drug price increases running from October 2022-September 2023. Previously, Medicare had no authority to limit annual price increases for drugs covered under Part B or Part D. Year-to-year drug price increases exceeding inflation are not uncommon and affect people with both Medicare and private insurance.
Implementation Timeline of the Prescription Drug Provisions in the Inflation Reduction Act

How Does Medicare Pay Hospitals, Physicians, and Other Providers in Traditional Medicare?

Copy link to How Does Medicare Pay Hospitals, Physicians, and Other Providers in Traditional Medicare?

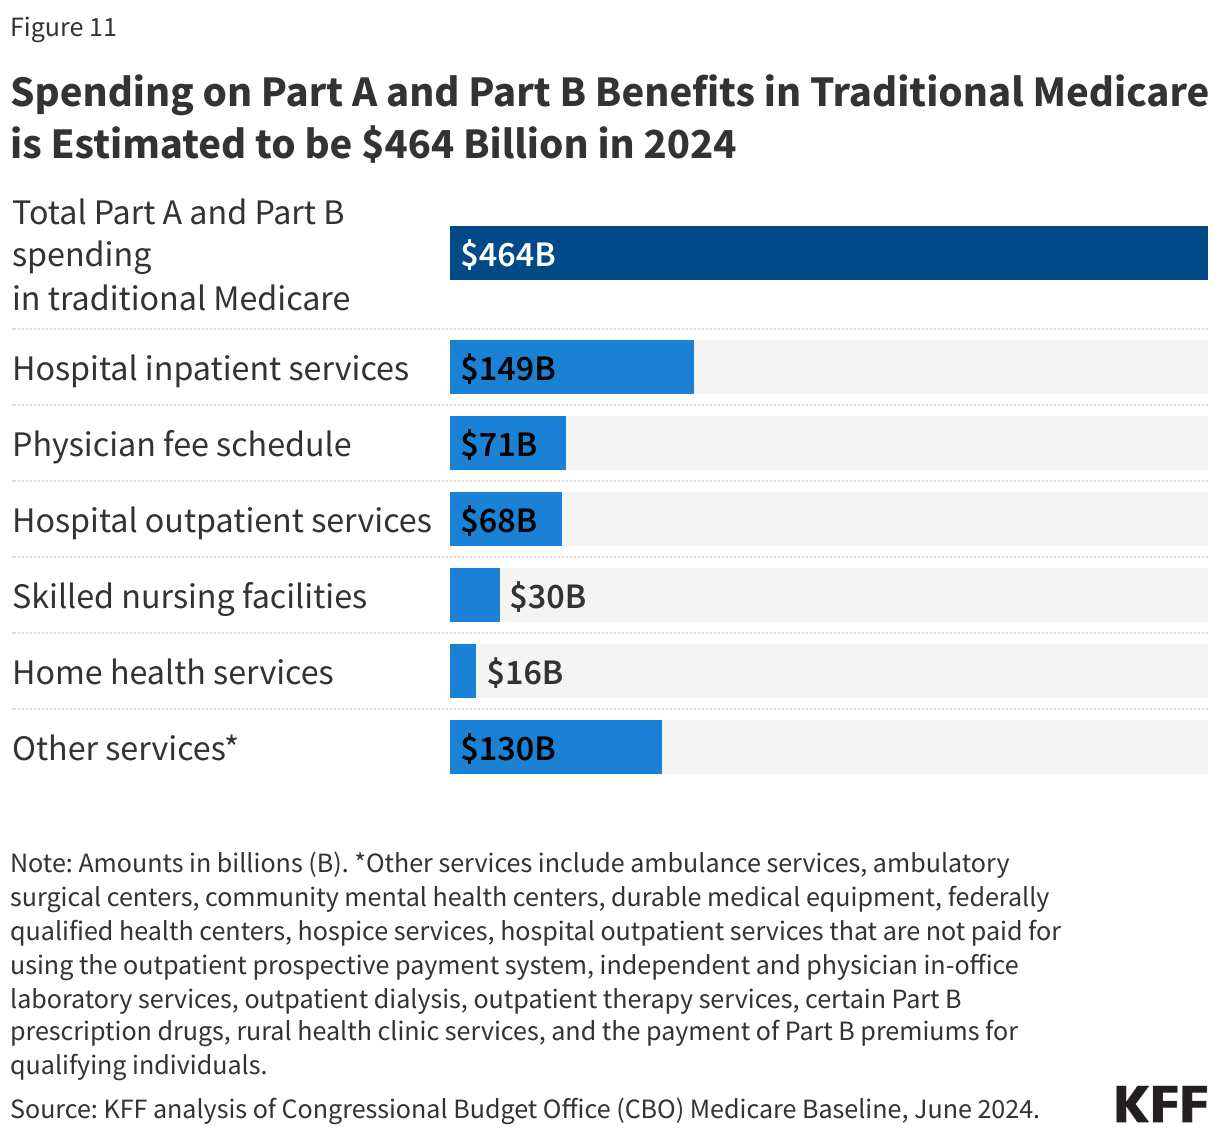
In 2024, Medicare was estimated to spend $464 billion on benefits covered under Part A and Part B for beneficiaries in traditional Medicare. Medicare pays providers in traditional Medicare using various payment systems depending on the setting of care (Figure 11).

Spending on Part A and Part B Benefits in Traditional Medicare is Estimated to be $464 Billion in 2024

Medicare relies on a number of different approaches when determining payments to providers for Part A and Part B services delivered to beneficiaries in traditional Medicare. These providers include hospitals (for both inpatient and outpatient services), physicians, skilled nursing facilities, home health agencies, and several other types of providers. Of the $464 billion in estimated spending on Medicare benefits covered under Part A and Part B in traditional Medicare in 2024, $149 billion (32%) was for hospital inpatient services and $68 billion (15%) was for hospital outpatient services, $71 billion (15%) was for services covered under the physician fee schedule, and $176 billion (38%) was for all other Part A or Part B services for beneficiaries in traditional Medicare.

Medicare uses prospective payment systems for most providers in traditional Medicare. These systems generally require that Medicare pre-determine a base payment rate for a given unit of service (e.g., a hospital stay, an episode of care, a particular service). Then, based on certain variables, such as the provider’s geographic location and the complexity of the patient receiving the service, Medicare adjusts its payment for each unit of service provided. Medicare updates payment rates annually for most payment systems to account for inflation adjustments. 

The main features of hospital, physician, outpatient, and skilled nursing facility payment systems (altogether accounting for 69% of spending on Part A and Part B benefits in traditional Medicare) are described below:

  • Inpatient hospitals (acute care): Medicare pays hospitals per beneficiary discharge using the Inpatient Prospective Payment System. The rate for each discharge corresponds to one of over 770 different categories of diagnoses – called Medicare Severity Diagnosis Related Groups (MS-DRGs), which reflect the principal diagnosis, secondary diagnoses, procedures performed, and other patient characteristics. DRGs that are likely to incur more intense levels of care and/or longer lengths of stay are assigned higher payments. Medicare’s payments to hospitals also account for a portion of hospitals’ capital and operating expenses.
  • Medicare also makes additional payments to hospitals in particular situations. These include additional payments for rural or isolated hospitals that meet certain criteria. Further, Medicare makes additional payments to help offset costs incurred by hospitals that are not otherwise accounted for in the inpatient prospective payment system. These include add-on payments for treating a disproportionate share (DSH) of low-income patients, as well as for covering costs associated with care provided by medical residents, known as indirect medical education (IME). While not part of the Inpatient Prospective Payment System, Medicare also pays hospitals directly for the costs of operating residency programs, known as Graduate Medical Education (GME) payments.
  • Physicians and other health professionals: Medicare reimburses physicians and other health professionals (e.g., nurse practitioners) based on the Physician Fee Schedule for over 10,000 services. Payment rates for these services are based on three components: (1) clinician work, (2) practice expenses, and (3) professional liability insurance (also known as medical malpractice insurance), which are measured in terms of “relative value units” (RVUs). Each component is adjusted to account for differences across geography and then multiplied by a conversion factor. Payment rates for individual services may be updated each year based in part on the recommendations of the AMA/Specialty Society RVS Update Committee (RUC), a volunteer committee of physicians and other professionals overseen by the American Medical Association (AMA). CMS also makes annual updates to the conversion factor based on statutory factors, as well as adjustments to preserve budget neutrality, which may result in payment cuts for physicians and other clinicians whenever the projected cost of all Physician Fee Schedule spending is expected to increase by more than $20 million for the year.
  • Payment rates specified under the Physician Fee Schedule are subject to further adjustments under the Quality Payment Program, established by the Medicare Access and CHIP Reauthorization Act of 2015 (MACRA). Clinicians can receive payment increases if they participate in qualified advanced alternative payment models (A-APMs), which bear some financial risk for the costs of patient care, while those who participate in the Merit-based Incentive Payment System (MIPS) may receive payment increases or decreases (or no change) depending on their performance on specific quality measures. (See “What Is Medicare Doing to Promote Alternative Payment Models?” for more information about alternative payment models in Medicare.)
  • While not part of the Physician Fee Schedule, Medicare also pays for a limited number of drugs that physicians and other health care providers administer. For drugs administered by physicians, which are covered under Part B, Medicare reimburses providers based on a formula set at 106% of the Average Sales Price (ASP), which is the average price to all non-federal purchasers in the U.S, inclusive of rebates (other than rebates paid under the Medicaid program).
  • Hospital outpatient departments: Medicare pays hospitals for ambulatory services provided in outpatient departments, using the Hospital Outpatient Prospective Payment System, based on the classification of individual services into Ambulatory Payment Classifications (APC) with similar characteristics and expected costs. Final determination of Medicare payments for outpatient department services is complex. It incorporates both individual service payments and payments “packaged” with other services, partial hospitalization payments, as well as numerous exceptions, such as payments for new technologies. Medicare payment rates for services provided in hospital outpatient departments are typically higher than for similar services provided in physicians’ offices, and evidence indicates that providers have shifted the billing of services to higher-cost settings. There is bipartisan interest in proposals to expand so-called “site-neutral” payments, meaning that Medicare would align payment rates for the same service across settings.
  • Skilled Nursing Facilities (SNFs): SNFs are freestanding or hospital-based facilities that provide post-acute inpatient nursing or rehabilitation services. Medicare pays SNFs based on the Skilled Nursing Facility Prospective Payment System, and payments to SNFs are determined using a base payment rate, adjusted for geographic differences in labor costs, case mix, and, in some cases, length of stay. Daily rates consider six care components – nursing, physical therapy, occupational therapy, speech–language pathology services, nontherapy ancillary services and supplies, and non–case mix (room and board services).

How Does Medicare Pay Private Plans in Medicare Advantage and Medicare Part D?

Copy link to How Does Medicare Pay Private Plans in Medicare Advantage and Medicare Part D?

Medicare Advantage. Medicare pays firms offering Medicare Advantage plans a set monthly amount per enrollee. The payment is determined through an annual process in which plans submit “bids” for how much they estimate it will cost to provide benefits covered under Medicare Parts A and B for an average beneficiary. The bid is compared to a county “benchmark”, which is the maximum amount the federal government will pay for a Medicare Advantage enrollee and is a percentage of estimated spending in traditional Medicare in the same county, ranging from 95 percent in high-cost counties to 115 percent in low-cost counties. When the bid is below the benchmark in a given county, plans receive a portion of the difference (the “rebate”), which they must use to lower cost sharing, pay for extra benefits, or reduce enrollees’ Part B or Part D premiums. Payments to plans are risk adjusted, based on the health status and other characteristics of enrollees, including age, sex, and Medicaid enrollment. In addition, Medicare adopted a quality bonus program that increases the benchmark for plans that receive at least four out of five stars under the quality rating system, which increases plan payments.

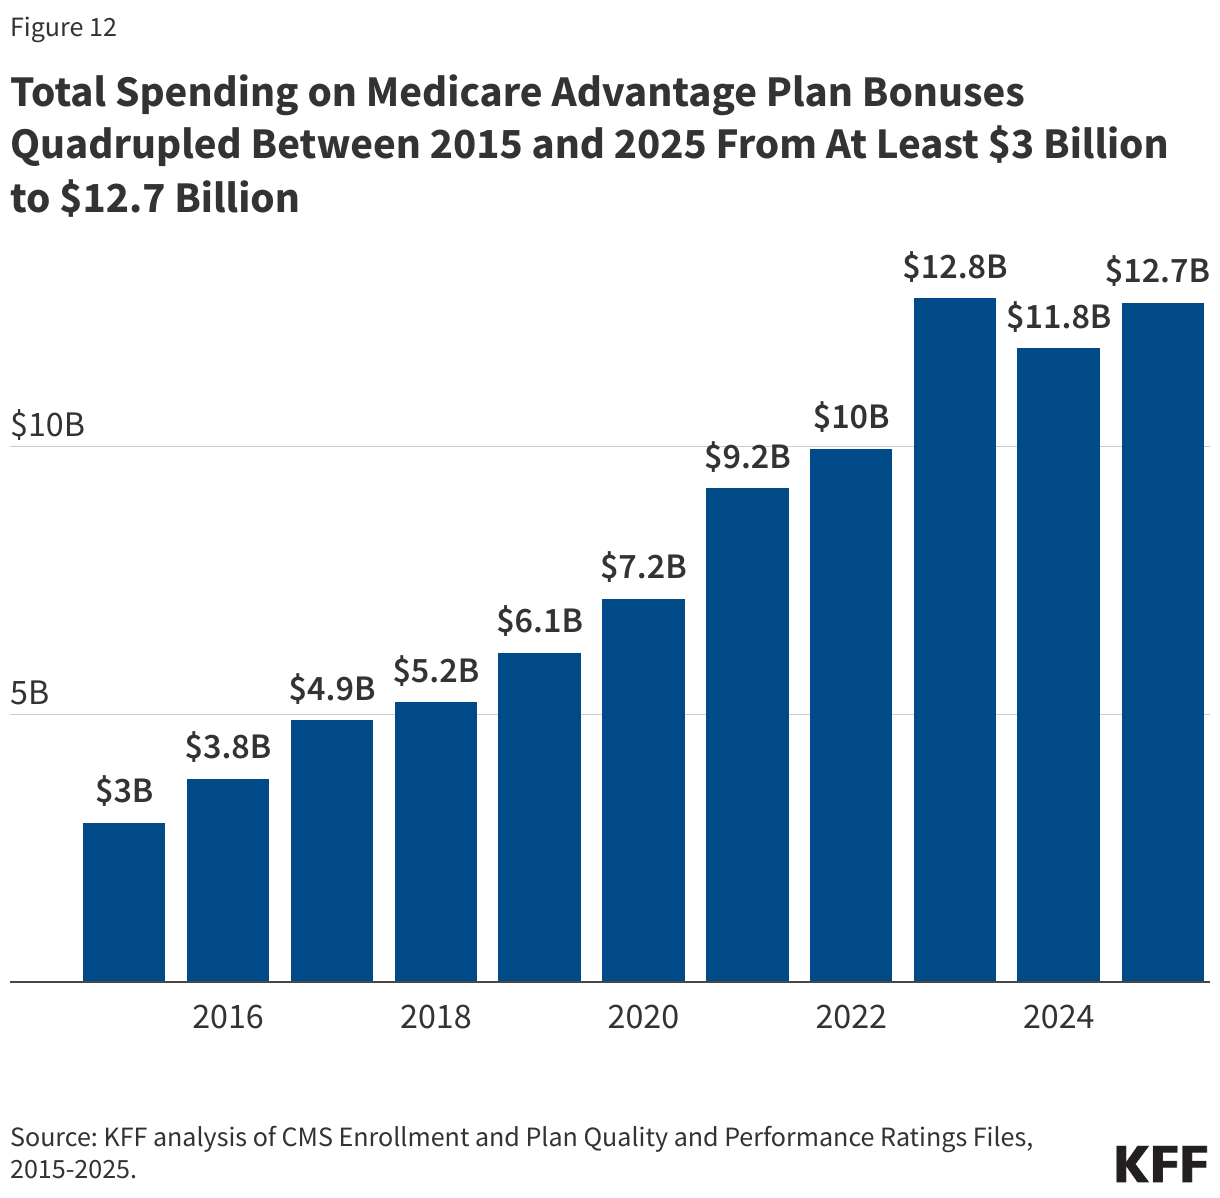
Generally, Medicare pays more to private Medicare Advantage plans for enrollees than their costs would be in traditional Medicare. The Medicare Payment Advisory Commission (MedPAC) reports that while it costs Medicare Advantage plans 83% of what it costs traditional Medicare to pay for Medicare-covered services, plans receive payments from CMS that are 120% of spending for similar beneficiaries in traditional Medicare, on average. The higher spending stems from features of the formula used to determine payments to Medicare Advantage plans, including setting benchmarks above traditional Medicare spending in half of counties and higher benchmarks due to the quality bonus program, resulting in bonus payments of at least $12.7 billion in 2025. This amount is four times greater than spending on bonus payments in 2015 (Figure 12).

Total Spending on Medicare Advantage Plan Bonuses Quadrupled Between 2015 and 2025 From At Least $3 Billion to $12.7 Billion

The higher spending in Medicare Advantage is also related to the impact of coding intensity, where Medicare Advantage enrollees look sicker than they would if they were in traditional Medicare, resulting in plans receiving higher risk adjustments to their monthly per person payments, translating to an estimated $84 billion in excess payments to plans in 2025.

Higher payments to Medicare Advantage plans allow them to offer extra benefits attractive to enrollees. However, these benefits come at a cost to all beneficiaries through higher Part B premiums – amounting to $13 billion in 2025 alone – and contribute to the strain on the Medicare Part A Hospital Insurance Trust Fund. (See “How Much Does Medicare Spend and How Is the Program Financed?” for additional information .)

Medicare Part D. Medicare pays Part D plans, both stand-alone prescription drug plans and Medicare Advantage plans that offer drug coverage, based on an annual competitive bidding process. Plans submit bids yearly to Medicare for their expected costs of providing the drug benefit plus administrative expenses. Plans receive a direct subsidy per enrollee, which is risk-adjusted based on the health status of their enrollees, plus reinsurance payments from Medicare for the highest-cost enrollees and adjustments for the low-income subsidy (LIS) status of their enrollees. (Unlike Medicare Advantage, there is no quality bonus program that provides higher payments to Part D plans with higher Part D quality ratings.) Risk-sharing arrangements with the federal government (“risk corridors”) limit plans' potential total losses or gains.

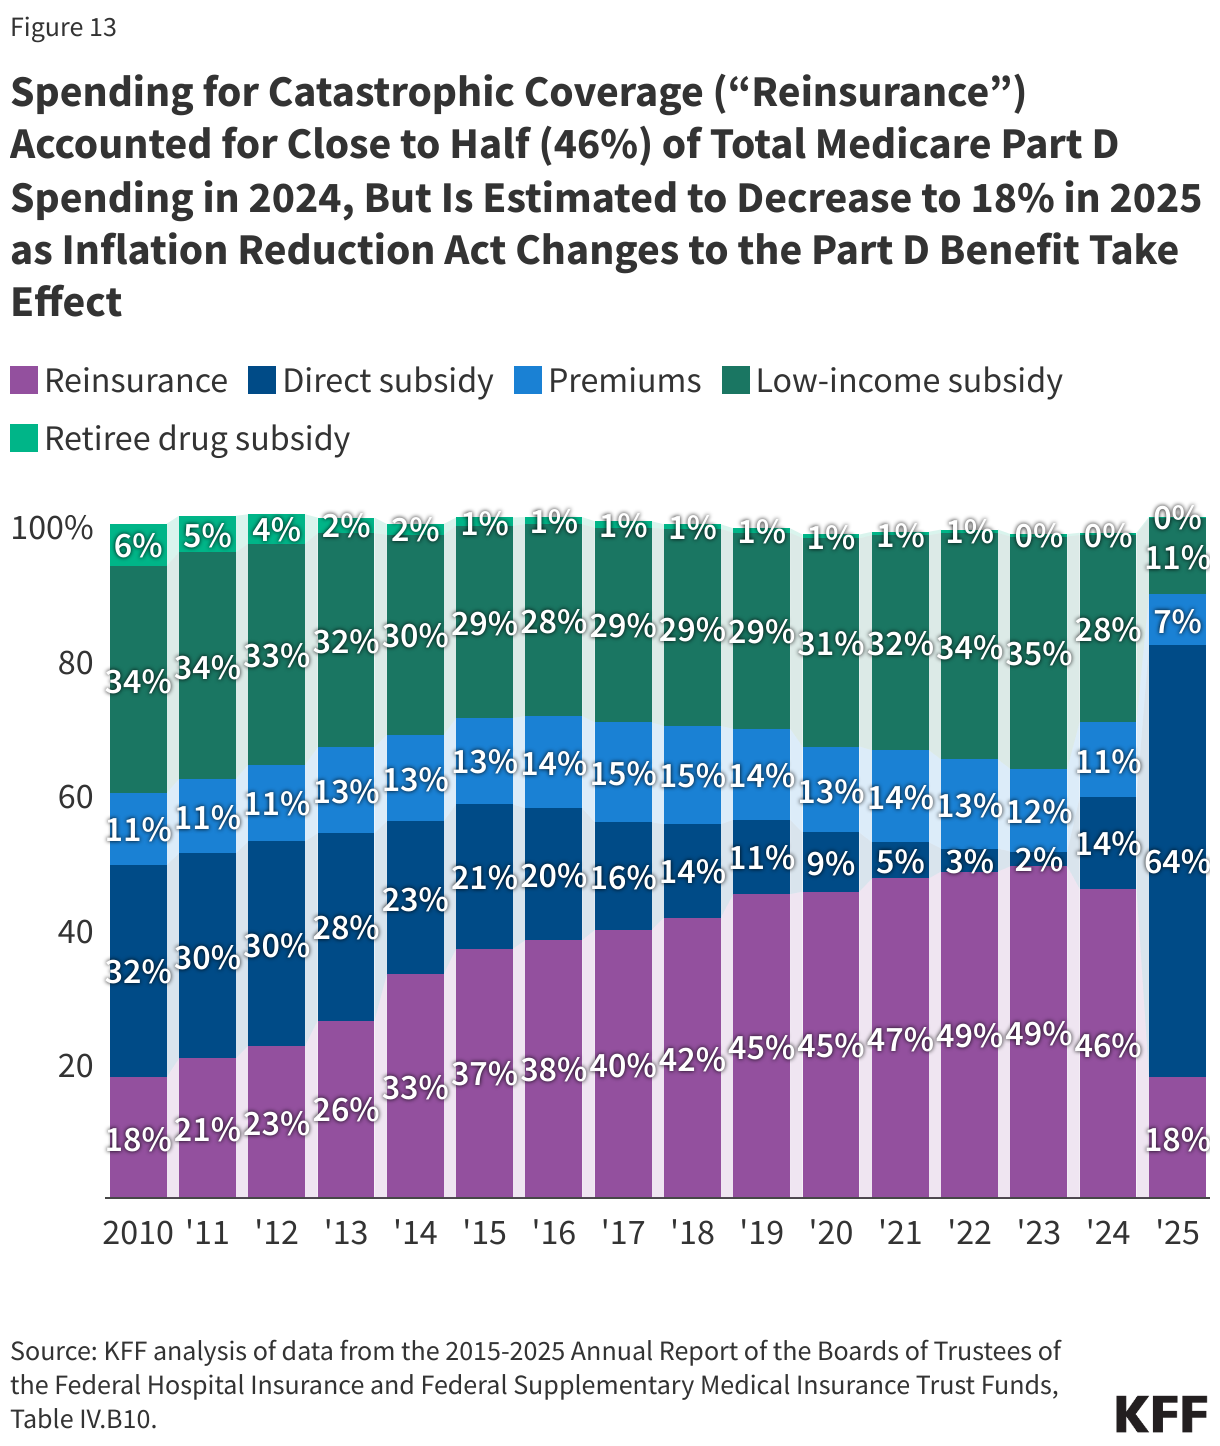
Under reinsurance, Medicare subsidizes 20% of total drug spending incurred by Part D enrollees with relatively high drug spending above the catastrophic coverage threshold, as of 2025, down from 80% in prior years, based on a provision of the Inflation Reduction Act. This provision was designed to shift more of the responsibility for catastrophic drug costs to Part D plans and drug manufacturers. Plans now pay 60% of total drug costs above the catastrophic threshold, up from 15% to 20% in prior years. (See “What Is the Medicare Part D Prescription Drug Benefit?” for more detail on plan liability under various phases of the Part D benefit and more information on changes to Part D included in the Inflation Reduction Act.) In the aggregate, Medicare’s reinsurance payments to Part D plans in 2025 are estimated to account for 18% of total Part D spending, down from close to half of total Part D spending (46%) in 2024 (Figure 13).

Spending for Catastrophic Coverage (“Reinsurance”) Accounted for Close to Half (46%) of Total Medicare Part D Spending in 2024, But Is Estimated to Decrease to 18% in 2025 as Inflation Reduction Act Changes to the Part D Benefit Take Effect

For 2025, Medicare’s actuaries estimate that Part D plans will receive direct subsidy payments averaging $1,855 per enrollee overall, $1,313 for enrollees receiving the LIS, and $517 in reinsurance payments for very high-cost enrollees.

What Is Medicare Doing to Promote Alternative Payment Models?

Copy link to What Is Medicare Doing to Promote Alternative Payment Models?

While Medicare has traditionally paid providers on a fee-for-service basis, the program is implementing various alternative payment models designed to tie payments under traditional Medicare to provider performance on quality and spending. Although the overarching goals of these various models are similar—improving the quality and affordability of patient care, increasing coordination between care teams, and reducing health care costs—the specific aims vary by model.

A notable example of an alternative payment model within Medicare is the Medicare Shared Savings Program (MSSP), a permanent accountable care organization (ACO) program in traditional Medicare established by the Affordable Care Act (ACA) that offers financial incentives to providers for meeting or exceeding savings targets and quality goals. ACOs are groups of doctors, hospitals, and other health care providers who voluntarily form partnerships to collaborate and share accountability for the quality and cost of care delivered to their patients. The MSSP currently offers different participation options to ACOs, allowing these organizations to share in savings only or both savings and losses, depending on their level of experience and other factors.

ACOs have a defined patient population for the purpose of calculating annual savings or losses. Beneficiaries in traditional Medicare may choose to align themselves to an ACO (voluntary alignment) or may be assigned to a particular ACO based on where they received a plurality of their primary care services. In either case, beneficiaries are free to seek treatment from any provider who accepts Medicare and are not limited to ACO-affiliated providers. This contrasts with enrollment in Medicare Advantage, where beneficiaries are generally limited to seeing providers in their plan’s network or face higher out-of-pocket costs for seeing out-of-network providers.

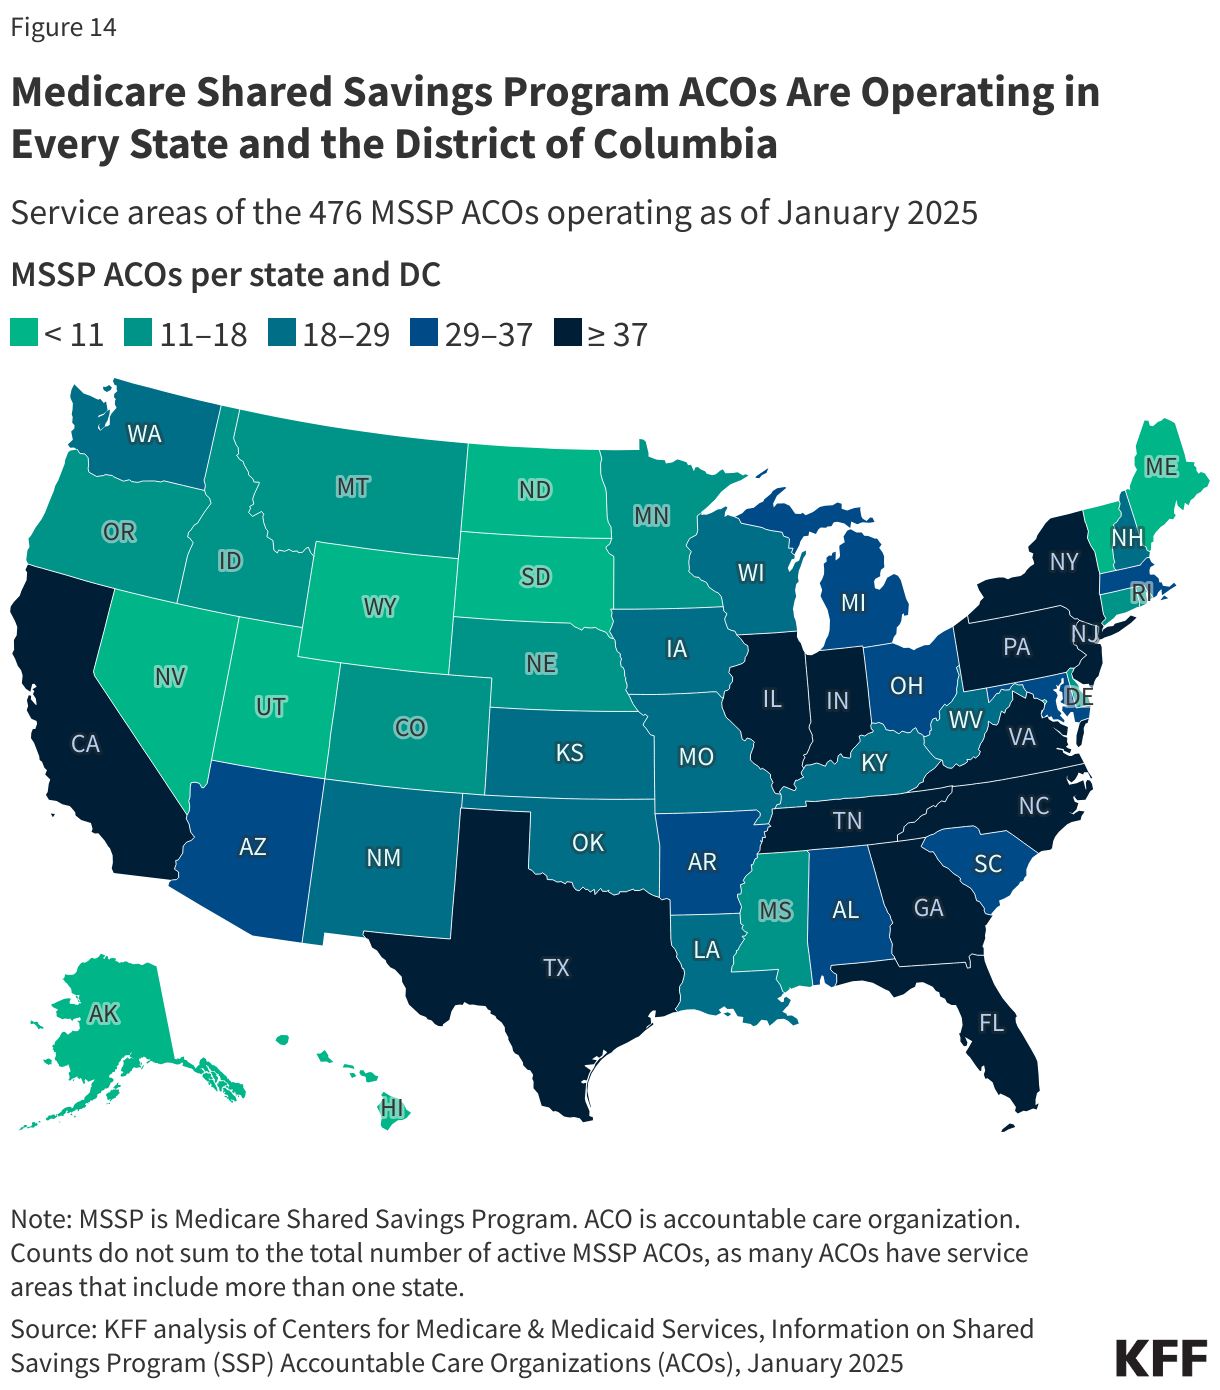
In 2023, the Medicare Shared Savings Program saved Medicare an estimated $2.1 billion relative to annual spending targets. As of 2025, there are 476 MSSP ACOs nationwide, with over 643,000 participating clinicians and 10.8 million beneficiaries aligned to MSSP ACOs (Figure 14).

Medicare Shared Savings Program ACOs Are Operating in Every State and the District of Columbia

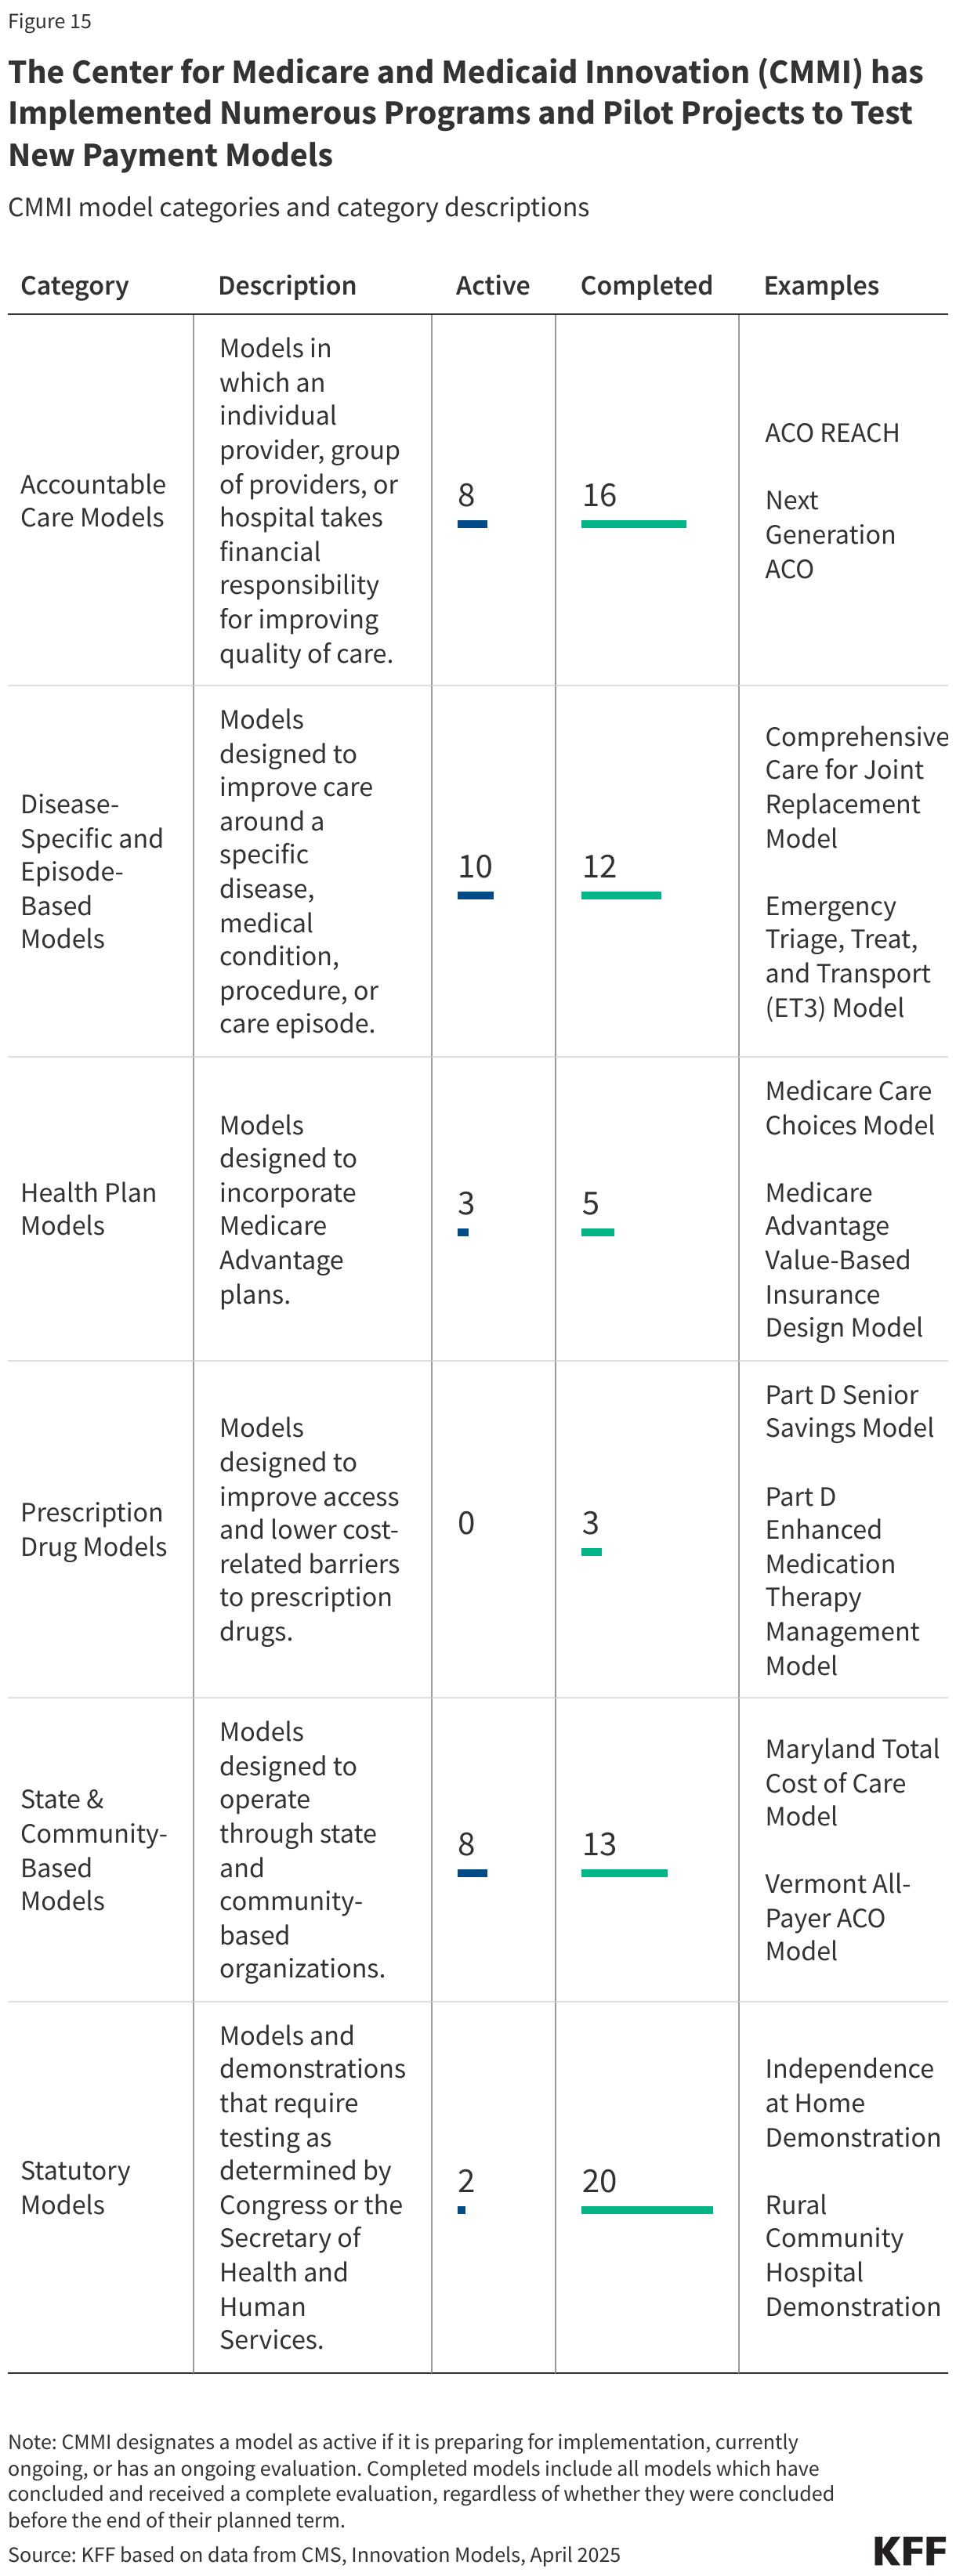
The ACA also established the Center for Medicare and Medicaid Innovation (CMMI, also known as the Innovation Center), an operating center within the Centers for Medicare & Medicaid Services tasked with designing and testing alternative payment models to address concerns about rising health care costs, quality of care, and inefficient spending within the Medicare, Medicaid, and CHIP programs. Since its start in 2010, CMMI has launched more than 80 models across six different categories, including accountable care models, disease-specific models, health plan models, and others (Figure 15). CMMI models are designed to be tested over a limited number of years, but Congress gave CMMI the authority to expand models nationwide permanently if they meet certain quality and savings criteria. As of the most recent estimate, six models have shown statistically significant savings, and four have met the requirements for permanent expansion into the wider Medicare program, including the Medicare Diabetes Prevention Program and the Home Health Value-Based Purchasing Model.

While the overall aims of CMMI are set in law, changes of administration have brought about changes in the strategic direction of the Innovation Center and the types of models that have been pursued, along with the reframing or termination of certain models from the previous administration. For example, the Biden administration placed a greater emphasis on health equity in CMMI models, while the second Trump administration is prioritizing evidence-based preventive care, empowering consumers with data and information to make health decisions, and promoting choice and competition in health care markets.

The Center for Medicare and Medicaid Innovation (CMMI) has Implemented Numerous Programs and Pilot Projects to Test New Payment Models

According to the Congressional Budget Office (CBO), the activities of CMMI increased federal spending by $5.4 billion from 2011 to 2020, which CBO attributes in part to the mixed success of many models at generating sufficient savings to offset their high upfront costs. (CBO had initially projected that CMMI would reduce federal spending by $2.8 billion in its first decade of operation.) However, evidence suggests that savings vary by model type, with the greatest savings found among state and community-based models. Further, a review of select CMMI models provides evidence of improvements in care coordination, team-based care, and other care delivery changes, even in the absence of savings. CBO projects that CMMI’s activities will come closer to the breakeven point regarding federal spending over the course of the current decade (2024-2033).

How Much Does Medicare Spend and How Is the Program Financed?

Copy link to How Much Does Medicare Spend and How Is the Program Financed?

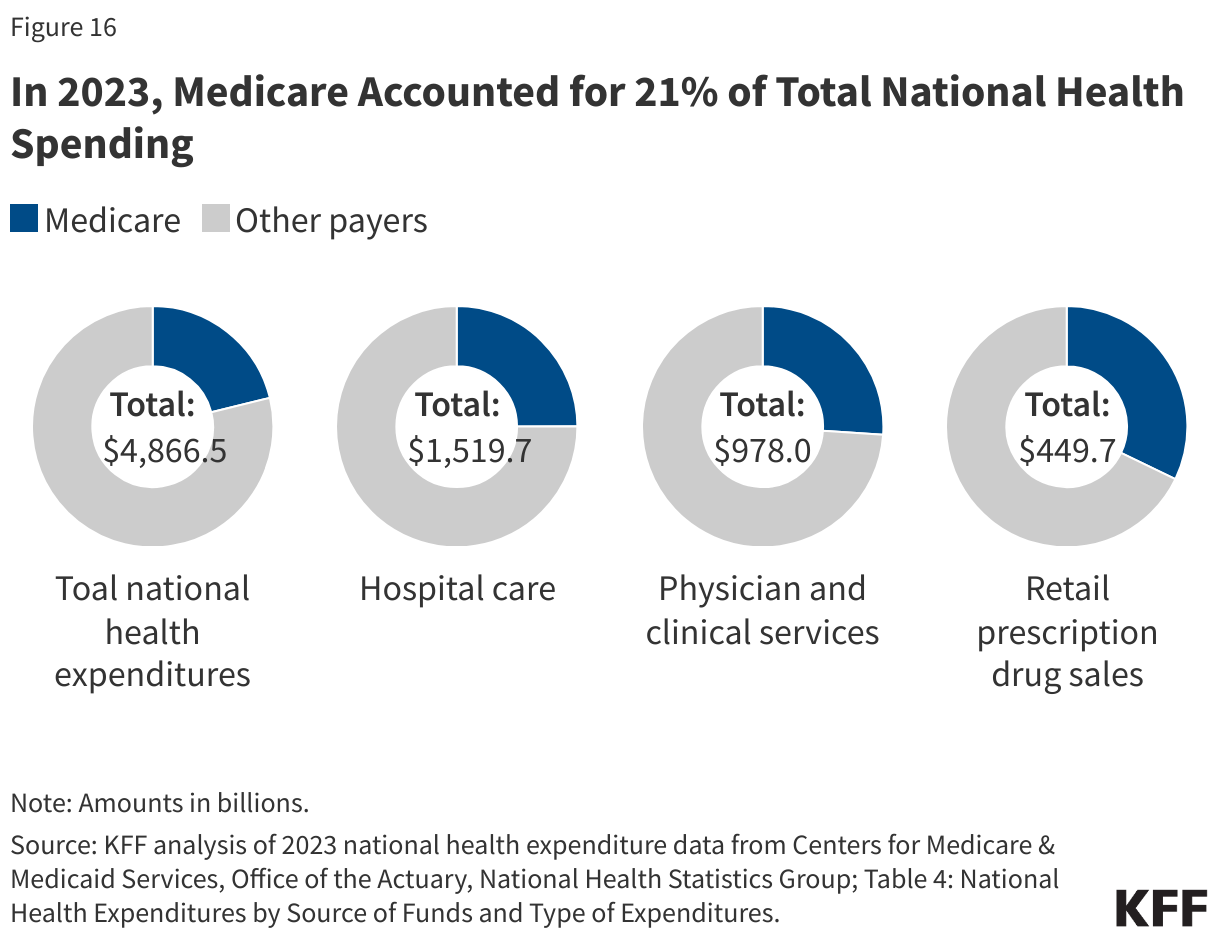
Spending. Medicare plays a significant role in the health care system, accounting for 21% of total national health spending in 2023, a quarter of spending on both hospital care and physician and clinical services, and 32% of spending on retail prescription drug sales (Figure 16).

In 20222023, Medicare Accounted for 21% of Total National Health Spending

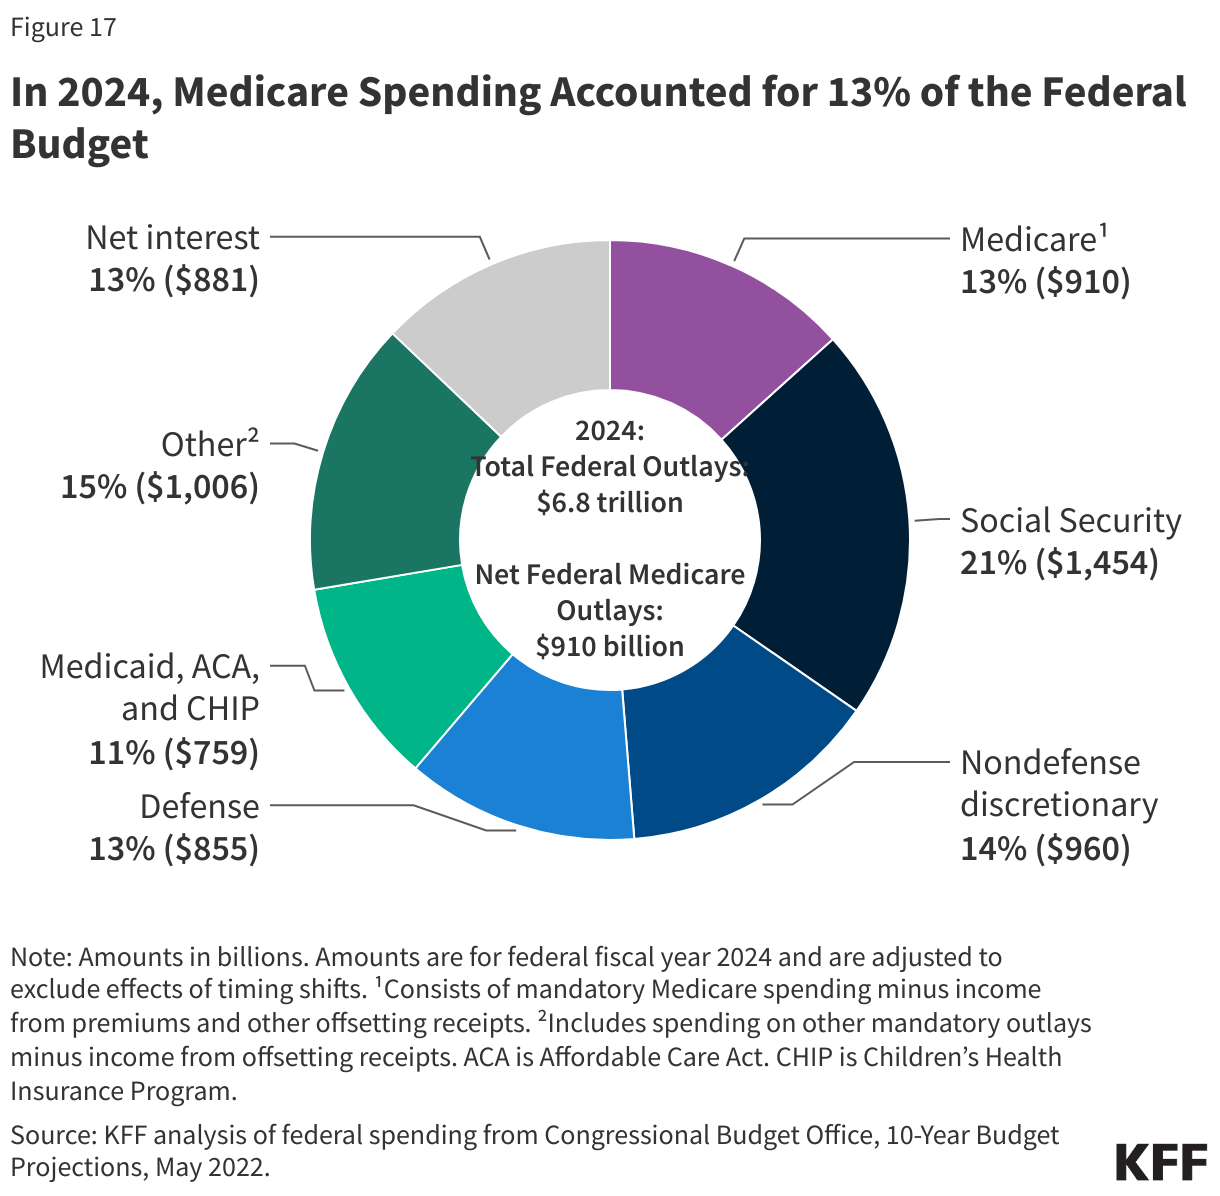
In 2024, Medicare spending, net of income from premiums and other offsetting receipts, totaled $910 billion and accounted for 13% of the federal budget — a similar share as spending on Medicaid, the ACA, and the Children’s Health Insurance Program combined, and defense spending (Figure 17).

In 2024, Medicare Spending Accounted for 13% of the Federal Budget

In 2025, Medicare benefit payments are estimated to total $1.1 trillion, up from $632 billion in 2015 (including spending for Part A, Part B, and Part D benefits in both traditional Medicare and Medicare Advantage). Medicare spending per person has also grown, increasing from $5,800 to $16,700 between 2000 and 2023 – or 4.7% average annual growth over the 23-year period. In recent years, however, growth in spending per person has been lower in Medicare than in private health insurance .

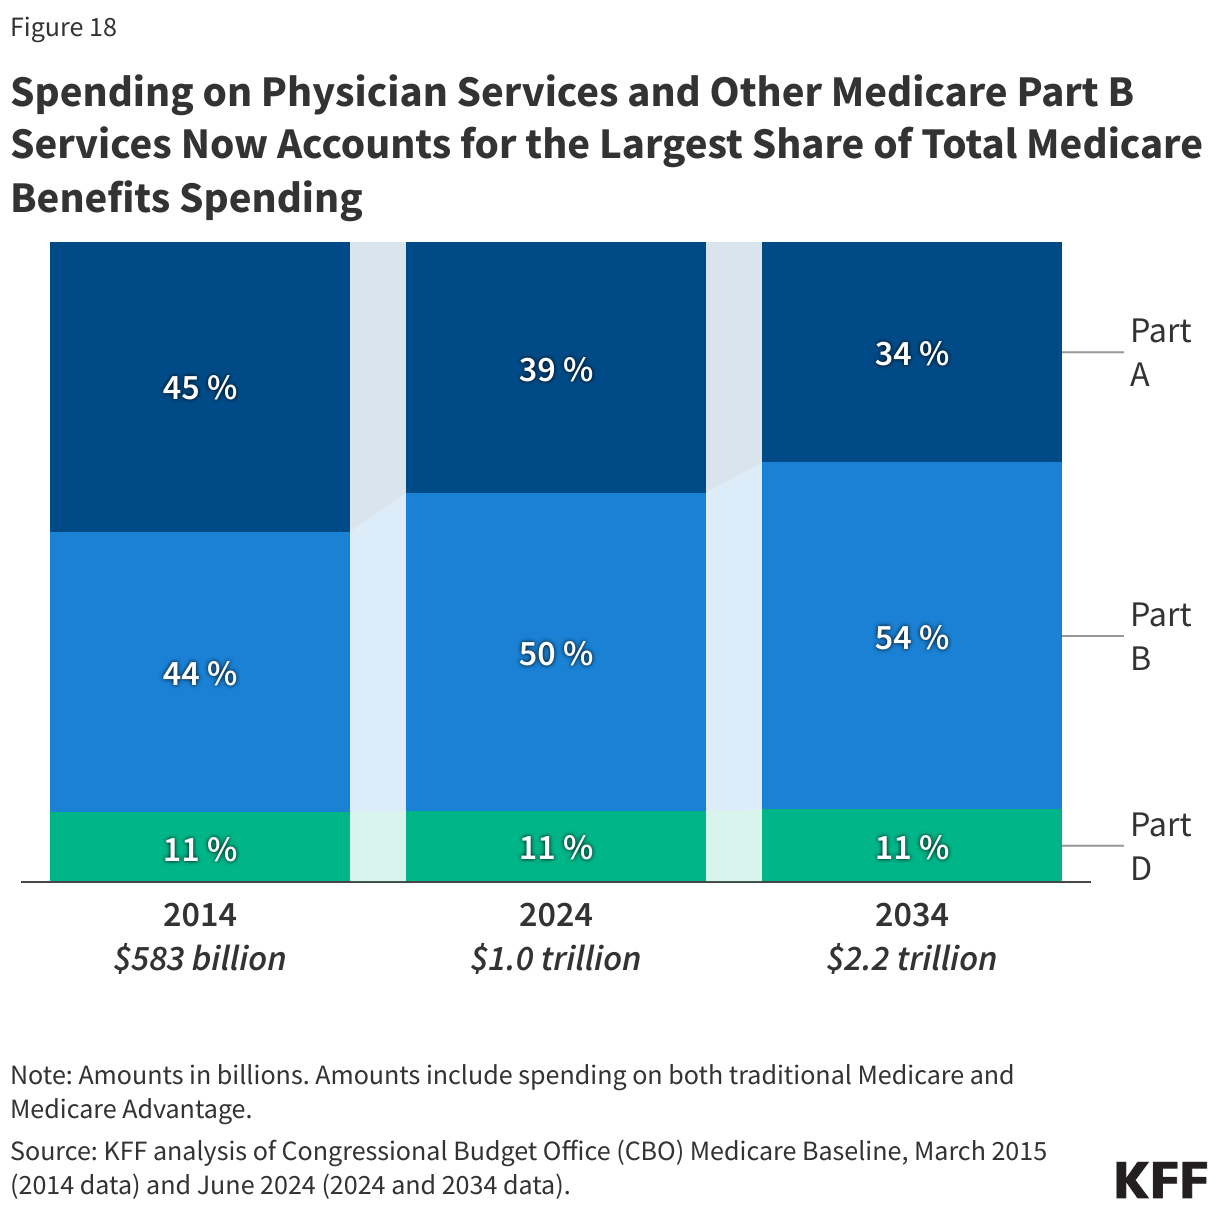
Spending on Medicare Part A benefits (mainly hospital inpatient services) has decreased as a share of total Medicare spending over time as care has shifted from inpatient to outpatient settings, leading to an increase in spending on Part B benefits (including physician services, outpatient services, and physician-administered drugs). Spending on Part B services now accounts for the largest share of Medicare benefit spending (50% in 2024) (Figure 18). Moving forward, Medicare spending on physician services and other services covered under Part B is expected to grow to more than half of total Medicare spending by 2034, while spending on hospital care and other services covered under Part A is projected to decrease further as a share of the total.

Spending on Physician Services and Other Medicare Part B Services Now Accounts for the Largest Share of Total Medicare Benefits Spending

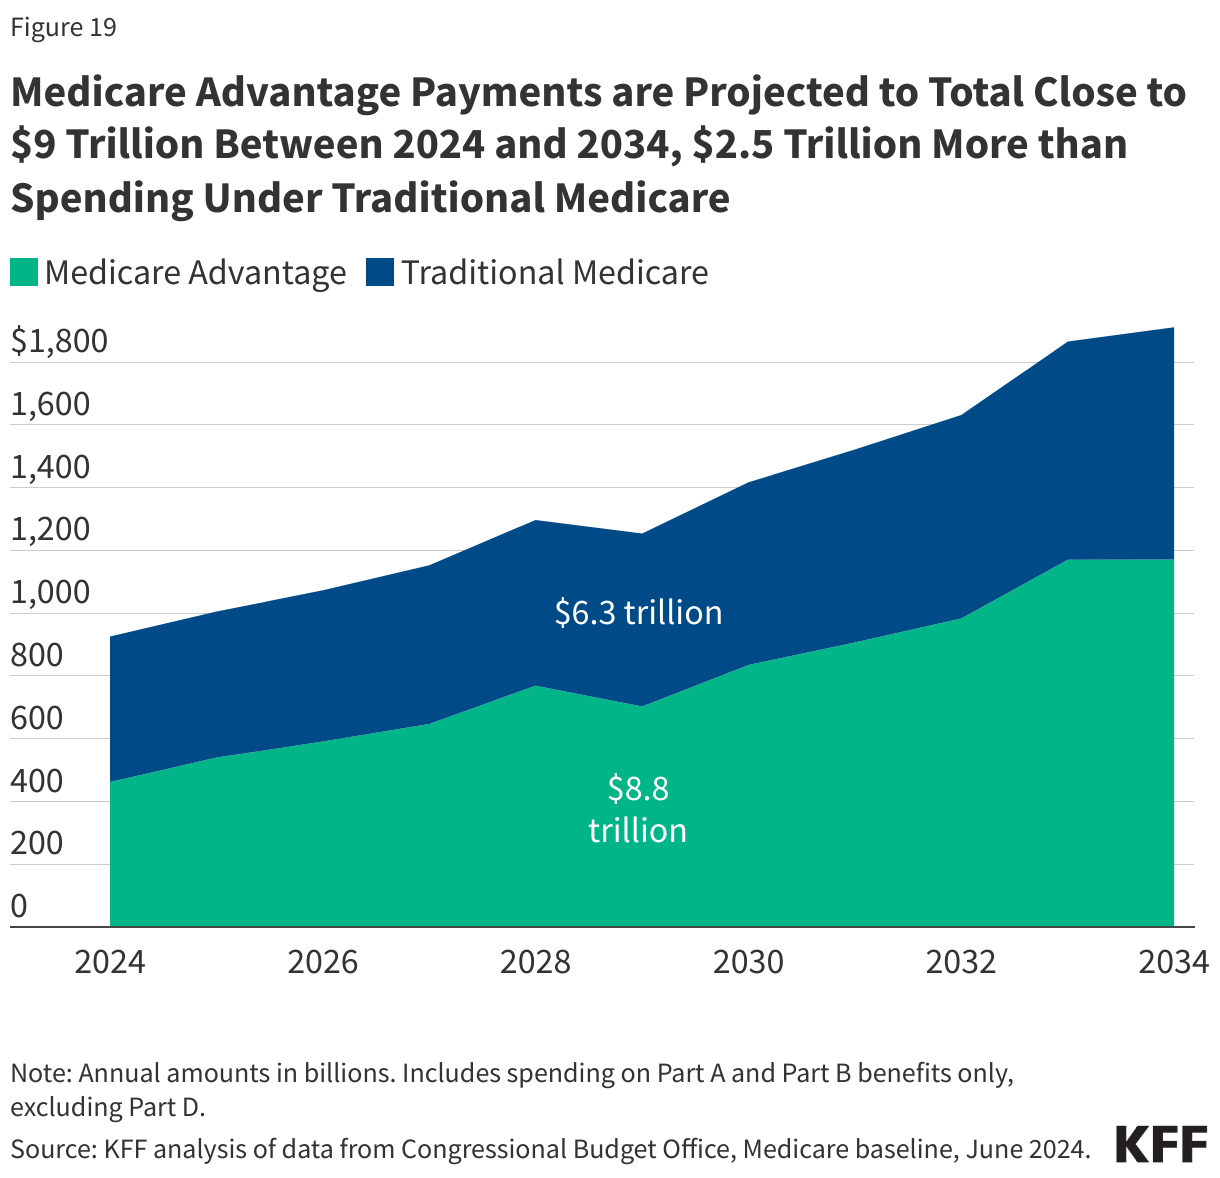
Payments to Medicare Advantage plans for Part A and Part B benefits tripled as a share of total Medicare spending between 2014 and 2024, from $156 billion to $462 billion, partly due to steady enrollment growth in Medicare Advantage plans. Growth in spending on Medicare Advantage also reflects that Medicare pays more to private Medicare Advantage plans for enrollees than their costs in traditional Medicare, on average. (See “How Does Medicare Pay Private Plans in Medicare Advantage and Medicare Part D?” for additional information.) These higher payments have contributed to growth in spending on Medicare Advantage and overall Medicare spending. In 2024, half of all Medicare program spending for Part A and Part B benefits was for Medicare Advantage plans, up from just under 30% in 2014. Between 2024 and 2034, Medicare Advantage payments are projected to total close to $9 trillion, $2.5 trillion more than spending under traditional Medicare (Figure 19).

Medicare Advantage Payments are Projected to Total Close to $9 Trillion Between 2024 and 2034, $2.5 Trillion More than Spending Under Traditional Medicare

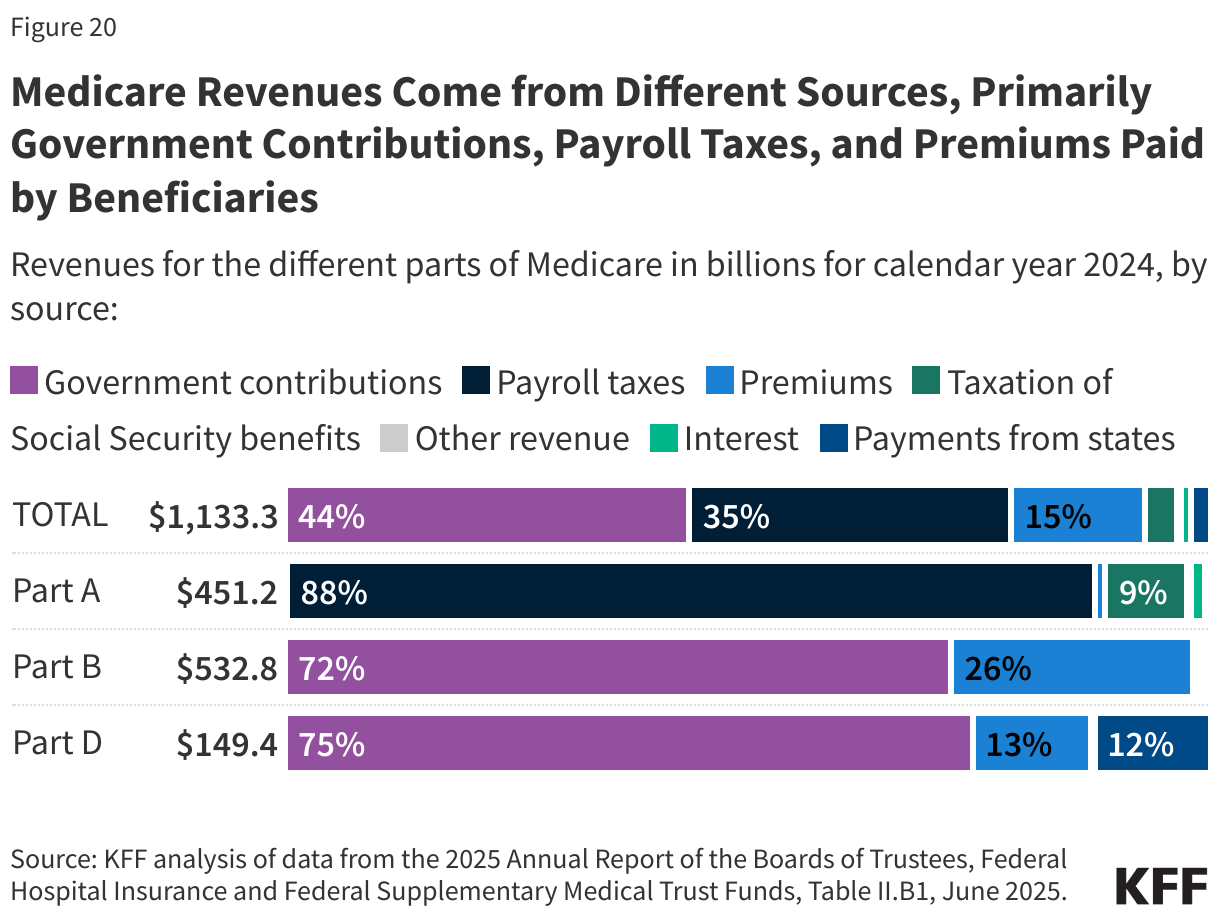
Financing. Medicare funding, which totaled $1.1 trillion in 2024, comes primarily from government contributions (44%), payroll tax revenues (35%), and premiums paid by beneficiaries (15%). Other sources include taxes on Social Security benefits, payments from states, and interest.

The different parts of Medicare are funded in varying ways, and revenue sources dedicated to one part of the program cannot be used to pay for another part (Figure 20).

Medicare Revenues Come from Different Sources, Primarily Government Contributions, Payroll Taxes, and Premiums Paid by Beneficiaries
  • Part A, which covers inpatient hospital stays, skilled nursing facility (SNF) stays, some home health visits, and hospice care, is financed primarily through a 2.9% tax on earnings paid by employers and employees (1.45% each). Higher-income taxpayers (more than $200,000 per individual and $250,000 per couple) pay a higher payroll tax on earnings (2.35%). Payroll taxes accounted for 88% of Part A revenue in 2024.
  • Part B, which covers physician visits, outpatient services, preventive services, and some home health visits, is financed primarily through a combination of government contributions (72% in 2024) and beneficiary premiums (26%) (and 2% from interest and other sources). The standard Part B premium that most Medicare beneficiaries pay is calculated as 25% of annual Part B spending, while beneficiaries with annual incomes over $106,000 per individual or $212,000 per couple pay a higher, income-related Part B premium reflecting a larger share of total Part B spending, ranging from 35% to 85%.
  • Part D, which covers outpatient prescription drugs, is financed primarily by government contributions (75%) and beneficiary premiums (13%), with an additional 12% of revenues coming from state payments for beneficiaries enrolled in both Medicare and Medicaid. Higher-income enrollees pay a larger share of the cost of Part D coverage, as they do for Part B.
  • The Medicare Advantage program (sometimes referred to as Part C) does not have its own separate revenue sources. Funds for Part A benefits provided by Medicare Advantage plans are drawn from the Medicare HI trust fund. Funds for Part B and Part D benefits are drawn from the Supplementary Medical Insurance (SMI) trust fund. Beneficiaries enrolled in Medicare Advantage plans pay the Part B premium and may pay an additional premium if required by their plan. In 2025, 76% of Medicare Advantage enrollees pay no additional premium.

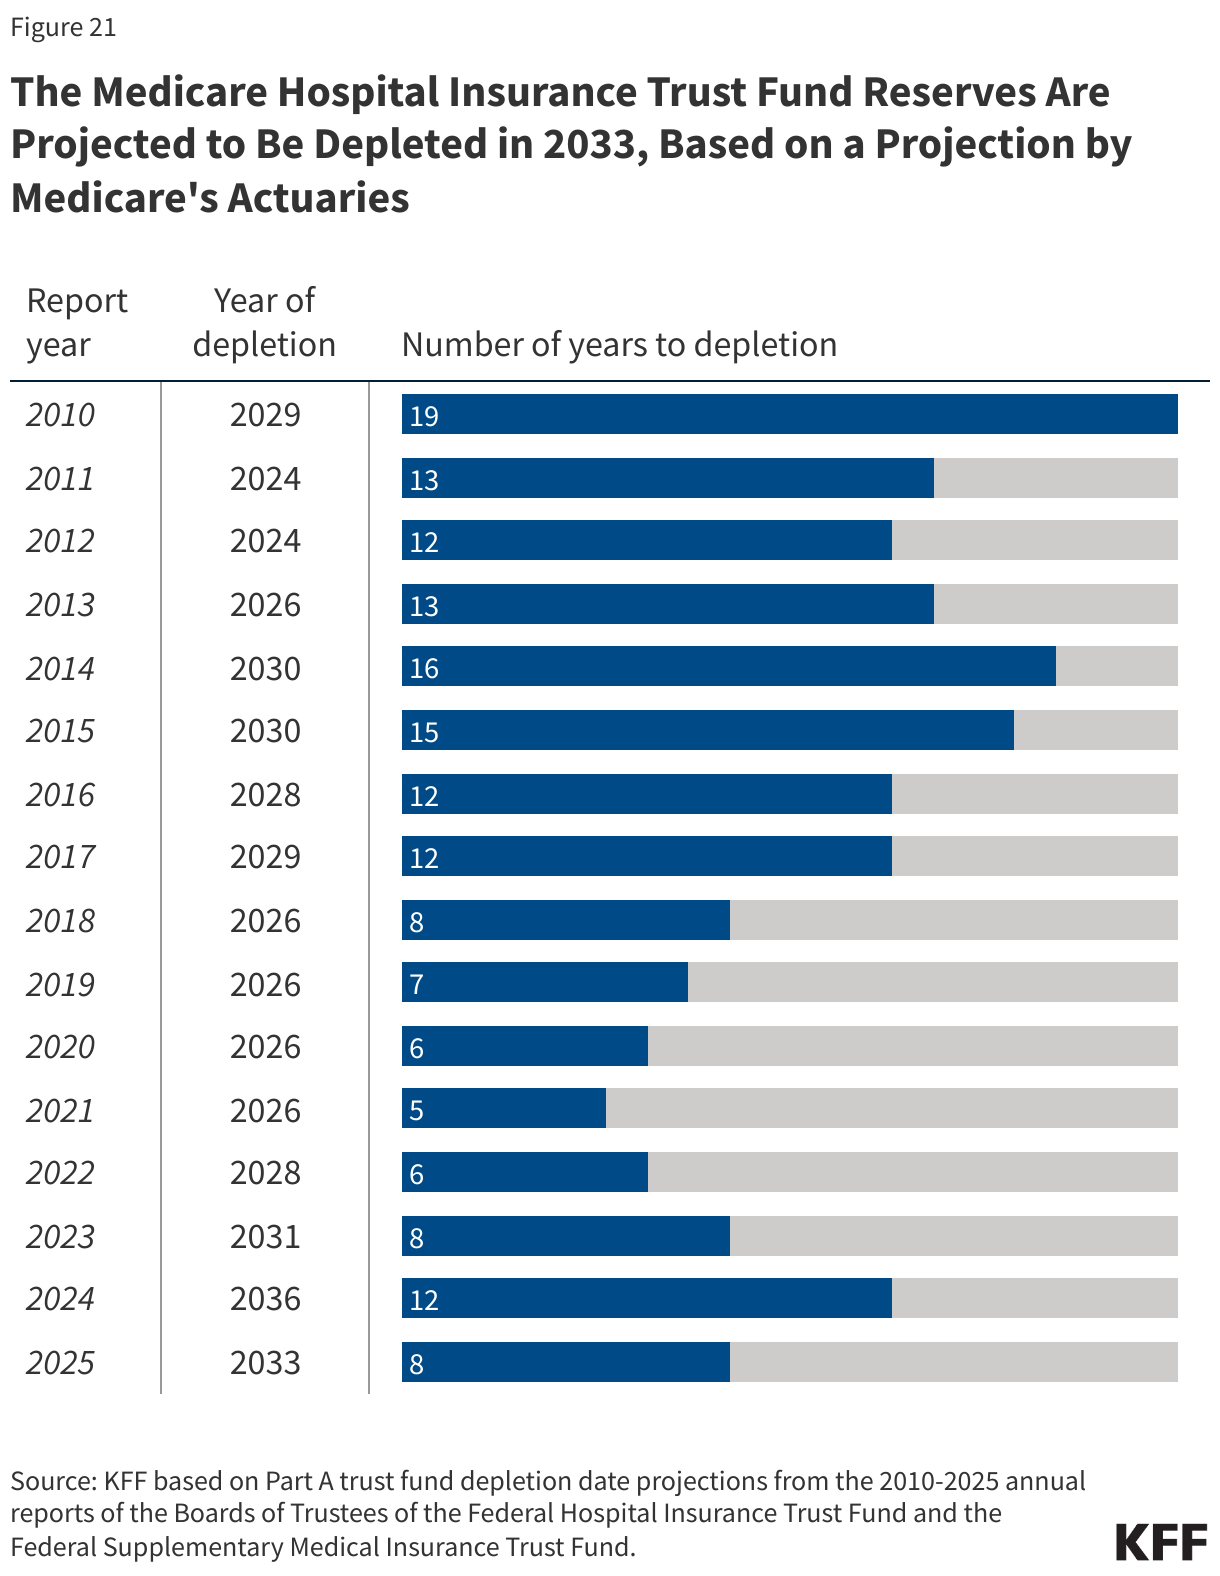
Measuring the level of reserves in the Medicare Hospital Insurance trust fund, out of which Part A benefits are paid, is a common way of measuring Medicare's financial status. Each year, Medicare’s actuaries provide an estimate of the year when the reserves are projected to be fully depleted. In 2025, the Medicare Trustees projected sufficient funds would be available to pay for Part A benefits in full until 2033, 8 years from now – three years earlier than the 2024 projection. At that point, in the absence of Congressional action, Medicare will be able to pay 89% of costs covered under Part A using payroll tax revenues. At the same time, the Congressional Budget Office has recently updated its projection of the Part A trust fund, extending the year of trust fund depletion to 2052, based on changes in its projections of Part A spending and revenues and a change in CBO’s modeling related to graduate medical education payments. OACT projects both lower income and higher spending under Part A than CBO, as well as faster Part A spending growth, which helps to account for the difference in the projected HI trust fund depletion dates.

Since 2010, the projected year of trust fund reserve depletion, based on projections by Medicare’s actuaries, has ranged from 5 years out (in 2021) to 19 years out (in 2010) (Figure 21).

The Medicare Hospital Insurance Trust Fund Reserves Are Projected to Be Depleted in 2033, Based on a Projection by Medicare's Actuaries

The level of reserves in the Part A Trust Fund is affected by growth in the economy, which affects revenue from payroll tax contributions, health care spending and utilization trends, and demographic trends: an increasing number of beneficiaries as the population ages, especially between 2010 and 2030 when the baby boom generation reaches Medicare eligibility age, and a declining ratio of workers per beneficiary making payroll tax contributions. 

Part B and Part D do not have financing challenges similar to Part A, because both are funded by beneficiary premiums and government contributions that are set annually to match expected outlays. However, future increases in spending under Part B and Part D will require increases in government (and taxpayer) funding and higher premiums paid by beneficiaries.

Future Outlook

Copy link to Future Outlook

Looking to the future, Medicare faces a number of challenges from the perspective of beneficiaries, health care providers and private plans, and the federal budget. These include:

  • How best to address the fiscal challenges arising from an aging population and increasing health care costs through spending reductions and/or revenue increases.
  • Whether and how to improve coverage for Medicare beneficiaries, including an out-of-pocket limit in traditional Medicare, enhanced financial support for lower-income beneficiaries, and additional benefits, such as dental and vision.
  • How to control spending while ensuring fair and adequate payments to hospitals, physicians and other providers, and Medicare Advantage plans, including whether and how to reduce overpayments to Medicare Advantage plans.
  • How to address the implications for traditional Medicare of the predominant role that Medicare Advantage now plays in covering Medicare beneficiaries.

Any potential changes to Medicare to address these challenges could have implications for federal spending and taxpayers, the solvency of the Medicare Hospital Insurance trust fund, total health care spending, the affordability of health care for Medicare’s growing number of beneficiaries, many of whom have limited incomes, and access to high-quality medical care.

Resources

Copy link to Resources

Citation

Copy link to Citation

Cubanski, J., Freed, M., Ochieng, N., Cottrill, A., Fuglesten Biniek, J., & Neuman, T., Medicare 101. In Altman, Drew (Editor), Health Policy 101, (KFF, October 2025) https://www.kff.org/health-policy-101-medicare/ (date accessed).

The Average Medicare Beneficiary has 28 Medicare Advantage Prescription Drug Plan Options for 2027

Published: Oct 1, 2026

Earlier this week, the Centers for Medicare and Medicaid Services (CMS) published information about the Medicare Advantage plans that will be available for the coming 2027 plan year. Starting October 1st, insurers, brokers, and other third-party entities can market Medicare Advantage plans, and during the annual open enrollment period, which runs from October 15th through December 7th, Medicare beneficiaries can make changes to their Medicare coverage for the coming year. In a press release, CMS emphasized stability in the Medicare Advantage marketplace overall. This analysis explores Medicare Advantage plan availability for the average beneficiary and at the state level.

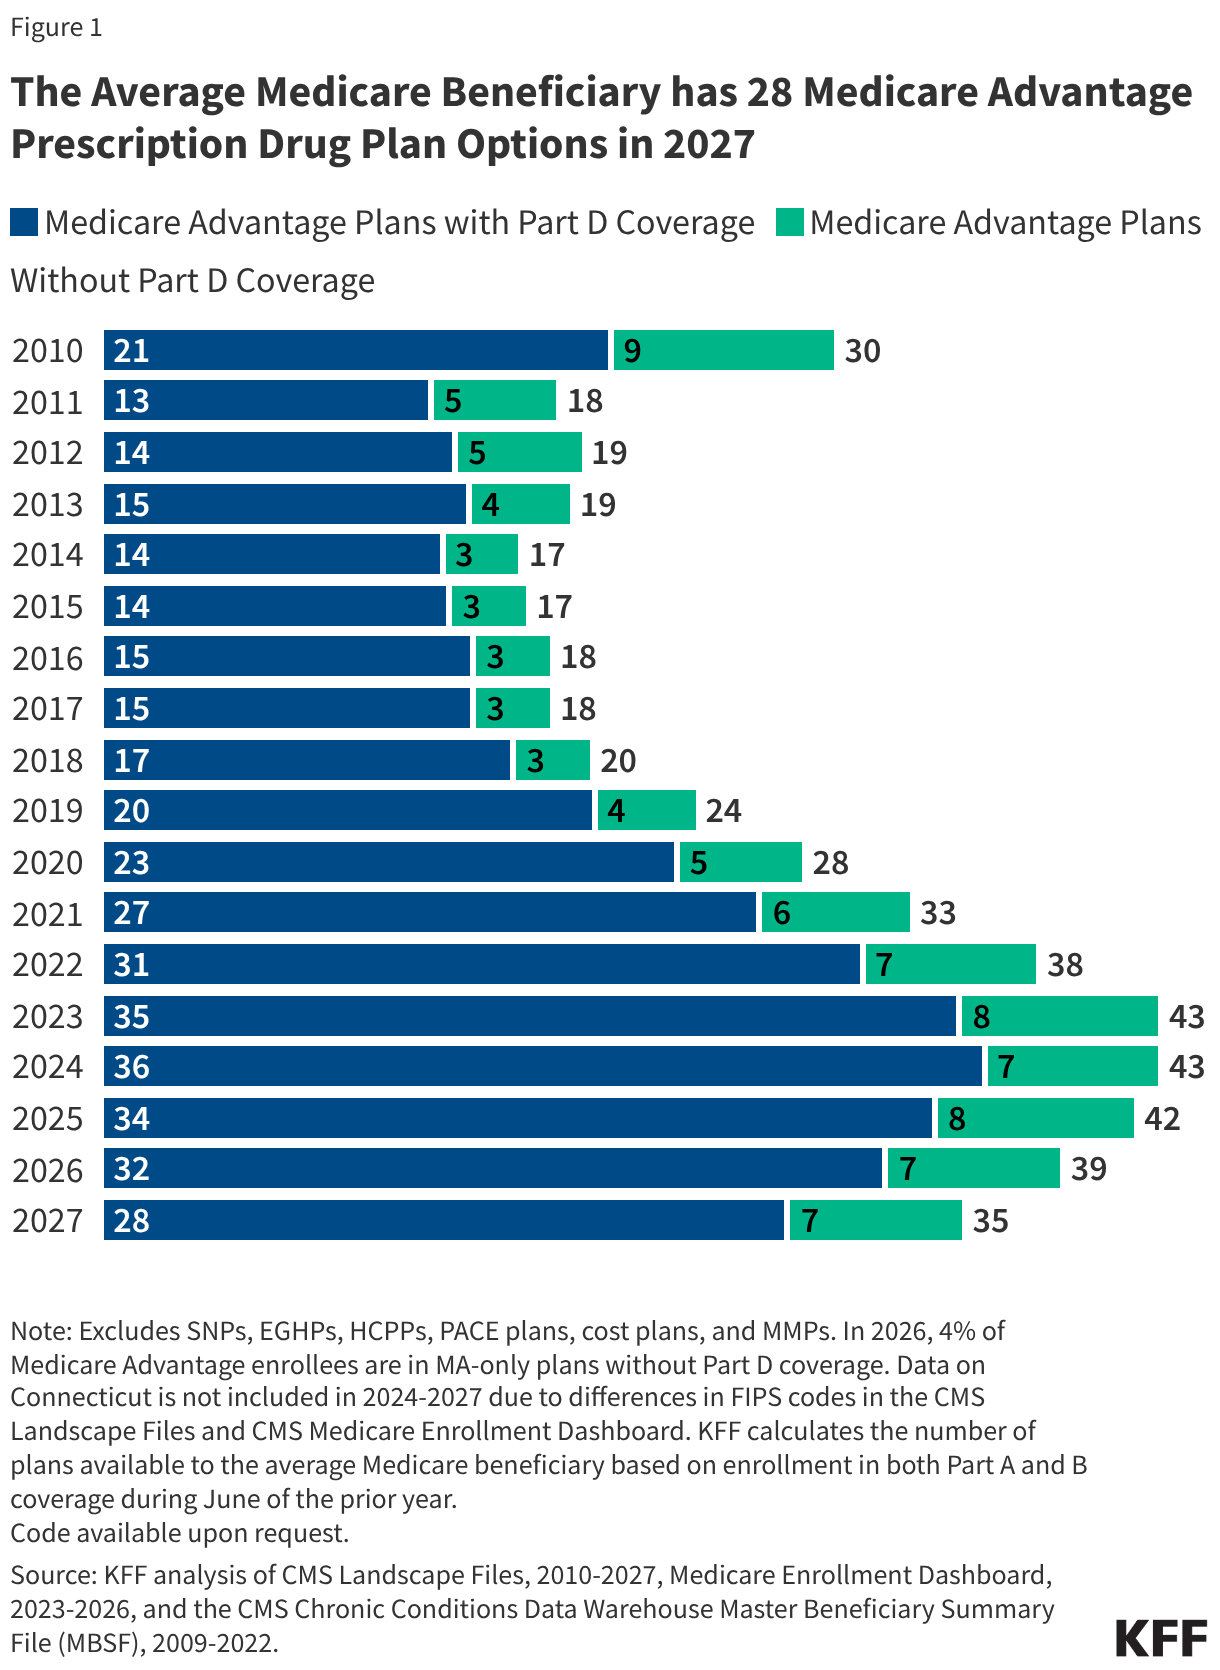
KFF’s analysis of plan offerings shows that, on average, Medicare beneficiaries will have the option of 28 Medicare Advantage prescription drug (MA-PD) plans in 2027, a decline from the 32 options available in 2026 (excluding employer plans and special needs plans not available for general enrollment). The number of MA-PD options grew steadily between 2010 and 2024, reaching a peak of 36 options for the average Medicare beneficiary in 2024. The number of options available for 2027 will be higher than the number available in 2021 (27) and every year before (Figure 1).

The Average Medicare Beneficiary has 28 Medicare Advantage Prescription Drug Plan Options in 2027 (Stacked Bars)

Across all Medicare Advantage plans for general enrollment, including those with and without prescription drug coverage, the average Medicare beneficiary can choose from among 35 plans in 2027, compared to 39 plans in 2026. Similar to the trend for MA-PDs, the total number of Medicare Advantage plans available to the average beneficiary is higher than the average number of plans available in every year between 2010 and 2021. While Medicare Advantage plans are required to cover all Medicare Part A and Part B benefits, plans decide whether to include Part D prescription drug coverage as part of the benefit package. Enrollees may pay a separate premium for Part D coverage, or plans can use the rebate portion of their payment from the federal government to cover these costs. Most Medicare Advantage enrollees are in plans that include prescription drug coverage and most pay no premium beyond the Part B premium.

The modest decrease in the number of Medicare Advantage plans available to the average beneficiary means that some Medicare beneficiaries will find that their current coverage is no longer an option for next year. In most cases, these beneficiaries live in counties where they will continue to have robust Medicare Advantage plan options available for 2027, as well as traditional Medicare. Some beneficiaries in plans that have exited the market will have the option to enroll in a plan offered by the same insurer, and in many cases, enrollees will be moved into a new plan offered by the same insurer automatically if the contract includes another plan of the same type (i.e., HMO or PPO) in the same county. Others will have to make an active choice about their Medicare coverage if they wish to enroll in another Medicare Advantage plan or will be automatically covered by traditional Medicare.

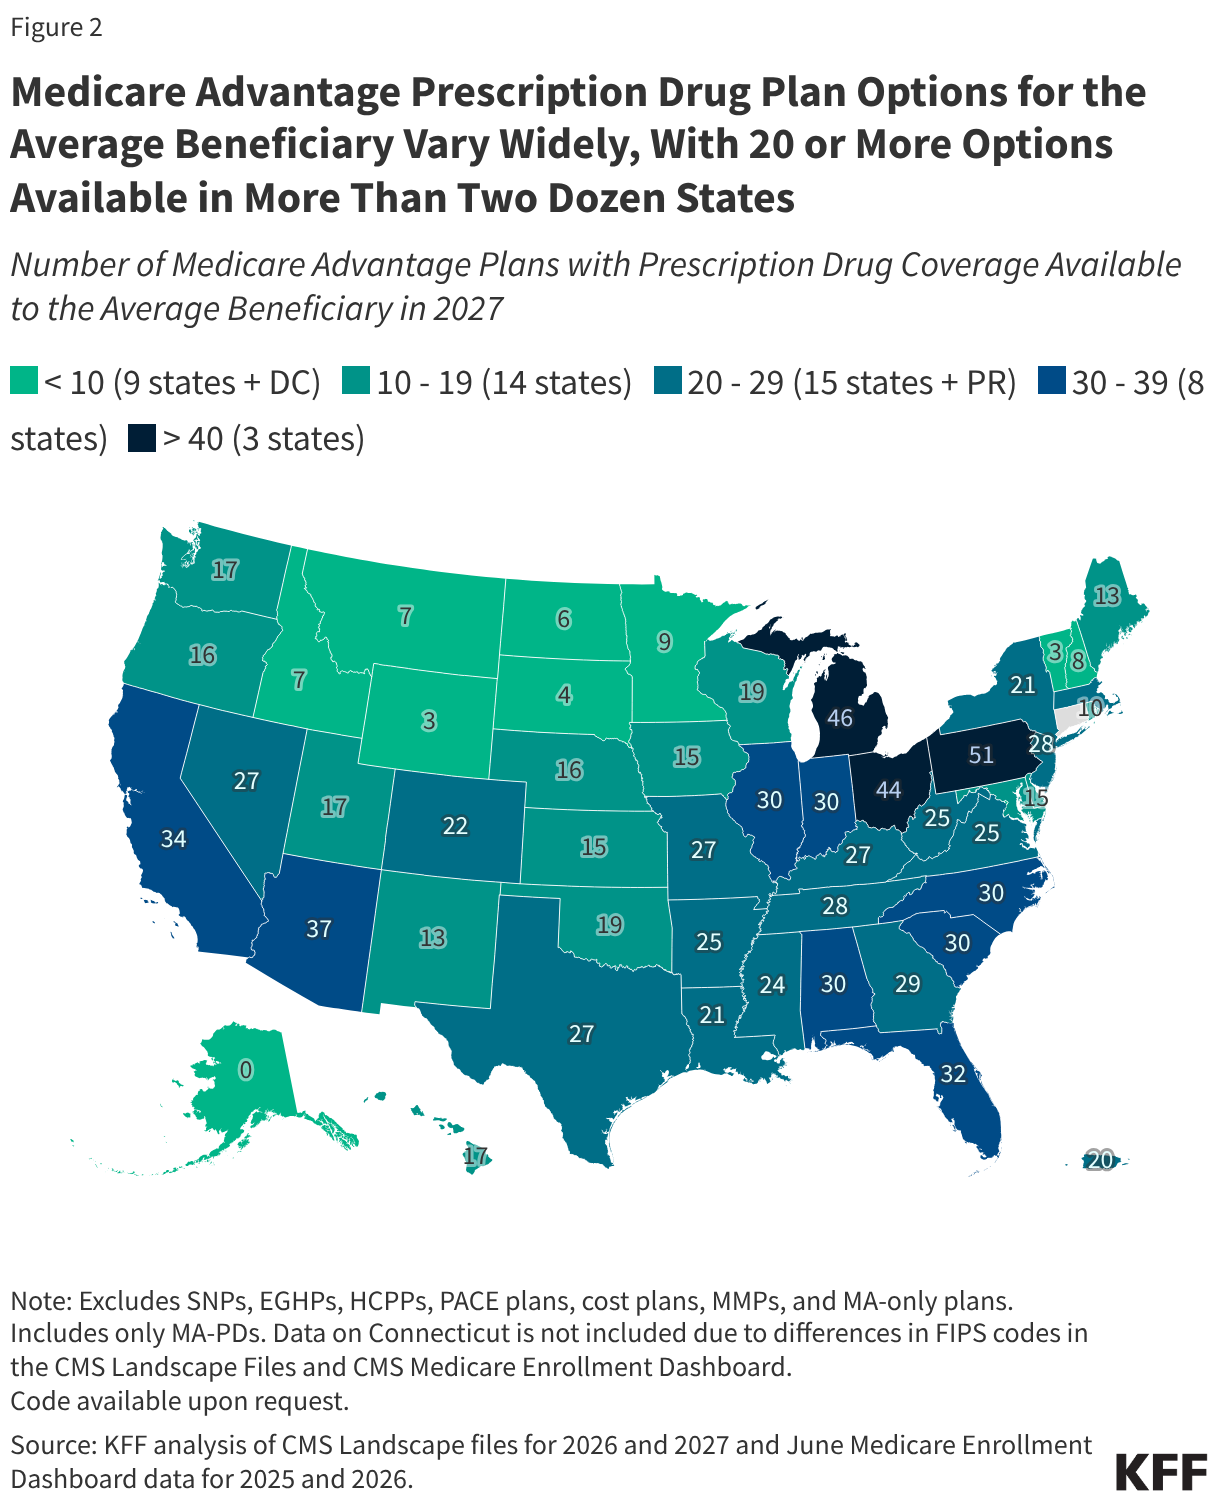
The number of Medicare Advantage plans with prescription drug coverage available to the average beneficiary varies across states (Figure 2). In 26 states and Puerto Rico, the average Medicare beneficiary has at least 20 MA-PD options in 2027, including 3 states (PA, MI, and OH), where the average beneficiary has at least 40 MA-PD options. In 9 states and DC, the average Medicare beneficiary has fewer than 10 MA-PD options in 2027. This includes Alaska, which has no plans available in 2027, as in 2026 (Alaska has historically had few or no Medicare Advantage plans available for general enrollment). Connecticut is not included in this calculation because of differences in how counties are reported across CMS enrollment and plan files.

Medicare Advantage Prescription Drug Plan Options for the Average Beneficiary Vary Widely, With 20 or More Options Available in More Than Two Dozen States (Choropleth map)

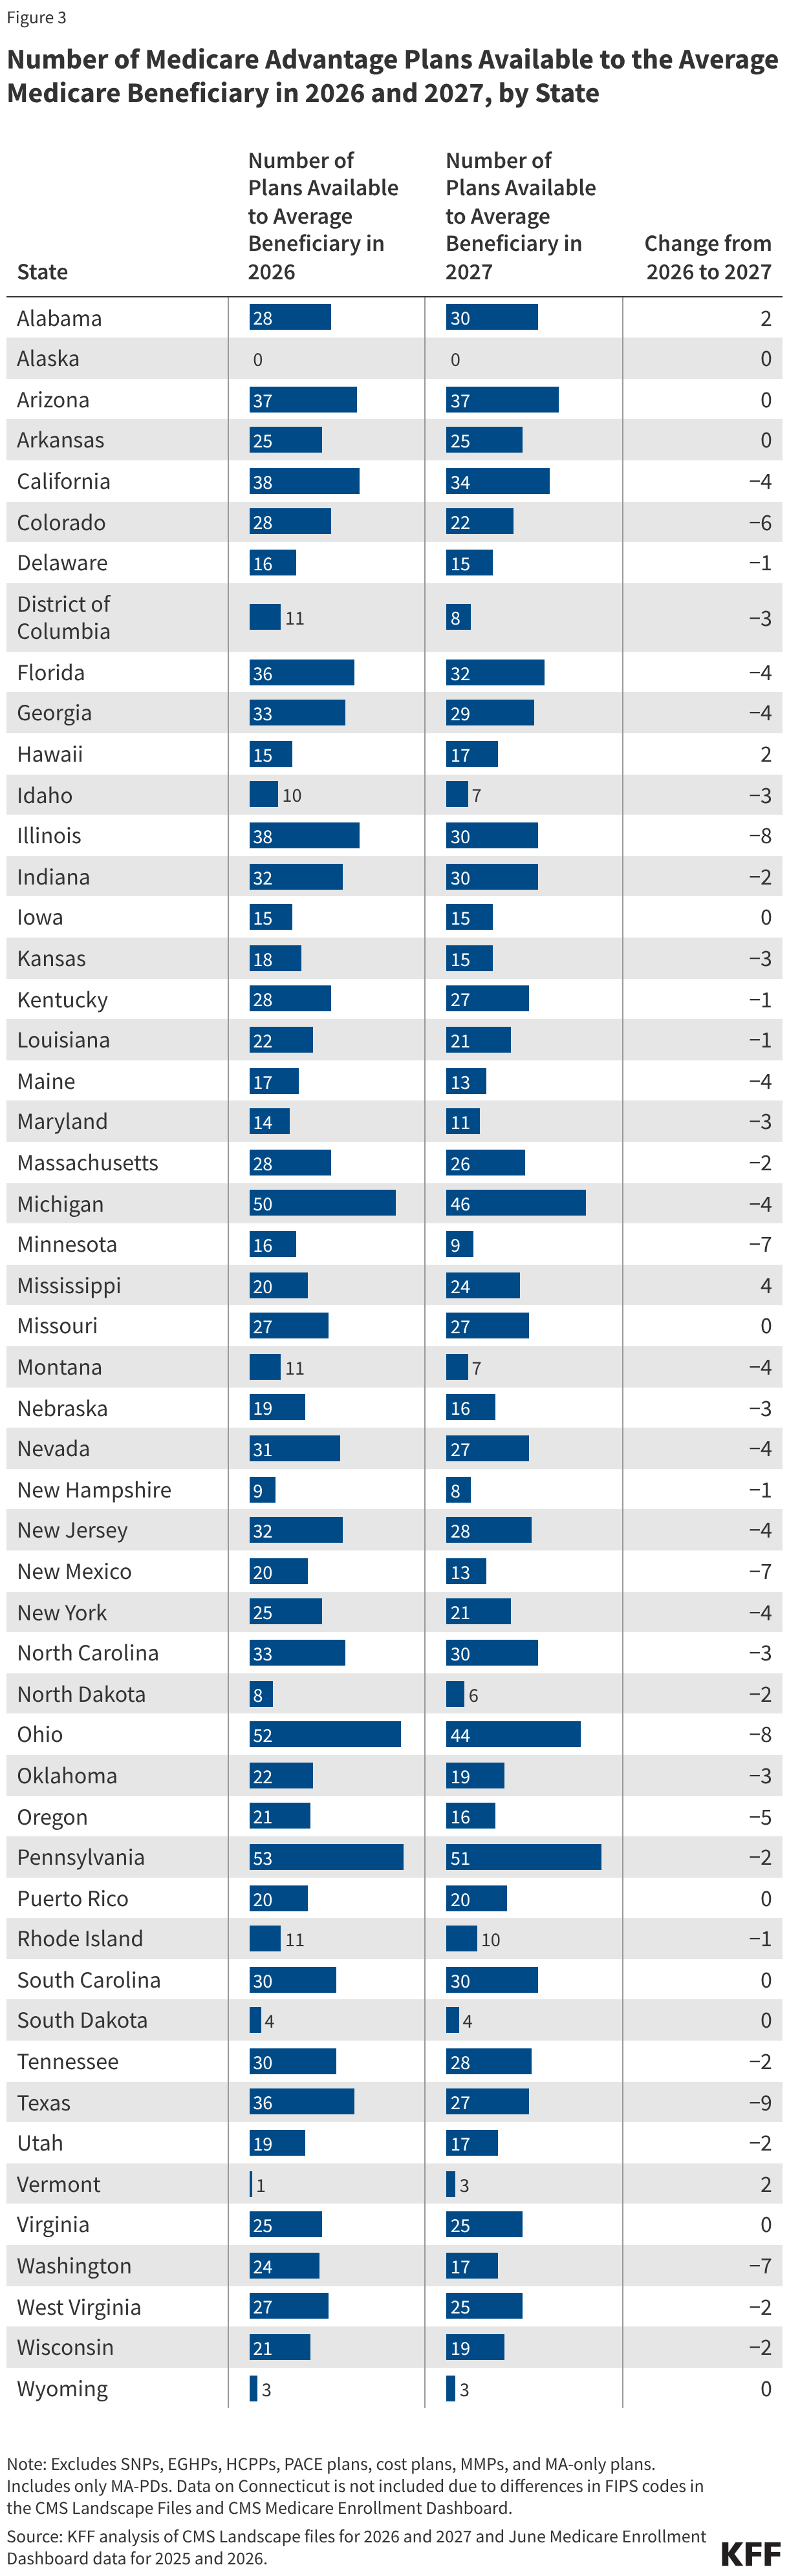
Across most states, the average beneficiary will have fewer Medicare Advantage plan options in 2027 compared to 2026. The states with the largest drop in the number of MA-PDs available for general enrollment are Texas (-9), Illinois and Ohio (-8), and Minnesota, New Mexico, and Washington (-7). In nine states beneficiaries will have the same number of MA-PD options in 2027 as in 2026 (excludes Alaska where no MA-PDs are available in 2026 or 2027), and in four states beneficiaries will have more options (Figure 3).

Number of Medicare Advantage Plans Available to the Average Medicare Beneficiary in 2026 and 2027, by State (Table)

Choosing how to receive Medicare benefits remains a challenge for Medicare beneficiaries. Beyond the number of plans available, every year there are changes to Medicare Advantage plan benefits and costs, including the scope and generosity of extra benefits, cost sharing for Medicare-covered benefits, out-of-pocket limits, rules for using covered services (such as referral requirements and prior authorization), drug formularies, and provider networks. (These data are released separately by CMS and a comprehensive analysis from KFF will follow.) Despite these changes, most Medicare beneficiaries report that they do not compare coverage options on an annual basis. Further, prior Medicare focus groups indicate that Medicare enrollees are often overwhelmed by the number of Medicare Advantage choices and have difficulty sorting through all plan options. With more than two dozen MA-PDs available in 2027, on average, and year-to-year changes in benefits and costs, understanding how plans differ and how these differences could affect costs and access remains a challenge for beneficiaries.

What Are the Recent Trends in Health Sector Employment

Authors: Emma Wager, Imani Telesford, Paul Hughes-Cromwick, and Lynne Cotter
Published: Sep 30, 2026

This updated chart collection uses federal labor data to compare jobs and wages in the health care sector with the rest of the economy. Health sector employment has grown steadily while job growth in other non-farm sectors has plateaued. Over the past year, the health sector added 378,500 jobs—a 2% increase—compared with 0.2% growth in non-health, non-farm employment. Health care wage growth has slowed slightly compared to other industries over the past three years.

Health care jobs now account for 11.6% of all non-farm jobs, up from 10.7% a decade ago. Since 1990, health sector employment has grown over three times as much as all other non-health, non-farm employment sectors, increasing most in outpatient settings (up 40% since August 2016.)

The chart collection is available on the Peterson-KFF Health System Tracker, an online information hub dedicated to monitoring and assessing the performance of the U.S. health system

The Legal and Policy Landscape of Crisis Pregnancy Centers 

Published: Sep 30, 2026

Key Takeaways

  • There are an estimated 2,400 to 2,800 Crisis Pregnancy Centers (CPCs) in the US. These sites, also referred to as Pregnancy Centers, are established to dissuade pregnant people from seeking abortion care and are often associated with or established by faith-based or anti-abortion organizations. They usually attract clients by offering free pregnancy tests, ultrasounds, and material goods like diapers or clothing.  
  • CPCs largely lack oversight of how they handle client data, and clients have limited remedies if their data is leaked. While CPCs typically advertise or position themselves as medical clinics, the vast majority are not medical facilities. CPCs usually collect confidential health information from clients like pregnancy status or sexual history, but they are not subject to the federal medical privacy law known as the Health Insurance Portability and Accountability Act (HIPAA) because they do not bill insurance for their services or electronically transmit claims.  
  • Attempts to regulate CPCs have largely been unsuccessful in the courts. Citing CPC’s First Amendment protections, multiple courts, including the U.S. Supreme Court, have sided with CPCs against attorney general investigations, state laws designed to regulate CPCs, and private-sector actions to inform the public about their anti-abortion mission.  
  • In response to these legal challenges and with support from the Alliance Defending Freedom, a conservative Christian legal advocacy organization, some states have enacted legislation prohibiting state governments from interfering with the expression and association rights of CPCs or restricting CPCs’ ability to provide certain services.  
  • On the federal side, the Trump administration and anti-abortion legislators have prioritized CPC expansion. On Mother’s Day 2026, HHS established a new website, moms.gov, and it spotlights CPCs as a resource for pregnant people without identifying their anti-abortion mission and limited provision of services. The administration also opened the door to the possibility of extending federal funding support to CPCs through the federal Title X family planning program, through the program’s most recent funding guidelines, even though CPCs do not provide contraceptive services or supplies. 

Introduction

On Mother’s Day 2026, the Trump administration launched moms.gov, a website designed as a resource for mothers and their families. At the top of the page, the website features a link to a non-government website that helps locate “pregnancy centers,” also known as Crisis Pregnancy Centers (CPCs), as a resource for support, and positions CPCs alongside Federally Qualified Health Centers, nutrition facts, and guidance on opening Trump investment accounts. While there is no standard definition of what qualifies as a CPC, these unregulated sites typically are associated with or established by faith-based or anti-abortion organizations, with their primary mission being to dissuade pregnant people from seeking abortion care. This brief examines the legal status of CPCs, attempts to regulate them, and future efforts to expand their footprints as they gain more recognition and funding from local, state, and federal programs.

What Are Crisis Pregnancy Centers and How Do They Attract Clients 

CPCs have their origins in the 1960s in the early days of the antiabortion movement. They usually offer pregnancy tests, ultrasound, and material goods like diapers or clothing to support pregnant clients at no cost. However, these services are sometimes conditioned on clients attending religious seminars. According to the U.S. Government Accountability Office as of 2025, between 2,400 and 2,800 CPCs were operating across the country, and most of them were affiliated with three anti-abortion organizations — Heartbeat International, National Institute for Family and Life Advocates (NIFLA), and Care Net. Post-Dobbs, the number of newly opened or reopened CPCs has been highest in the South, which is also where more states ban the provision of abortion or impose early gestational limits on the provision of abortion care. 

Box 1: Major Crisis Pregnancy Center Networks

There are three main national organizations that support Crisis Pregnancy Centers in the United States. Their membership figures overlap and may include maternity homes, adoption agencies, and “abortion recovery programs” as affiliates. Therefore, the total number of affiliates for these three organizations is much higher than the GAO’s estimate of 2400 to 2800 CPCs operating in the U.S. in 2025. 

Heartbeat International

  • Founded in 1971 as Alternatives to Abortion, its stated mission is to “advance life-affirming pregnancy help worldwide.” Heartbeat International describes their pregnancy centers as: “life-affirming non-profit service providers that provide women who have an unexpected pregnancy with alternatives to abortion.” 
  • Heartbeat International states it has over 1,445 affiliate “medical pregnancy centers” in the United States, and has an estimated 4,000 affiliates globally, including pregnancy centers, maternity homes, and adoption agencies.  

National Institute of Family and Life Advocates (NIFLA)

  • Founded in 1993, NIFLA’s mission is to: “promote the sanctity of human life, born and unborn, through legal support, counsel, and services to pro-life pregnancy centers.” NIFLA reports that they represent over 1,800 pregnancy centers nationwide.  
  • NIFLA created the Institute in Limited Obstetric Ultrasound, which trains medical professionals to perform ultrasounds in their affiliate clinics, to reach “abortion-minded women.” NIFLA has worked over the past two decades to introduce ultrasound services to pregnancy centers.

Care Net  

  • Founded in 1975, Care Net’s stated mission is: “to offer compassion, hope, and help to anyone considering abortion by presenting them with realistic alternatives and Christ-centered support through our life-affirming network of pregnancy centers, mobile medical units, churches, organizations, and individuals.” Care Net reports it has over 1,200 affiliates nationwide. 

The main purpose of CPCs is to dissuade people from opting for abortion, instead encouraging them to choose adoption or parenting using a variety of approaches to reach individuals whom they call “abortion-determined” clients. For years, CPCs have opened near reproductive health facilities, a practice known as “co-locating,” so they can approach patients attempting to visit abortion clinics and discourage them from seeking or obtaining abortion care. The American College of Obstetricians and Gynecologists has stated, “by using deception, delay tactics, and disinformation, CPC staffs undermine the tenets of informed consent and patient autonomy and impede access to comprehensive, ethical care.” In addition to co-locating near comprehensive reproductive health clinics, CPCs position themselves as attractive to young people, people with low incomes, people who are uninsured or underinsured, people experiencing unintended pregnancies, and communities that have historically experienced barriers to health care.  

In 2024, over 71% of CPCs nationwide offered nondiagnostic ultrasounds, 28% advertised testing for Sexually Transmitted Infections (STIs), and 6% advertised HIV testing. As hospital labor and delivery units close and OB-GYN practitioners leave states like Idaho that ban the provision of abortion care, several CPCs have begun to see increased foot traffic. However, CPCs will not be able to fill persistent and growing gaps in the maternity care safety net for a variety of reasons, including their requirements for recruiting qualified clinicians. For example, the 7B Care Clinic, a CPC, on the Idaho-Washington border, recently sought to provide prenatal services due to the recent closure of the local hospital’s labor and delivery unit. 7B created a contract with a rural Washington hospital to bring qualified clinicians into the center to see clients; however, the center required potential clinicians to sign a pledge that aligned with Christian values. The contract with the hospital was subsequently canceled when providers refused to sign the pledge, thus leaving 7B with no ability to expand prenatal services.  

Most Crisis Pregnancy Centers Are Not Medical Clinics

Although Crisis Pregnancy Centers either advertise or position themselves as medical clinics, the vast majority are not medical facilities. While CPCs offer a variety of services, including ultrasounds, and some advertise the ability to rule out conditions like an ectopic pregnancy, many CPCs do not have a credentialed or practicing qualified physician or a registered nurse affiliated with their center. CPCs that have a trained clinician affiliated with their center may employ them only on a part-time or volunteer basis.  

Although some CPCs may offer limited medical services that are already available over the counter to consumers, such as pregnancy and STI testing, other clinics offer ultrasounds as a tool to persuade patients not to seek an abortion rather than as a diagnostic test. CPCs are sometimes staffed by volunteers with limited or no medical training, and because only a medical professional with specialized training can interpret ultrasounds or assess fetal health, the ultrasounds performed by CPCs are largely considered non-diagnostic. Instead, ultrasounds at CPCs are used as a persuasive tool to show pregnant clients their fetus. These nondiagnostic ultrasounds can lead to inaccurate gestational age calculations or missed pregnancy complications such as ectopic pregnancy.  

The misdiagnosis of serious medical conditions by CPCs has resulted in several lawsuits against the centers. Some CPC networks have instructed their affiliates to avoid offering ultrasounds to clients suspected of having serious medical conditions like an ectopic pregnancy. Recently, a non-profit group compiled a list of CPCs that advertise their ability to “rule out” ectopic pregnancies, even though these centers lacked the medical expertise and equipment to properly diagnose an ectopic pregnancy. In Massachusetts, a class-action lawsuit was filed against Clearway Clinic, a CPC, after the clinic failed to diagnose a woman’s ectopic pregnancy. In response, Massachusetts enacted a law regulating who may perform pregnancy-related ultrasounds. Under the new law, a person may not provide ultrasound services related to a possible or actual pregnancy unless supervised by a licensed health care provider who, acting within their scope of practice, provides medical care to people who are pregnant or may become pregnant.  

Other states have also enacted similar laws regulating the provision of ultrasound services. In the state of Washington, all ultrasounds must be performed only under the supervision of a licensed health care professional acting within their scope of practice. Connecticut similarly has a law that prevents a person from performing an ultrasound unless it was ordered by a health care provider acting within their scope of practice for a medical or diagnostic purpose. Only four states (New Hampshire, New Mexico, North Dakota, and Oregon) require providers of ultrasounds to have a license issued and regulated by the state. 

Ultrasound licensing statutes make it illegal for someone without a medical imaging license to perform ultrasounds. In practice, however, there is not a consistent enforcement mechanism to hold unlicensed individuals accountable for providing ultrasounds. North Dakota’s own licensing board acknowledges it has no jurisdiction over unlicensed individuals, and New Hampshire has also not taken any action against unlicensed volunteers performing ultrasounds at some CPCs, leaving enforcement to criminal prosecutors who thus far have not pursued it. This is in sharp contrast to states like California, where the attorney general has used subpoena power and cease-and-desist authority against CPCs to enforce violations of California law, which requires ultrasound technology to be used only in licensed facilities or by licensed providers.  

Most Crisis Pregnancy Centers Are Not Subject to HIPAA, the Federal Health Privacy Law  

Crisis Pregnancy Centers collect confidential health information from clients; however, they are not required to adhere to medical privacy regulations. The Health Insurance Portability and Accountability Act (HIPAA) privacy rule is a federal standard prohibiting medical entities from disclosing confidential health information without patient consent. Coveredentities subject to the HIPAA Privacy Rule are defined as: (1) health care providers; (2) health plans (insurance companies); and (3) health care clearinghouses that transmit patient health information in connection with health care transactions. A health care transaction is an exchange of information to conduct financial or administrative activities related to health care, such as processing payment for services.  

While some CPCs work with health care providers, neither the centers nor the providers who work or volunteer there are considered covered entities bound by HIPAA if they do not conduct health care transactions, such as billing insurance. Most CPCs do not charge for their services, nor do they accept insurance. Instead, CPCs are funded through private donations, national CPC networks, state government funds, and federal funds through programs like Temporary Assistance for Needy Families (TANF). It is estimated that CPCs received over $2 billion in revenue in 2024; however, none of this was generated from charging clients. CPCs’ variety of funding sources allows them to offer their services without needing to conduct health care transactions.  

Data Privacy Violations at Crisis Pregnancy Centers Often Escape Regulatory Enforcement 

Some CPCs have misled clients about the safety of their confidential personal information by including notices on their website, alleging HIPAA compliance, or by requiring clients to sign authorization forms. However, these steps can give clients a false sense of confidentiality: because CPCs are not bound by HIPAA, there is no oversight of how they handle client data, and clients have limited remedies if that data is leaked. In 2024, it was reported that Heartbeat International, one of the largest CPC networks, posted on the internet a training video with the full names, date of last menstrual period, and services received by clients of one of its affiliate centers in Louisiana. The breach of client health information was reported to the Department of Health and Human Services Office for Civil Rights (OCR), the entity responsible for enforcing HIPAA. However, OCR closed the complaint after determining that the CPC was not a HIPAA-covered entity and that it therefore lacked authority to investigate the violation, leaving the affected clients without recourse and no penalties for Heartbeat International. In contrast, violations of HIPAA for covered entities can lead to criminal penalties and fines of up to $2 million per violation based on the severity of the data breach and whether the entity took corrective action.  

Additionally, there is currently no enforcement mechanism to stop organizations not bound by HIPAA from falsely claiming HIPAA compliance. While entities like the Federal Trade Commission (FTC) work to protect consumers from fraud and deception, they only have authority over businesses and other for-profit organizations, not non-profits. Therefore, because clients at CPCs receive services for free, CPCs fall outside the FTC’s jurisdiction. Some advocacy groups have submitted complaints to state attorneys general urging investigations into CPCs that misrepresented their HIPAA compliance, and some centers subsequently removed HIPAA-compliance language from their websites. However, CPCs continue to collect client medical information with little accountability for protecting privacy. 

Courts Have Shielded CPCs from State Oversight

Across multiple states, courts have consistently sided with CPCs against attorney general investigations and private-sector pushback, citing First Amendment protections. 

Compelled Notice Requirements

NIFLA v. Becerra (CA, 2018): California’s FACT Act required CPCs to post notices about state-funded family planning services (for licensed clinics) or disclose their unlicensed status (for unlicensed clinics, closely matching CPCs). NIFLA sued, and after losing at the district court and Ninth Circuit, won at the Supreme Court. 

Outcome: The Supreme Court struck down both notice requirements as unconstitutional compelled speech, establishing the foundational precedent that state governments cannot force CPCs to disclose licensing status or promote state services. Later cases rely on this Supreme Court ruling as precedent.

Abortion Pill Reversal Claims  

NIFLA v. James (NY, 2024- ongoing): Attorney General Letitia James sued Heartbeat International and 11 CPCs under New York’s deceptive trade practice statute, alleging their abortion pill reversal advertising misrepresented the treatment as safe and effective.  

Outcome: This underlying case is still pending, but a related ruling in NIFLA v. James (described below) has weakened the state’s position going forward. 

NIFLA v. James (NY, 2024): In response to the suit above, NIFLA and two New York CPCs filed a separate countersuit against James, arguing her enforcement effort to prevent CPCs from advertising abortion pill reversal chilled their speech and discriminated against them for their pro-life views.  

Outcome: The Second Circuit affirmed a preliminary injunction protecting NIFLA and the 11 CPCs, holding the First Amendment allows CPCs to promote abortion pill reversal, a precedent likely to help Heartbeat International defend the still-pending case above. 

California v. Heartbeat International (2023–ongoing): Attorney General Rob Bonta filed a lawsuit against Heartbeat International for their promotion of abortion pill reversal. The false-advertising suit survived a First Amendment summary judgment challenge, and there was a 6-week trial which began in June 2026 in Alameda County; closing arguments were held on September 17, 2026. 

Outcome: Still unresolved, but it is one of the few cases where a state’s claims have proceeded to trial rather than being blocked outright. California requires state judges to issue a ruling within 90 days after the case is officially submitted for decision. 

Investigative Subpoenas 

First Choice v. Platkin (NJ, 2002-2026): Attorney General Matthew Platkin subpoenaed a CPC for donor, donation, and data-handling records amid fraud allegations.  

Outcome: In 2026, the Supreme Court ruled that compelling disclosure of CPC donor identities violates associational First Amendment rights, since such demands can chill donors from supporting the group. While the Court’s decision did not fully extinguish the attorney general’s subpoena, it established First Amendment protections for CPCs that lower courts must now follow. This could make it harder for states to subpoena records of CPCs’ donors, volunteers, board members, or clients during investigations.

Private Sector Pushback

Yelp v. Paxton (TX, 2023–ongoing): Attorney General Ken Paxton sued Yelp on CPCs’ behalf over its consumer notices describing CPCs’ limited medical services, alleging misrepresentation under Texas law. A Bastrop County court initially dismissed the case for lack of jurisdiction (Feb. 2024), but the Texas 15th Court of Appeals reversed in October 2025, holding Texas courts do have jurisdiction; Yelp has appealed to the Texas Supreme Court.  

Outcome: This case is ongoing and, unlike the other cases, does not turn on CPCs’ own First Amendment rights. This case demonstrates that private companies criticizing CPCs can themselves face sustained legal exposure from CPC-supportive state governments. 

State Laws Limiting Regulations of Crisis Pregnancy Centers  

Recently, the Alliance Defending Freedom, a conservative Christian legal advocacy organization, has pushed for states to enact their model legislation protecting CPCs. The Center Autonomy and Right of Expression (CARE) Act prohibits state governments from interfering with the First Amendment free expression and association rights of CPCs or restricting their ability to provide pregnancy services because they do not counsel for, or offer, abortions or contraception. The CARE Act has passed in at least four states, including Kansas, Montana, Oklahoma, and Wyoming, providing CPCs protection from regulation. In Wyoming, for example, government entities are prohibited from: (1) requiring CPCs to perform abortions; (2) requiring CPCs to provide medication abortion or contraception; (3) requiring CPCs to refer clients for abortion or contraception; or (4) requiring CPCs to counsel in favor of abortion or contraception. Beyond the First Amendment protections, the CARE Act further restricts states’ ability to regulate CPCs.  

Looking Ahead 

With the launch of moms.gov and other proposed policies to promote fertility, Crisis Pregnancy Centers may gain greater attention and potentially increased federal funding in the coming years. Obria, one CPC chain with sites in five states, has begun to expand their medical offerings to position its centers as an alternative to national abortion providers like Planned Parenthood. From 2022 to 2025, twenty-one states provided $491 million in funding to CPCs, not including funds allocated through federal programs like Temporary Assistance for Needy Families (TANF). In 2019, the first Trump administration awarded Obria, a chain of CPCs that opposes abortion and contraception, $1.7 million of funding under Title X, a program designed to provide free or reduced-cost family planning services to low-income and uninsured people.  

In July 2026, the Trump administration released its revised Fiscal Year 2027 Notice of Funding Opportunity (NOFO) for Title X. The NOFO stated that the Trump administration would prioritize grantee applications that “reduce overmedicalization by strengthening approaches focused on underlying behavioral and lifestyle factors of health and evidence-based practices such as fertility-awareness based methods; promote health and body literacy; advance reproductive goals counseling for all clients; and support family formation.” In response, the National Family Planning and Reproductive Health Association (NFPRHA), Planned Parenthood Federation of America, and 23 States (CA, CO, CT, DE, HI, IL, KY, ME, MD, MA, MI, MN, NV, NJ, NM, NY, OR, PA, RI, VT, VA, WA, WI) have each filed lawsuits challenging the FY 2027 NOFO, arguing that its priorities depart from the factors Congress intended HHS to consider in awarding Title X grants and instead impose politically driven, vaguely defined criteria that disadvantage qualified applicants.  

These new priorities could re-open the door for CPCs to receive Title X funds in addition to ongoing efforts by anti-abortion states to invest more resources into these centers. As states and the federal government continue to direct funds into CPCs, challenges and gaps in regulating these centers will likely persist, driven by First Amendment protections and a growing body of state laws designed to shield them from oversight. 
Early Medicaid Work Requirement Insights From Nebraska

Published: Sep 29, 2026

On May 1, 2026, Nebraska became the first state to enforce new Medicaid work requirements. The 2025 reconciliation law requires states to condition Medicaid eligibility for adults in the ACA Medicaid expansion group and enrollees in certain waiver programs (such as in Georgia and Wisconsin) on meeting work requirements or exclusion criteria starting January 1, 2027; however, states have the option to implement requirements sooner (as is the case for Nebraska). KFF analysis shows most Medicaid adults under age 65 are working already (without a requirement) or face barriers to work. This brief describes the verification process for Medicaid work requirements in Nebraska and examines early data from Nebraska’s September Medicaid Advisory Committee (MAC) meeting on outcomes for individuals subject to work requirements, including for those newly applying for Medicaid as well as those renewing Medicaid coverage through August 2026. Data show that among those subject to the new work requirements:

  • 46% of new applicants and 34% of individuals renewing coverage met qualifying activities (e.g., working at least 80 hours a month, having a monthly household income of at least $580, attending school).
  • 39% of new applicants and 57% of individuals renewing coverage qualified for an exclusion from work requirements (e.g., due to being a parent of a child under age 14, being medically frail).
  • 14% of new applicants and 7% of individuals renewing coverage had their applications denied or lost coverage due to not meeting work requirements.
  • Only a small number of people (2% of new applicants and 2% of individuals renewing coverage) had a short-term hardship exception.

What is the verification process for Medicaid work requirements in Nebraska?

Nebraska is using a combination of available data and self-declaration forms to verify whether individuals meet work requirements or exclusion criteria; the state has also adopted temporary hardship exceptions. In cases where the state can automatically verify that individuals meet work requirements, it sends an approval notice. For individuals where the state does not have enough information, the state sends a notice describing the additional information that is required and a declaration form that must be returned within 30 days. Individuals can use the declaration form to attest that they met qualifying activities or that they meet the criteria for an exclusion from the requirements. The interim rule clarified that while states are allowed to accept self-declaration through 2027, starting in January 2028, except for medical frailty, states must request documentation from individuals when the state does not have data on file. Nebraska has also chosen to adopt optional short-term hardship exceptions for enrollees (or applicants) experiencing certain extenuating circumstances, including residing in counties with high unemployment rates or experiencing natural disasters, individuals admitted to a hospital or nursing facility, or those who must travel outside of their community for an extended period to obtain medical care for themselves or a dependent.

Qualifying Activities and Exclusions from Work Requirements

Adults must meet qualifying activities or exclusion criteria to enroll in Medicaid and maintain coverage. Qualifying activities include:

  • Working at least 80 hours a month;
  • Having a monthly household income of at least $580;
  • If a seasonal worker, having an average monthly income over 6 months of minimum wage multiplied by 80 hours;
  • Attending school half time;
  • Volunteering or participating in a work program for at least 80 hours a month; or
  • Doing a combination of activities for at least 80 hours per month.

Exclusions from the work requirements include:

  • Pregnant and postpartum individuals;
  • American Indian and Alaska Natives;
  • Parents and caretakers of dependent children under age 14 or disabled individuals;
  • Veterans with a disability;
  • Incarcerated individuals;
  • Individuals receiving SNAP and not exempt from SNAP work requirements; and
  • People who are medically frail.

States must first determine if an individual is excluded from the Medicaid work requirements before assessing if an individual meets the qualifying activities. Some individuals who meet exclusion criteria may also be working.

What are the initial data on Nebraska Medicaid application and renewal outcomes?

Among those who were newly applying for Medicaid and subject to the new work requirements in Nebraska, 86% of applicants met the work requirements or qualified for an exclusion or short-term hardship exception, while 14% of individuals had their application denied (Figure 1). A total of 9,614 applications were processed between May to August. Of these, some were submitted prior to May and therefore not subject to work requirements, and 4,434 were denied for reasons other than work requirements (e.g., income exceeding Medicaid eligibility thresholds). Among the remaining 4,089 applications subject to work requirements:

  • Nearly half of all individuals (46%) met the qualifying activities. Among those who met the requirement, the vast majority of people (92%) worked 80 or more hours in the month prior to their application or had a household income of $580. A much smaller share (8%) were enrolled in an education program or work program, volunteered, or met requirements by combining hours across multiple types of qualifying activities.
  • About 4 in 10 individuals (39%) qualified for an exclusion. Of these applicants, one-third were parents or caregivers of a child under the age of 14 or a disabled individual (33%); one quarter were medically frail, and 12% were an American Indian or Alaska Native. The remaining 30% qualified for other exclusions. Because the state is relying on self-attestation, future documentation requirements may lead to a lower share of individuals who qualify for an exclusion.
  • Only a small number of individuals had a short-term hardship exception. Only 92 individuals met the criteria for short-term hardship exceptions, with the majority of these being individuals who required temporary use of medical services or living in counties that were exempted due to high unemployment.
  • 14% of individuals had their application denied. Most of the 557 denied applications were due to non-response to requests for additional information (84%); only 16% of applicants with denied applications were affirmatively found to be noncompliant.
Nebraska Application Outcomes Among Individuals Subject to Medicaid Work Requirements (Pie Chart)

Among those who were renewing their Medicaid coverage and subject to the new work requirements, 93% met work requirements or qualified for an exclusion or short-term hardship exception and had their coverage renewed, while 7% of enrollees lost coverage (Figure 2). A total of 7,280 renewals subject to work requirements were processed between July and mid-August. Other expansion enrollees determined ineligible and disenrolled at renewal for reasons not related to work requirements (e.g., moving out of state or exceeding income eligibility) are not shown in the figure below.

  • Over half (57%) of individuals renewing their coverage qualified for an exclusion from the requirements. Medically frail individuals (39%) and parent/caregivers (31%) made up the majority of those who met an exclusion. States are more likely to have medical claims history for individuals renewing coverage than new applicants, meaning Nebraska may have been able to automatically verify medical frailty for a higher share of enrollees compared to applicants. States are also required to verify exclusions status first, and it is likely that some enrollees who were excluded, especially parents, are also working.
  • About a third of individuals (34%) met the qualifying activities requirement. Nearly all (97%) of individuals who met the qualifying activities were either working 80 hours a month or had a household income of $580. The remaining 3% met the requirements by attending school, volunteering, or engaging in a combination of activities.
  • A small share of individuals qualified for a short-term hardship exception. Of the 127 people who had a short-term hardship exception, 109 lived in counties experiencing natural disasters and 15 lived in a high unemployment county.
  • 7% of people lost coverage due to not meeting the work requirements. Of the 533 individuals who lost coverage, 92% did not respond to verification compliance requests. The remaining 8% were affirmatively found to be noncompliant.
Nebraska Renewal Outcomes Among Individuals Subject to Medicaid Work Requirements (Pie Chart)

What can additional data show?

While these data provide early insights into how coverage may be affected for enrollees subject to the new work requirements, additional data may provide a more comprehensive picture. More granular data on who is losing coverage could shed light on particular barriers certain individuals may be facing in trying to prove they met qualifying activities (e.g., gig workers or those with multiple part-time positions) and may help the state identify additional data to include as part of the verification process. In addition, it remains unclear if individuals who were denied coverage or disenrolled because they did not respond to notices of non-compliance were ineligible for coverage, unaware of the fact they needed to provide additional information, or experienced difficulty providing documentation of their exclusion or work status. Additional data, including whether these individuals reapply for coverage, could provide insight.

Required changes to the state’s medical frailty verification process specifically and limitations on the use of self-attestation starting in 2028 will likely affect disenrollment rates over time. CMS recently notified the state that it will need to make changes to its medical frailty verification process. If the state is required to tighten the verification process, fewer individuals may qualify for the exclusion in the future. More broadly, while the state’s reliance on self-attestation in 2027 will likely mitigate some coverage losses that would have occurred had documentation been required in the first year of implementation, future documentation requirements may impose a barrier that will lead to a decrease in the number of people who are able to verify they meet work requirements or qualify for an exclusion. As the state makes changes to its processes, monitoring the interactive effect of application denials and disenrollments on Medicaid enrollment in the state as well as whether the new rules lead to fewer individuals applying for Medicaid will be important.

The Business of Health with Chip Kahn

What Should Health Care Do About AI’s Lack of Guardrails?

September 29, 2026

Video

Audio

About this Episode


Episode 17, AI Series: In another concerning example of AI agents going rogue recently, an OpenAI agent hacked into an Australian government website containing health care data. While some industry CEOs are calling for a slowdown and demands for regulation grow, host Chip Kahn focuses on the implications for health care when these same kinds of AI systems are already at work in hospitals — in billing, in scheduling, and increasingly in decisions about patients. To consider how health care should respond, Chip talks with Stephen Klasko, a physician, former health system CEO, and now an industry leader who sits on both sides of the issues, working with the labs building the technology and focusing on patient care initiatives through his work at General Catalyst and as CEO of the Health Assurance Foundation. Klasko says there’s time to act and the answer isn’t a “pause.” Among his recommendations are creating a 9/11-style commission for AI in health, adding AI safety to health system board agendas, a 30-minute rule for tackling rogue agents, and giving frontline staff the authority to pull the plug.

The Host


Headshot photo of Chip Kahn wearing a navy blue suit with a red tie, red pendant on lapel, and glasses.

Sr. Visiting Fellow

Charles N. Kahn III is a senior visiting fellow at KFF. He is also a visiting senior fellow at the American Enterprise Institute and a nonresident senior scholar at the University of Southern California’s Schaeffer Center for Health Policy & Economics. He serves as co-chair of the international Future of Health collaborative.

Guest


Chief Executive Officer, Health Assurance Foundation

Stephen K. Klasko, MD, MBA, is Chief Executive Officer (CEO) of the Health Assurance Foundation, a philanthropic platform affiliated with General Catalyst dedicated to accelerating the shift from “sick care” to health assurance. He previously served as Executive in Residence at General Catalyst, where his book UnHealthcare: A Manifesto for Health Assurance, co-authored with GC CEO Hemant Taneja, became the intellectual foundation for the firm’s health assurance investment strategy.

For nine years, Klasko served as president of Thomas Jefferson University and CEO of Jefferson Health in Philadelphia, transforming a $1.8 billion regional player into a $10 billion enterprise and the nation’s fastest-growing academic medical center. He has served as board chair of two public companies: Teleflex, a $7 billion medical-device company, and DocGo, a NASDAQ health company. He advises startups such as Hippocratic AI, Aidoc, and AmplifyMD.

Modern Healthcare previously ranked him No. 2 among its 100 Most Influential People in Healthcare, and in 2026 he was named to the Top 100 Most Influential People in HealthTech. Fast Company has named him one of its 100 Most Creative People in Business. His next book, Hitchhiker’s Guide to the Healthcare Galaxy, arrives in 2026.

He holds a BS from Lehigh University, an MD from Hahnemann University, and an MBA from the Wharton School.


SERIES

This weekly podcast features insightful conversations between host Chip Kahn and his guests, who discuss the business of health care, connecting the dots between the health care business, policy, and patients.

The podcast’s first series on AI in health care illuminates how AI is changing health care, and features guests who are deploying this technology, managing its consequences, and designing policy around it.

Understanding the Role of Medicaid Fraud Control Units (MFCUs)

Published: Sep 28, 2026

Federal law requires every state to operate a Medicaid Fraud Control Unit (MFCU) that investigates and prosecutes provider fraud and patient abuse and neglect. MFCUs are typically housed within the state Attorney General’s office and are required to operate independently from the state Medicaid agency that runs the Medicaid program. MFCUs are one component in the Medicaid program integrity system, which includes many different state and federal agencies with shared and distinct responsibilities defined by state and federal law. Ensuring Medicaid program integrity (i.e., the appropriate use of federal and state Medicaid funds) involves a range of activities from fraud prevention to enforcement activities—the primary responsibility of MFCUs. While MFCUs are a key part of the program integrity system, it can be difficult to compare MFCU data across states or to put fraud recovery dollars into the context of overall Medicaid spending because recovery data only capture a portion of Medicaid program integrity efforts (e.g., leaving out the value of fraud prevention or stopped payments) and don’t capture fraud that goes undetected.

As the Trump Administration continues to focus on addressing fraud, waste, and abuse in federal programs, including Medicaid, MFCUs are facing increased federal scrutiny. In May 2026, CMS announced the HHS Office of the Inspector General (HHS-OIG) would be initiating a review of every state’s MFCU before its next annual recertification. In June 2026, the HHS-OIG denied recertification and suspended federal funding for Hawaii’s and New York’s Medicaid Fraud Control Units. Within this context, this brief provides an overview of the role of MFCUs, examines caseload and case outcome data, and current issues facing MFCUs.

What are MFCUs and how do they work?

MFCUs are law enforcement entities that investigate and prosecute provider fraud and patient abuse and neglect. MFCUs investigate and prosecute, or refer to prosecution, provider fraud (in all settings) and complaints of patient abuse in certain health care settings, such as nursing homes and hospitals receiving Medicaid funds.1 MFCUs do not investigate fraud or program abuse committed by beneficiaries (these cases are the responsibility of the state Medicaid agency), although evidence of beneficiary fraud is low.2 MFCUs must operate independently from the state Medicaid agency and are often part of the State Attorney General’s office, employing teams of investigators, attorneys, and auditors. The HHS-OIG oversees MFCUs, annually recertifying each MFCU, assessing performance and compliance with federal requirements, and administering federal grant awards (which cover 75% of MFCU operating costs).

MFCUs open investigations after receiving referrals of suspected provider fraud or complaints involving patient abuse or neglect. A MFCU case typically begins with a referral from the state Medicaid agency (including program integrity or auditing offices), managed care organization (MCO), or from a complaint filed by a patient or former employee. The state Medicaid agency or MCO may initially detect fraud through monitoring Medicaid data and using data mining or analytics to identify billing pattern anomalies (e.g., billing spikes, upcoding, double billing, or unusual hours). All state Medicaid agencies have authority to conduct data mining, but some MFCUs have also specifically been granted permission by HHS-OIG to mine Medicaid data directly for evidence of fraud as part of their regular activities. More MFCUs may begin to conduct data mining or analytics as HHS-OIG in August 2026 waived the requirement that MFCUs obtain prior approval for these activities to identify suspected Medicaid fraud. While patient abuse or neglect may fall under the jurisdiction of several different law enforcement agencies, MFCUs may investigate patient abuse or neglect in health care facilities receiving Medicaid funds.3

MFCU cases vary in duration and scope, but investigations generally follow a standard process starting with an investigation and ending with potential financial recoveries (Figure 1).

Investigation. When a case is opened, the investigative team researches the alleged fraud or abuse by analyzing the evidence. Investigations may take months or years before charges are filed against providers.

Criminal Indictments & Civil Cases. Fraud and abuse can violate state and/or federal criminal law, civil law, or both. If a MFCU’s investigation team determines there is sufficient evidence of wrongdoing, the MFCU can bring criminal charges and/or civil lawsuits against the provider.

Criminal Convictions & Civil Judgments. Criminal convictions can result in a criminal record, financial penalties, and/or incarceration. Civil judgments can establish liability and/or impose financial penalties and other court-ordered remedies. Providers who are convicted or liable for criminal fraud or patient abuse/neglect (along with other crimes) legally must be excluded from participating in federally funded health care programs. HHS-OIG or state Medicaid agencies may also decide to exclude providers beyond these minimum standards.

Recoveries. HHS-OIG defines recoveries as the amount of money that defendants are required to pay as a result of a settlement, judgment, or prefiling settlement in criminal and civil cases. Recoveries may not reflect the amounts actually collected from defendants (e.g., if the defendant is a company that dissolved before collections could be obtained). MFCUs work with state Medicaid agencies to return the state and federal share of any recovered Medicaid payments.

Note: Throughout the lifecycle of a case, MFCUs may collaborate with other state and federal program integrity and law enforcement partners. State entities include state inspectors general and state health departments and federal entities include the U.S. Department of Justice (DOJ) (including Federal Bureau of Investigation (FBI)) and the U.S. Department of Health and Human Services Office of Inspector General (HHS-OIG). Some investigations or cases may be transferred to (or handled by) federal law enforcement agencies.     
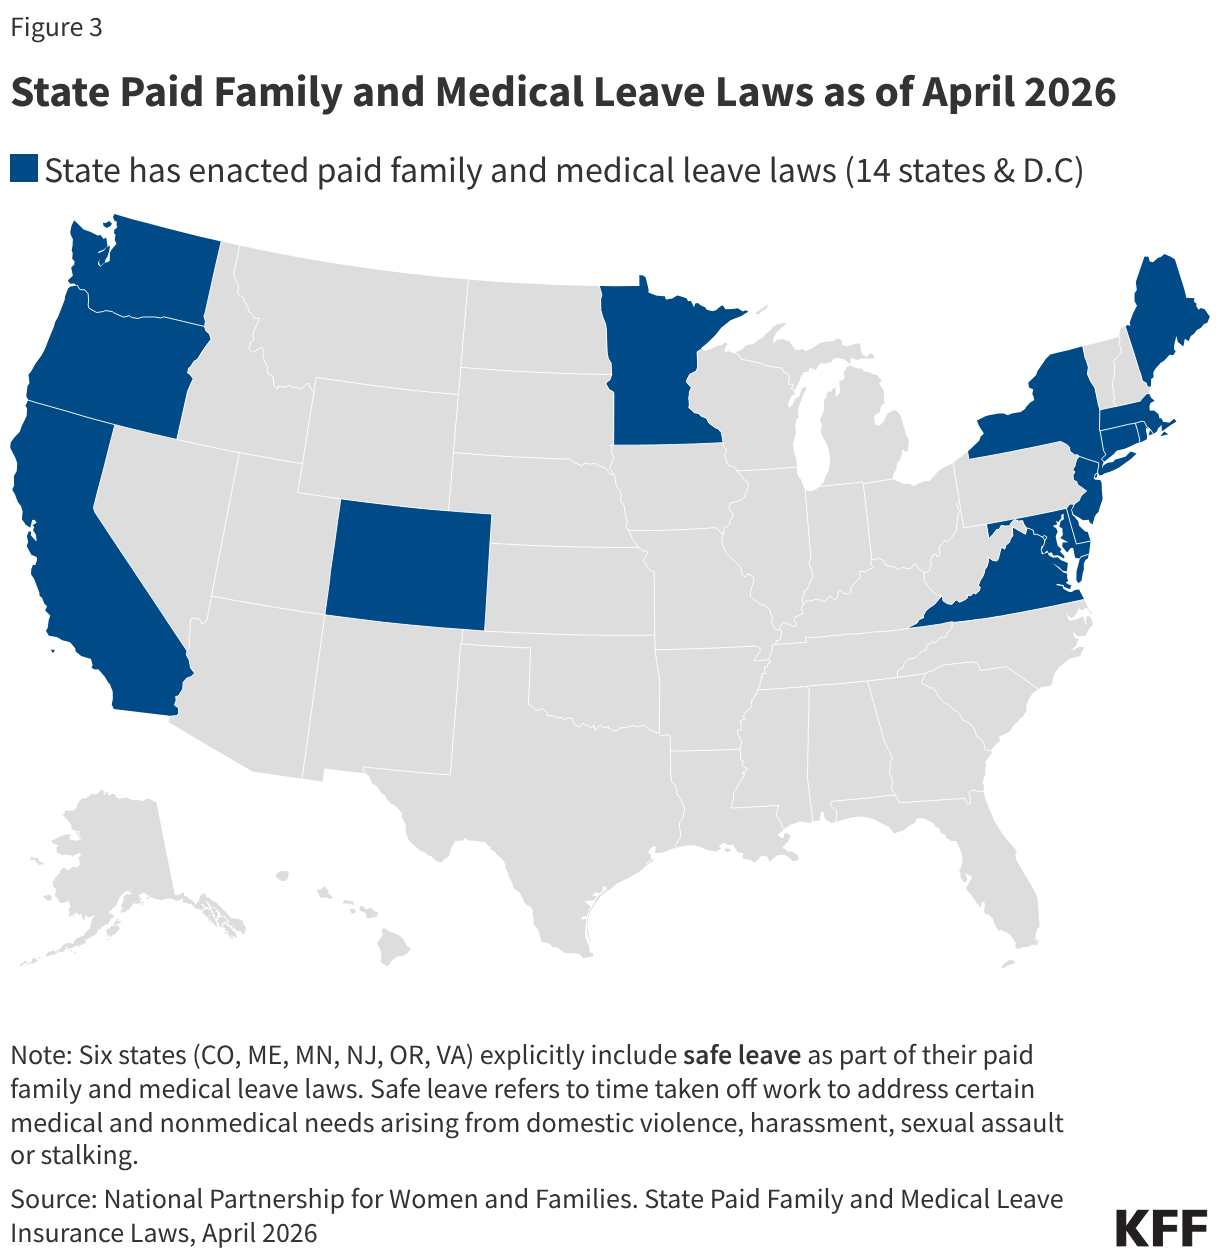
Box 1. Example Cases

Active MFCU investigations are typically confidential. When MFCUs secure criminal convictions and civil judgments or settlements, the case is described in an announcement published by the state or the DOJ. To illustrate the variety of cases that may be processed by a MFCU, this box describes examples from a range of states, types of wrongdoing, and recovery amounts.
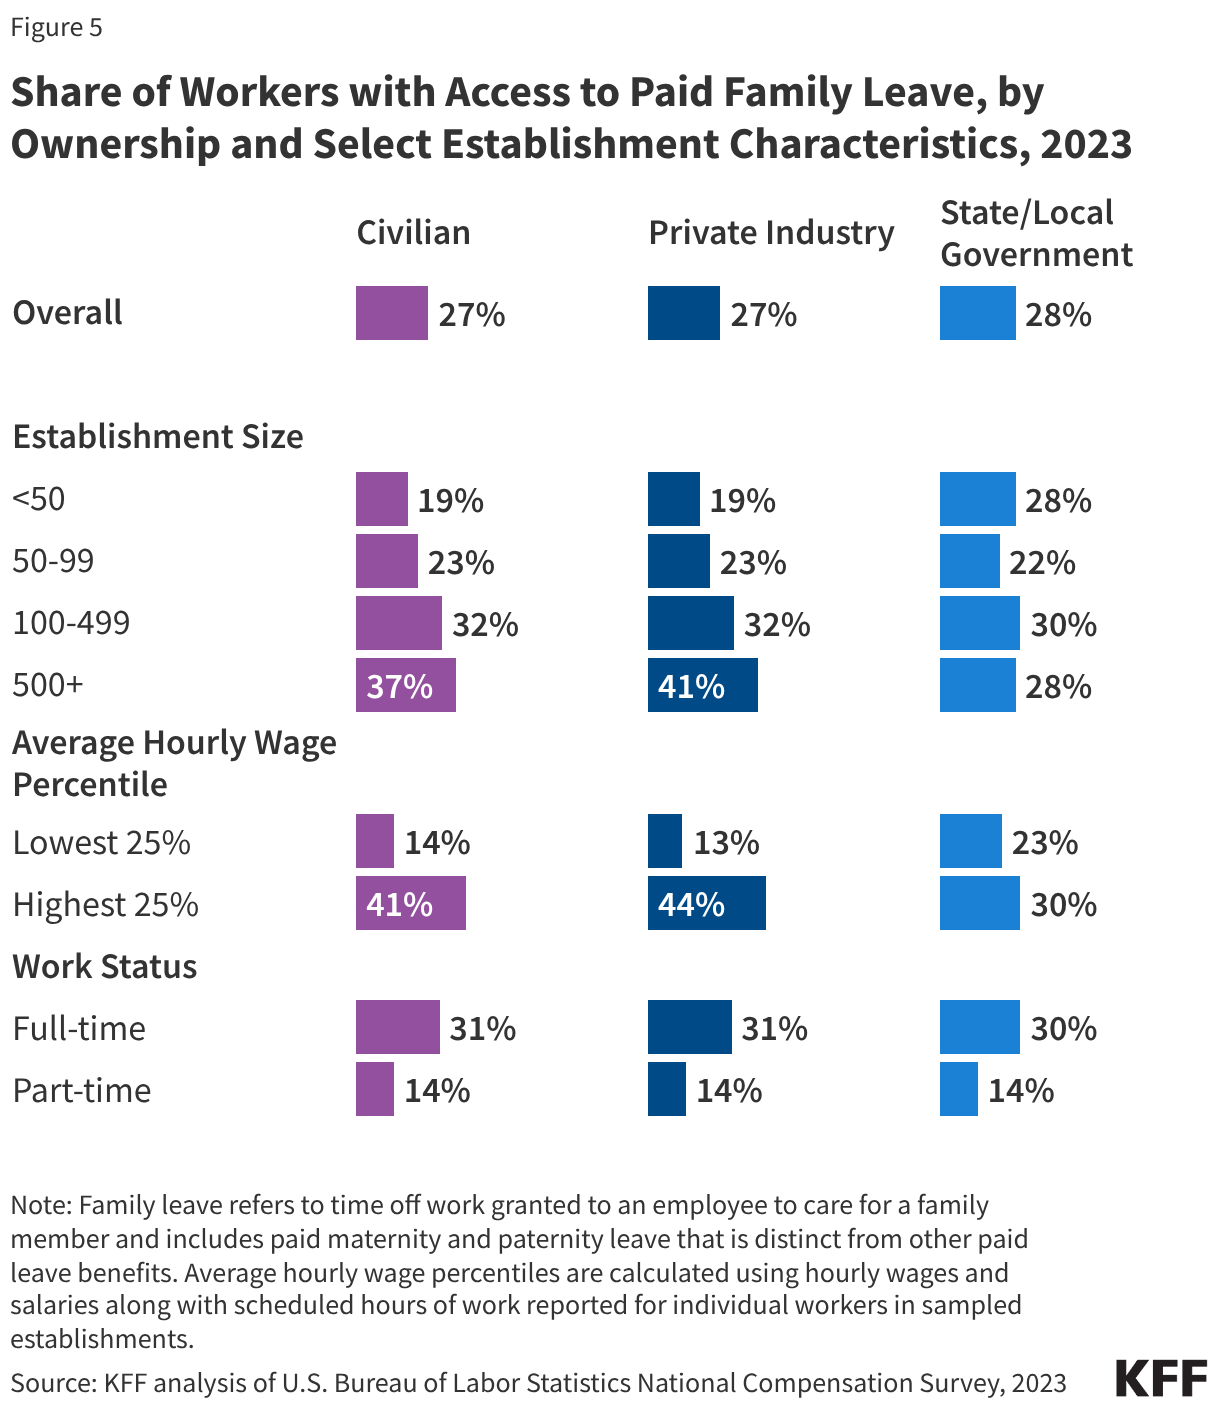
Criminal Fraud: Between 2004 and 2019, the McKinsey consulting firm provided OxyContin sales and marketing advice to Purdue Pharmaceuticals. The Virginia MFCU participated in a lengthy and complex investigation into alleged criminal wrongdoing resulting in false or fraudulent OxyContin prescriptions paid by Medicaid and other health insurers. The December 2024 resolution of criminal charges against McKinsey resulted in $650 million in recoveries, which contribute to the high total MFCU recoveries reported in FY 2025 (as seen in Figure 4).  
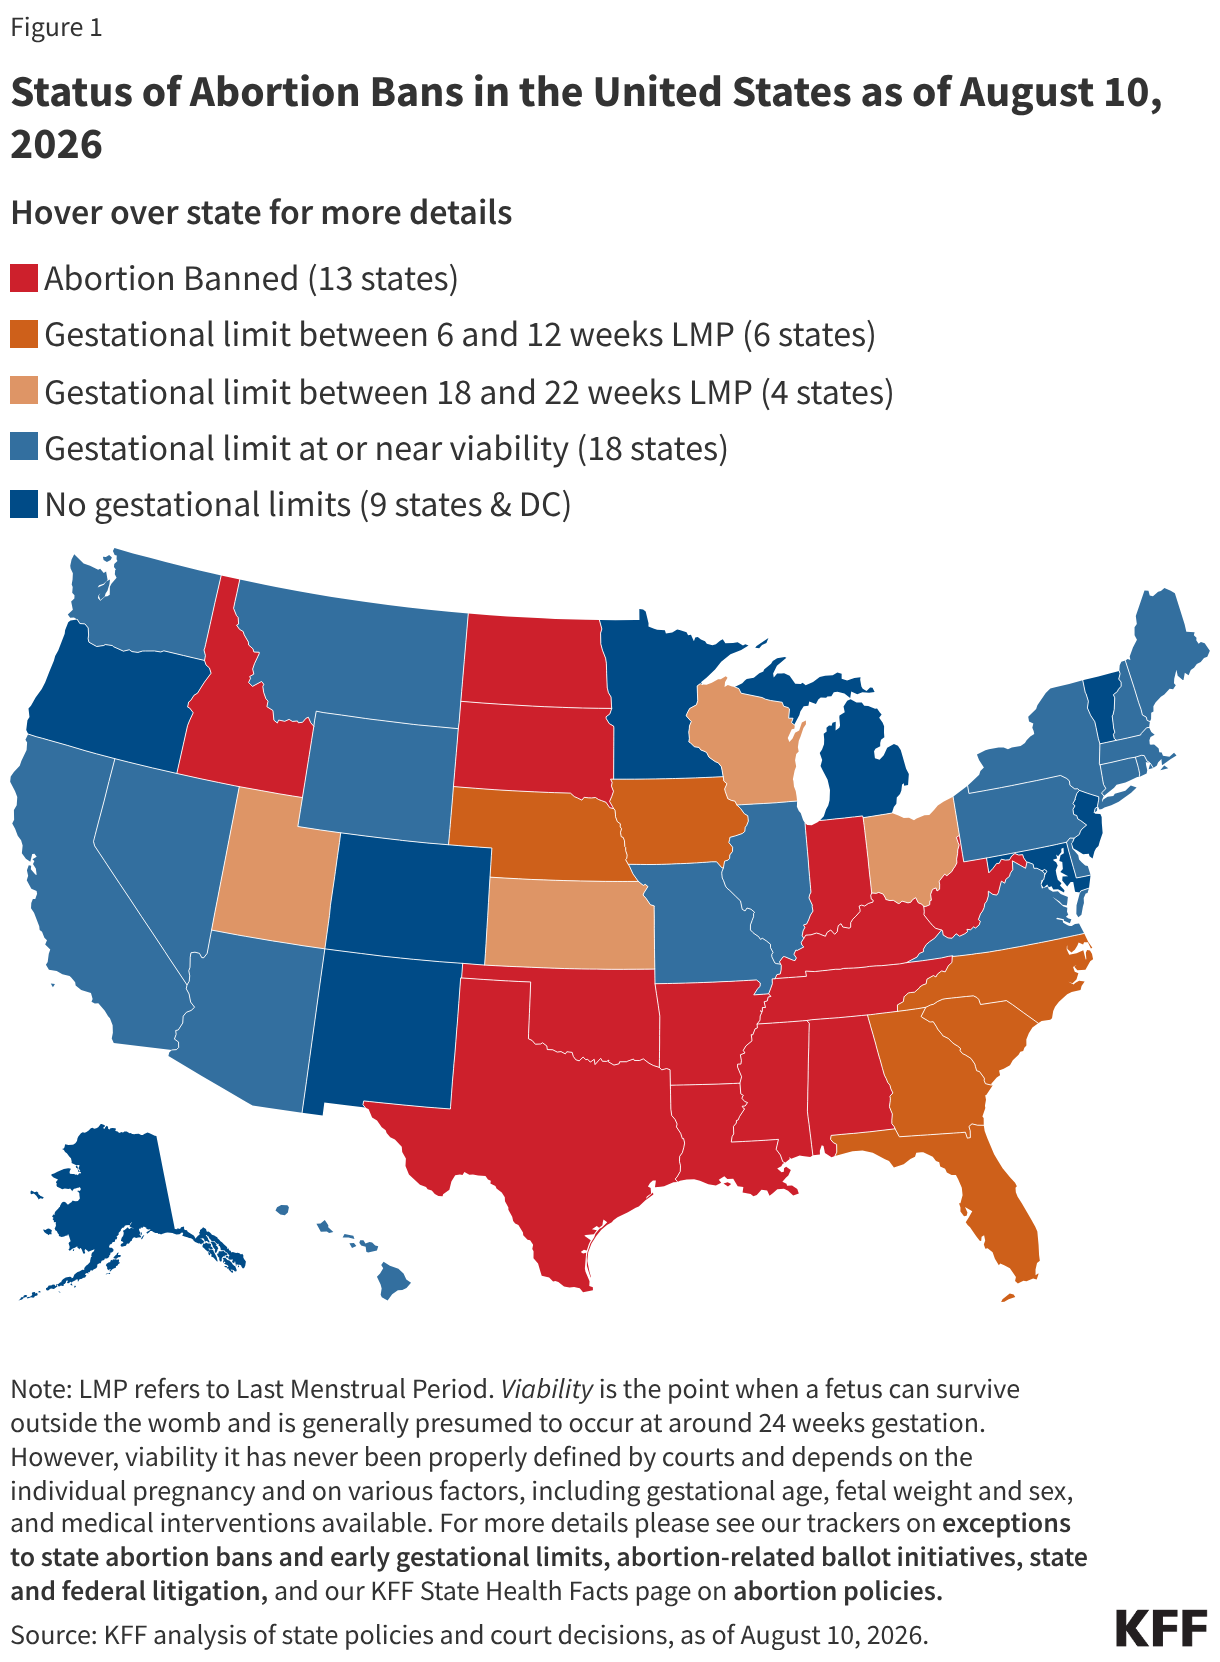
Civil Fraud: As part of the 2018 National Health Care Fraud Takedown, the Georgia MFCU investigated false claims for non-emergency medical transportation (NEMT) and adult day health services. More than $1 million in Medicaid payments were implicated in the investigation. The case was decided in 2019, with state and federal civil judgments resulting in a $10.1 million settlement paid to Georgia and the federal government.

Patient Abuse and Neglect: In 2021, the Massachusetts MFCU received a referral into alleged patient abuse by a home health aide. In 2023 the MFCU obtained a criminal conviction of abuse, neglect, or mistreatment of an elder by a caretaker.


What data do MFCUs report?

Annually, MFCUs report investigation, enforcement, and financial recoveries data to HHS-OIG. Each year, HHS-OIG releases a summary report of MFCU activities that provides an annual snapshot of aggregated case outcomes from all MFCUs and certain case outcome trends. In addition to the summary report, HHS-OIG releases individual (state) MFCU case activity and outcomes data.

At the end of FY 2025, there were 15,810 open investigations across all state MFCUs. While MFCUs investigate both provider fraud and patient abuse and neglect, data show most MFCU investigations are related to provider fraud (Figure 2). A subset of investigations leads to criminal indictments or civil cases / complaints. MFCU investigations can take months to years, depending on various factors, including the types of allegations involved, volume of records, and agencies involved.

Most Investigations Were Cases of Suspected Fraud (Donut Chart)

In FY 2025, MFCUs obtained 1,180 criminal convictions and reached 661 civil settlements and judgements (Figure 3). Most criminal convictions were for provider fraud. HHS-OIG uses information it receives from MFCUs to exclude individuals and entities from participating in federal health programs. In FY 2025, 900 individuals or entities were excluded because of criminal convictions obtained by MFCUs—accounting for nearly one-third (32%) of all OIG exclusions that year (data not shown).

MFCUs Obtained 1,841 Case Resolutions in FY 2025 (Stacked column chart)

On average, MFCUs recover more than $1 billion each year from fraud investigations. Nationally, MFCUs recovered $1.97 billion in FY 2025. While recoveries include other financial penalties in addition to Medicaid funds recouped from providers due to MFCU investigations (and may not reflect amounts actually collected4), the total amount of recoveries is small compared to total Medicaid spending. Recoveries vary each year and can be skewed by factors, including timing of settlements and large multi-year cases. Recoveries typically vary substantially from year to year and have averaged $1.48 billion per year over the period 2016 to 2025. A 5-year rolling average accounts for periodic variation and shows that recoveries decreased during the COVID-19 Public Health Emergency and are returning to pre-COVID levels. Recoveries, after accounting for year-to-year variation, have remained generally steady over time while total Medicaid spending has increased. Recoveries are not a comprehensive measure of enforcement (because they may not include Medicaid-related enforcement actions that occurred outside of MFCU actions) and do not include the possible financial impacts of other program integrity efforts, such as preventing fraud before it occurs. Of the $1.97 billion in recoveries, two-thirds (64%) were due to criminal convictions and one-third (36%) were due to civil judgments or settlements (data not shown). This is proportionate to the share of criminal and civil case resolutions in FY 2025 (Figure 3).

Annual Recoveries Vary, but on Average MFCUs Recover More than  Billion in Medicaid Funds Each Year Through Fraud Investigations (Line chart)

Comparing data across states or considering recovery dollars in the context of overall Medicaid spending can be challenging. Comparing MFCU data across states or years can be difficult due to differences in state law (that impact the handling of cases) and varying duration, scope, or complexity of cases, among other factors. Comparing MFCU recoveries to overall Medicaid spending can also be challenging to interpret as a hypothetical indicator of MFCU performance because these data only capture a portion of Medicaid program integrity efforts and include amounts other than recouped Medicaid payments. States can also make policy decisions that might impact state spending and MFCU recoveries differently. For example, states that spend more on prevention or early detection may see fewer recoveries (if these activities are successful), while states that invest less in fraud prevention may see higher levels of enforcement action and recoveries. There are no estimates of fraud that may have been successfully prevented or fraud that went undetected/unrecovered; however, over time there has been a shift in focus from efforts to recover misspent funds (“pay and chase”) to prevention and early detection. A higher level of MFCU recoveries could indicate more fraud, more aggressive enforcement, or less effective prevention.

What are current issues involving MFCUs?

MFCUs continue to work with state and federal agencies to stop fraud and abuse but also face increased federal scrutiny. On May 13, 2026, HHS Investigator General Bell sent a letter to every state Attorney General communicating a stance of “insistence on rigid MFCU compliance” with requirements and performance standards that will be enforced through “robust review” by the HHS-OIG. MFCUs are recertified annually on a rolling schedule, based on each specific state or territory’s original certification date.5 As of September 17, 2026, HHS-OIG has followed release of the May 2026 letter by issuing standard recertifications to 3 states and “conditionally recertifying” 11 state MFCUs, a designation which accompanies a set of corrective actions recommended by HHS-OIG. It does not appear that HHS-OIG regularly issued conditional recertifications prior to 2026.

In June 2026, Hawaii’s and New York’s MFCUs were notified that HHS-OIG was denying their annual recertification in letters citing insufficient case outcomes in both states. HHS announced that it was denying Hawaii’s and New York’s annual MFCU recertifications, discontinuing federal funding for the fraud control units. In each state’s recertification denial letter, HHS cites insufficient case outcomes (particularly low production of criminal indictments and convictions) and recoveries that are disproportionately low relative to the staffing and budget of the state MFCU (New York) or relative to the growth in the state’s Medicaid spending (Hawaii). States that have their MFCU recertification denied can appeal the decision and request that HHS-OIG reconsider; Hawaii indicated they intended to seek reconsideration. Hawaii and New York have responded to their denied MFCU certifications by reiterating their states’ commitment to Medicaid program integrity and highlighting ongoing actions to prevent and detect suspected Medicaid fraud. It is unclear if HHS-OIG may deny the recertification of other state MFCUs, but the discontinuation of federal funding could hamper states' ability to continue ongoing operations or initiate new investigations.

  1. MFCUs can also elect to investigate and prosecute patient abuse and neglect in non-institutional settings (e.g., home and community-based settings). ↩︎
  2. While states may have their own laws defining responsibilities around investigating beneficiary fraud or program abuse, MFCUs cannot use federal funding to investigate alleged beneficiary fraud unless it is in relation to suspected provider fraud. ↩︎
  3. Ibid. ↩︎
  4. Recoveries may not reflect the amounts actually collected from defendants (e.g., if the defendant is a company that dissolved before collections could be obtained). MFCUs work with state Medicaid agencies to return the state and federal share of any recovered Medicaid payments. ↩︎
  5. Federal requirements and performance standards serve as the basis for MFCU annual recertification by HHS-OIG. When a MFCU applies for annual recertification, the MFCU submits performance and budget data, including staffing, costs, case numbers and outcomes, and other information requested by HHS-OIG. HHS-OIG may conduct an onsite review of the MFCU. ↩︎

Proposed Changes to Demographic Data Collection in the Census Could Impact Efforts to Address Health and Health Care Disparities 

Published: Sep 25, 2026

Introduction

On September 10, 2026, the Census Bureau published a proposed rule adding two new parts to the regulations that govern the decennial census of population and housing. The proposed changes would prohibit the inclusion of questions on race and ethnicity (in addition to sexual orientation) and would narrow the definition of “usual residence” to exclude millions of noncitizen immigrants, including undocumented immigrants as well as lawfully present immigrants without lawful permanent resident status (i.e., LPR status or a green card) from the census’ apportionment count. This count is the official measurement used to proportionately divide the 435 seats in the U.S. House of Representatives across all 50 states. Further, under the proposed rule, the Census Bureau would consider tax records to determine “usual residence,” which could result in the exclusion of people who don’t file taxes from the census count. As outlined in the U.S. Constitution, the purpose of the decennial census is to count every person living in the U.S., with that information being used to determine “the number of seats each state has in the U.S. House of Representatives” as well as to distribute federal funds.

Since its inception in 1790, the census has always collected data on race and ethnicity and counted all persons living in the U.S., regardless of citizenship or immigration status. While President Trump attempted to exclude undocumented immigrants from the 2020 decennial census during his first term via executive action, legal challenges prevented the policy from being implemented. If finalized and implemented, the changes in the September 2026 proposed rule would mark the first time that race and ethnicity data are not collected in the decennial census and would also be the first time that millions of noncitizen immigrants, including those who are lawfully present but who lack LPR status, are excluded from U.S. population counts.

Public comments on the proposed rule are due by October 13, 2026, after which the Census Bureau is required to review and respond to comments before publishing a final rule. If finalized, the rule is likely to face legal challenges. A change in presidential administration prior to the 2030 decennial census could also impact implementation.

This issue brief provides an overview of the decennial census and discusses potential implications of the changes outlined in the proposed rule. Key takeaways include:

  • If finalized, the proposed changes to census data collection would signal the first time since its inception in 1790 that the U.S. decennial census does not collect data on race and/or ethnicity and excludes millions of noncitizen immigrants from apportionment counts.
  • The exclusion of millions of noncitizen immigrants from apportionment counts could lead to decreased federal funding and resources for states and localities with higher shares of immigrants. This includes funding for health programs such as Medicaid and the Children’s Health Insurance Program (CHIP).
  • Lack of race and ethnicity data could negatively impact research on health and health care disparities as well as data quality and representation since the decennial census is the only source of complete, block-level data on race and ethnicity as well as other key sociodemographic characteristics. Further, the exclusion of many noncitizens will also mean that the census will not accurately reflect who is residing in the U.S.
  • The proposed changes could impact the redistricting process and lead to shifts in political representation, including potentially reallocating congressional seats in ways that would reduce political representation for states with large immigrant populations.

The Decennial U.S. Census

The decennial census is constitutionally mandated to obtain a count of every person living in the U.S. to determine political representation and the allocation of federal funds. Beginning in 1790, the U.S. Census Bureau has conducted a census once every decade on April 1 in years ending in zero “to determine the number of people living in the United States.” The data collected by the decennial census are used to proportionately divide the 435 seats in the U.S. House of Representatives across all 50 states as well as to determine the allocation of hundreds of billions of dollars in federal funding annually.

The decennial census is the only source of complete, block-level (smallest geographic unit defined by the Census Bureau) data on race and ethnicity as well as other demographic characteristics. Researchers and organizations rely on census data to understand population distribution by key demographic characteristics, for drawing nationally representative survey samples and weighting surveys, and to do in-depth research in areas like the U.S. workforce, the economy, and housing stock, among others. The race and ethnicity data collected by the census are also used to evaluate the effectiveness of government programs and policies as well as to measure and ensure fairness, equity, and compliance with anti-discrimination laws and policies.

Since its inception in 1790, the U.S. census has collected information on race and ethnicity that has informed policy, the allocation of resources, and research on different groups within the country. How the census has collected and categorized information on race and ethnicity and the racial and ethnic groups for which data have been collected have evolved significantly over time, reflecting social and political shifts and the growing diversity of the U.S. population (Figure 1). In 1977, the Office of Management and Budget (OMB) established federal standards for collecting and reporting race and ethnicity data. The OMB standards guide not only the census but also other federal surveys, ensuring consistency across government data collection efforts. In March 2024, the OMB revised the racial and ethnic data collection and reporting standards to add Middle Eastern or North African as a category, clarify instructions for individuals to select multiple racial and ethnic categories, and require collection of more detailed data. The OMB indicated that these revisions were intended to result in more accurate and useful race and ethnicity data across the federal government. However, the Trump administration has extended the deadline for implementation of these changes twice and canceled plans to use the new standards in the 2027 American Community Survey.

U.S. Census Collection of Race and Ethnicity Data Have Evolved Over Time (Dot Plot)

Since its inception in 1790, the decennial census has included all people residing in the U.S. regardless of citizenship or immigration status, consistent with the Constitution's directive to enumerate "persons" rather than citizens. Article I, Section 2 of the U.S. Constitution requires an "actual Enumeration" of the population every ten years for purposes of proportionately dividing, or apportioning, seats in the U.S. House of Representatives, and Section 2 of the Fourteenth Amendment, which eliminated the Three-Fifths Compromise, specifies that representatives be apportioned "according to their respective numbers, counting the whole number of persons in each State…". Consistent with this description, the Census Bureau's longstanding practice has been to count every single “person,” regardless of citizenship or immigration status, who usually lives and sleeps in the U.S. in the decennial census. It has never excluded noncitizens from the apportionment base. During his first term, President Trump sought to exclude undocumented immigrants from the 2020 apportionment count through executive action, but legal challenges prevented the policy from taking effect.

Implications of Proposed Changes

The exclusion of millions of noncitizen immigrants from apportionment counts could lead to decreased federal funding and resources for states and localities with higher shares of immigrants. The proposed rule's exclusion of immigrants without LPR status from the U.S. resident population (in addition to the apportionment base) by redefining the term “usual residence” will impact the allocation of federal funds and resources across areas. The change will lead to areas with higher shares of noncitizen immigrants receiving less funding since the census will show them having fewer residents and the income and demographic profile of state residents may change without those noncitizens being counted. Prior research has found that, beyond total population counts, each state’s poverty rate and share of people living in rural areas are key factors that drive allocation of federal funds since they often are directed to low-income households and rural areas. According to analysis by the Project on Government Oversight, over 370 public programs relied on census data to allocate at least some portion of over $2.2 trillion in federal funds to states, counties, local communities, organizations, and households in fiscal year 2023. The largest share of this funding is for health programs, including Medicaid and CHIP. For example, the federal government’s share of most Medicaid and CHIP expenditures (or Federal Medical Assistance Percentage (FMAP)) is based on a state’s per capita income derived from decennial census data. Excluding many noncitizens--who are disproportionately likely to have lower incomes--from the resident count could result in a reduction in the FMAP for states with large immigrant populations, such as Florida and Texas. Other states that also have large immigrant populations, like California, would likely be affected less since their FMAP is already at the lowest level of 50%. The change could also affect the location of federally funded resources. For example, the Health Center Program uses census-derived data to determine medically underserved areas, which helps determine the location of Federally Qualified Health Centers (FQHCs). Decennial census data also indirectly shape where hospitals are located. For example, 36 states, including D.C., have certificate of need (CON) laws that help determine whether a new hospital or additional beds may be built using "bed need" methodologies that are benchmarked to census data.

Lack of race and ethnicity data and the exclusion of many noncitizen immigrants could negatively impact research on health and health care disparities as well as data quality and representation. Elimination of racial and ethnic data collection from the decennial census will have important implications for the measurement of disparities since the decennial census is the only source of complete, block-level data on race and ethnicity as well as other key sociodemographic characteristics. The exclusion of many noncitizens will also mean that the census will not accurately reflect who is residing in the U.S. Changes to the data beginning with the 2030 decennial census will eliminate a key source of data researchers use to understand population demographics and to ensure surveys are nationally representative and also limit the ability to examine trends over time, since the data will not be comparable to earlier versions. In the proposed rule, the Census Bureau indicates that they are not proposing restrictions on asking demographic questions on the American Community Survey or other surveys that are not used for enumeration of the population. While the administration is not currently proposing changes to such surveys, if similar changes are made to these surveys in the future, that would further limit the ability to understand the demographics of the U.S. population and the ability to measure and address health and health care disparities.

The proposed changes to stop collecting data on race and ethnicity are also likely to affect the redistricting process and lead to shifts in political representation. Decennial race and ethnicity data obtained from the census underpin the redistricting process and consequently, the voting power of communities of color. Under public law 94-171, enacted in 1975, the Census Bureau is required to provide states with block-level demographic data from the decennial census to redraw congressional and state legislative districts based on updated population counts. Section 2 of the Voting Rights Act (VRA) of 1965 prohibits voting practices that discriminate on the basis of race, among other factors. Block-level data on race and ethnicity cross-tabulated by voting age have long been used to establish the threshold required to bring a vote dilution claim under the law. In April 2026, the Supreme Court's decision in Louisiana v. Callais narrowed Section 2, holding that plaintiffs must show a strong inference that a state intentionally drew districts to afford minority voters less opportunity because of race as well as offer alternative maps meeting the state's legitimate goals. Eliminating block-level racial and ethnic data would compound these heightened evidentiary requirements by removing the underlying data to identify vote dilution, draw districts that provide communities of color an opportunity to elect candidates of their choice, and litigate VRA claims in the future.

The exclusion of millions of noncitizen immigrants from the decennial census could lead to the reallocation of congressional seats in ways that would reduce political representation for states with large immigrant populations. According to Pew Research Center, as of 2023, there were roughly 14 million undocumented immigrants and over 2 million lawfully present immigrants without LPR status in the U.S. Although these numbers have likely fallen since 2023, omitting these people from the count could impact representation for states with large numbers of immigrants. For example, a Pew Research Center analysis of President Trump’s earlier proposal to exclude undocumented immigrants from the 2020 decennial census found that, at that time, California, Florida, and Texas would each lose one congressional seat due to the change in population counts, while three other states would gain seats (Alabama, Minnesota, and Ohio).

Paid Family and Sick Leave in the U.S.

Published: Sep 25, 2026

Paid family and medical leave and sick leave can help workers meet their personal and family health care needs, while also fulfilling work responsibilities. Access to paid leave is a particularly salient concern for women, who comprise nearly half of the nation’s workforce and often take on the bulk of caregiving responsibilities. The federal Family and Medical Leave Act (FMLA) requires eligible employers to provide certain workers unpaid family leave; however, unlike nearly all other industrialized nations, the U.S. does not have a national requirement for paid family or sick leave, resulting in a patchwork of policies determined by state and local laws, employers, and/or labor contracts. While many have been advocating a national standard for paid leave for decades, there has been relatively little federal action.       

Though many states and localities have passed laws to expand access to paid leave within their jurisdictions, many workers still do not have access to these benefits. Employees not covered by these state and local laws must rely on voluntary employer policies, which can vary considerably in scope and compensation. This fact sheet summarizes federal, state, and local policies on paid family and medical leave and paid sick leave.

Paid Sick Leave: Paid sick leave can be used to recover from a short-term injury or illness such as a cold or for doctor’s appointments. It is often provided on an accrual basis up to a set number of hours or days per year, such as one hour of leave earned for every 30 hours worked up to seven days per year, and replaces 100% of the worker’s regular wages. On average, private sector workers are offered seven days of paid sick leave per year. Paid sick leave benefits are paid by the employer.

Paid Family and Medical Leave: Paid family and medical leave typically provides a set number of weeks or months to be used for a worker’s own serious, longer-term health condition, to care for a family member with a serious health condition, or to care for or bond with a new child, and for reasons related to a family’s member’s military service. On average, it provides six to twelve weeks of fully or partially paid leave per year, without the need for accrual. Paid family and medical leave may be insured and is often funded by contributions from the employer and/or the worker. 

Federal, State, and Local Policies on Sick, Family, and Medical Leave

Sick Leave

Paid sick leave allows workers to take short durations of time off if they are sick or need to care for a family member who is sick without losing pay. There is no federal requirement that employers offer paid leave benefits, but many states have requirements, and some employers do so voluntarily. According to the Bureau of Labor Statistics (BLS), eight in ten workers (82%) had access to paid sick leave through their employer in 2025. 

Proponents of a national paid sick leave mandate stress that workers should not be forced to choose between going to work while sick and losing pay or their job, pointing to numerous studies on the benefits of paid sick leave, such as preventing the spread of illnesses, increased use of preventive health care services, reduced on-the-job injuries, and fewer inappropriate emergency room visits. Opponents of a national paid sick leave mandate generally contend that it is not necessary because many employers already provide these benefits, or that it should be a voluntary benefit. They cite concerns about the financial implications for employers who would be required to provide this benefit, particularly for smaller businesses, and potential reductions in wages designed to offset those costs. 

At the federal level, the Healthy Families Act has been reintroduced annually and would require employers nationwide with 15 or more employees to provide at least 7 days annually, based on a 40-hour work week if it were to pass. Employees would be able to use sick leave for their own illness, to care for a sick family member, obtain medical care, or address needs resulting from domestic violence, sexual assault, or stalking, known as “safe time,” “safe days,” or “safe leave.” Federal government employees have generally had access to paid sick leave through employee benefits packages. 

There has been more traction on paid sick leave policies at the state and local level. Since the first law was passed by voter initiative in 2006 in San Francisco, 18 states plus D.C., and 18 other localities have passed laws requiring covered employers to provide eligible employees paid sick leave (Figure 1). Most of these policies permit the use of accrued sick leave for “safe time.” Three additional states and three localities have general paid time off laws that allow employees to use accrued leave for any reason, including illness. Ten states and 12 localities permit use of accrued paid sick leave for workplace closure or closure of the worker’s child’s school or childcare associated with a public health emergency.

Figure 1

The scope and generosity of paid sick leave laws vary. Most state and local laws have exemptions based on the size and type of employer and/or permit employers to impose certain worker eligibility requirements. Most laws also permit employers to impose a waiting period before new employees can use accrued leave, most often 90 days from the start of employment. Laws generally provide for accrual of 30-40 hours per year, though there is wide variation by policy, with lower accrual rates for smaller employers in many cases.

Family and Medical Leave 

FMLA and Unpaid Family and Medical Leave

It has been more than 30 years since the federal government passed the Family and Medical Leave Act (FMLA), giving eligible employees up to 12 weeks of unpaid, job-protected leave per year for their own serious health condition, to care for a seriously ill family member, for the arrival of a new child, and to address needs related to a family member’s military deployment. Eligible employees also receive up to 26 weeks of unpaid, job-protected leave per year to care for a seriously ill or injured family servicemember or veteran. The law applies to public agencies and local educational agencies of all sizes, as well as private employers with 50 or more employees. The FMLA has provided job security to millions of workers who need to take time off work for a qualifying reason; however, just over half (56%) of the workforce is eligible for FMLA protections because small employers are exempt, and even in covered worksites, not all employees meet FMLA eligibility requirements. Most states have opted to expand job-protected leave benefits beyond FMLA’s minimum standards by expanding eligibility, the duration of leave, the definition of family members, or qualified reasons for taking leave in the private and/or public sector in the private and/or public sector. 

Paid Family and Medical Leave

BLS data found that just over one in four (27%) workers had access to paid family leave in 2023, the most recent year for which there is data (Figure 2). Data on the share of workers with explicit access to paid medical leave for a longer, serious illness are limited, but BLS also estimates that 42% of workers had access to short-term disability insurance in 2025, which can be used to take paid time off for parental leave or medical leave.​ 

Bar chart showing the share of workers who had access to paid family leave compared to the share of workers who had access to unpaid family leave in 2023. It shows that while most workers have access to unpaid family leave, less than three in ten have access to paid family leave. This is the case among civilian-owned, privately-owned, and state/local government-owned establishments.

Proponents of a national paid family and medical leave program urge that it would provide employees with greater financial security when they must take extended leave for medical reasons or to care for an ailing family member or new child. Research indicates that access to paid family and medical leave is associated with improved physical and mental health for new parents, improved birth outcomes, financial security for caregivers in the short- and long-term, and improved connections to the workforce, particularly for women, who are more likely than men to be caregivers for children and older adults. Opponents often cite concerns about the impact of new federal requirements on businesses, government overreach into the free market, increased taxes for businesses (should that be the funding mechanism), as well as the financial implications a new benefit would have on wages and employment.  

Like sick leave, there have been many attempts to enact a national paid family and medical leave policy, but no permanent, broad-scale federal legislation has ever been passed. The Family and Medical Insurance Leave (FAMILY) Act, re-introduced in 119th Congress, if passed, would create a national insurance program to provide workers up to 12 weeks of their partial income for their own serious health condition or that of an immediate family member, and for the birth or placement of a child. The program would be funded by employee and employer payroll contributions. The program would be funded by employee and employer payroll contributions.

At the state level, 14 states and D.C. have enacted paid family and medical leave (Figure 3). In November 2020, Colorado became the first state to enact paid family and medical leave through a ballot measure. In 2026, Virginia became the first southern state to pass a statewide requirement for paid family and medical leave. Six states (Colorado, Maine, Minnesota, New Jersey, Oregon, and Virginia) also explicitly include safe leave as part of their paid family and medical leave laws. Oregon permits use of paid leave for reasons associated with a public health emergency. Paid leave durations for an employee’s own serious medical condition range from 6 to 52 weeks per year and 8-12 weeks for family leave. Four states (Colorado, Connecticut, Oregon, and Washington) plus D.C. provide a 2–4-week extension for a worker’s own pregnancy-related health issues. Wage replacement ranges from 50% to 100% of regular pay, up to certain caps, and requirements vary by state. Some states provide benefits on a sliding scale, with a higher percentage of wage replacement for lower-income workers. All states offering paid family and medical leave have minimum earnings or employment length requirements to qualify, and some have 7-day unpaid waiting periods. Paid leave benefits are administered by the state or by employers with qualifying programs and are funded through employer and/or employee contributions. 

This map shows that paid family and medical leave laws are limited across the U.S. Fourteen states and Washington D.C. have enacted paid family and medical leave laws ranging from 8 weeks to 52 weeks. Wage replacement rates vary by state and an individual's average weekly wages, with some states replacing up to 100% of an employee's wages while on leave.

Employer Provision of Paid Leave Benefits

The BLS’s National Compensation Survey (NCS) releases annual data related to employer benefit plans, including leave benefits. The share of employees with access to paid leave benefits varies by establishment characteristics, such as size, worker status, and wages. Nonetheless, access to paid leave benefits has increased overall in the last few years. The share of workers with access to paid family leave increased from 17% in 2018 to 27% in 2023; similarly, the share of workers with access to paid sick leave slightly increased from 78% in 2020 to 82% in 2025.  

There are differences between different groups of workers in access to paid sick leave (Figure 4). Just over half (56%) of part-time workers had access, compared to nine in ten (90%) full-time workers. The lower likelihood of paid sick leave for part-time workers has a disproportionate impact on women, who are more likely than men to hold part-time jobs and more likely than men to care for sick children when they stay home from school. Among establishments with 500 workers or more, the share of workers with access to this benefit was 91%, compared to 73% of workers in establishments with less than 50 workers.

Split bar chart showing the share of workers who had access to paid sick leave in 2025. It shows that while access to paid sick leave is high overall among civilian-owned, privately-owned, and state/local government-owned establishments, there are differences in access between different groups of workers. Smaller shares of workers with lower incomes and part-time workers had access to paid sick leave compared to workers with higher incomes and full-time workers, respectively.

Similarly, in 2023, 31% of full-time workers had access to paid family leave benefits compared to 14% of part-time workers (Figure 5). Among establishments with less than 50 workers, the share of workers with access to this benefit was about one in five (19%). The share of workers with access nearly doubles (37%) in establishments with over 500 workers.  

Split bar chart showing the share of workers who had access to paid family leave in 2023. It shows that while access to paid family leave is similar overall among civilian-owned, privately-owned, and state/local government-owned establishments, there are differences in access between different groups of workers. Smaller shares of workers with lower incomes and part-time workers had access to paid family leave compared to workers with higher incomes and full-time workers, respectively.

Short of federal action, the movement for paid leave will likely continue to be centered on state and local policies or those voluntarily adopted by employers or negotiated through union contracts. Given that most people will need time off during their working lives to care for a personal or family illness, or for a new child, this issue will continue to be a salient concern for working families across the country in the years to come. 

Key Facts on Abortion in the United States

Published: Sep 25, 2026

Note: This brief was updated on September 25, 2026 to incorporate new data on abortion statistics.

The Supreme Court’s 2022 ruling in Dobbs v. Jackson Women’s Health Organization overturned the constitutional right to abortion that had been in place for nearly 50 years under Roe v. Wade. Prior to the Dobbs ruling, abortions were permitted up to fetal viability in all states. That federal standard was eliminated under Dobbs, allowing states to ban or restrict clinicians from providing abortion before viability. KFF is tracking and updating the status of abortion access and availability, with some states banning the provision of almost all abortions, and some states protecting abortion access. 

This issue brief answers some key questions about abortion in the United States and presents data collected before and since the Dobbs ruling.

Table of Contents

What is abortion?

Copy link to What is abortion?

Abortion is the medical termination of a pregnancy. It is a common medical service that many women obtain at some point in their life. There are different types of abortion methods, which the National Academy of Sciences, Engineering, and Medicine (NASEM) places in four categories: 

  • Medication Abortion – Medication abortion, also known as medical abortion or abortion with pills, terminates a pregnancy by oral medications. There are two widely accepted protocols for medication abortion. In the U.S., the most common protocol involves the drugs mifepristone and misoprostol. Typically, an individual takes mifepristone first, followed by misoprostol 24-48 hours later. The U.S. Food and Drug Administration (FDA) has approved this abortion protocol up to the first 70 days (10 weeks) of pregnancy. Another medication abortion protocol uses misoprostol alone, which is also recommended for up to 70 days (10 weeks) of pregnancy, but it is not currently approved by the FDA and is more commonly used in other countries. 

The Guttmacher Institute estimates that in 2023, medication was used for almost two thirds (65%) of all abortions. Many have confused emergency contraception (EC) pills with medication abortion pills, but EC does not terminate a pregnancy. EC is a contraceptive that prevents pregnancy by delaying or inhibiting ovulation and will not affect an established pregnancy.  

  • Aspiration, a minimally invasive and commonly used gynecological procedure, is the most common form of procedural abortion. It can be used to conduct abortions up to 14-16 weeks of gestation. Aspiration is also commonly used in cases of early pregnancy loss (miscarriage).  
  • Dilation and evacuation abortions (D&E) are usually performed after the 14th week of pregnancy. The cervix is dilated, and the pregnancy tissue is evacuated using forceps or suction.  
  • Induction abortions are rare and conducted later in pregnancy. They involve the use of medications to induce labor and delivery of the fetus.  

What does research show about the safety of abortions?

Copy link to What does research show about the safety of abortions?

Decades of research have shown that abortion is a very safe medical service.

Despite its strong safety profile, abortion is the most highly regulated medical service in the country and is now banned in several states. Additionally, many states impose other limitations on abortion that are not medically indicated, including waiting periods and parental notification and consent requirements that typically delay receipt of services. 

  • NASEM completed an exhaustive review on the safety and effectiveness of abortion care and concluded that complications from abortion are rare and occur far less frequently than during childbirth.  
  • NASEM also concluded that safety is enhanced when the abortion is performed earlier in the pregnancy. State level restrictions such as waiting periods, ultrasound requirements, and gestational limits that impede access and delay abortion provision likely make abortions less safe.  
  • Medication abortion successfully terminates the pregnancy 91.9% to 99.7% of the time, with a 0.4% risk of major complications, and an associated mortality rate of less than 0.001 percent (0.0005%). Between 2% to 4% of medication abortions may need a procedural intervention with this regimen.  
  • Studies on procedural abortions, which include aspiration and D&E, have also found that they are very safe, with the rate of major complications less than 1% for aspiration abortions. Abortion medications and procedures are also often used for people experiencing miscarriages and stillbirths and can improve safety by preventing delays when a loss is inevitable. 
  • Most OBGYN physicians say that the Dobbs decision has had a negative impact on maternal health and patient safety. In a national KFF survey of OBGYNs, more than six in ten say that racial and ethnic inequities in maternal health (70%), management of pregnancy-related medical emergencies (68%), and pregnancy-related mortality have all worsened (64%) since the Dobbs decision.

What is the status of abortion policy in the U.S.?

Copy link to What is the status of abortion policy in the U.S.?

As of August 2026, the provision of abortion is banned in 13 states, and another 6 states have implemented early gestational limits between 6 and 12 weeks (Figure 1). Most other states allow abortion to the point of fetal viability, which is generally considered around 24 weeks gestation.

Map of the United States showing the status of abortion bans as of March 9, 2026. 

Abortion banned in 13 states: Alabama, Arkansas, Idaho, Indiana, Kentucky, Louisiana, Mississippi, North Dakota, Oklahoma, South Dakota, Tennessee, Texas, West Virginia

Gestational limit between 6 and 12 weeks LMP in effect in 7 states: Florida (6 weeks), Georgia (6 weeks), Iowa (6 weeks), Nebraska (12 weeks), North Carolina (12 weeks), South Carolina (6 weeks), Wyoming (6 weeks).

Gestational limit between 15 and 22 weeks LMP in effect in 4 states: Kansas, Ohio, Utah and Wisconsin

Gestational limits at or near viability in 18 states: Arizona, California, Connecticut, Delaware, Hawaii, Illinois, Maine, Massachusetts, Missouri, Montana, Nevada, New Hampshire, New York, Pennsylvania, Rhode Island, Virginia, Washington

No gestational limits in 9 states and DC: Alaska, Colorado, DC, Maryland, Michigan, Minnesota, New Jersey, New Mexico, Oregon, Vermont

All states that ban the provision of abortion have exceptions if an abortion is needed to prevent the death of the pregnant person. Additionally, some state bans make exceptions when the pregnancy is threatening the pregnant person’s health, when the pregnancy is the result of rape or incest, and when there is a lethal fetal anomaly. However, in practice, these exceptions have proven to be unworkable except in the most extreme circumstances.  

Abortion is one of the most highly restricted and regulated health care services. However, KFF research has found strong support for abortion access and opposition to criminalizing abortion care (Figure 2). 

Stacked bar chart showing that a majority of the public opposes laws restricting medication abortion. This includes laws that would ban mifepristone nationwide and laws that would make it a crime for health care providers to mail abortion pills to patients in states with abortion ban.

How common are abortions?

Copy link to How common are abortions?

The most recent data estimates that more than one million abortions (1,129,020) occurred in the U.S. in 2025. 

Three different organizations currently track abortion volume at the state and the federal levels: the federal Centers for Disease Control and Prevention (CDC), the Guttmacher Institute, and the Society for Family Planning (SFP). The CDC has been collecting abortion data for decades, but several states do not provide data to the federal government (reporting to the CDC is voluntary) and there is a two-to-three-year time lag until the data become publicly available. The most recent data from CDC is from 2022, the year the Dobbs decision was issued. For most of the decade prior to the Dobbs ruling, there was a steady decline in abortion rates nationally, but there was a slight increase in the years just before the ruling. Immediately following the Dobbs ruling, the number of abortions in the U.S. dropped as more states enforced bans and restrictions. 

Since the Dobbs ruling, the Guttmacher Institute’s Monthly Abortion Provision Study and the SFP's #WeCount have been tracking state level changes in abortion volume based on data provided by abortion clinics and providers. Both studies provide national and state-level estimates on procedural and medication abortions but differ in some methodologic details. For more details about data sources, see KFF’s issue brief on abortion trends. 

Paradoxically, the most recent data show that the abortion volume in the U.S. slightly increased overall in the three years following the Dobbs ruling.  

The monthly average number of abortions steadily increased from 77,560 monthly abortions in 2022 (April to December 2022), to 85,780 abortions in 2023 to 92,400 abortions in 2024 to 94,090 in 2025 (Figure 3). This overall increase nationally can be largely attributed to the growth of telehealth for medication abortion, increased availability of lower cost medication abortion pills through virtual clinics, growth in capacity in states without laws banning or restricting the provision of abortion, and in particular, shield law abortions where clinicians in legal states are mailing pills to individuals residing in states with bans and restrictions.  

There is large variation in the volume of abortions between states with different abortion policies. Most abortions occur in states without bans. In states with bans and six-week gestational limits, there have been major declines in the volume of in-person abortions, but an increase in abortions by telehealth since the Dobbs ruling.  There are month-to-month variations in all states. Additionally, in the years since Dobbs, some states have changed their abortion policies, with some becoming more restrictive and some less restrictive at different times, which affects abortion access and volume.  However, the overall pattern since the Dobbs ruling is an increase in the national number of abortions, particularly growth in the share of telehealth abortions. 

These grouped columns show that there is large variation in the volume of abortions between states with different abortion policies. Some states have changed their abortion policies since the 2022 Dobbs ruling, with some becoming more restrictive and some less restrictive at different times, which affects abortion access and volume. Most abortions occur in states without bans on abortion provision. In states with bans and six-week gestational limits, the number of abortions by telehealth have increased.

Who gets abortions?

Copy link to Who gets abortions?

Most of the information about people who receive abortions comes from CDC data. In 2022, the most recent year CDC data are available, women across a range of age groups, socioeconomic status, and racial and ethnic backgrounds obtained abortions, but the majority were obtained by women who were in their twenties, low-income, and women of color. 

  • Women in their twenties accounted for more than half (57%) of abortions. Nearly one-third (31%) were among women in their thirties and a small share were among women in their 40s (4%) and teens (9%).  
  • Information on the race and ethnicity of people who obtain abortions is particularly limited, but based on available data, more than half of abortions were among women of color in 2022. Black women comprised 40% of abortion recipients, 32% were provided to White women, 21% to Hispanic women, and 7% were among women of other races/ethnicities. Additionally, White, Black, and American Indian and Alaska Native women are disproportionately represented among women ages 18-49 in states with laws banning or restricting the provision of abortion compared to states that provide broader access to abortion. Many women who sought abortions have children. Approximately six in 10 (59%) abortion patients in 2022 had at least one previous birth.
Pie chart showing the age breakdown of individuals who had abortions in 2022. Overall, women in their 20s made up over half of abortion patients.

The vast majority (93%) of abortions occur during the first trimester of pregnancy according to data available from before the Dobbs decision.  

Before the 2022 ruling in Dobbs, there was a federal constitutional right to abortion before the pregnancy is considered to be viable, that is, can survive outside of a pregnant person’s uterus. Viability is generally considered around 24 weeks of pregnancy. Most abortions, though, occur well before the point of fetal viability. When people have abortions later in pregnancy, it is often because the fetus is not viable and the pregnancy may endanger the pregnant person’s life. 

Data from 2022 found that four in ten (40%) abortions occurred by six weeks of gestation, another four in ten (39%) occurred between seven and nine weeks, and 14% at 10-13 weeks. Just 7% of abortions occurred after the first trimester (Figure 5).

Pie chart showing the breakdown of abortions that occurred in 2022 by weeks of gestation. Most abortions (79%) occurred before 10 weeks of gestation.

Where do people get abortion care?

Copy link to Where do people get abortion care?

Abortions can be provided in a variety of settings. Historically, the majority of abortions have been provided at brick-and-mortar clinics that specialize in provision of reproductive health care. Some private office-based physicians also offer abortion services, and in more recent years, there has been an emergence of virtual-only clinics that send medication abortion pills by mail. 

Brick-and-mortar clinics vary, but they can offer medication abortion, procedural abortions, and services for abortions later in pregnancy. Many clinics in states where abortion is restricted or banned stopped offering abortion services shortly after the Dobbs ruling and the overall number of brick-and-mortar independent clinics in the US has decreased over the years.  

The distribution of facilities that offer abortion care varies widely by state and geographic region, and the national increase in abortions appears to be largely driven by the expansion of virtual abortion clinics. While virtual clinics can remove geographic barriers for those seeking abortion care, their services are limited to medication abortion which is only available to those seeking abortions earlier in pregnancy. Even prior to the ruling in Dobbs, access to abortion services was very uneven across the country, and these geographic disparities have only widened.

Telehealth

Telehealth has grown as a delivery mechanism for abortion services, accounting for 28% of abortions in 2025. While procedural abortions must be provided in person in a clinical setting, medication abortion can be provided in a clinical setting or via telehealth without an in person visit. 

Access to medication abortion via telehealth was limited for many years by an FDA policy that permitted only certified clinicians to dispense mifepristone within a health care setting. In December 2021, however, the FDA permanently revised this policy and no longer requires clinicians to dispense the drug in person. Additionally, in January 2023, the FDA finalized a policy change that allows retail pharmacies to dispense medication abortion pills to patients with a prescription. These policy changes opened the door to using telehealth for medication abortion.  

  • Telehealth can be administered by providers from traditional brick-and-mortar clinics or by virtual-only clinics. Virtual clinics began to proliferate after the FDA revised its in-person dispensing requirement in 2021, rising from no virtual clinics in 2020 to 226 clinics in 2023.  
  • In a telehealth abortion, the patient typically completes an online questionnaire to assess (1) confirmation of pregnancy, (2) gestational duration and (3) blood type. If determined eligible by a remote clinician, the patient is mailed the medications. This model does not require an ultrasound for pregnancy dating if the patient has regular periods and is sure of the date of their last menstrual period (in line with ACOG’s guidelines). If the patient has irregular periods or is unsure how long they have been pregnant, they may need to obtain an ultrasound to confirm the weeks of gestation and rule out an ectopic pregnancy and send in the images for review before receiving medications. The follow-up visit with a clinician can also happen via a telehealth visit.  
  • Research has found that the provision of medication abortion via telehealth is as safe and effective as the provision of the pills at an in person visit. Yet, in some states that have not banned the provision of abortion, telehealth may not be available because of state-level restrictions enacted prior to the Dobbs ruling that effectively ban telehealth for abortion care.  
  • Medication abortion has emerged as a major legal and legislative front in the battle over abortion access across the nation. Multiple cases have been filed in federal and state courts regarding aspects of the FDA’s regulation of medication abortion as well as the mailing of medications.  
  • Some states have passed shield laws that bar the clinicians’ resident state from extraditing them if a restrictive state attempts to prosecute the clinician for performing an abortion that is otherwise legal in their home state. Telehealth abortions include those provided by brick-and-mortar clinics, virtual clinicians, and clinicians in states with shield laws who prescribe medication abortion to patients in states with telehealth restrictions or laws banning or restricting the provision of abortion. 
Pie chart showing the breakdown of telehealth and in-person abortions in 2025. Nearly three in ten (28%) abortions now occur via telehealth.

Self Managed Abortions

Self-managed abortions typically involve obtaining medication abortion pills from an online pharmacy that will send the pills by mail or by purchasing the pills from a pharmacy in another country, usually without the involvement of a physician or advanced practice clinician. While this can involve asynchronous contact with non-US-based clinicians, it does not typically involve a direct consultation with a clinician either in person or via telehealth. 

It is difficult to track the volume of self-managed abortions since they are outside of the formal health care system, and it is unknown if all people who receive medication pills take them. One study estimated that at least 26,000 additional self-managed medication abortions took place in the six months following the Dobbs ruling.

Interstate Travel

The Guttmacher Institute Monthly Abortion Provision Study is the only data source so far to provide in-depth information on interstate travel pre- and post-Dobbs. Guttmacher estimates that prior to Dobbs, nearly one in ten people obtained an abortion by traveling across state lines in 2020. Even before Roe v Wade was overturned, abortion was highly restricted in many states. The latest data show that 155,000 patients traveled out of state for abortion care in 2024, a slight drop from 170,000 in 2023 but nearly double the number of travelers in 2020 (81,000). This has been offset by an increase in patients who are getting abortion pills via telehealth. 

The states with the highest number of people traveling inbound for abortion care border at least one state where the provision of abortion is banned, including Illinois, North Carolina, Kansas, and New Mexico. 

How much do abortions cost?

Copy link to How much do abortions cost?

The costs of abortion services vary widely depending on the method, facility, and gestational length; the costs can be as low as $40 through virtual clinics but typically exceed $1,000 for abortions later in pregnancy.  

  • Obtaining an abortion can be costly. In 2023, the median costs for people paying out of pocket in the first trimester were $563 for a medication abortion and $650 for a procedural abortion (Figure 7). For people with low incomes, who are more likely to seek abortion care, these costs are often unaffordable.  
  • The costs for medication abortion services through virtual clinics, such as AidAccess and Abuzz, as well as self-managed sites, are typically lower than in person services. In 2023, the median cost of medication abortion from virtual clinics was $150. Costs at online pharmacies listed on Plan C range from a low of $40 for abortion pills by mail without clinician consultation, to upwards of $150 for abortion by mail with a clinical consultation. 
  • The costs of abortion are higher in the second trimester compared to the first, with median self-pay reaching or exceeding $1000. In the second trimester, more complex procedures may be needed and local options are more limited in many communities that have fewer facilities. The state bans and restrictions enacted since Dobbs can also result in additional nonmedical expenses for transportation, childcare, lodging, and lost wages.  
  • While some people use their insurance to pay for the costs of abortion care, most people pay out of pocket. Some people can obtain assistance from local abortion funds, which are independent organizations that help pay for some of the costs of abortion services, typically medical care, travel, and accommodations if needed. Most abortion funds are regional and have connections to clinics in their area, but they do not reach all people seeking services.
Columns chart summarizing the median out-of-pocket cost of medication abortion, first trimester procedural abortion, and second trimester procedural abortion in 2023. While each service exceeded 0, the median cost of second trimester procedural abortions was almost double the median cost of medication abortions.

Does private insurance or Medicaid cover abortions?

Copy link to Does private insurance or Medicaid cover abortions?

Insurance coverage for abortion services is heavily restricted in certain private insurance plans and public programs like Medicaid and Medicare.   

Among women of reproductive age, approximately six in ten are covered by private insurance, one in five are covered by Medicaid, and one in ten are uninsured.  

Prior to the Dobbs ruling, several states had enacted private plan restrictions and banned abortion coverage from ACA Marketplace plans. As of September 2026, there are 10 states that have policies restricting abortion coverage in private plans and 25 that ban coverage in any Marketplace plans. Since the Dobbs ruling, some of these states have also banned the provision of abortion services altogether. Conversely, 13 states require state-regulated private plans to cover abortion, ten of which require no cost-sharing for abortion.

For decades, the Hyde Amendment has banned the use of federal funds for abortion in Medicaid, Medicare and other public programs unless the pregnancy is a result of rape, incest, or if it endangers the pregnant person’s life. States have the option to use state-only funds to cover abortions under other circumstances for those on Medicaid, which 21 states do currently.  

Data from 2021, prior to Dobbs, estimated that a quarter (26%) of abortion patients used Medicaid to pay for abortion services, 11% used private insurance, and 60% paid out of pocket. People in states with more restrictive abortion policies were more likely to pay out of pocket compared to people living in less restrictive states. 

A map of the United States highlighting health insurance coverage restrictions for abortion services. This includes Medicaid, private, and marketplace limitations; Medicaid and marketplace limitations; Medicaid limitations only; and, marketplace limitations only. Most states have at least one restriction.13 states require abortion coverage in all of these plans, while 6 states have no coverage limitations or requirements.