Women’s Experiences with and Attitudes Towards Family Support Policies
Findings from the 2026 KFF Women’s Health Survey
Introduction
There has been increased attention on declining fertility rates in the U.S. and globally. Fertility rates have been falling for many years, but they have been in the spotlight of media coverage recently, in part because of the current Administration’s focus on pronatalist policies aimed at encouraging people to have more children. Considerable financial and structural barriers face people who want to start families, including expensive and limited childcare options, inconsistent and limited paid leave and workplace flexibility, low economic mobility, and high cost of living.
The 2026 KFF Women’s Health Survey is a nationally representative survey of 4,688 women and 1,148 men ages 18 to 64, fielded between March 11, 2026 to April 14, 2026. This analysis presents data among women 18 to 49 (n=3,538) and men 18-49 (840), and highlights women’s opinions regarding the possible impact of potential federal actions on their decision to have children in the future as well their experiences with paid parental leave and sick leave in the workplace.
Key Takeaways
- One in four women ages 18 to 49 say they are considering having children in the next three years. Less than a quarter of reproductive age women (23%) are considering having or adopting a child in the near future, including 24% of those who do not currently have children (under 18 years old). Six in ten women (63%) say they are not planning on having children in the next three years.
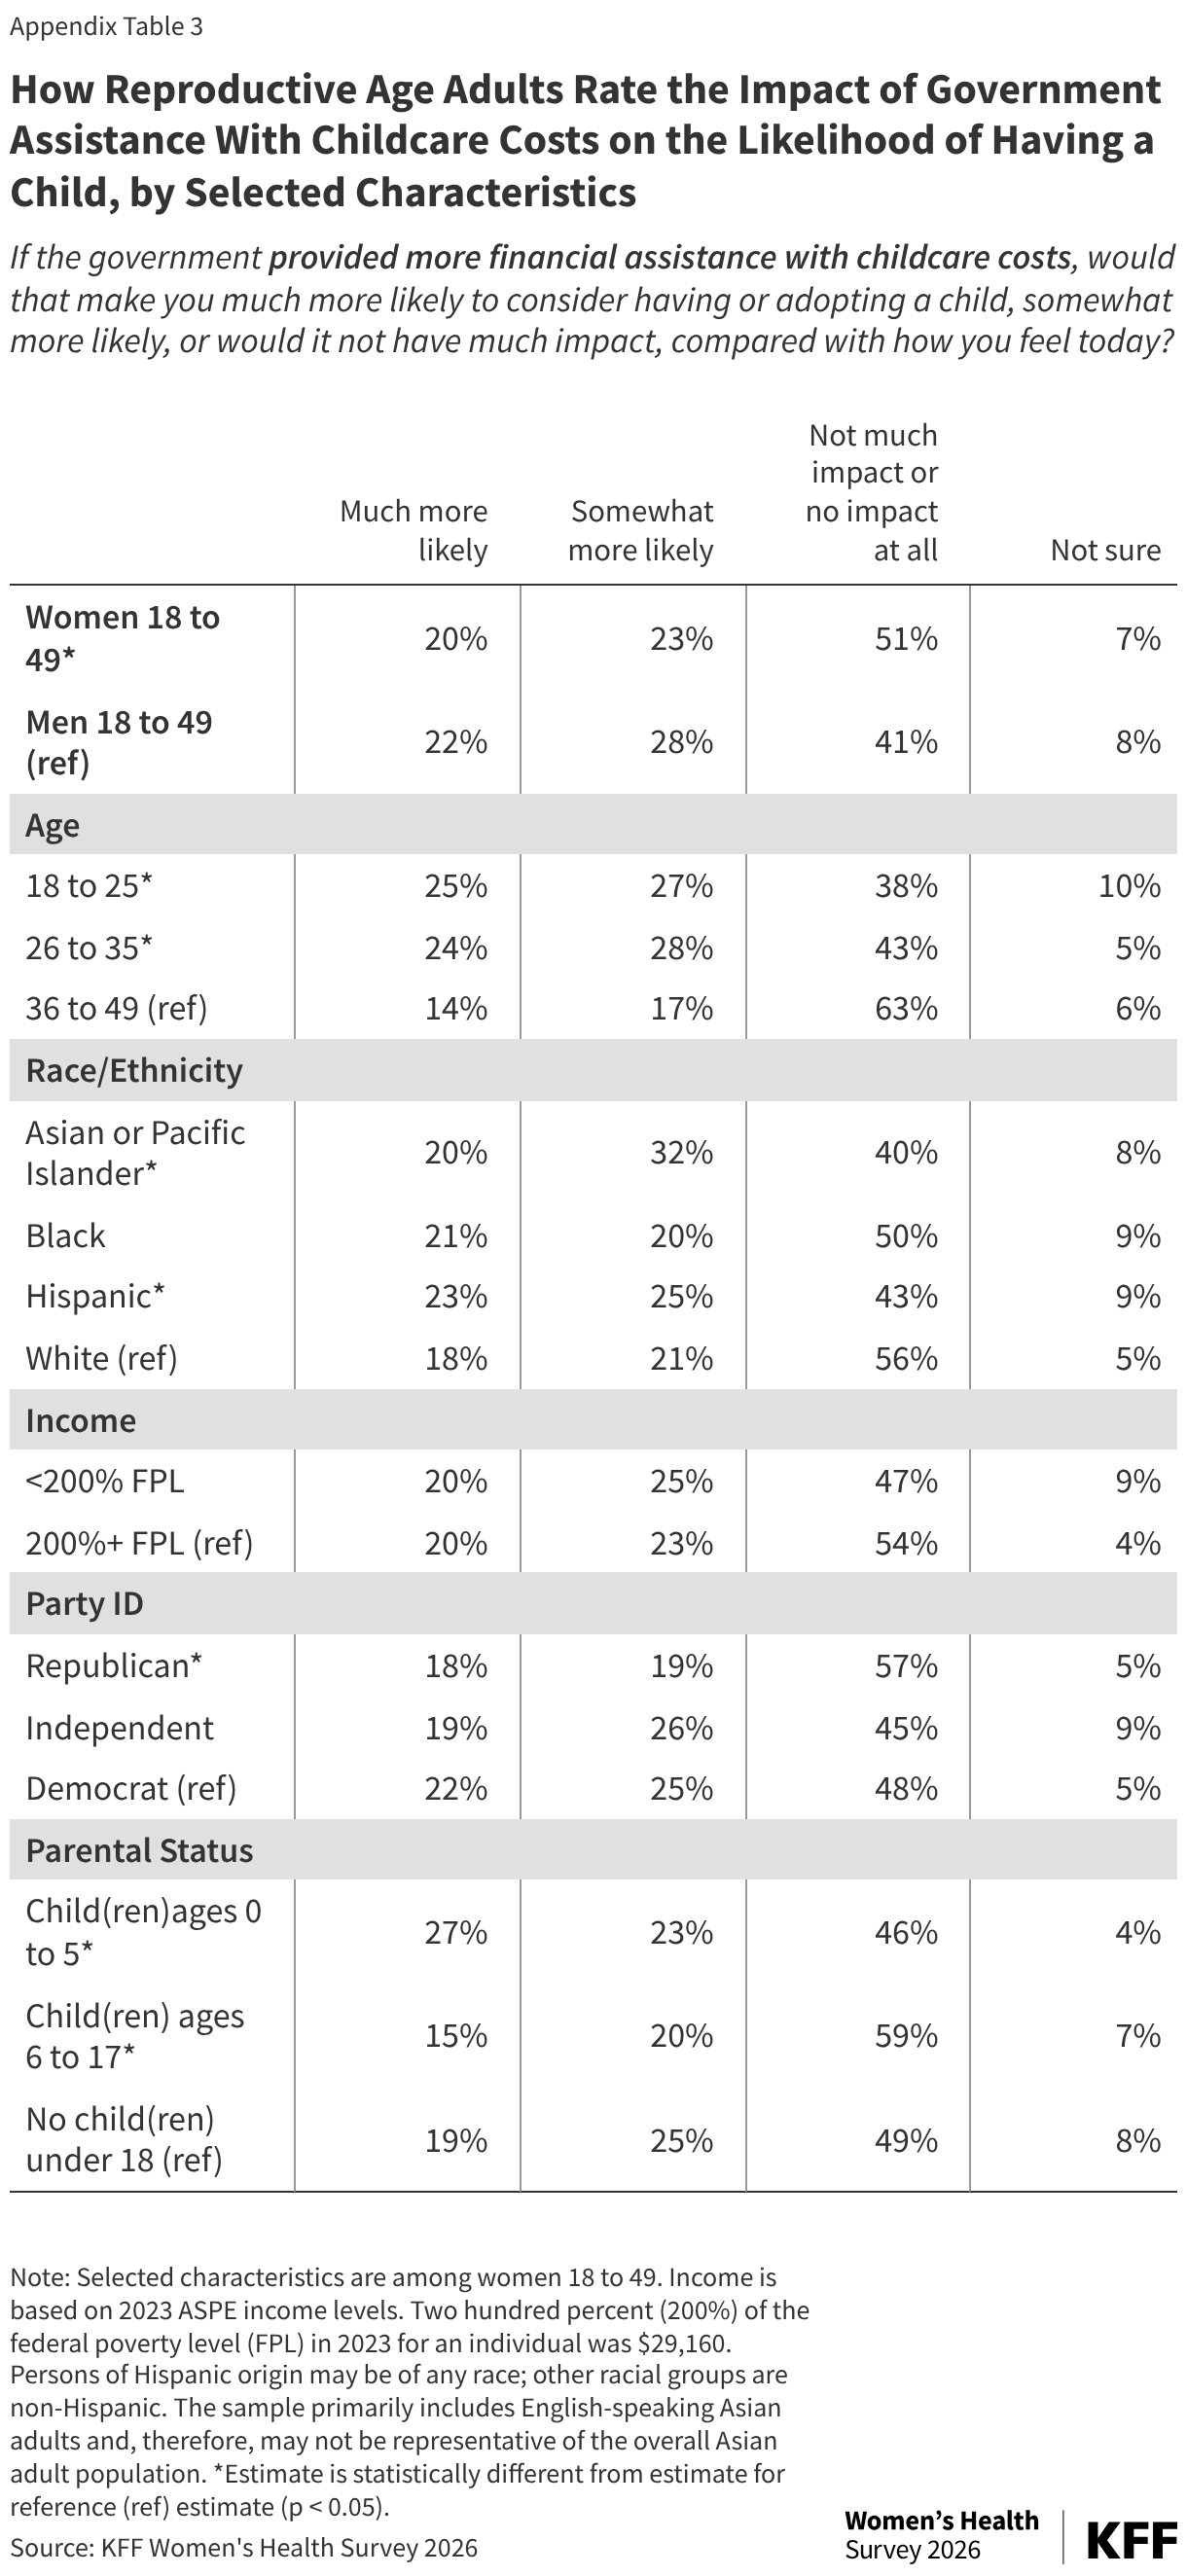
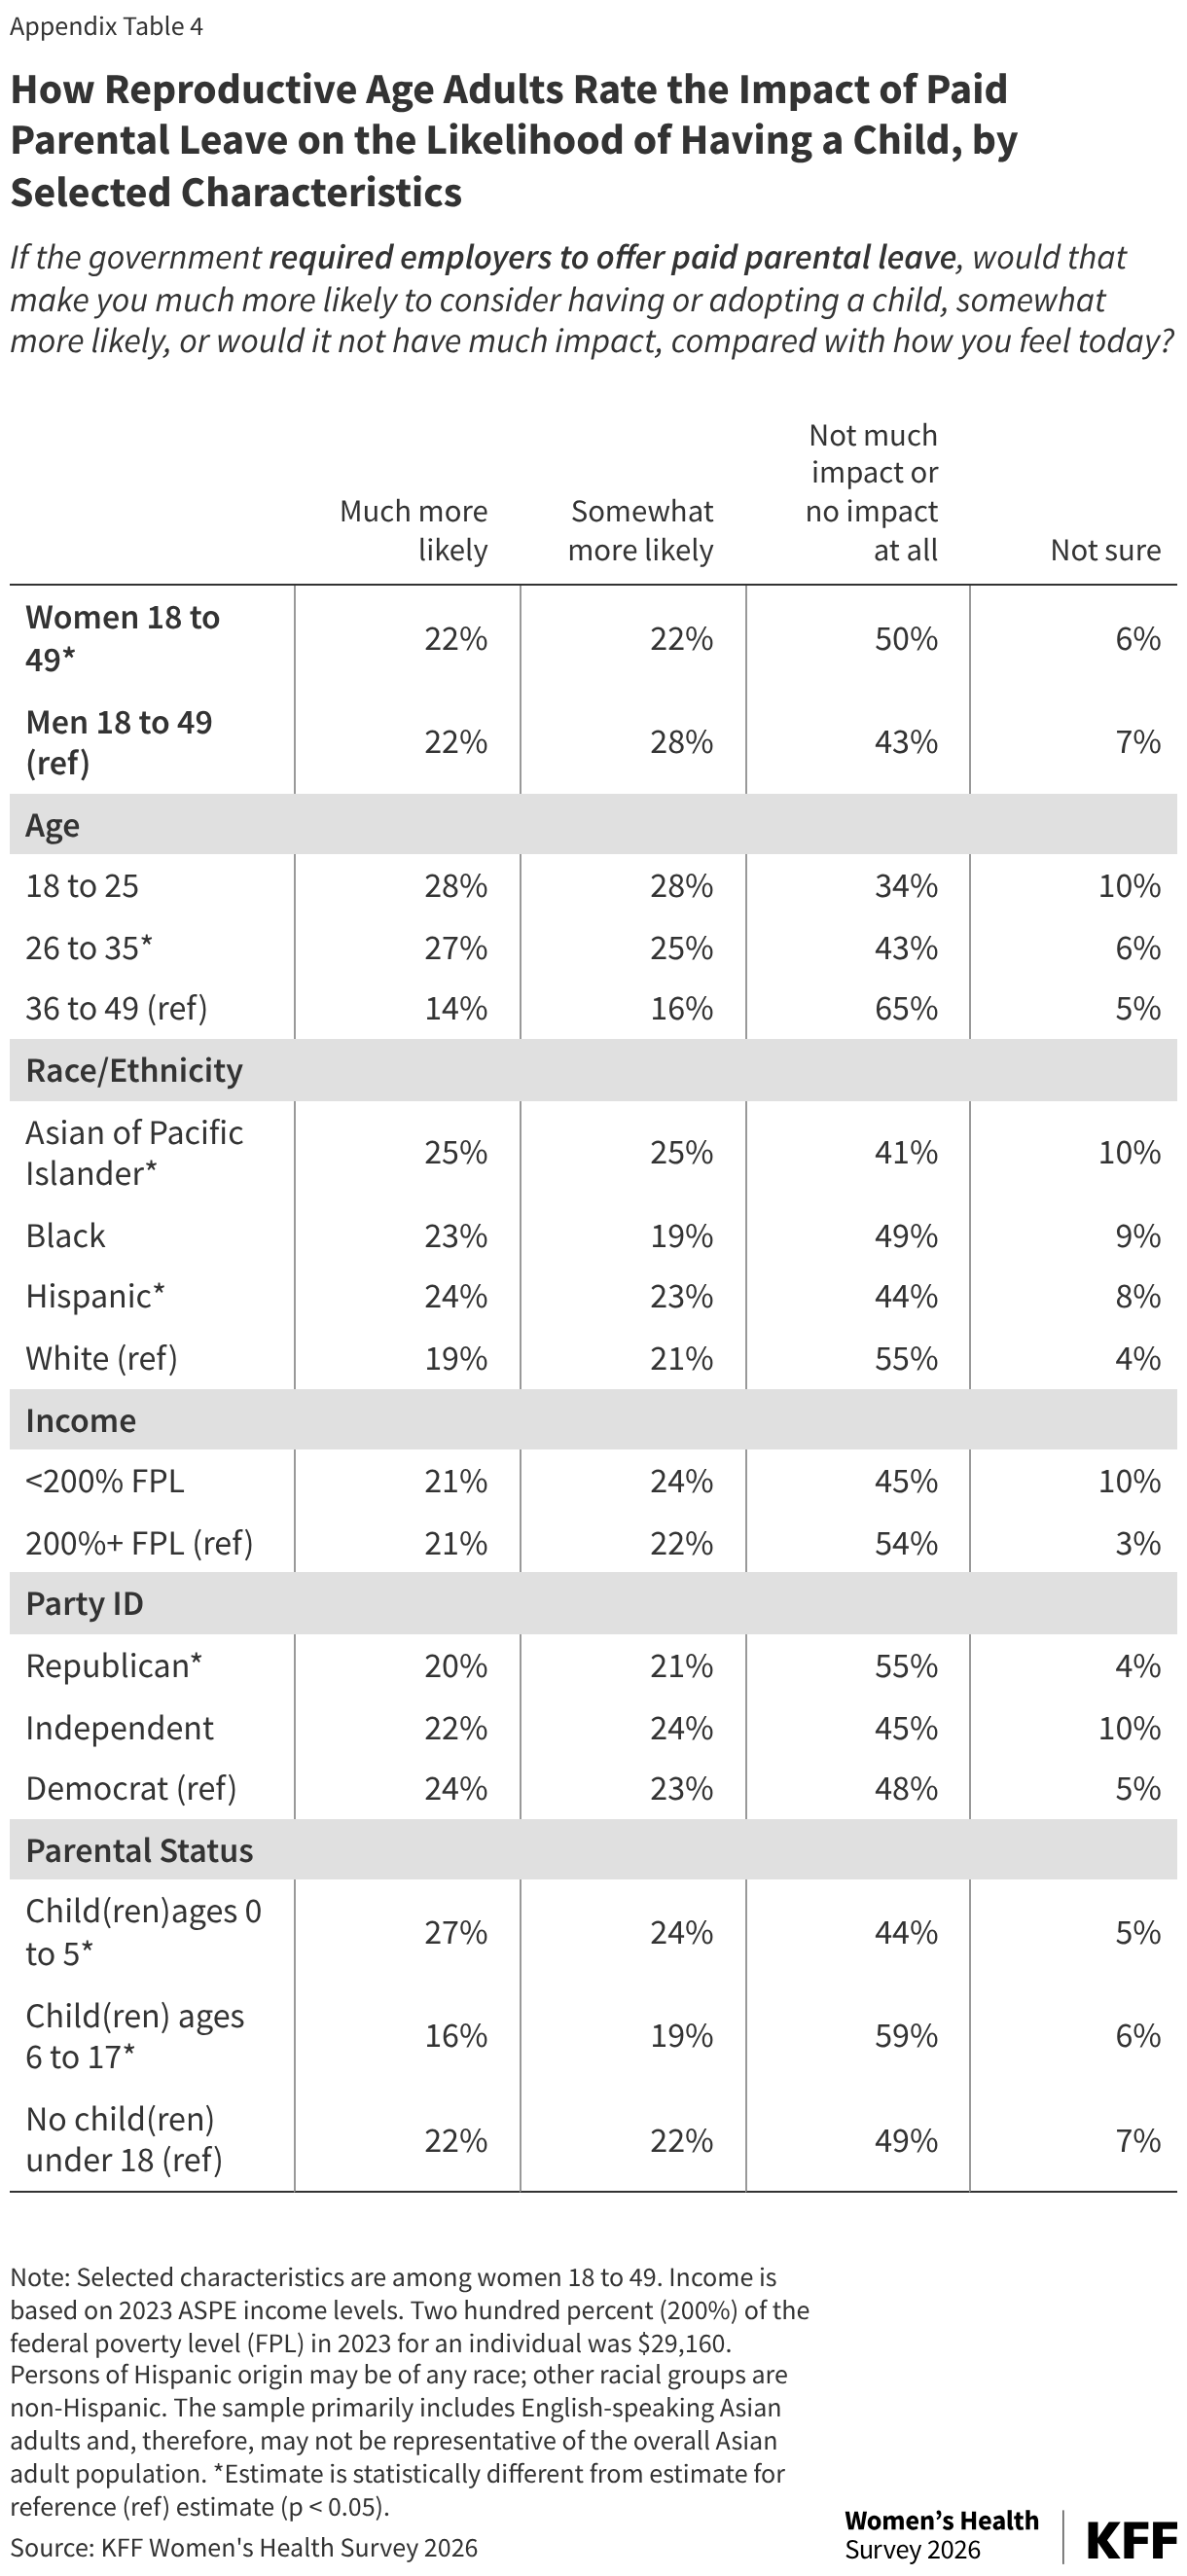
- While the majority of reproductive age women say that greater family support policies such as assistance with childcare costs and mandatory paid parental leave would not affect their plans to have children, some say they would be more likely to consider growing their families if these policies were in place. Four in ten women say they are more likely to consider having children if the government assisted with childcare costs (43%) or required employers to offer paid parental leave (43%). This rises to about seven in ten among women who are already considering having a child in the near future. Half of men say these two policies would make them more likely to consider having children.
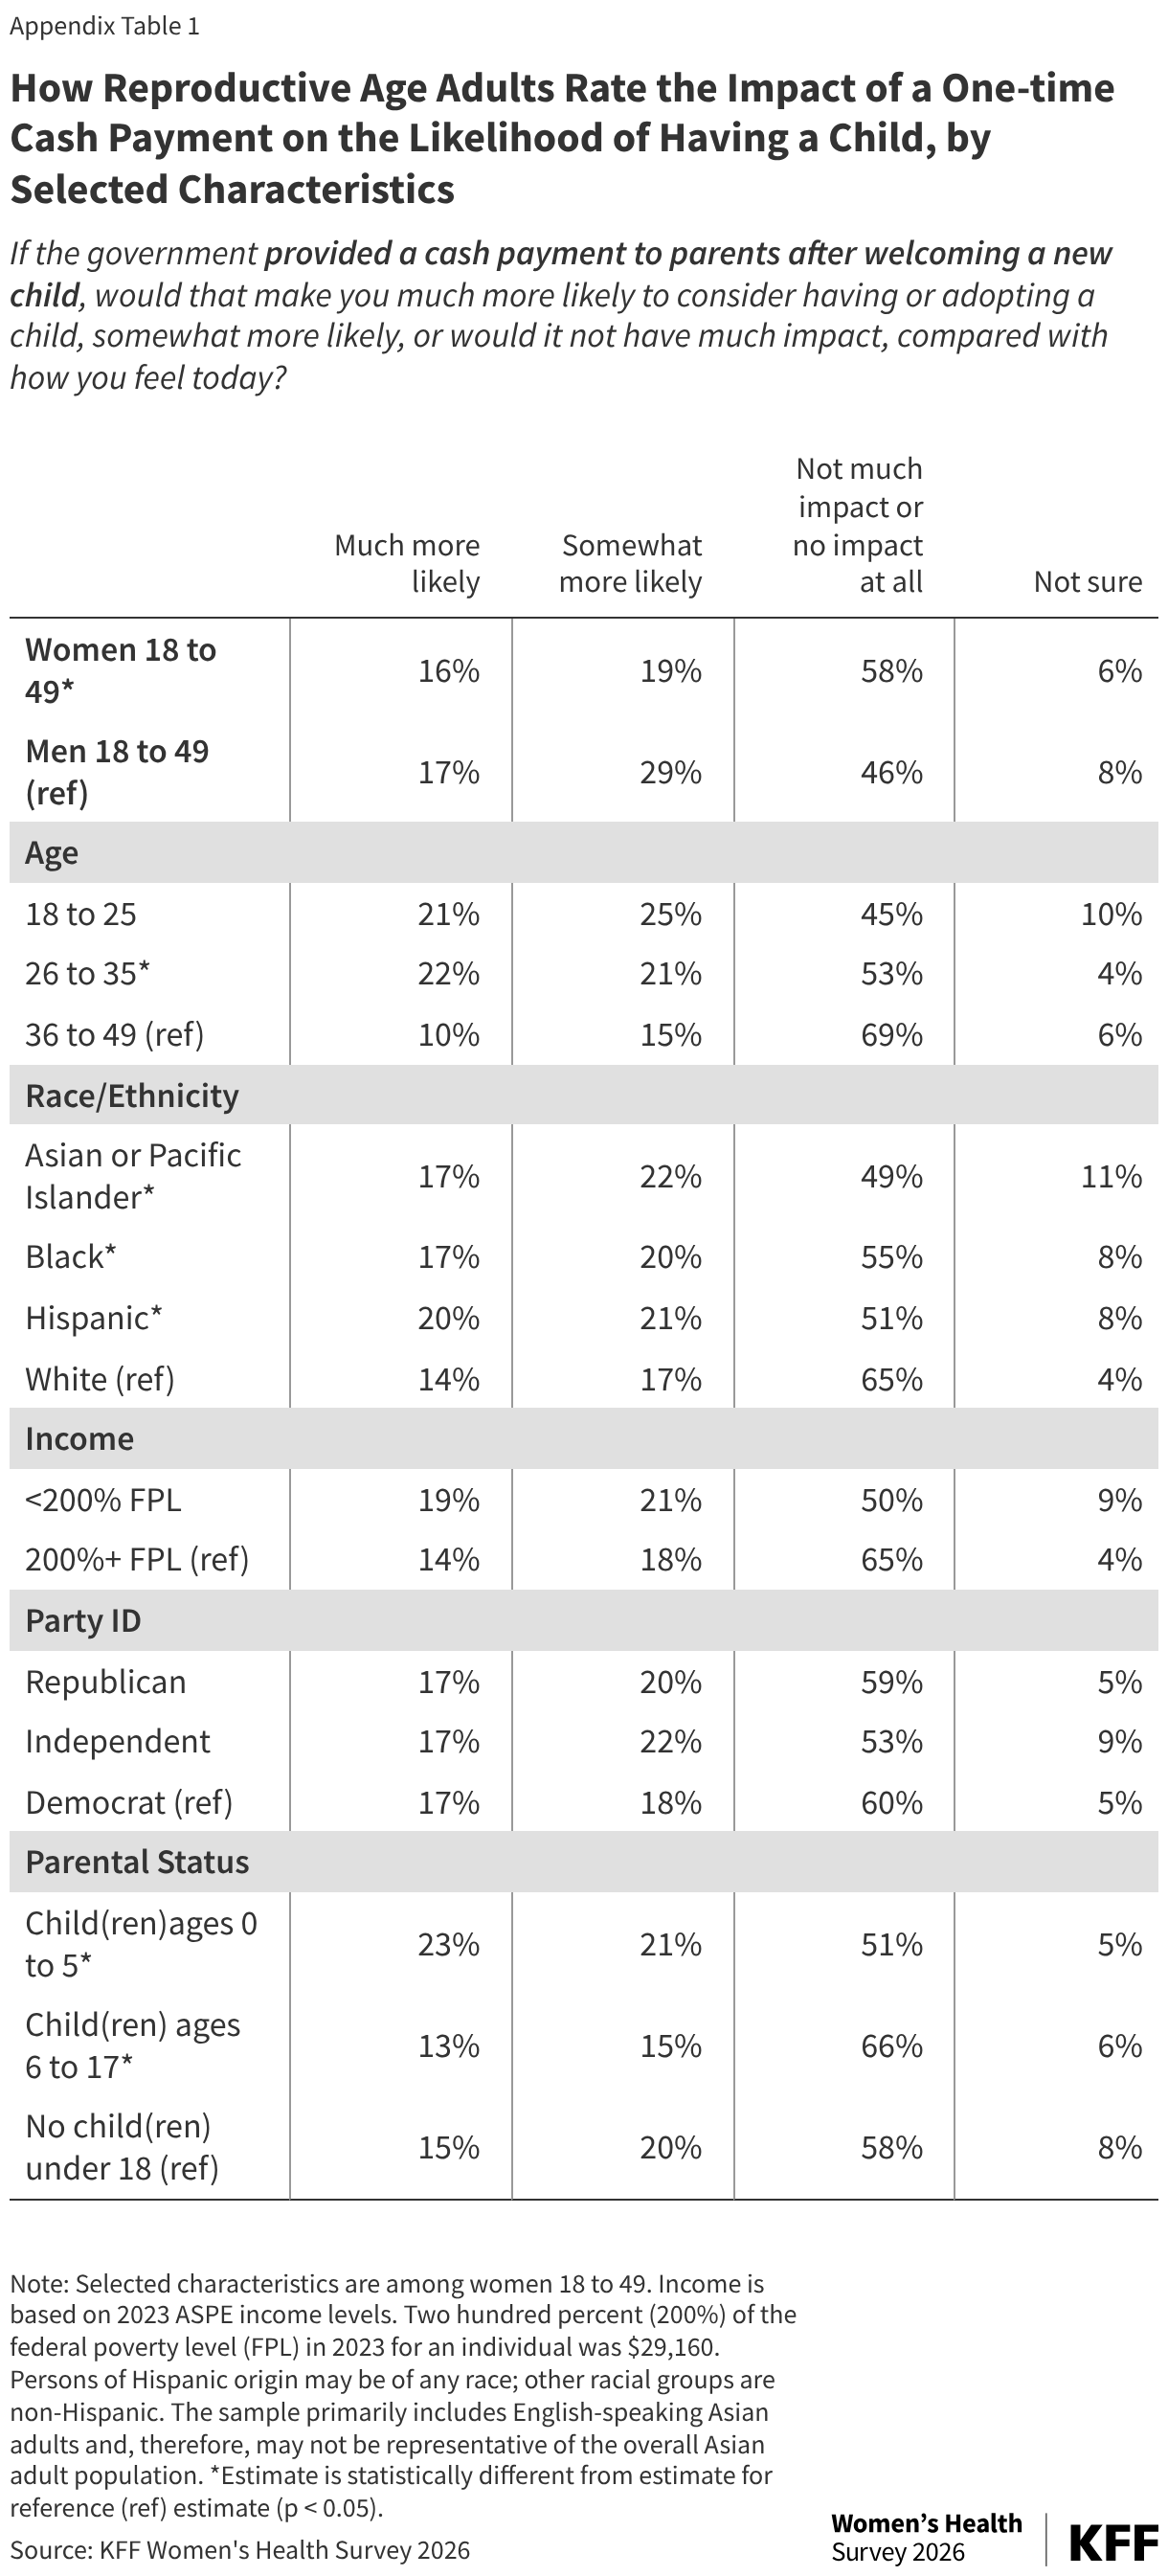
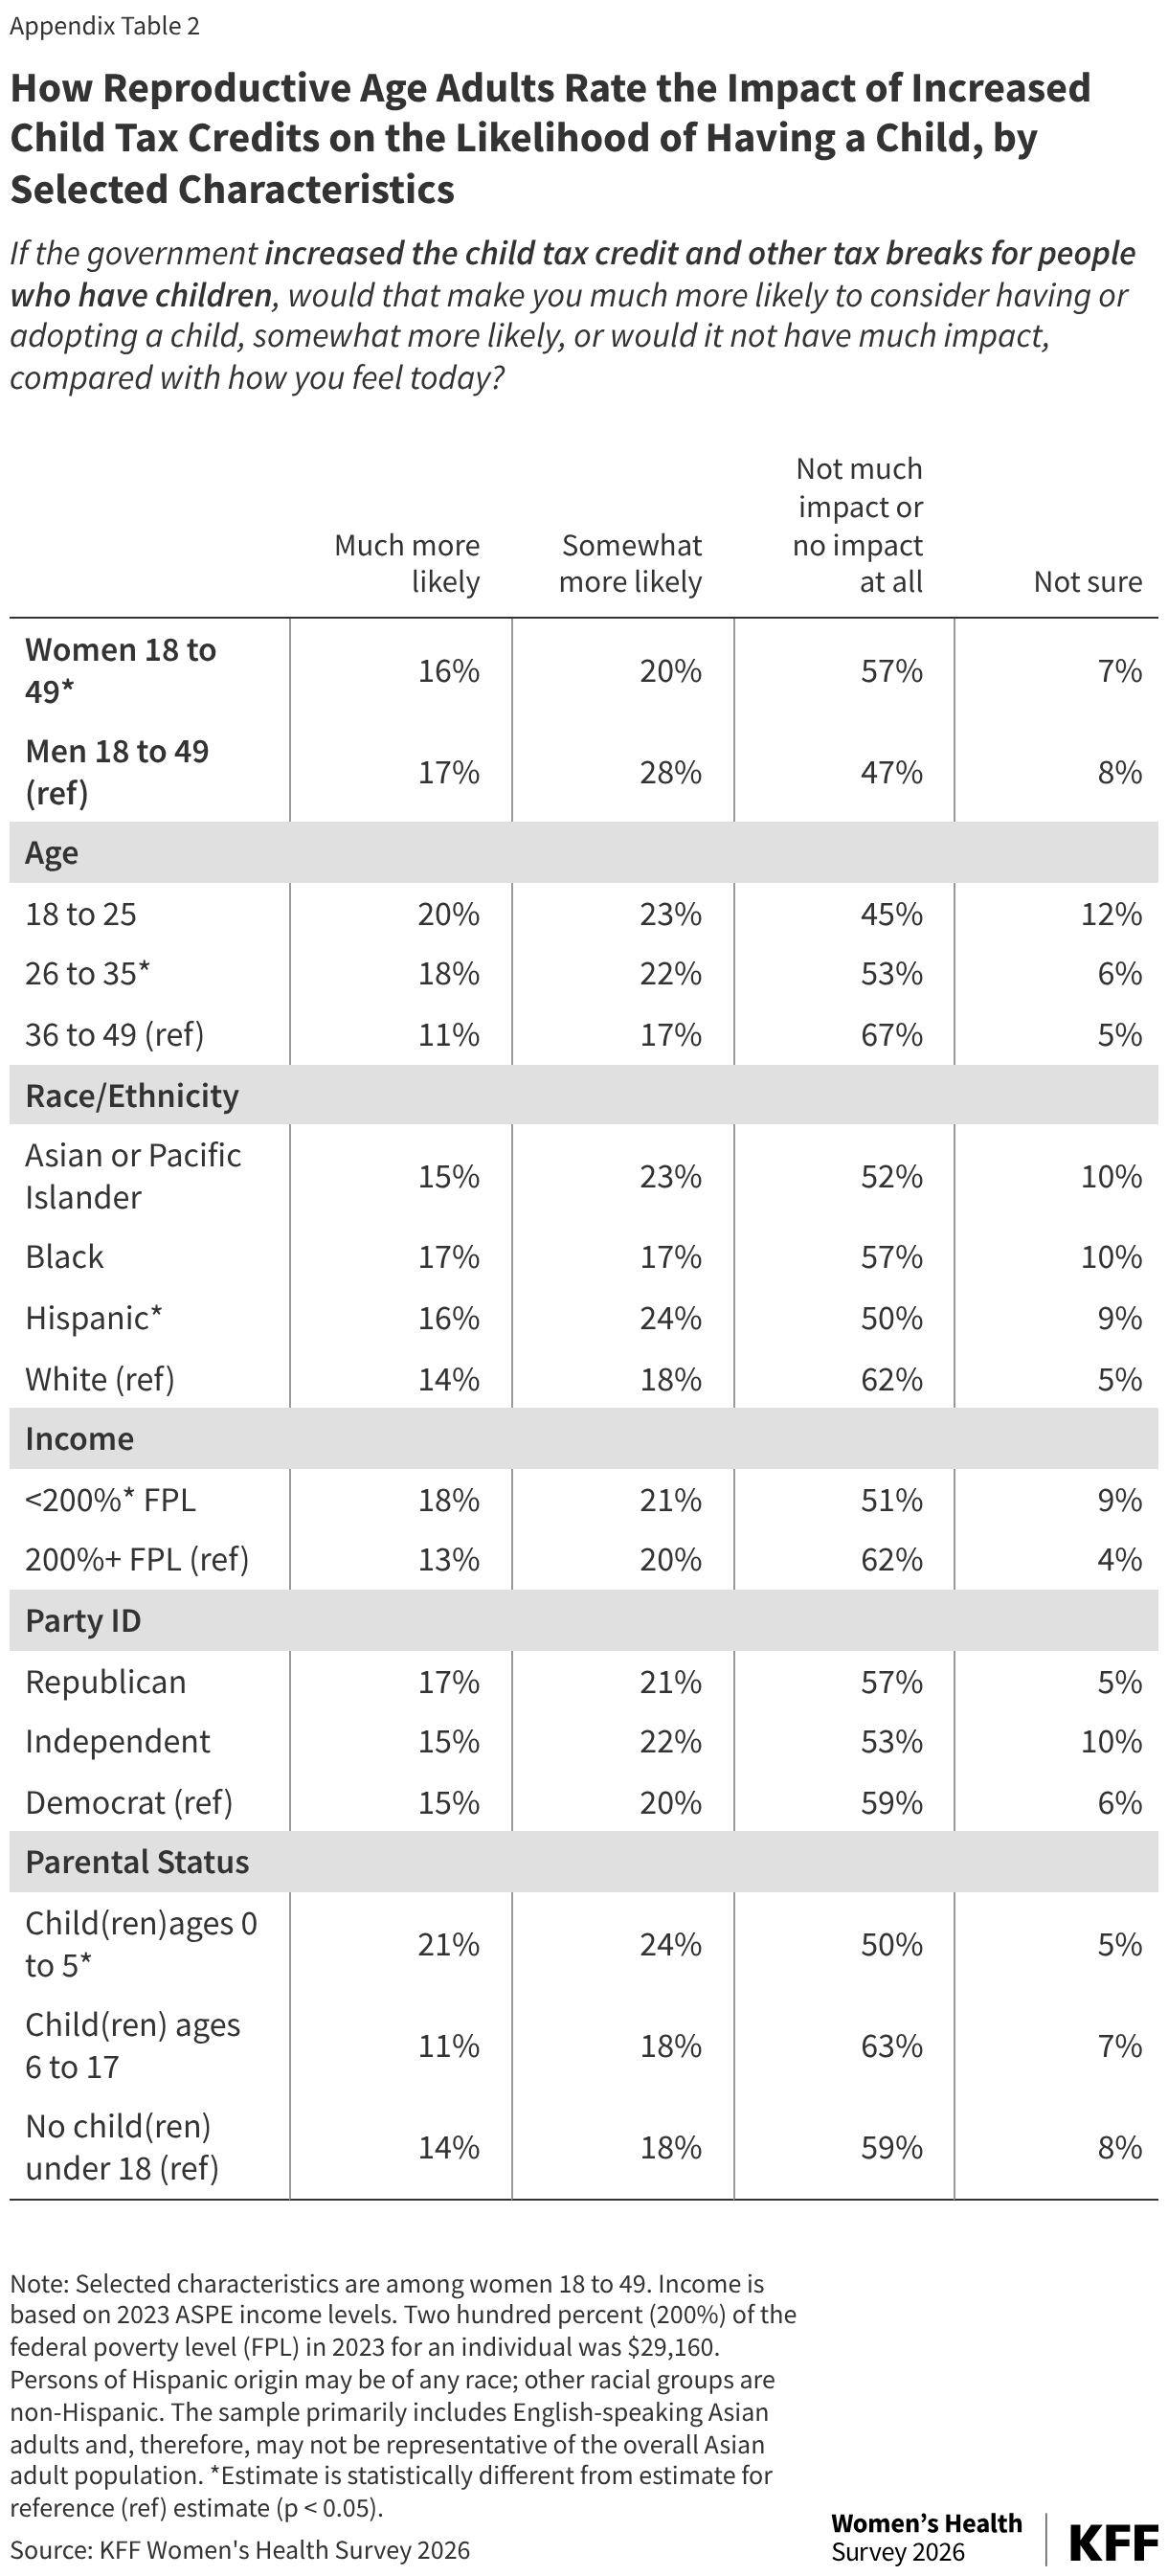
- Compared to government assistance with childcare costs and mandatory paid parental leave, somewhat fewer women say the expansion of the child tax credit and one-time cash bonuses for a new child in the family would make them more likely to have children in the near future. One-third of reproductive age women say that if the government increased the child tax credit (35%) or provided a one-time cash payment to parents after welcoming a new child (35%), they would be much or somewhat more likely to consider having a child.
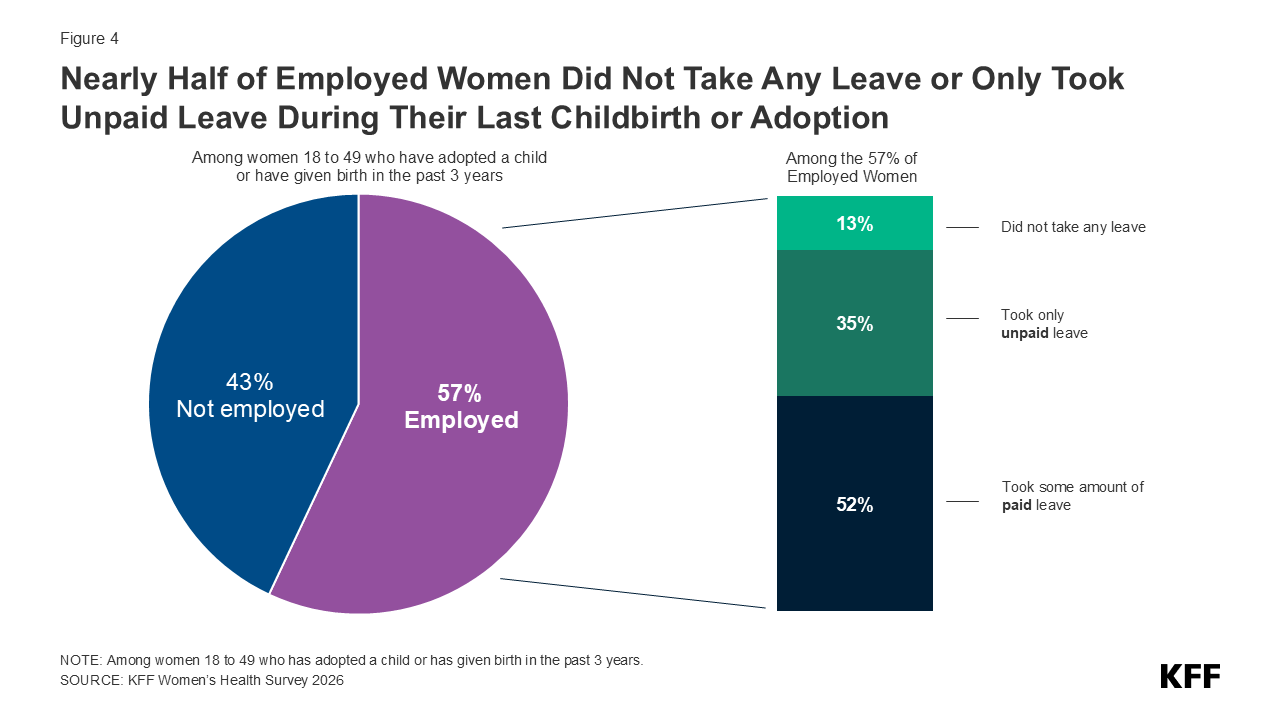
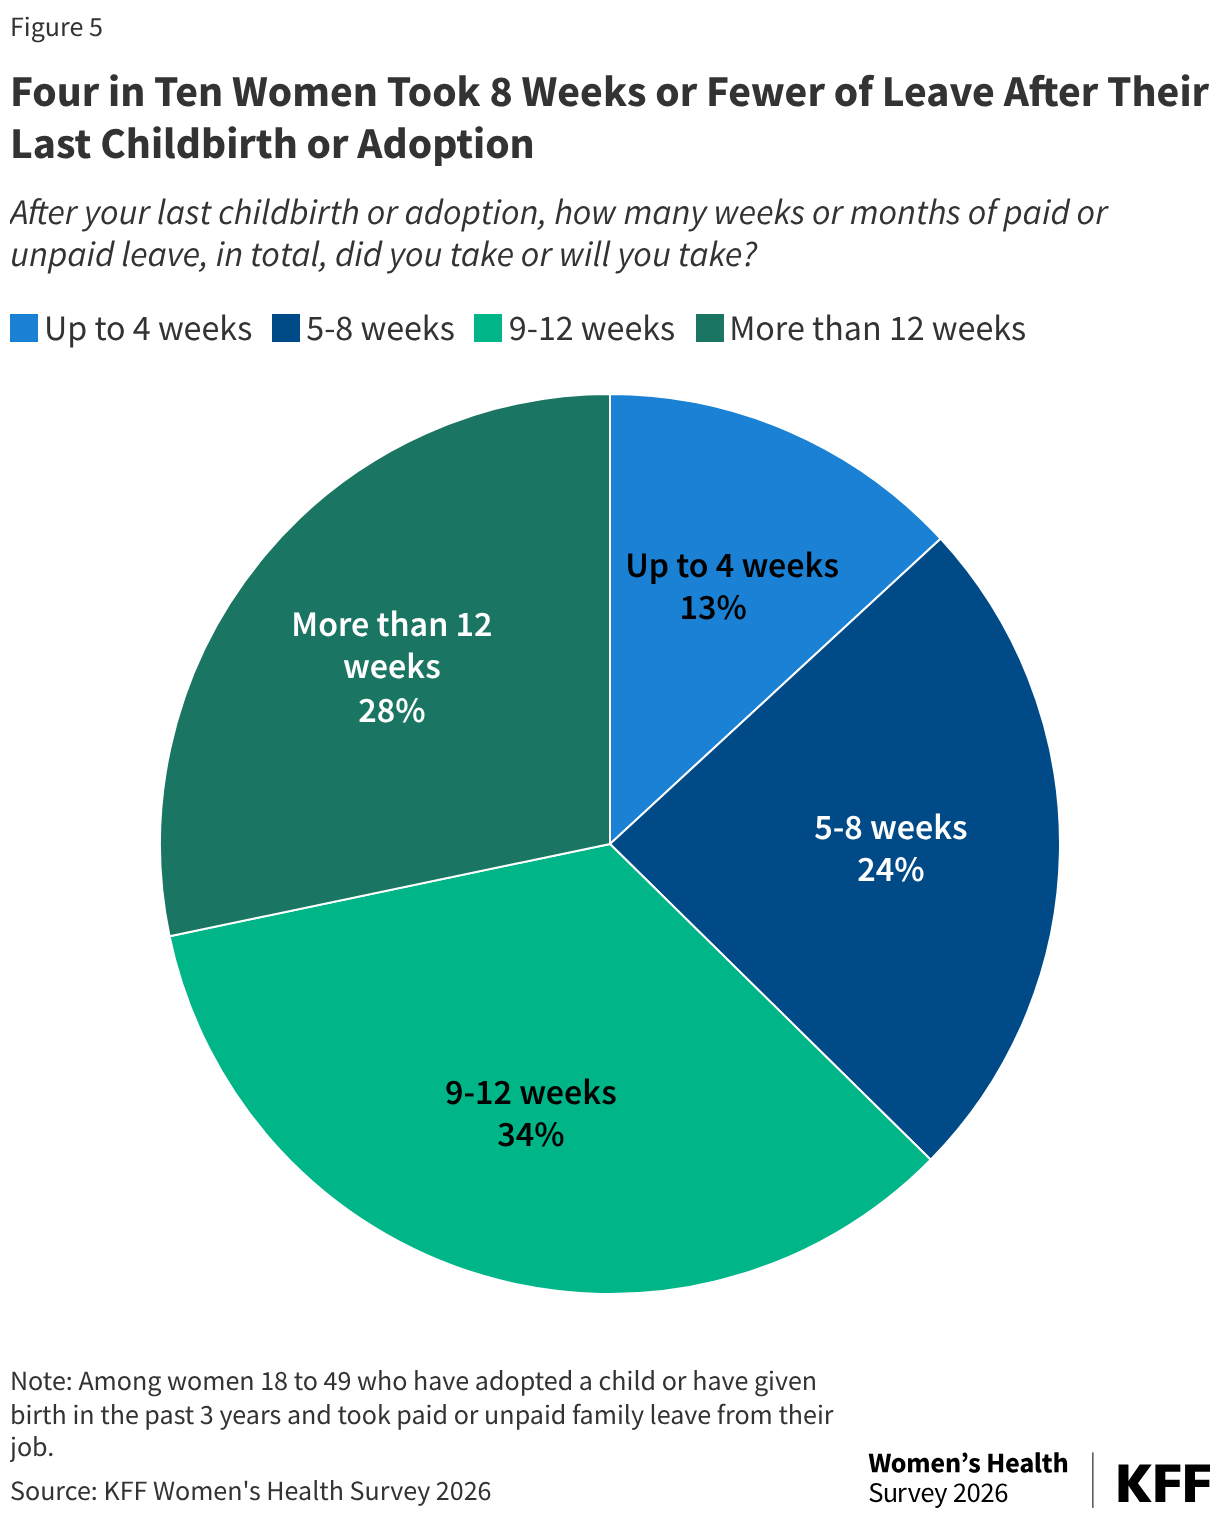
- There is wide variation in the types and amount of parental leave women take, including whether they take any at all. Among employed women who had or adopted a child in the past three years, half (52%) took some amount of paid leave. About one-third (35%) took only unpaid leave, while more than one in ten (13%) did not take any leave after the arrival of their child. Among those who took leave, four in ten (37%) took up to two months of time in total, one third (34%) took between 9 to 12 weeks of leave, and 28% took more than 12 weeks off.
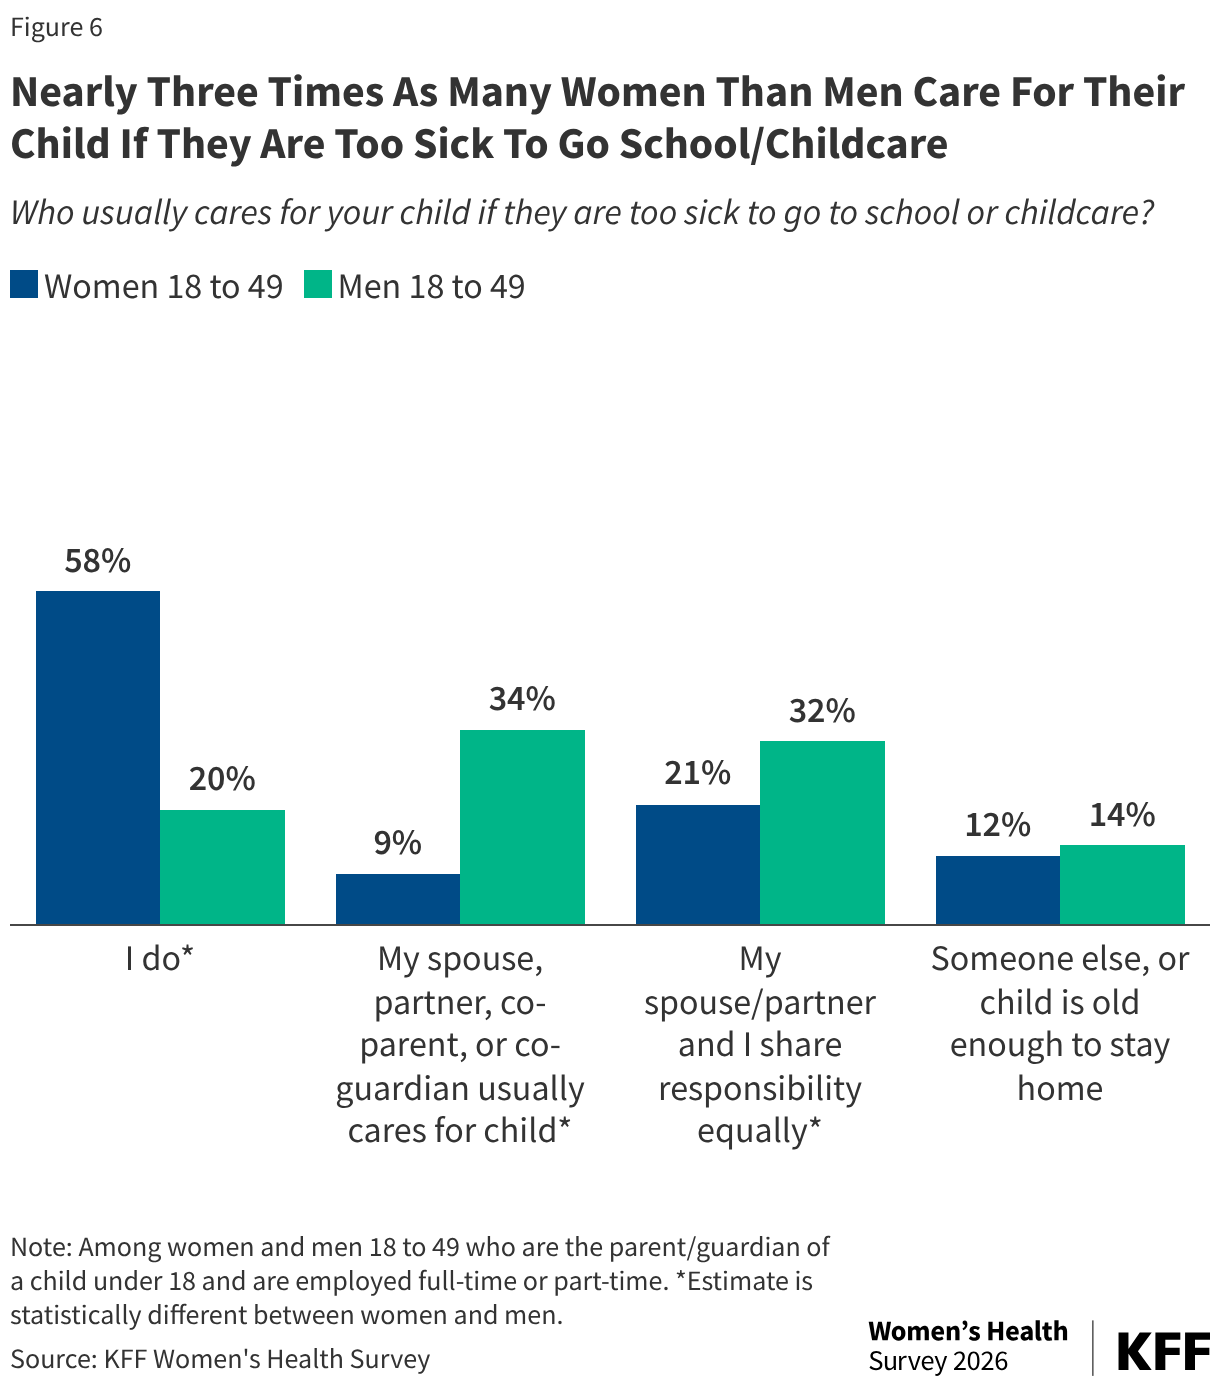
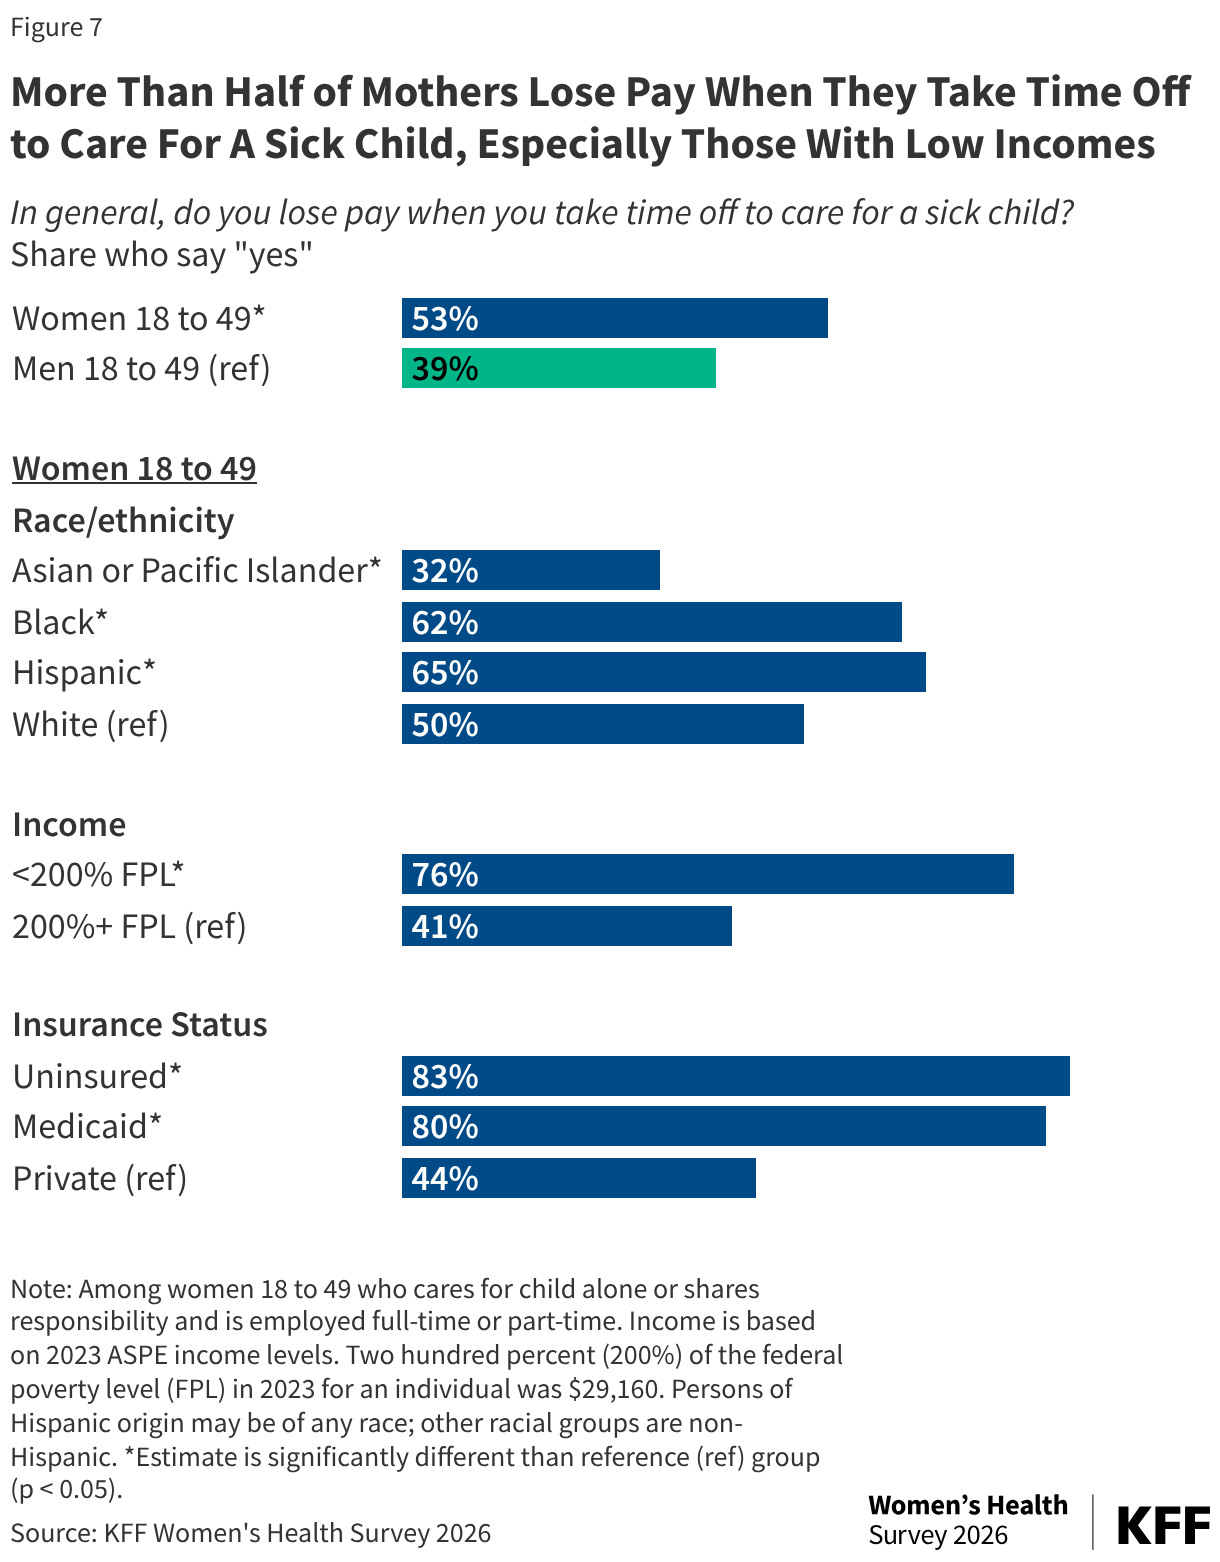
- Women are the primary caretakers for children when they are sick at nearly three times the rate of men, and many women lose pay when they take time off. Nearly three times as many working women (58%) than men (20%) say they are the ones who care for their child when they are sick and cannot go to school. Among these women who care for their child either alone or with a partner, half (53%) report losing pay when they miss work.
Findings
Family Building
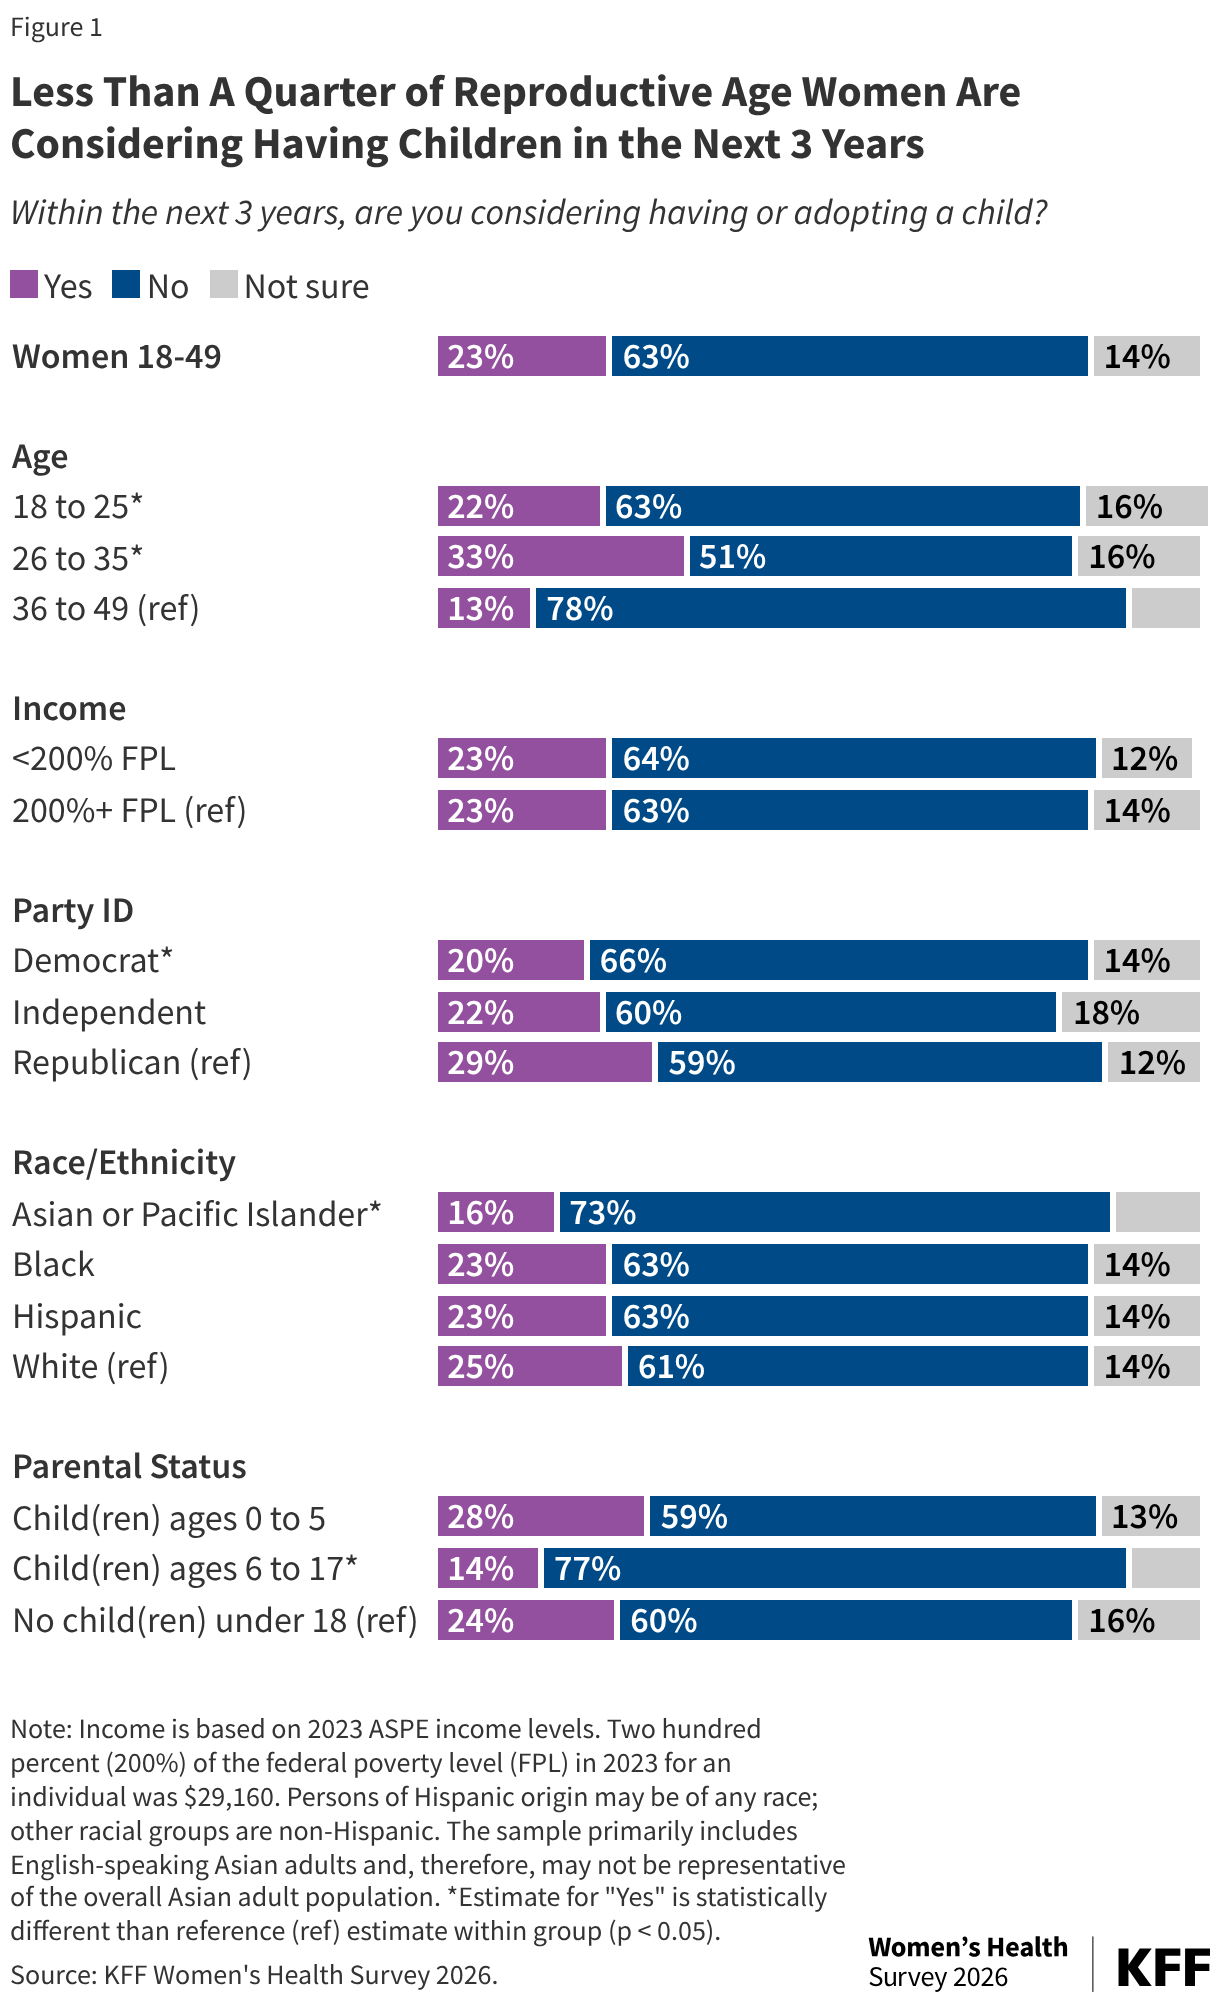
The majority of reproductive age women say they are not planning on having children in the next three years, including those who are already parents of a young child. About one in four women age 18 to 49 (23%) are considering having or adopting a child in the next three years (Figure 1). Larger shares of younger women between the ages of 18 and 25 (22%) and between 26 and 35 (33%) say they are planning on having children compared to women in their later reproductive years (13%). By political affiliation, more Republican women (29%) than Democrats (20%) plan on having children in the next three years. Almost half (45%) of reproductive age women are already parents to a child under 18 years old (data not shown). Half as many parents with older children (14%) than parents of younger children (28%) are planning on having another child in the next three years.
Influence of Potential Family Supports
The costs of having children and raising a family have never been higher. The current administration and other conservative policymakers have been pushing for young Americans to start families and have more children to address concerns about the declining birth rate in the U.S. They have discussed some ideas that they say would help, such as “Trump Savings Accounts,” a “motherhood medal” for women with six or more children, and most recently, using childcare subsidy funds to pay stay-at-home parents. The Administration has also proposed policies aimed at expanding access to fertility care such as in vitro fertilization (IVF), including discounts on medications and clarifying insurance rules for employers that want to offer fertility benefits to their workers.
Many factors come into play when people are thinking about having a child, including cost of living and income, the cost of raising a child, or certainty about having children. Previous KFF research has found that affordable and high-quality childcare is particularly daunting and difficult to find. Some policymakers have been advocating for policies that are intended to support families by offering broader financial assistance.
The survey probed whether people would be more likely to have children if the government did each of the following:
- expanded the child tax credit
- offered a one-time cash bonus for a new child in the family
- provided more financial assistance with childcare costs
- required employers to offer paid parental leave
Overall, less than half of reproductive age women say that enhanced family support policies would make them more likely to consider having a child.
About one-third of reproductive age women say that they would be much more likely or somewhat more likely to consider having a child if the government increased the child tax credit (35%) or provided a one-time cash bonus to parents after welcoming a child (35%). Most women say that these two policies would not have much or any impact on whether they have a child (Figure 2).
The federal child tax credit lowers the amount of taxes that parents/guardians of dependent children under age 18 owe. In 2021, the American Rescue Plan Act (ARPA), a COVID relief law, included a temporary expansion of the child tax credit. Research has found that the policy lowered the rate of child poverty, but that its economic benefits were uneven across different populations.
In the past few years, some states and locales have experimented with different models of cash payments to new parents, and recently, the Trump Administration launched tax-preferred investment accounts available to families with children, with the federal government providing an initial $1,000 deposit for the youngest children.
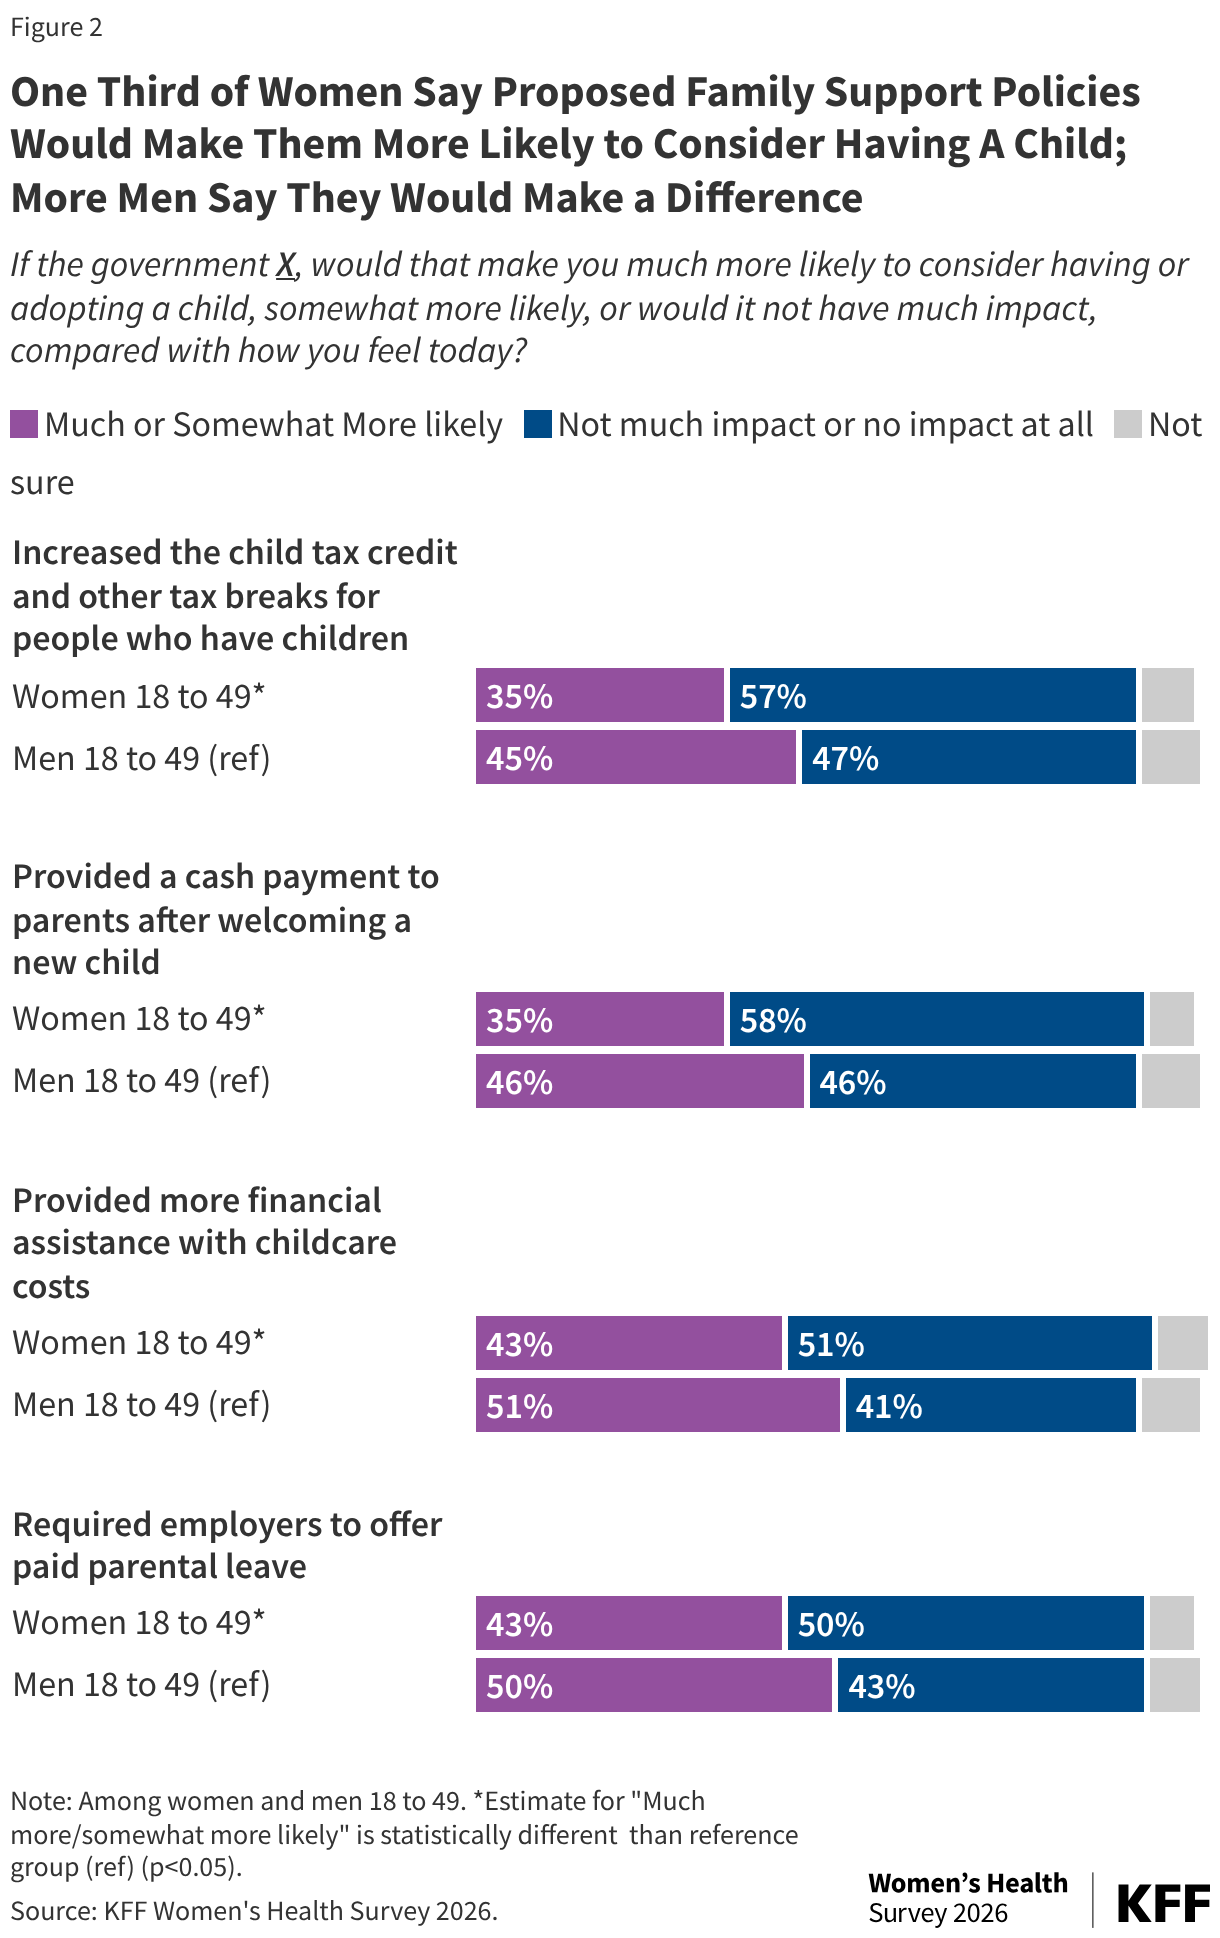
About four in ten reproductive age women say that if the government provided more financial assistance with childcare costs (43%) or required employers to offer paid parental leave (43%), they would be more likely to consider having a child, but half say that these two policies would have little or no impact. Higher shares of women who are Asian or Hispanic say they would be more likely to consider having a child if these policies were in place (Appendix Tables 3, 4).
Nationally, the average cost of childcare exceeds $13,000 annually, and many parents say that affordable childcare is difficult to obtain. Government assistance with childcare expenses can come in various forms, such as vouchers to help pay costs, public preschools, and tax incentives. Furthermore, the United States is one of the few industrialized nations that does not require employers to provide paid time off for new parents, but some states have enacted paid leave policies that cover a portion of their workers’ salaries.
Consistently, slightly higher shares of men than women say if the government required more family supportive policies that would make them more likely to consider having a child. More than four in ten men ages 18 to 49 say if the government increased the child tax credit (45%) or provided a one-time cash bonus to parents (46%) that they would be much more or somewhat more likely to consider having a child (Figure 2). About an equal share of men, though, say that these policies would not make much difference or any at all. Half of men say they would be more likely if the government provided more assistance with childcare costs or mandated paid parental leave. About four in ten men say these policies would not have much or any impact (Figure 2).
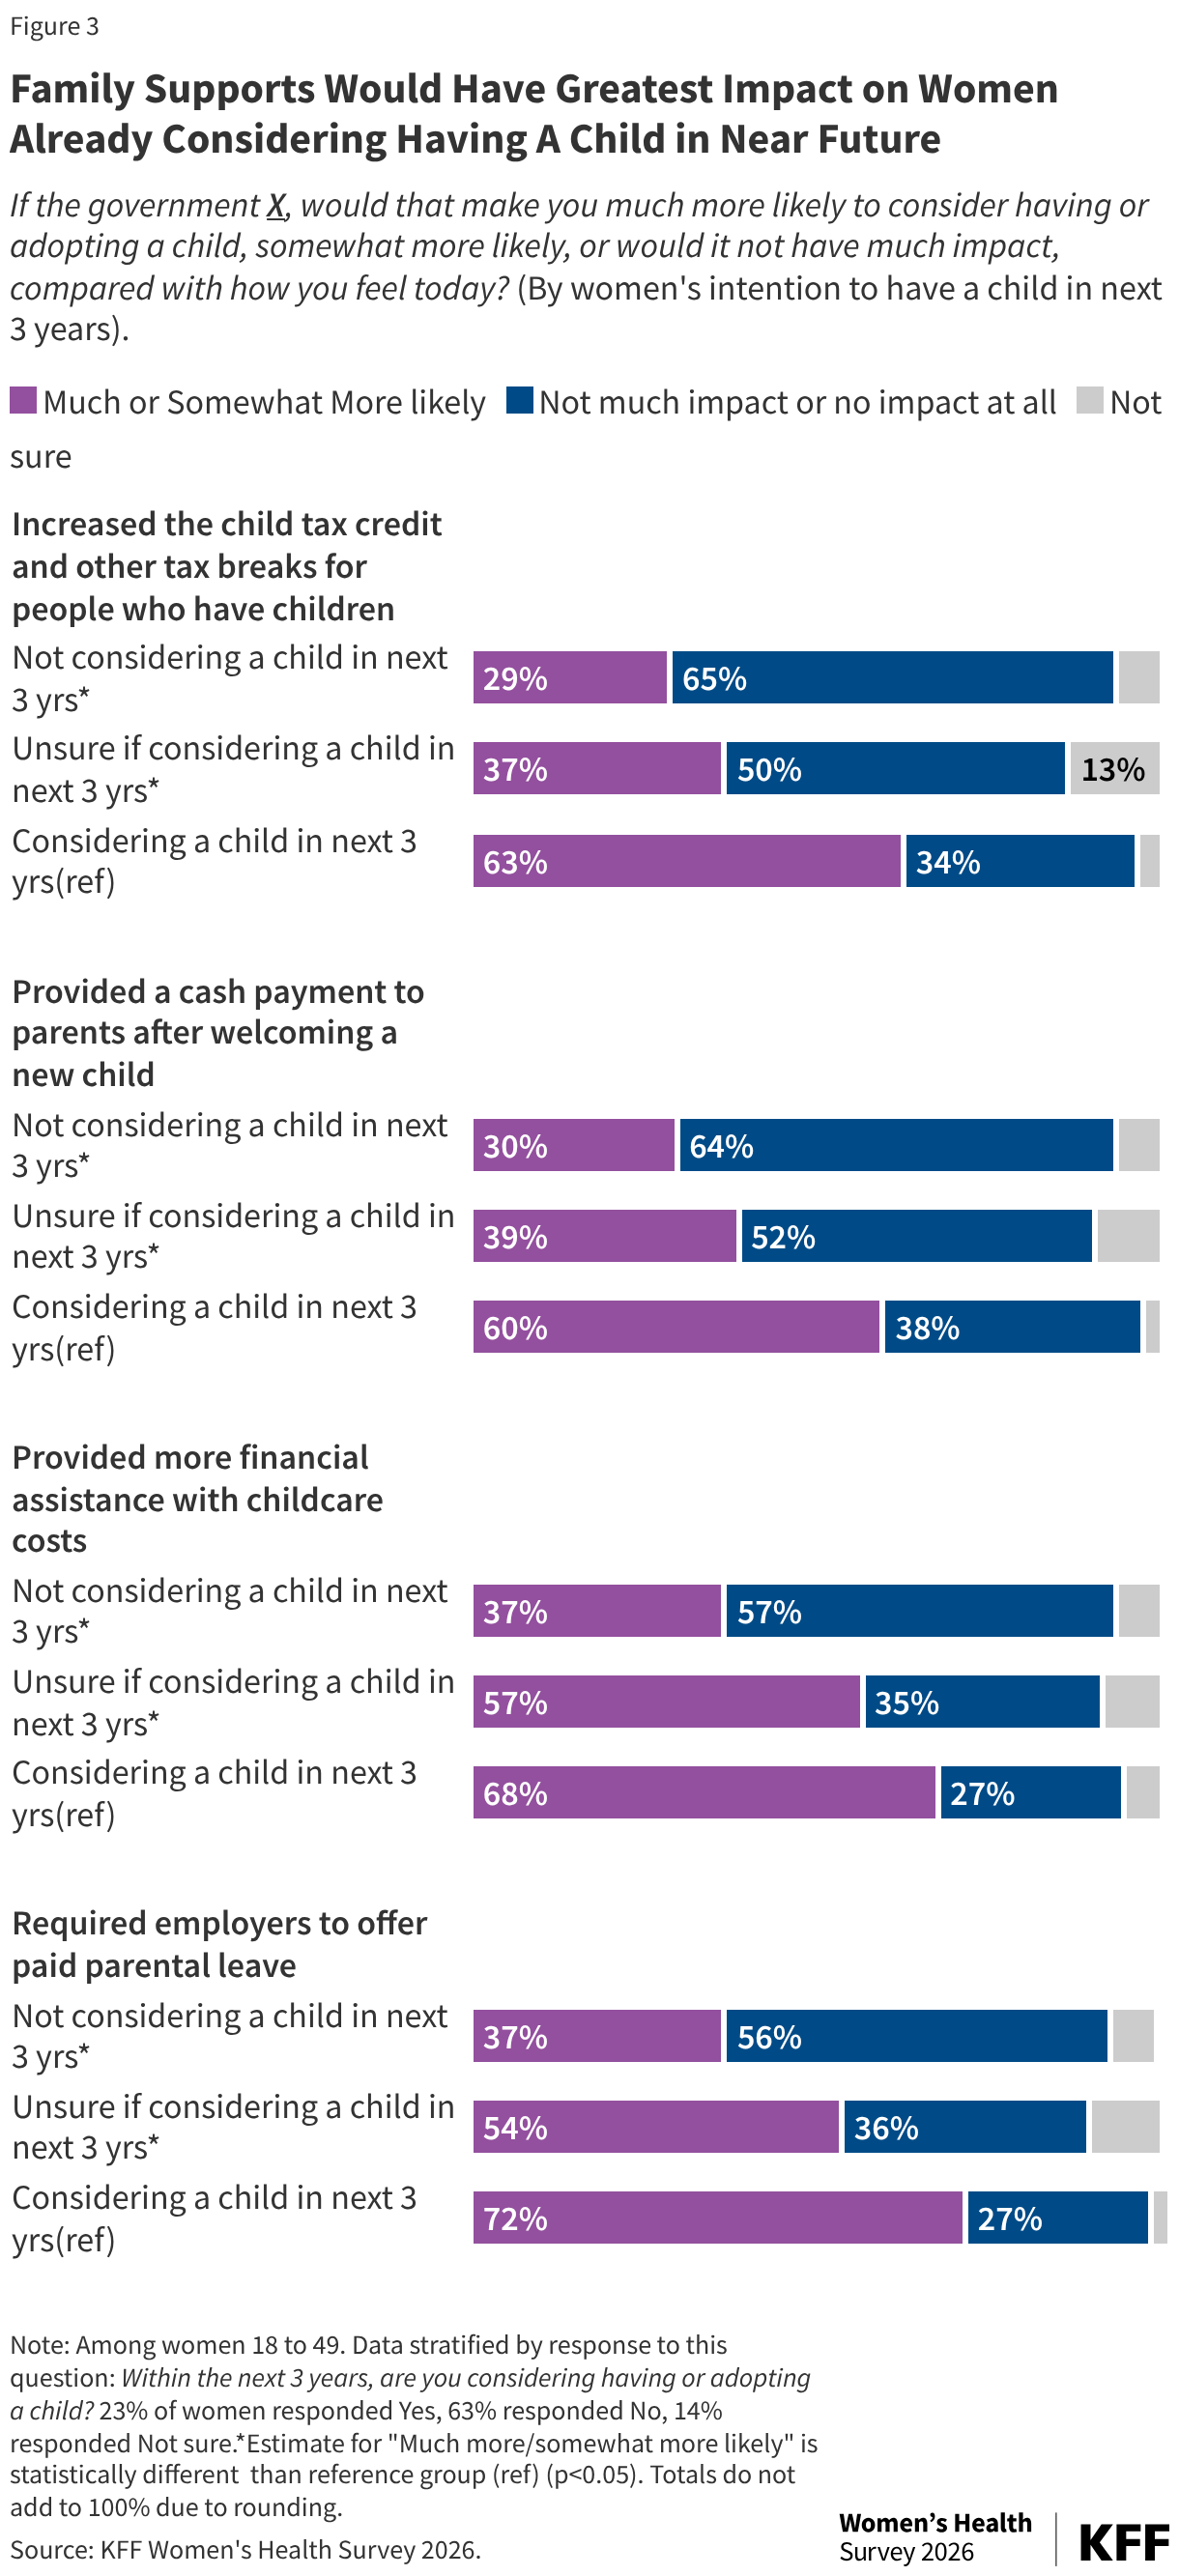
Compared to increased child tax credits and one-time cash incentives, government assistance with childcare expenses and mandatory paid parental leave would make reproductive age women more likely to consider having children, but the rates are highest among those already considering having children. About seven in ten reproductive age women who say they are considering having a child in the next three years also say they would be more likely to consider having a child if the government offered assistance with the costs of childcare (68%) or required paid parental leave (72%) (Figure 3). Notably, more than half of reproductive age women who are unsure about having a child in the next three years also say that support with childcare costs (57%) and paid parental leave (54%) would make them more likely to have children. However, just over one-third (37%) of women who are not considering having a child in the near future say these policies would affect their childbearing plans, but most say they would not make much difference or any at all.
Paid Parental Leave
Among the family support policies the survey asked about, the largest share of women said that paid parental leave would make them more likely to consider having a child. Paid parental leave benefits have been found to be associated with positive health outcomes, including shorter recovery times for women after childbirth, stronger bonding attachments with newborns, and greater access to breastfeeding. Yet, the United States is one of the few industrialized nations that does not have a national paid leave standard for parents caring for a new child or workers that need leave work to care for themselves or family members due to an illness or health condition. The federal Family and Medical Leave Act (FMLA) requires eligible employers to provide certain workers unpaid family leave, but only a minority of workers in the private sector have a paid family leave benefit. This gap has garnered increasing attention among elected officials at the national and local levels, and more than a dozen states now have paid leave policies in place.
More than half of women who had a child in the past three years (57%) were employed at the time, and about half (52%) took some paid time off after the arrival of their child (Figure 4). While most employed women took some time off work after childbirth or adoption, more than one in ten (13%) did not take any time off. Half (52%) took time off and were paid for at least a portion of that time, while 35% took only unpaid time off.
Among women who took leave after having a child, about four in ten took up to two months or 8 weeks of leave (Figure 5). There is a wide range in the amount of time women take off work after having a child in the U.S. Thirteen percent (13%) of women who had a child in the past three years report taking up to one month of leave, 24% took between five and eight weeks off, a third (34%) took between nine and 12 weeks, while only one in four took more than 12 weeks (28%). Twelve weeks is much shorter than the required maternity leave in most other developed countries, which averages around four months or 17 weeks of paid leave. The amount of parental leave women take in the U.S. is governed by several factors, including whether their employer is required by state law to offer parental and sick leave and the amount of wages they cover. Other factors affecting the amount of leave include their income, childcare availability, and their own or their infant’s health status and needs.
Paid Sick and Medical Leave
Like with parental leave, there is no federal law requiring employers to pay workers when they need time off to care for themselves, children, or other family members who are sick. However, far more employers do provide this benefit than not, and about eight in ten workers have some level of sick leave benefit. For workers with children, paid sick leave can allow them to stay home when their child is sick and cannot attend school without losing pay. Several states as well as cities require employers in their jurisdiction to provide a paid sick leave benefit to their workers.
Among working parents, a higher share of mothers than fathers report they are the ones that care for children when they are too sick to attend school. In addition to taking leave after the arrival of a child, many parents need to take time off when their children are sick and cannot attend school. Among working women, over half (58%) say they are the ones who usually take care of children when they are sick and cannot go to school, nearly three times the share of working fathers (20%) (Figure 6). One fifth (21%) of working mothers and three in ten working fathers (32%) say they share this responsibility equally with a spouse, partner, or co-parent. Only about one in ten (9%) working mothers say their spouse, partner, or co-parent usually takes on this responsibility, whereas this is the most common response among fathers (34%). Just over one in ten mothers (12%) and fathers (14%) say they can call someone else for childcare or their child can stay home alone. These numbers have remained steady over time and are similar to findings in 2022.
About half of working mothers report losing pay when they miss work to care for sick children who can’t go to school. When parents miss work to take care of their sick children, 53% of mothers and 38% of fathers say they are not paid for that time (Figure 7). This has a disproportionate impact on mothers, as they are more likely to care for children when they are sick.
Loss of pay is more common among women who are Black (62%) and Hispanic (65%), compared to those who are White (50%). Approximately three in four (76%) mothers with low incomes report losing pay when they miss work to care for sick children, compared to four in ten of those with higher incomes (41%).
Appendix
Methodology
The 2026 KFF Women’s Health Survey was designed and analyzed by women’s health researchers at KFF. The survey was conducted from March 11 – April 14, 2026, online and by telephone among a nationally representative sample of 5,854 adults ages 18 to 64, including 3,538 women ages 18 to 49. Women include anyone who selected woman as their gender. Sampling, data collection, weighting, tabulation, and IRB approval by the University of Southern Maine’s Collaborative Institutional Review Board were managed by SSRS of Glenn Mills, Pennsylvania in collaboration with women’s health researchers at KFF.
Throughout the reports of findings, we refer to “women.” This includes respondents who said their gender is “woman,” and includes those who selected “woman” in addition to another gender, such as “transgender,” or “non-binary,” or another gender. We followed this approach to try to include as many people as possible but recognize that some people who need and seek abortion and other reproductive health care services may not be represented in the findings or identify as women. Some questions about sexual and reproductive health were only asked among those with a specific sex assigned at birth (i.e. male or female).
The national sample was drawn from two nationally representative probability-based panels: the SSRS Opinion Panel and the Ipsos Knowledge-Panel. The SSRS Opinion Panel is a nationally representative probability-based panel where panel members are recruited randomly in one of two ways: (a) Through invitations mailed to respondents randomly sampled from an Address-Based Sample (ABS) provided by Marketing Systems Groups (MSG) through the U.S. Postal Service’s Computerized Delivery Sequence (CDS); (b) from a dual-frame random digit dial (RDD) sample provided by MSG. For the online panel component, invitations were sent to panel members by email followed by up to five reminder emails. 5,660 panel members completed the survey online and panel members who do not use the internet were reached by phone (n=194). Another 514 respondents were reached online through the Ipsos Knowledge Panel to help reach adequate sample sizes among subgroups of interest, specifically women ages 18 to 49. This panel is recruited using ABS, based on a stratified sample from the CDS. The questionnaire was translated into Spanish, so respondents were able to complete the survey in English or Spanish.
The national sample was weighted by splitting the sample into three groups: [1] Women 18-49, [2] Women 50-64, and [3] Men 18-64 and each group was separately weighted to match known population parameters (see table below for weighting variables and sources). Weights within the three groups were then trimmed at the 4th and 96th percentiles, to ensure that individual respondents do not have too much influence on survey-derived estimates. After the weights were trimmed, the samples were combined, and the weights adjusted, so that the groups were represented in their proper proportions for a final combined, gender by age-adjusted weight.
| Dimensions | Source |
| Age | Current Population Survey 2025 |
| Education | |
| Age by Education | |
| Age by Gender | |
| Census Region | |
| Race/Ethnicity by Nativity | |
| Home Tenure | |
| Civic Engagement | 2023 CPS Volunteering and Civic Life Supplement |
| Internet Frequency | Pew Research Center’s National Public Opinion Reference Survey (NPORS 2025) |
| Population Density | Claritas Pop-Facts Premier 2026 |
| Voter Registration | CPS 2024 Voting and Registration Supplement |
The margins of sampling error for the national sample of women ages 18 to 64 and reproductive age women ages 18 to 49 are plus or minus 2 percentage points. Numbers of respondents and margins of sampling error for key subgroups are shown in the table below. For results based on other subgroups, the margin of sampling error may be higher. Sampling error is only one of many potential sources of error and there may be other unmeasured error in this survey.
| Group | N (unweighted) | M.O.S.E. |
| National Women Ages 18-64 | 4,688 | ± 2 percentage points |
| White, non-Hispanic | 2,262 | ± 2 percentage points |
| Black, non-Hispanic | 767 | ± 4 percentage points |
| Hispanic | 1,135 | ± 4 percentage points |
| Asian or Pacific Islander | 347 | ± 6 percentage points |
| 18-25 | 508 | ± 5 percentage points |
| 26-35 | 1,313 | ± 3 percentage points |
| 36-49 | 1,715 | ± 3 percentage points |
| 50-64 | 1,152 | ± 3 percentage points |
| <200% FPL | 1,641 | ± 3 percentage points |
| 200%+ FPL | 2,707 | ± 2 percentage points |
| 200%-399% FPL | 1,232 | ± 3 percentage points |
| 400%+ FPL | 1,475 | ± 3 percentage points |
| Private | 2,876 | ± 2 percentage points |
| Employer-Sponsored | 2,490 | ± 2 percentage points |
| Individually Purchased | 386 | ±6 percentage points |
| Medicaid | 977 | ± 4 percentage points |
| Uninsured | 537 | ± 5 percentage points |
| Democrat/Democrat leaning | 2,267 | ± 3 percentage points |
| Independent | 628 | ± 5 percentage points |
| Republican/Republican leaning | 1,354 | ± 3 percentage points |
| National Women Ages 18-49 | 3,538 | ± 2 percentage points |
| White, non-Hispanic | 1,536 | ± 3 percentage points |
| Black, non-Hispanic | 620 | ± 5 percentage points |
| Hispanic | 944 | ± 4 percentage points |
| Asian or Pacific Islander | 304 | ± 6 percentage points |
| <200% FPL | 1,300 | ± 3 percentage points |
| 200%+ FPL | 1,949 | ± 3 percentage points |
| Private | 2,117 | ± 3 percentage points |
| Medicaid | 785 | ± 4 percentage points |
| Uninsured | 456 | ± 6 percentage points |
| Democrat/Democrat leaning | 1,752 | ± 3 percentage points |
| Independent | 496 | ± 5 percentage points |
| Republican/Republican leaning | 896 | ± 4 percentage points |
General Notes:
- Percentages may not add to 100%, or to subtotals indicated, due to rounding.
- The “No answer” category includes refusals and those who volunteered “don’t know” responses.
- The “Not sure” or “Don’t know” categories are only shown in tables when it was an explicit response option (i.e., shown on web or read via telephone) for survey respondents.
- A category with ‘(VOL.)’ signifies a response option was not shown or read via telephone for survey respondents.
- Insufficient sample size for analysis is denoted with “n/a” (e.g, FER4a). The sample size itself is shown, but the percentages are not.
- Some survey questions were asked of males and females based on sex assigned at birth, which is shown in the base text above each question. However, the topline tables show results based on current gender identity.
- Income is based on 2023 ASPE income levels. Two hundred percent (200%) of the federal poverty level (FPL) in 2023 for an individual was $29,160.
- The sample primarily includes English-speaking Asian adults and, therefore, may not be representative of the overall Asian adult population. Despite this limitation, it is important to report the views of Asian adults on the topics in this study. As always, Asian adults’ responses are incorporated into the general population figures throughout this report.