Key Takeaways
- The “One Big Beautiful Bill Act” that was passed by House Republicans and is currently being discussed by the U.S. Senate is viewed unfavorably by a majority of adults (64%), including large majorities of independents and Democrats. Six in ten Republicans have a favorable opinion of the bill, but this support is largely driven by supporters of the Make America Great Again (MAGA) movement, while two-thirds of non-MAGA Republicans view the bill unfavorably. Among both Republicans and MAGA supporters, support drops at least 20 percentage points, with less than half of each group viewing the law favorably after hearing it would increase the country’s uninsured rate and decrease funding for local hospitals.
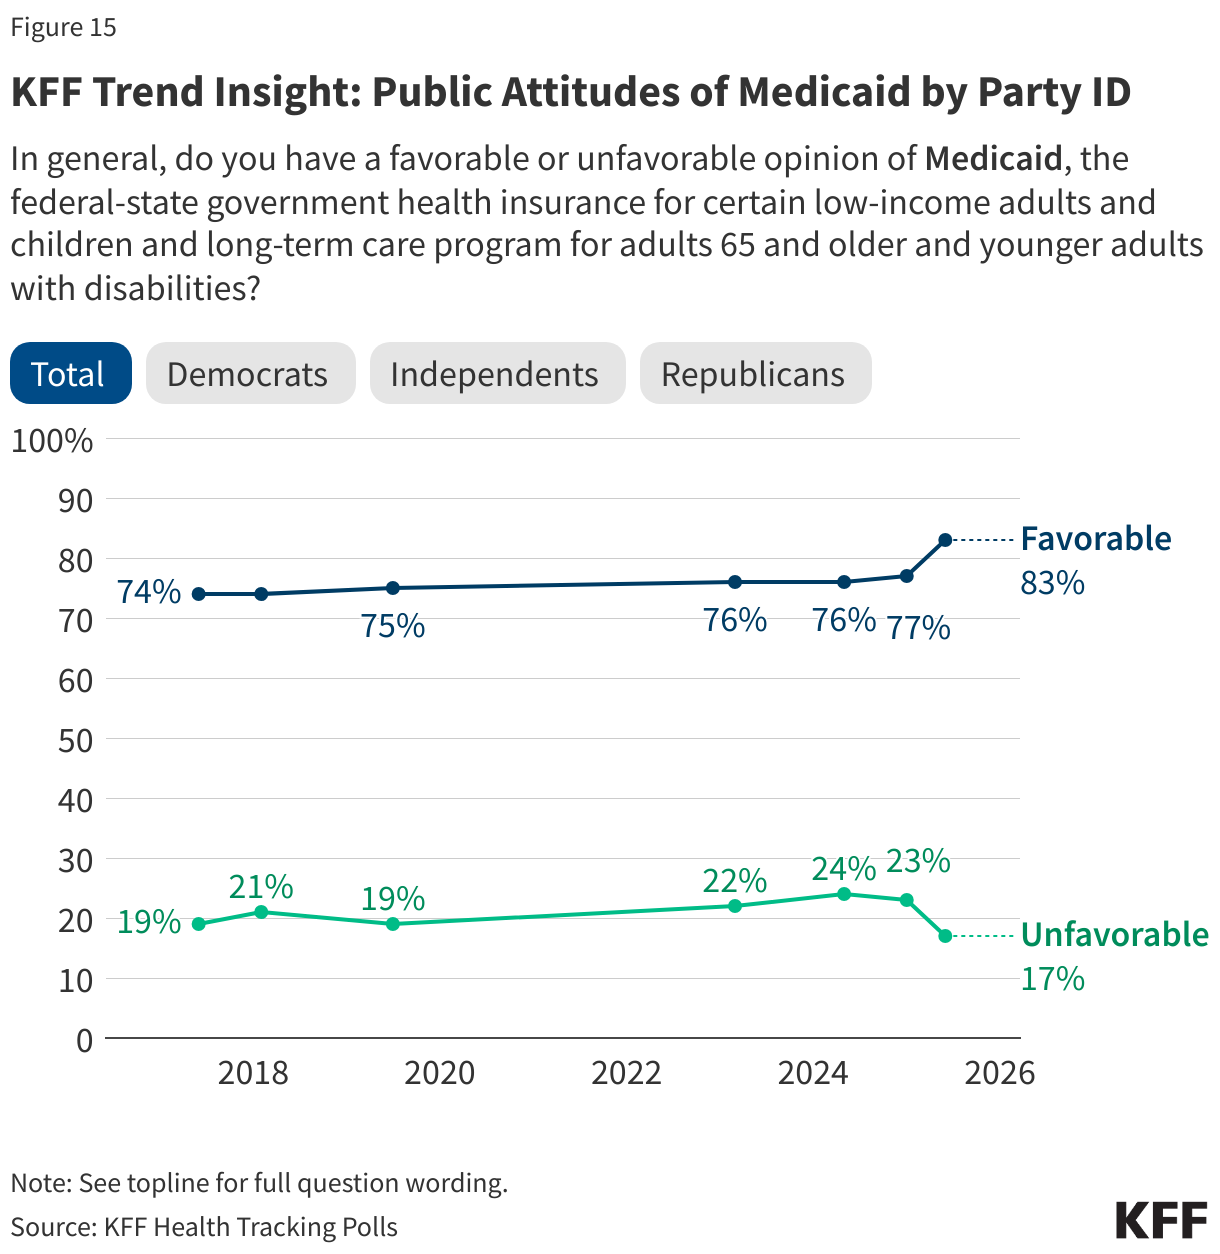
- As the Republican-backed bill proposes sweeping cuts to Medicaid spending as well as changes to the Affordable Care Act (ACA), overall favorability of both programs reach all-time highs. Overall favorability of Medicaid, the health care program for low-income adults and children is now at 83%, including majorities of Democrats (93%), independents (83%), and Republicans (74%). This is an uptick in favorability from January 2025 of six percentage points overall and an 11-point increase among Republicans. In addition, two-thirds of the public now view the ACA favorably. KFF polling found a similar uptick in favorability of the ACA during the 2017 repeal efforts. In general, large majorities of the public, including most Democrats, independents, and Republicans, think it is the government’s responsibility to provide health insurance to people who cannot afford it.
- A majority of the public (68%), including nine in ten Republicans and MAGA supporters, as well as half of Democrats support Medicaid work requirements as described in the House bill. Yet, most people are not aware that the majority of Medicaid recipients are already working, and attitudes can change once people are provided with additional information. For example, support for Medicaid work requirements drops as low as 35% (a 33-point decrease in support) when proponents hear that most people on Medicaid are already working and that many would be at risk of losing coverage because of difficulty completing paperwork to prove their eligibility. On the other hand, support increases as high as 79% (an 11 point increase) if opponents hear the argument that imposing these requirements could save money and help fund Medicaid for the elderly, people with disabilities and low-income children, showing how persuasive an argument can be even if it is not factually true.
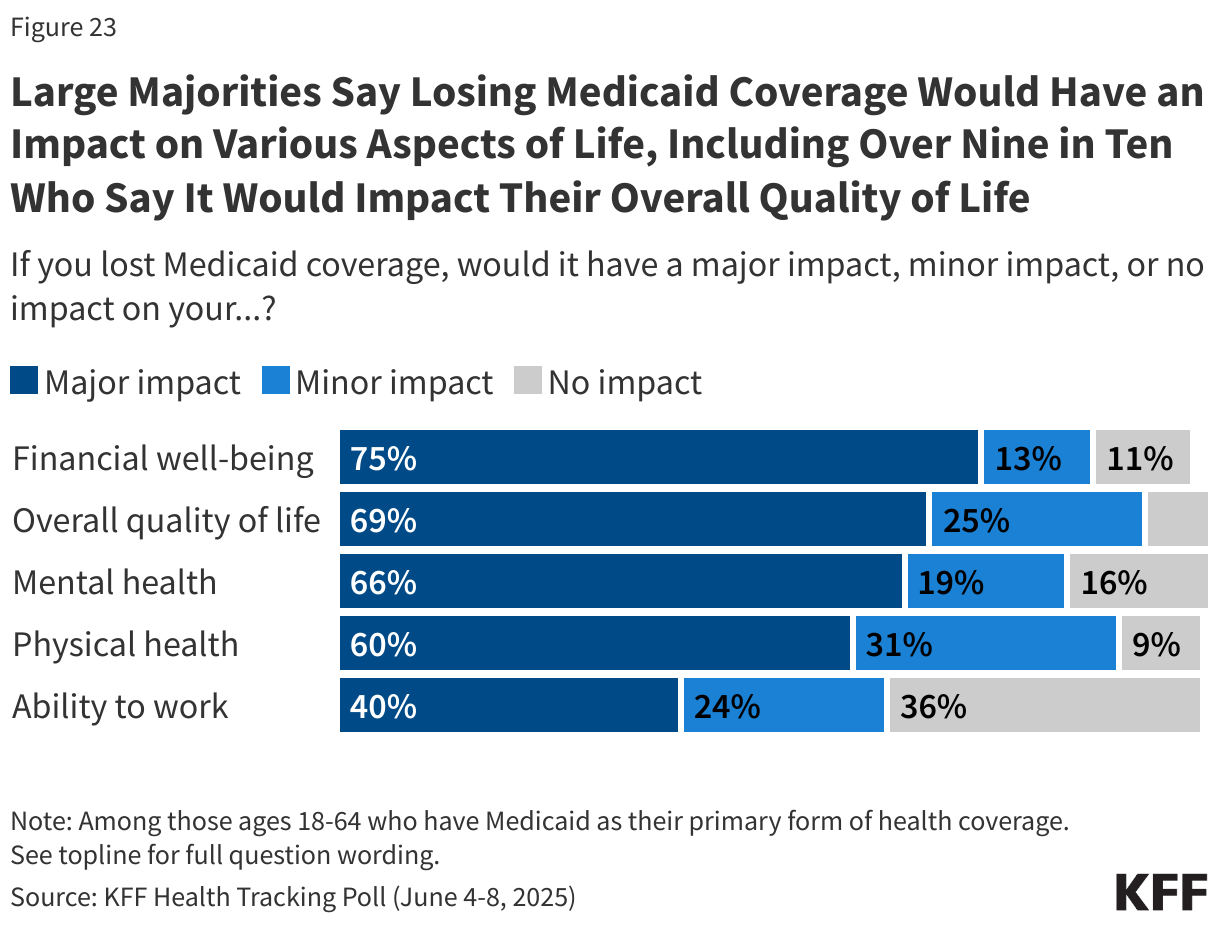
- Adults who currently are insured through Medicaid describe a variety of ways they would be affected if they lost Medicaid coverage. More than half say it would be “very difficult” to afford their prescription medications (68%), afford to see a health care provider (59%) or get and pay for another form of coverage insurance coverage (56%) if they lost Medicaid. In addition, most Medicaid enrollees say losing Medicaid coverage would have a “major impact” on their financial well-being (75%), overall quality of life (69%), their mental health (66%), and their physical health (60%).
The Tax and Budget Bill
Last month House Republicans passed a sweeping legislative package that combined tax cuts with other legislative priorities of President Trump. Known as the “One Big Beautiful Bill Act,” the tax and budget bill contains health care provisions which include significant changes to the Medicaid program and the Affordable Care Act (ACA). As the Senate takes up this legislation, the latest KFF Health Tracking Poll finds strong partisan views on key health care provisions in the proposed bill.
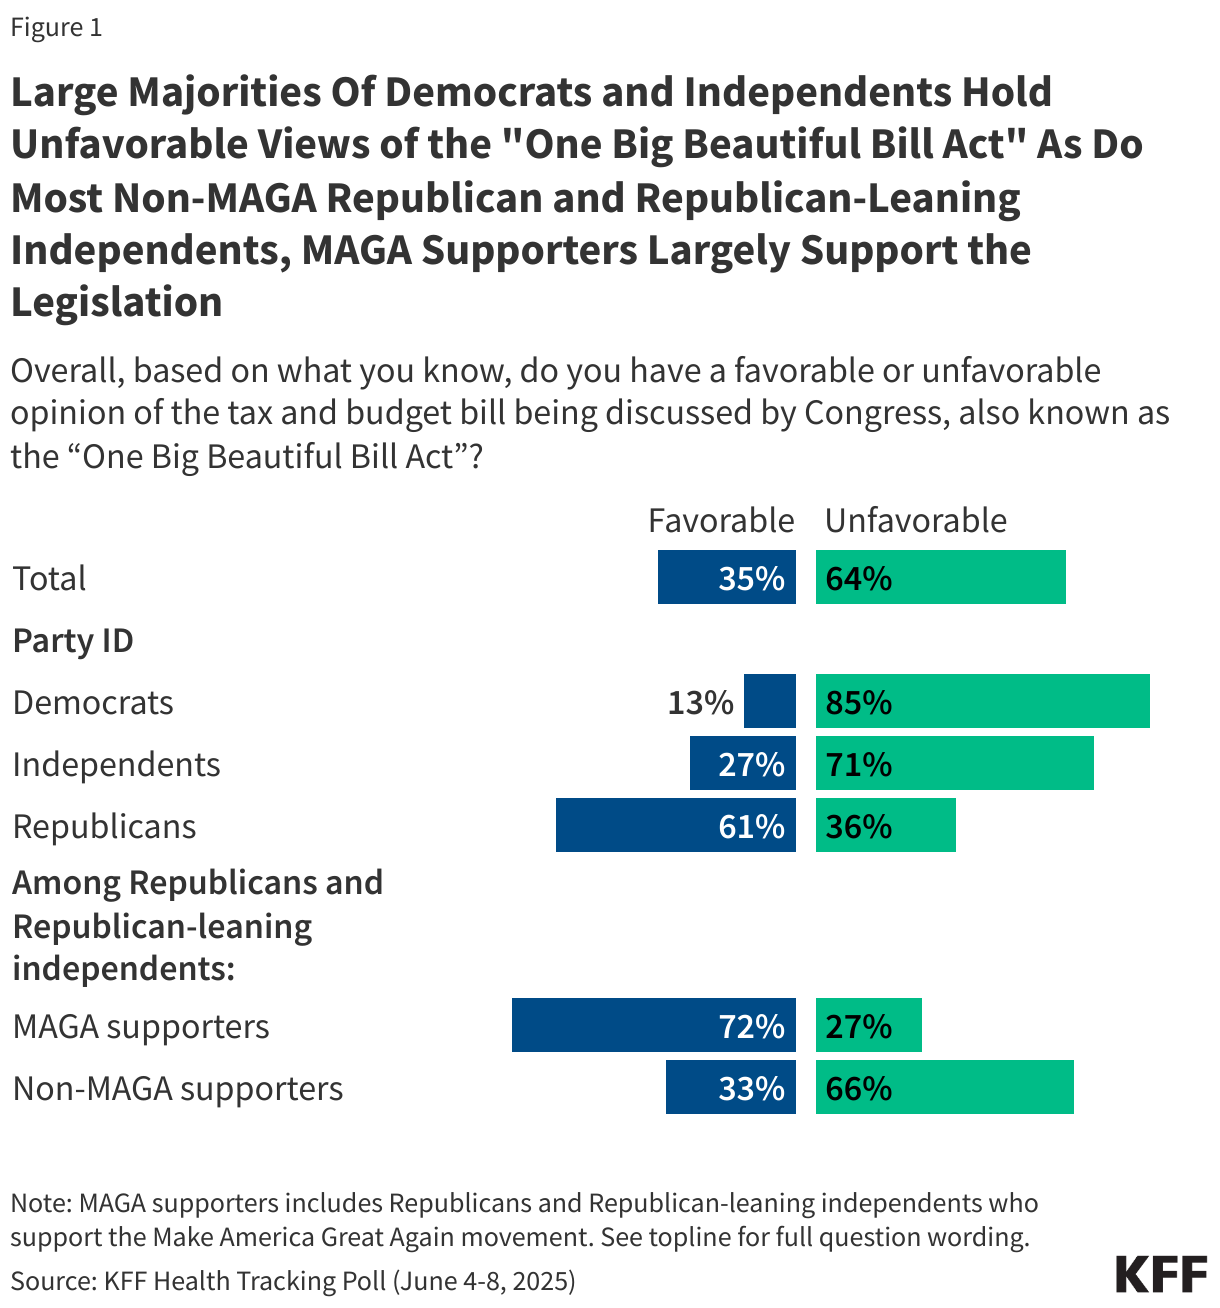
Nearly two-thirds of the public (64%) hold an unfavorable opinion of the tax and budget bill being discussed by Congress, while one-third (35%) hold a favorable view. And while there are strong partisan differences, there is a lack of support among Republican and Republican-leaning independents who do not align with President Trump’s Make America Great Again (MAGA) movement.
Generally, six in ten Republicans have a favorable opinion of the bill compared to large majorities of both independents (71%) and Democrats (85%) who have an unfavorable opinion. Support for the legislation rises as high as 72% among MAGA supporters, a key constituency of President Trump. Yet, among Republicans and Republican-leaning independents who are not MAGA supporters, two-thirds (66%) have an unfavorable view of the bill.
In addition, two groups that will be most directly impacted by the tax and budget bill – individuals with Medicaid coverage and people who buy their own insurance on the ACA Marketplaces – are largely negative towards the bill. At least six in ten people who purchase their own health coverage (64%) and Medicaid enrollees (61%) say they have an unfavorable view of the tax and budget bill being discussed by Congress. A recent KFF poll found that substantial shares of people who buy their own coverage and those with Medicaid coverage identify as Republican or Republican-leaning independents (45% and 27%, respectively).
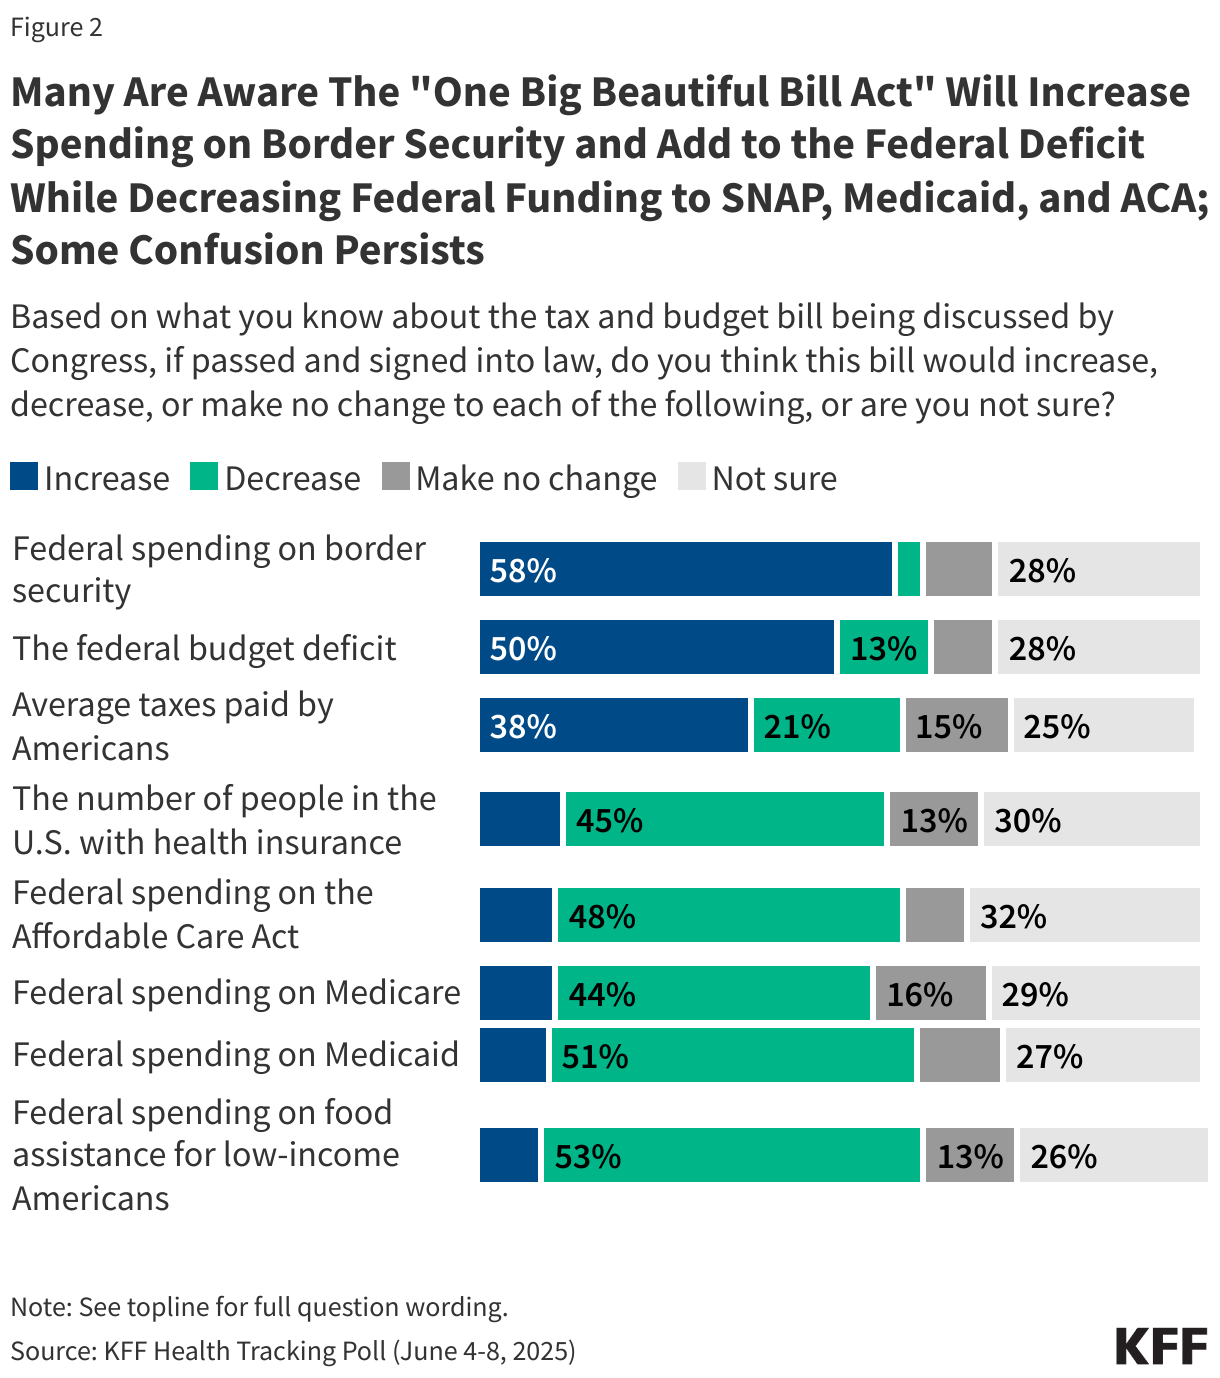
Many are aware of how the bill impacts spending on federal health programs but some confusion remains about the implications for average Americans. More than half of the public correctly say that if the bill was signed into law, it would increase federal spending on border security (58%) and about half are aware it would add to the federal budget deficit (50%). About half are also aware the bill would decrease federal spending on food assistance for low-income Americans (53%), Medicaid (51%), and the ACA (48%).
While the CBO has estimated at least 10 million people would lose coverage under the bill, many Republicans disagree and say the savings will come from reducing fraud, waste, and abuse. Slightly less than half of the public say the bill would decrease the number of people in the U.S. with health insurance (45%) with about a quarter saying the bill would either make no change to the number of people with health insurance or would increase it. Another three in ten say they are unsure what the impact would be on the uninsured rate.
There is also some confusion on the impact of the bill on the amount most people would pay in taxes. The House version of the bill is expected to cut taxes for most Americans, but four in ten (38%) think it would increase taxes, 21% correctly say it would decrease taxes, and about four in ten saying the tax rate would either not be changed (15%) or they are not sure (25%).
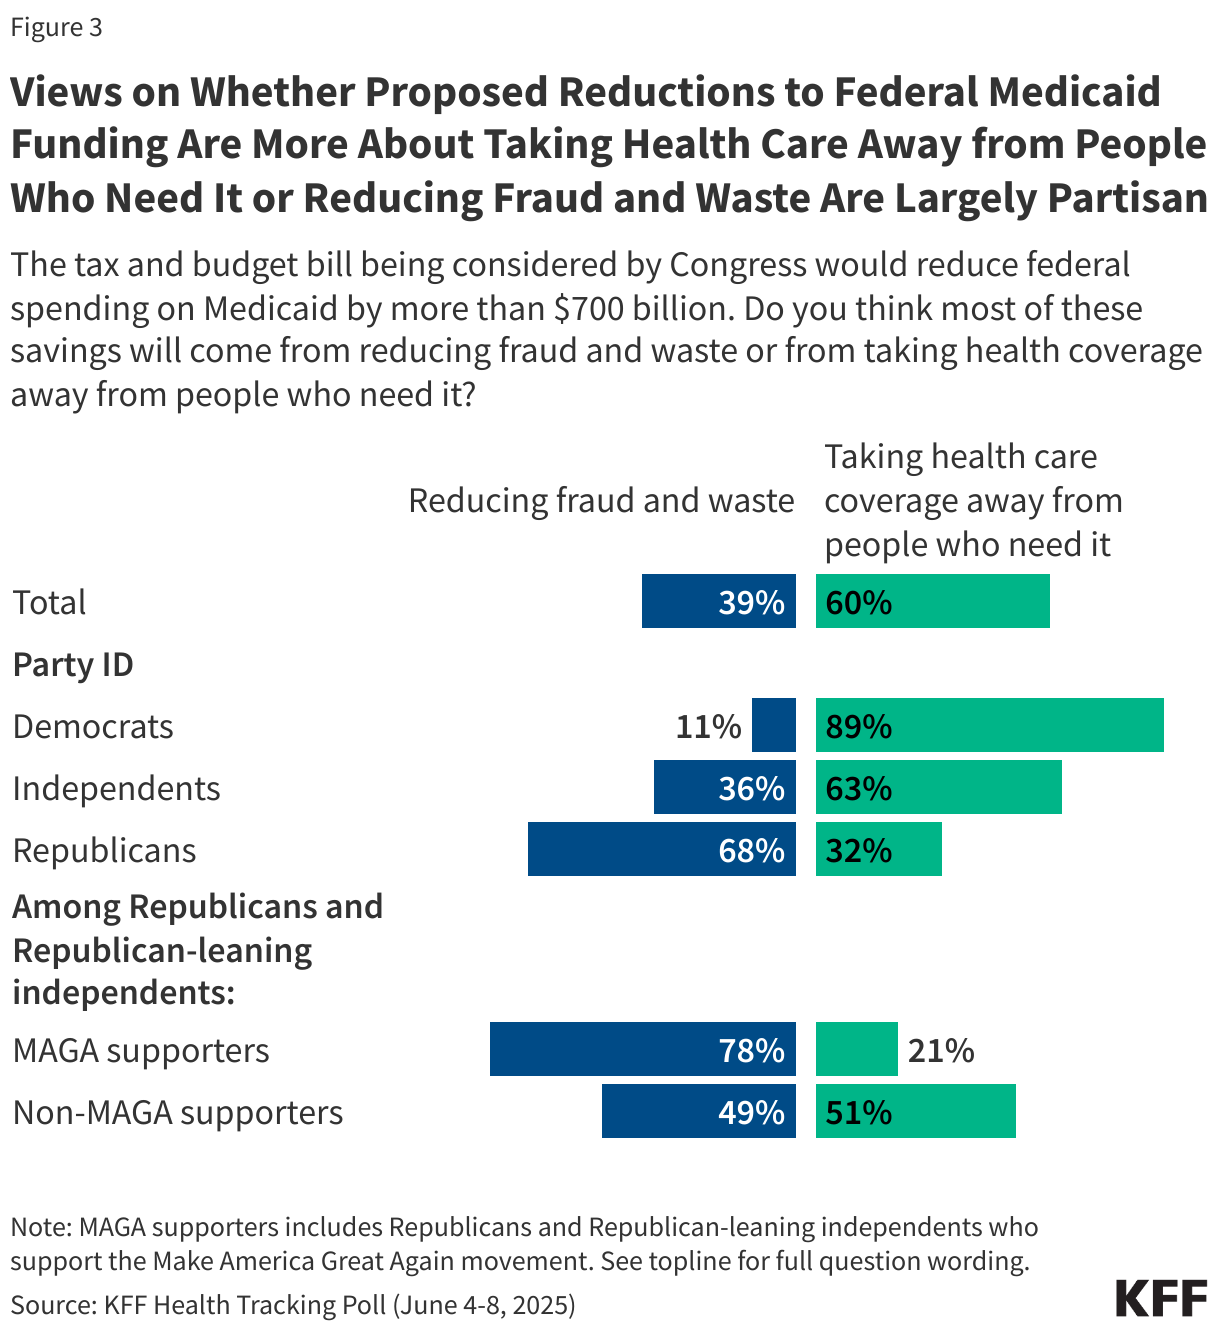
Republicans Say Medicaid Savings Will Come From Cutting Fraud and Waste, Democrats Say It Will Come From Taking Health Coverage Away
Partisan views of the changes to Medicaid may be directly tied to where people think the savings would come from. The bill would reduce federal spending on Medicaid by nearly $800 billion and six in ten adults say the savings will come from taking health coverage away from people who need it while four in ten (39%) say the savings will come from reducing fraud and waste. The vast majority of Democrats (89%) and six in ten (63%) independents say the savings will come from taking health coverage away from people who need it. More than three-fourths of MAGA supporters also say the savings will come from reducing fraud and waste, while non-MAGA Republicans and Republican-leaning independents are more divided in their views of where the savings will come from.
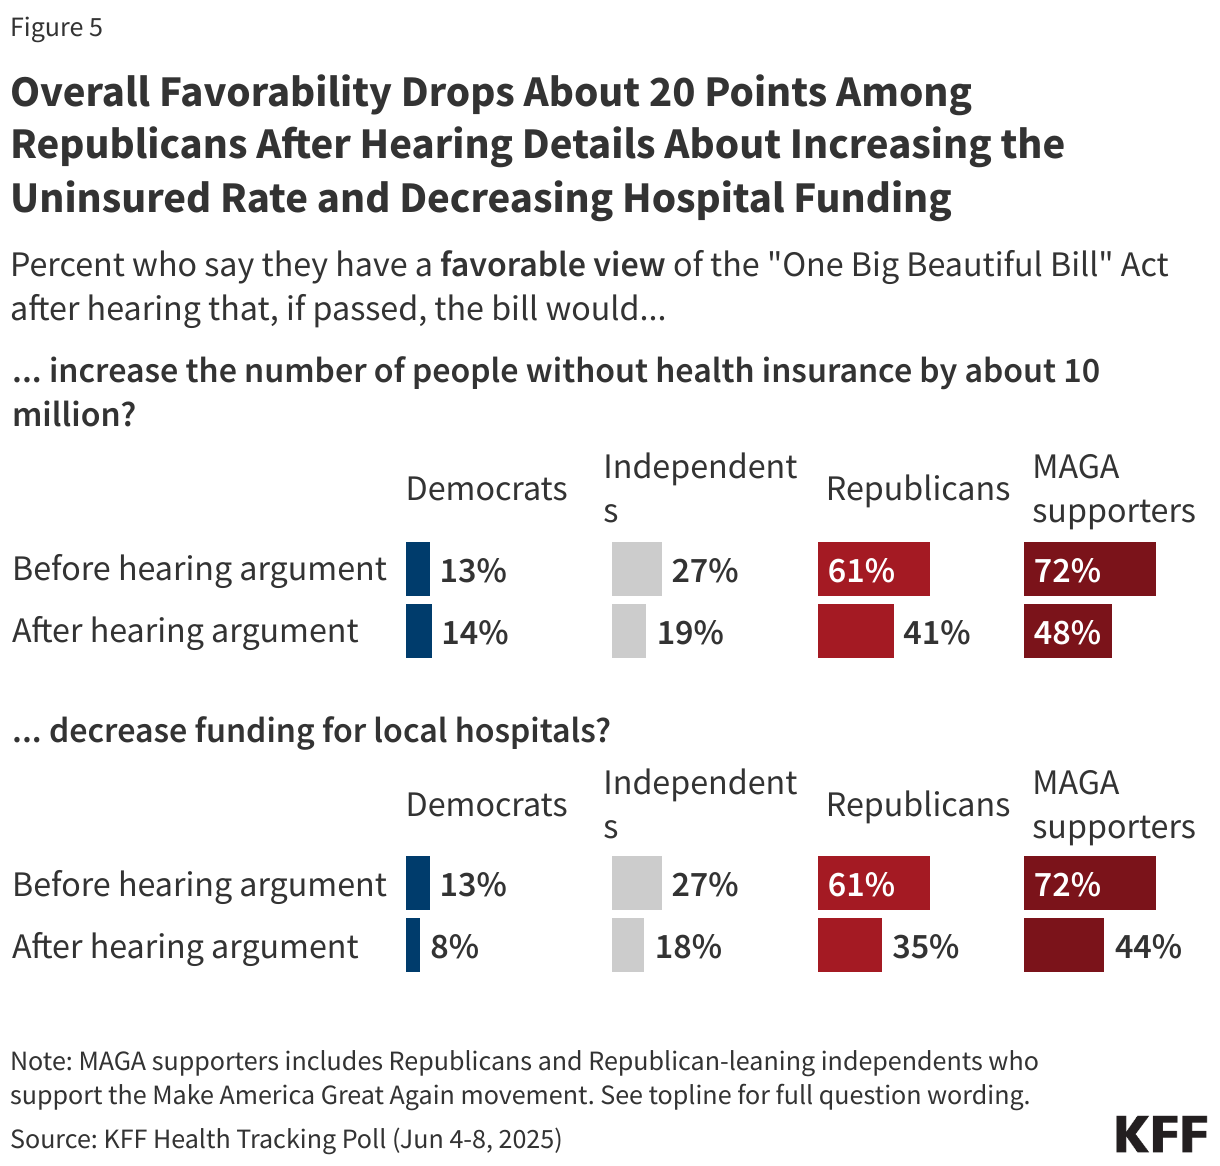
Public Disapproval of Big Beautiful Bill Increases When Hearing it Increases Uninsured Rate and Decreases Funding for Local Hospitals
While the legislation continues to be debated as the debate moves from the House to the Senate, the Congressional Budget Office (CBO) released their report estimating the legislation would increase the number of adults without health insurance by more than 10 million and reduce federal spending on Medicaid by almost $800 billion. In addition, several Republican Senators have said they oppose the provision in the House-passed legislation that freezes states’ provider taxes at their current rate and prohibits states from establishing new provider taxes because of the negative impact it may have on rural hospitals.
Reflecting these ongoing discussions, public attitudes towards the legislation are dynamic and can shift after hearing some of these details. For example, public support for the legislation drops 14 percentage points to 21% after hearing that the legislation would decrease funding for local hospitals. In addition, three-fourths of the public (74%) have an unfavorable view of the legislation after hearing that the bill would increase the number of people without health insurance by about 10 million.
On the other hand, hearing that the bill would reduce federal spending on Medicaid by more than $700 billion seemingly has no impact on public opinion with two-thirds still holding unfavorable views of the bill after hearing this.
Reflecting the difficulty facing Republican lawmakers, a majority of Republicans and MAGA supporters view the law unfavorably after hearing that it would decrease funding for local hospitals (64% and 55%, respectively) or increase the number of people without health insurance by about 10 million (59% and 52%, respectively).
Across partisans, overall favorability drops once the public hears details about funding decreases and coverage losses. Republicans’ and MAGA supporters’ favorability of the legislation drops at least 20 percentage points with now less than half of each group saying they view the law favorably after hearing the bill would increase the uninsured rate in the country and that it would decrease funding for local hospitals.
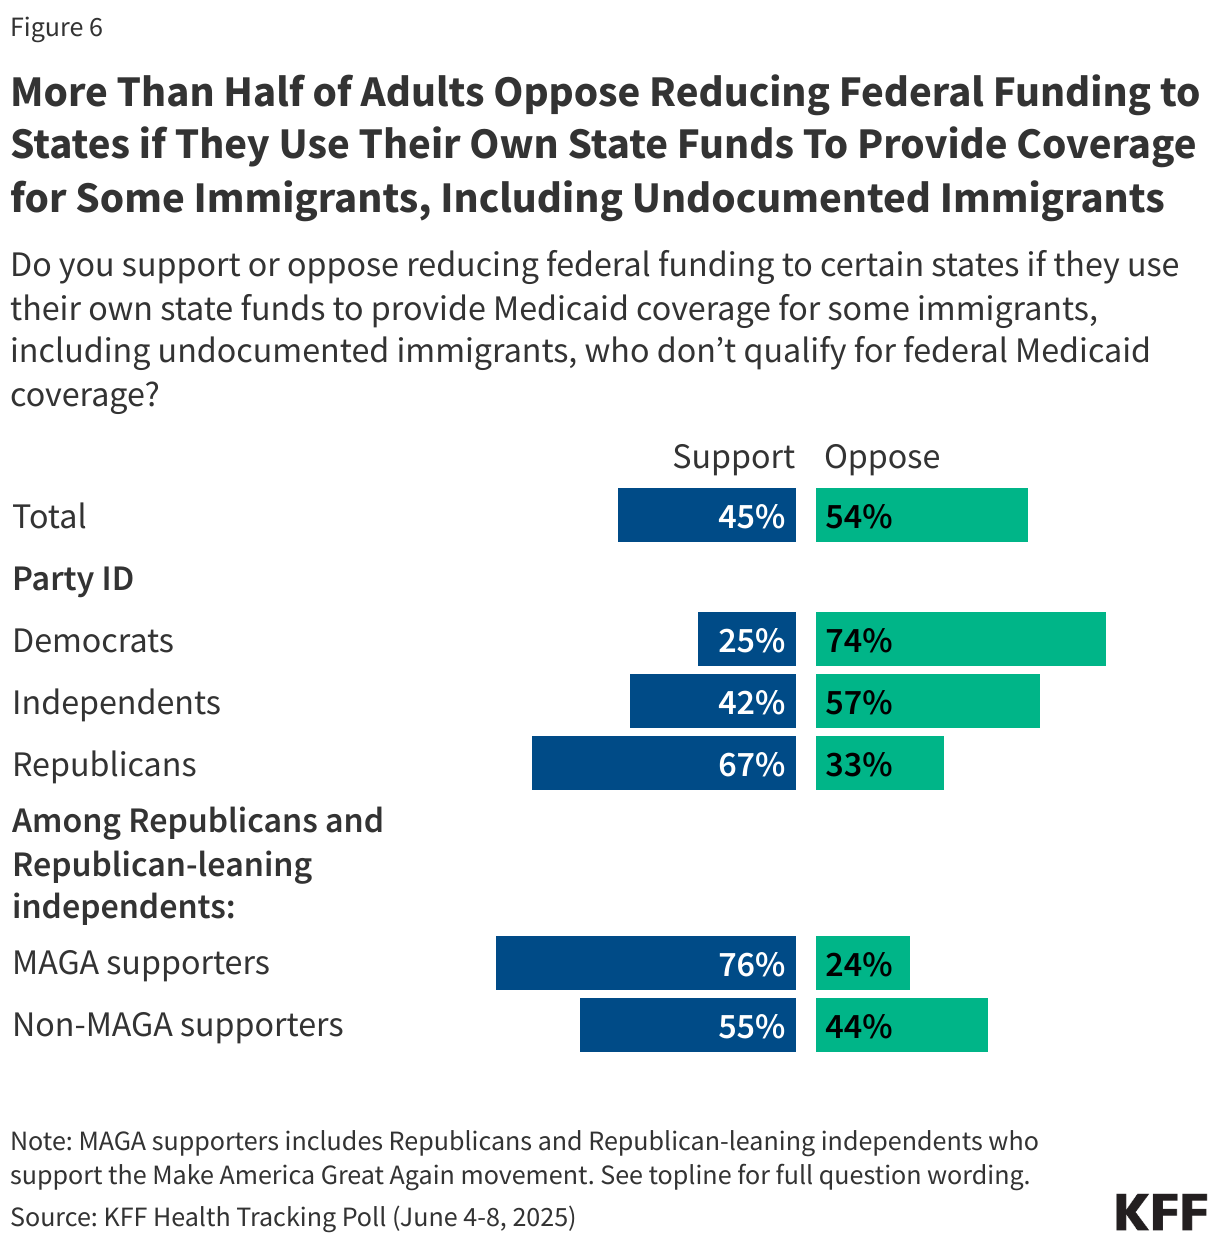
Support for Key Health Care Provisions
The bill includes a provision that would penalize states that have used their own funds to expand coverage to immigrants, including some undocumented immigrants, by reducing the federal Medicaid match rates for their ACA Medicaid expansion group. Overall, a small majority of the public (54%) oppose this provision while 45% support it. There are stark partisan differences on this proposal as Republicans are more than twice as likely as Democrats to support reducing funding for states that use their own funds to provide Medicaid coverage to immigrants. Among MAGA supporters, three in four (76%) say they support this provision in the bill as do more than half of non-MAGA Republicans and Republican-leaning independents (55%).
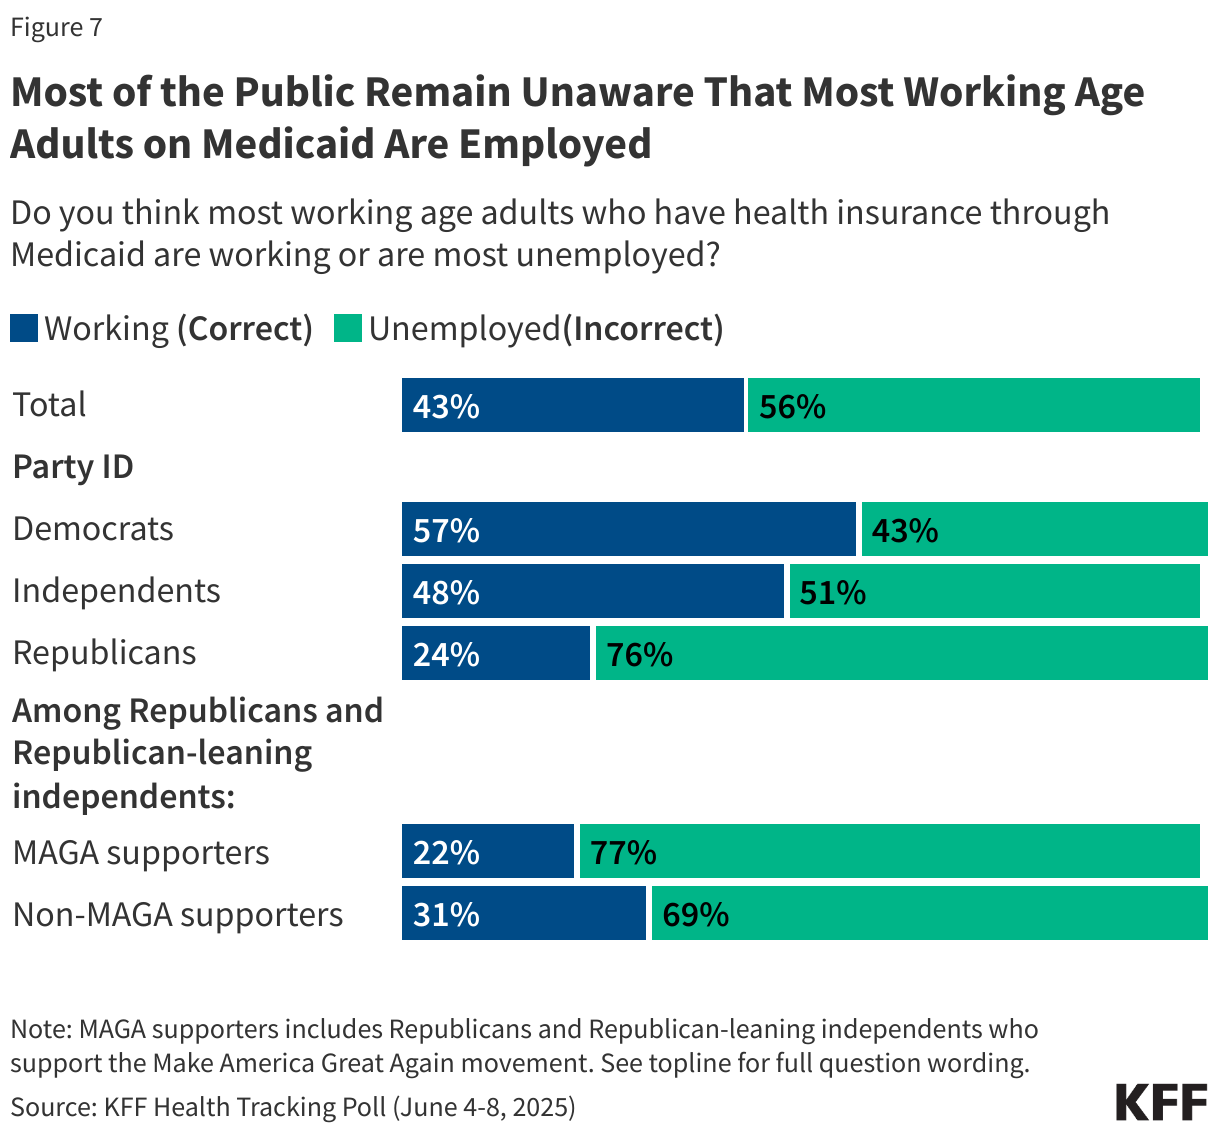
Medicaid Work Requirements
Incorporating work-requirements for people on Medicaid is a core aspect of the House-passed legislation. While most analyses have shown that most working-age adults on Medicaid are already working or have a disability or caregiving duties, the public is largely unaware of this fact. A majority of the public (56%) think most adults with Medicaid coverage are unemployed, while about four in ten (43%) are aware most adults who have Medicaid coverage are working.
A slight majority of Democrats (57%) and about half of independents (48%) are aware that most working-age adults on Medicaid are already working. However, more than three in four Republicans and majorities of both MAGA and non-MAGA Republicans and Republican-leaning independents are unaware that most working-age adults on Medicaid are working.
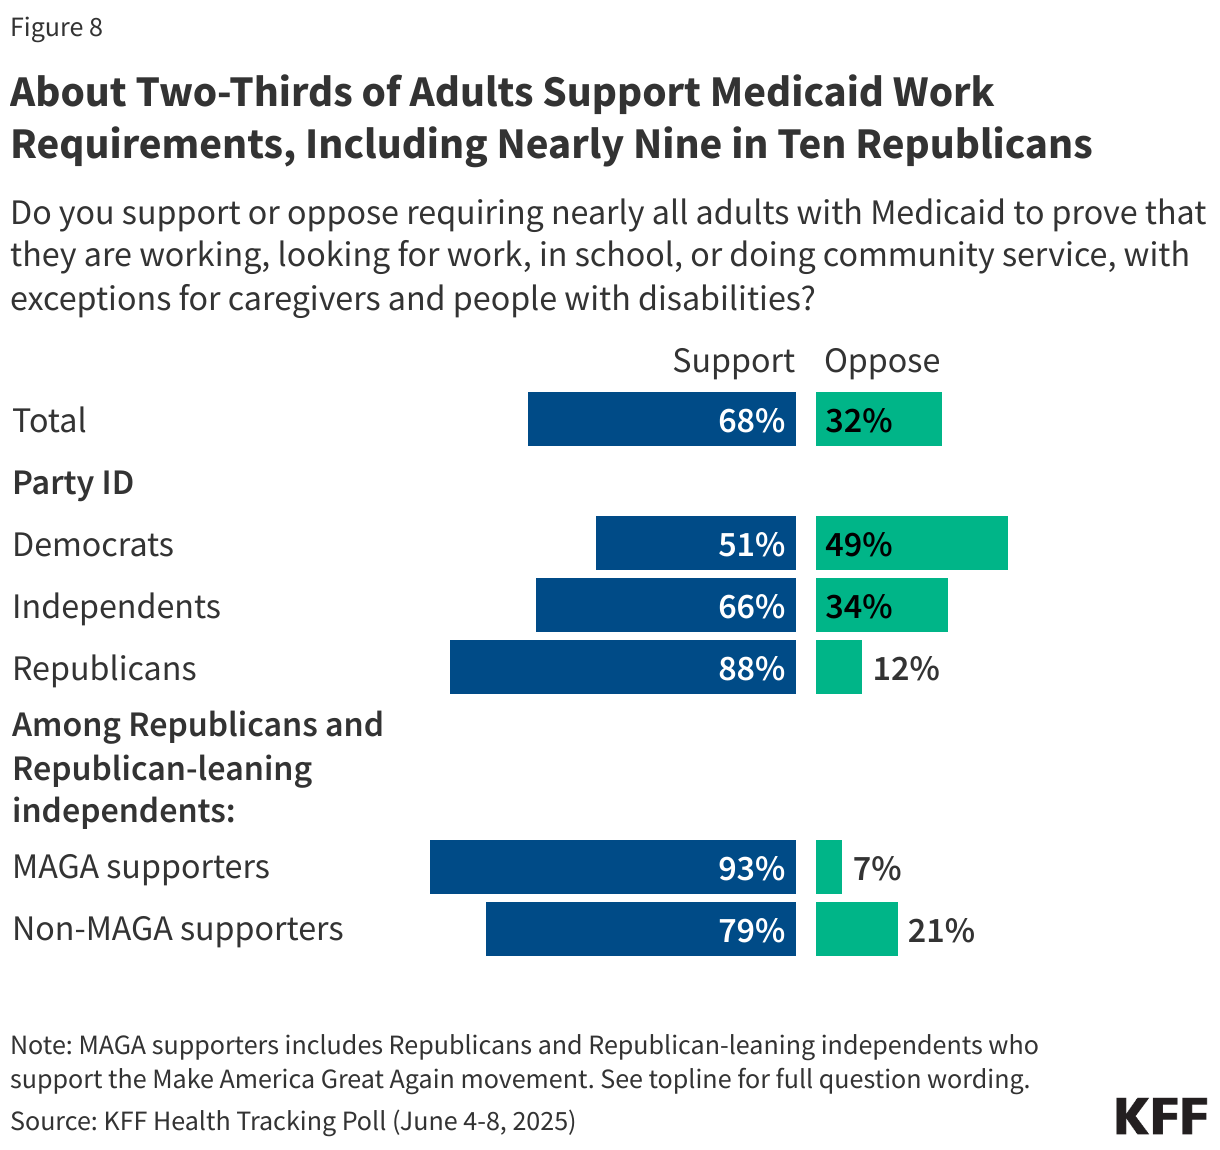
The latest KFF Health Tracking Poll finds majorities of the public, including nine in ten Republicans (88%) and MAGA supporters (93%), as well as half of Democrats (51%), support requiring nearly all adults with Medicaid coverage prove they are working, looking for work, in school, or doing community service, with exceptions for caregivers and people with disabilities.
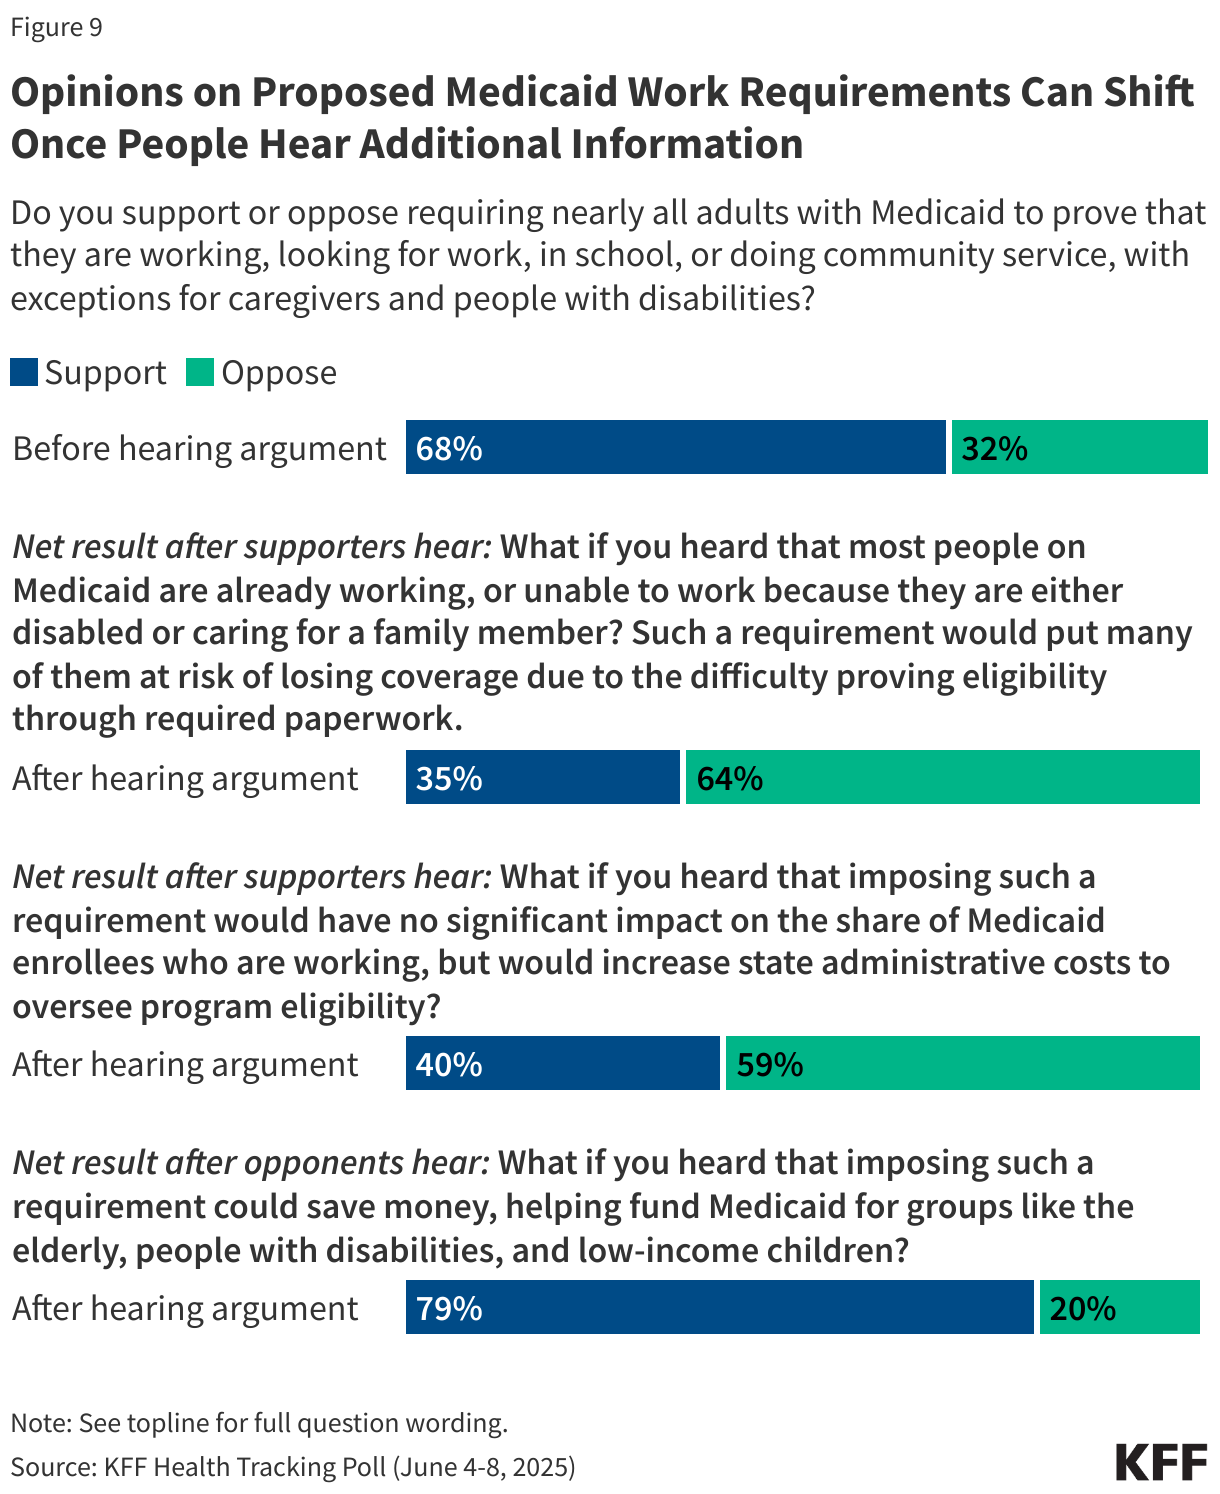
Yet attitudes towards this provision can change once people are provided with additional information and arguments. For example, when those who support Medicaid work requirements hear that most people on Medicaid are already working and many would be at risk of losing coverage because of difficulty of completing the paperwork to prove their eligibility, about half of supporters change their view, resulting in two-thirds (64%) now opposing Medicaid work requirements and one third (35%) supporting it (a 33 percentage point decrease in support).
Similarly, after supporters hear that work requirements would not have a significant impact on employment but would increase state administrative costs, support drops to 40% (a 28 point decrease).
On the other hand, when those who initially oppose work requirements hear the argument that imposing these requirements could save money and help fund Medicaid for the elderly, people with disabilities and low-income children, overall support increases from 68% to 79% (an 11 point increase). While this argument is persuasive, it is not factually accurate.
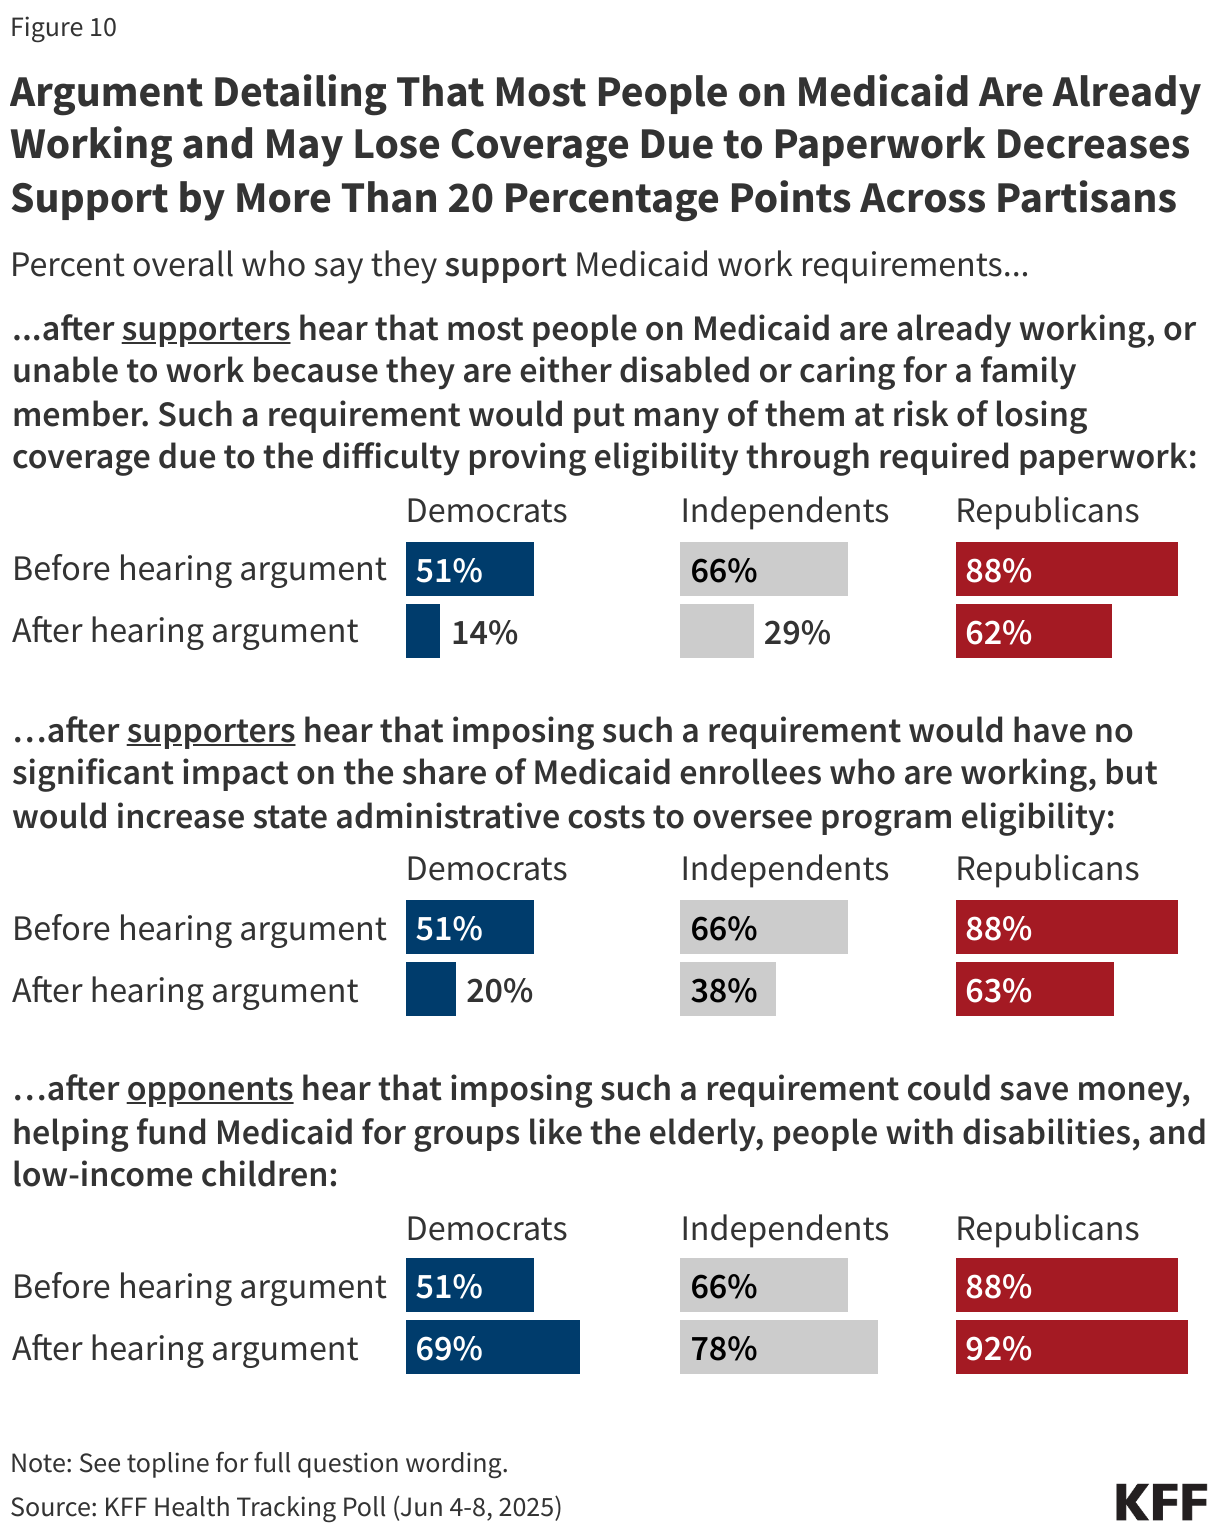
The arguments for and against work requirements work similarly across partisans, with overall support for Medicaid work requirements dropping significantly once initial supporters of the provision hear that imposing such a requirement would put many people at risk of losing coverage due to the difficulty proving eligibility through required paperwork, or that that imposing such a requirement would have no significant impact on employment but would increase state administrative costs.
On the other hand, support for Medicaid work requirements increases among Democrats and independents after those who initially opposed the proposal hear that imposing such a requirement could save money, helping fund Medicaid for groups like the elderly, people with disabilities, and low-income children.
Planned Parenthood Medicaid Funding
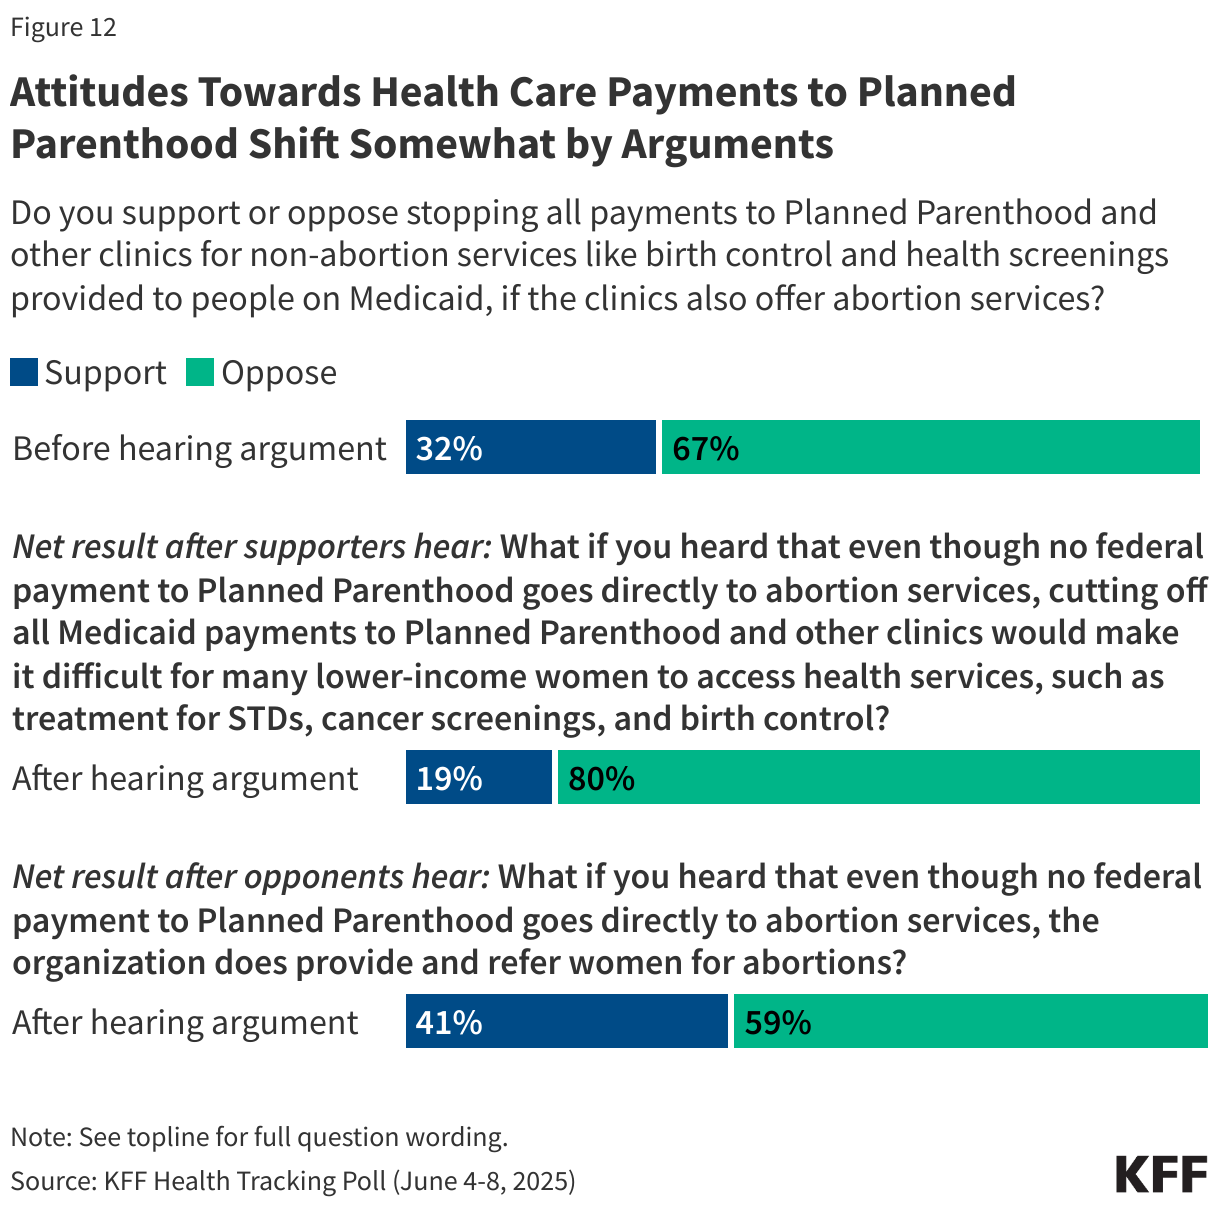
The House bill also includes a provision that would stop all federal health care payments to Planned Parenthood and other clinics for services like birth control and health screenings provided to people on Medicaid, if the clinics also offer abortion services. Overall, about two-thirds of the public (67%) oppose stopping these health care payments to Planned Parenthood and similar clinics, while about one-third (32%) support this provision.
About nine in ten Democrats (89%) and seven in ten independents oppose this provision, while Republicans are more divided with 54% supporting and 46% opposed. The provision to stop payments for health care services to any clinic that offers abortion services is popular among MAGA supporters, with more than six in ten of those who identify as MAGA supporters saying they support stopping payments to Planned Parenthood and similar clinics. Notably, a majority of non-MAGA Republicans and Republican-leaning independents are opposed to stopping payments and Republican women are divided in their views.

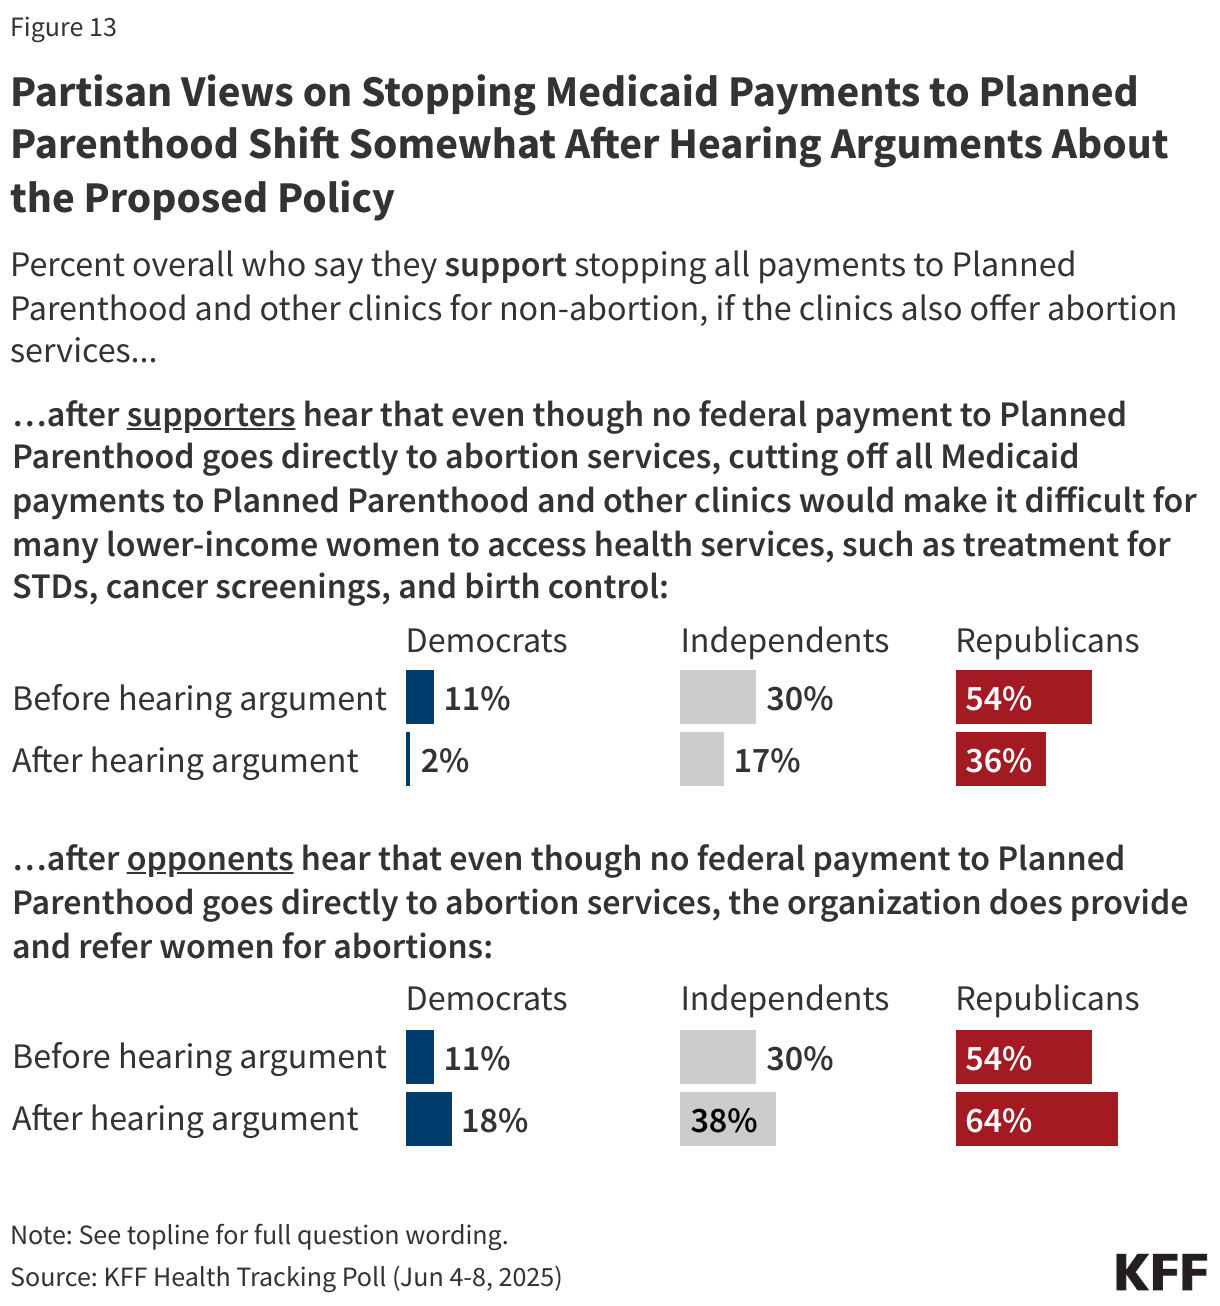
Attitudes towards federal Medicaid payments to Planned Parenthood are also somewhat malleable. For example, after those who initially support stopping payments hear that even though no federal payment to Planned Parenthood goes directly to abortion services, cutting off all Medicaid payments to Planned Parenthood and other clinics would make it difficult for many lower-income women to access health services, such as treatment for STDs, cancer screenings, and birth control, overall support for stopping payments drops from 32% to 19%.
Conversely, when those initially opposed to stopping payments to Planned Parenthood hear that even though no federal payment to Planned Parenthood goes directly to abortion services, the organization does provide and refer women for abortions, support for stopping payments increases from 32% to 41%.
Overall support for stopping Medicaid payments to Planned Parenthood decreases by 18 percentage points among Republicans and by 13 points among independents after those who initially support stopping payments hear that cutting off these payments would make it difficult for many lower-income women to access non-abortion health services.
When those who initially oppose stopping all payments to Planned Parenthood hear that that even though no federal payment goes directly to abortion services, the organization does provide and refer women for abortions, overall support for stopping the payments increases by 11 percentage points among Republicans and by 8 points among Democrats and independents.
Public Attitudes towards Medicaid
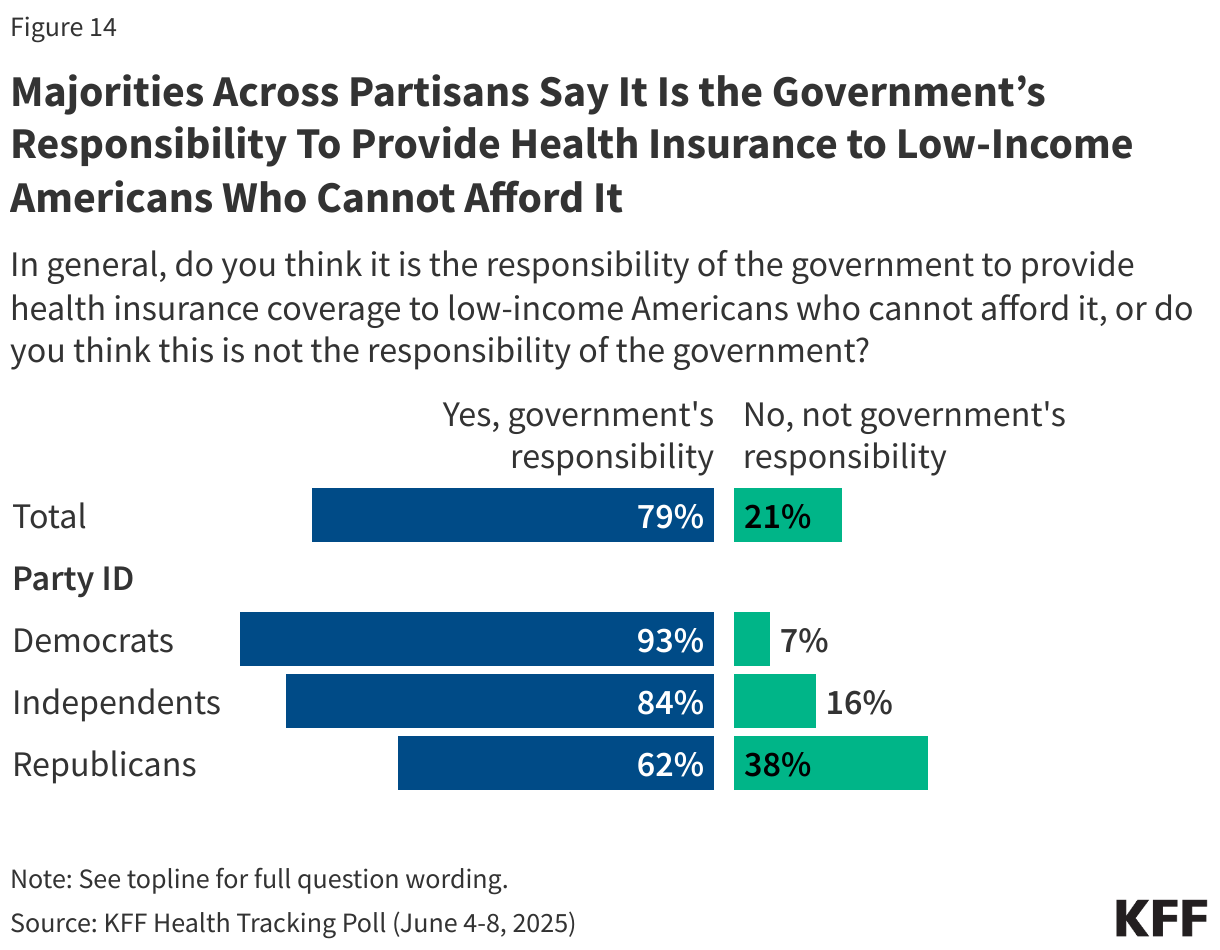
In 2010, the Affordable Care Act significantly expanded the country’s Medicaid program, which provides health and long-term care coverage to 83 million low-income children and adults in the U.S, and helped millions afford private health insurance through the exchanges. Eight in ten adults (79%) think it is the government’s responsibility to provide health insurance to people who cannot afford it, including nearly all Democrats (93%), more than eight in ten independents (84%), and about six in ten Republicans (62%).
In addition, more than eight in ten adults now view the Medicaid program favorably. This includes large majorities of Democrats (92%), independents (83%), and Republicans (74%) who hold favorable views of Medicaid. Since January 2025, the share across partisans who view Medicaid favorably has increased including an eleven-percentage point increase among Republicans.
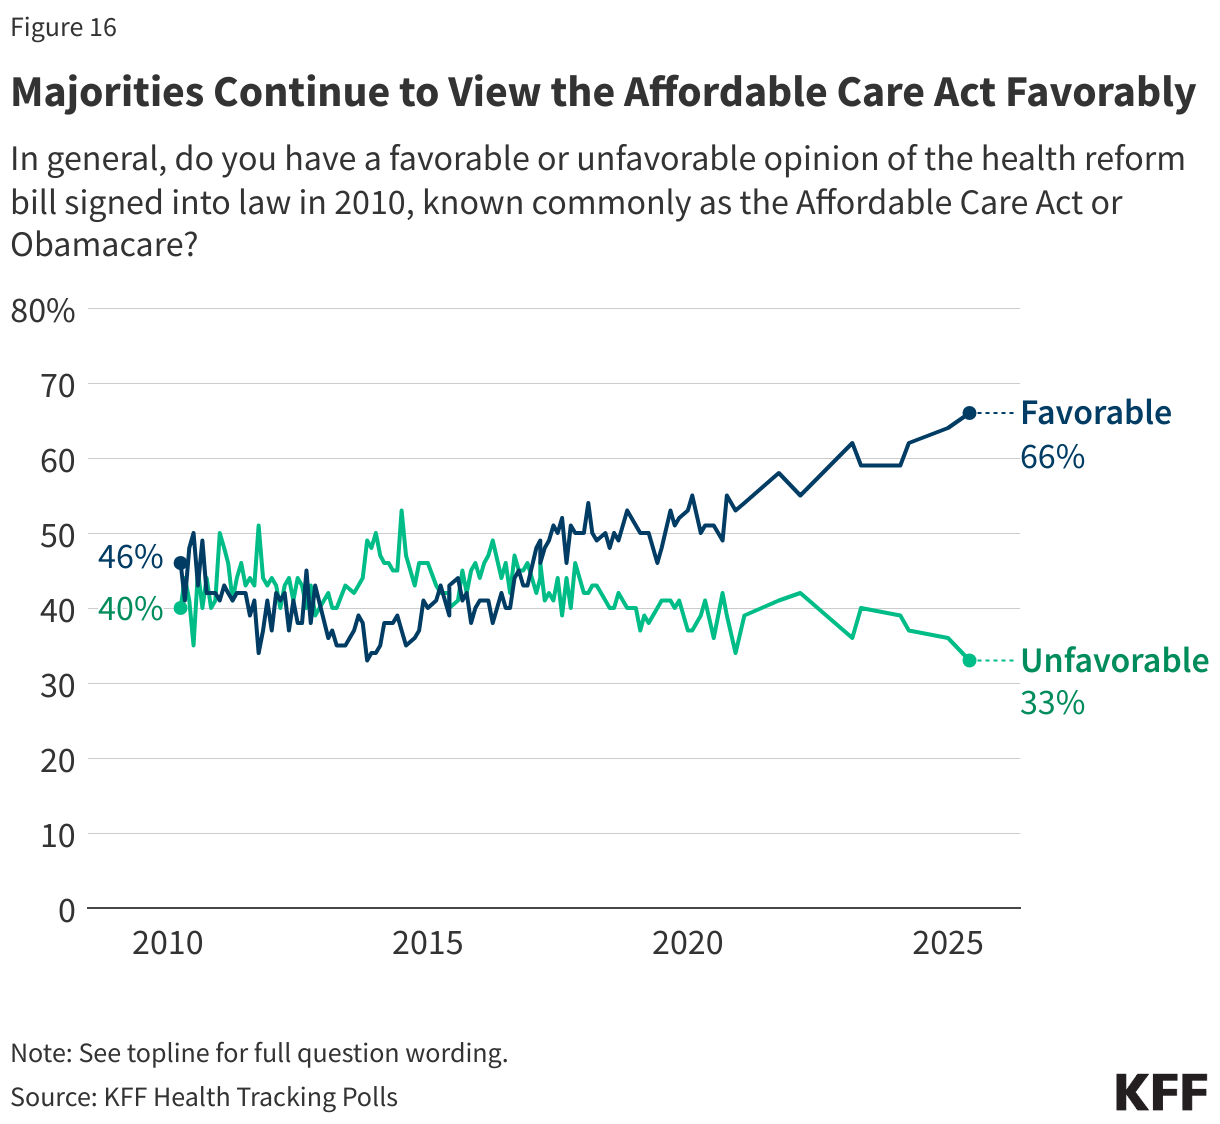
Overall views of the ACA are now two to one in favor of the law with two-thirds of the public viewing the ACA favorably while one-third hold unfavorable views of the law. This continues a long-term trend upwards in ACA favorability as the 2010 health care legislation has garnered majority approval since the latest GOP effort to repeal and replace the legislation during the first Trump administration. Notably, a majority of Republicans (63%) still hold unfavorable views of the law.
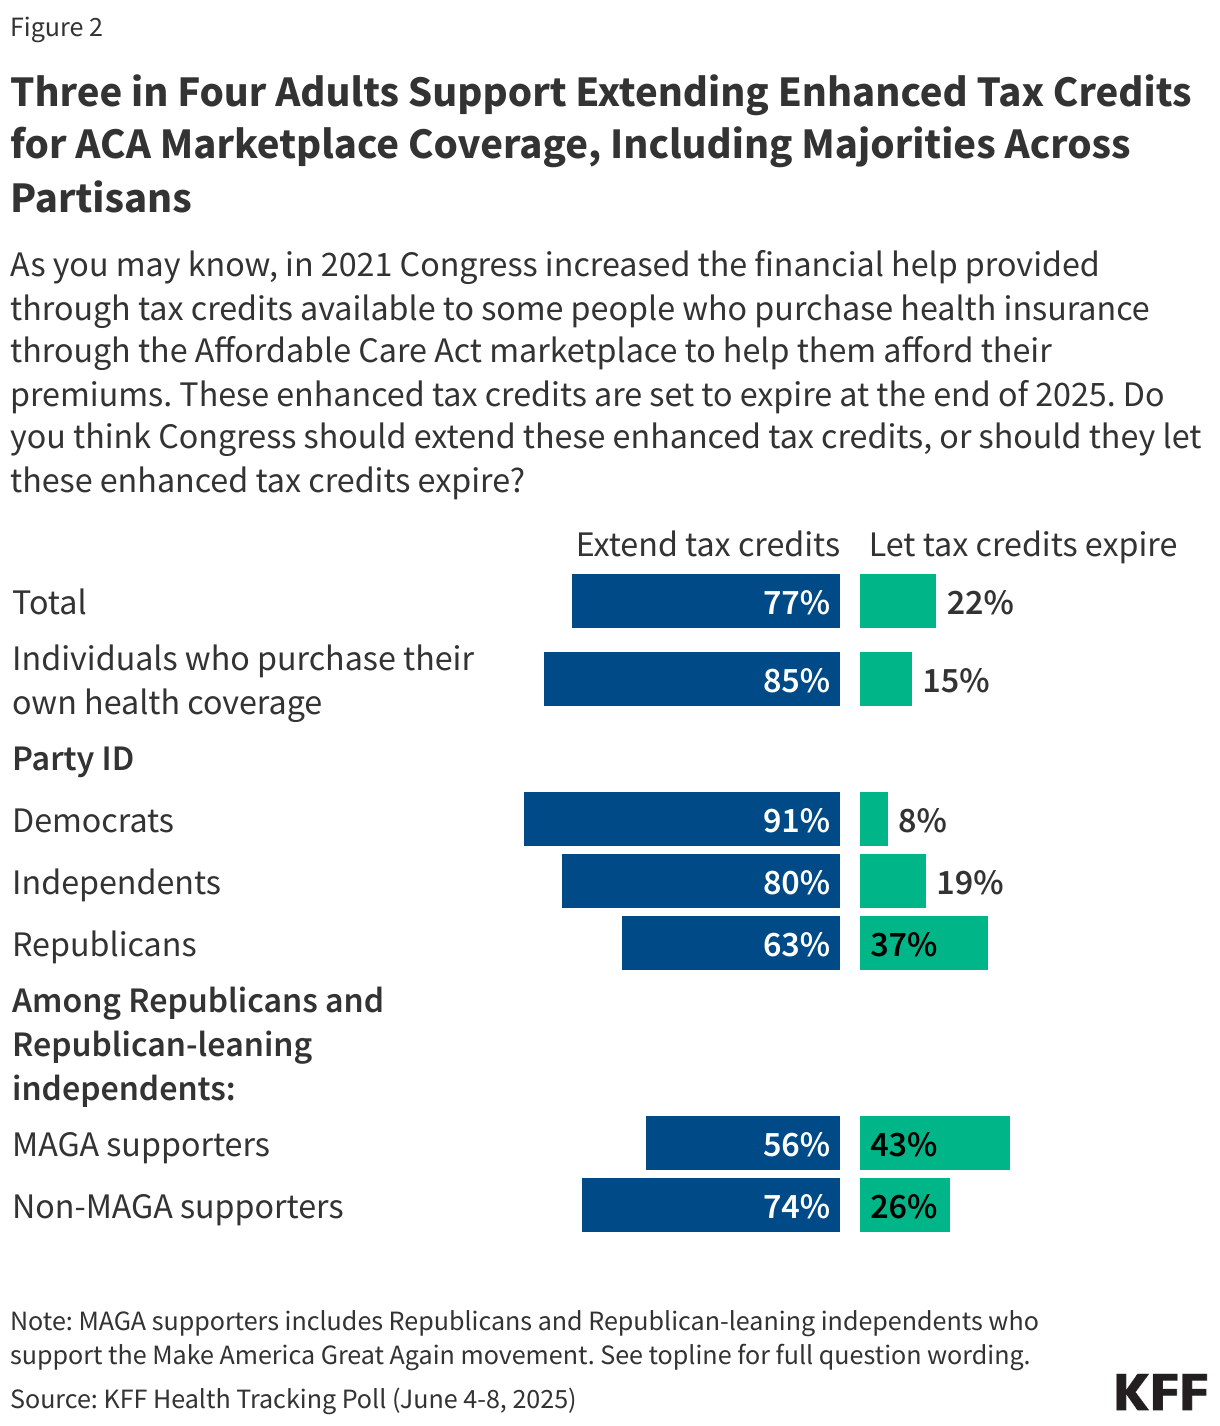
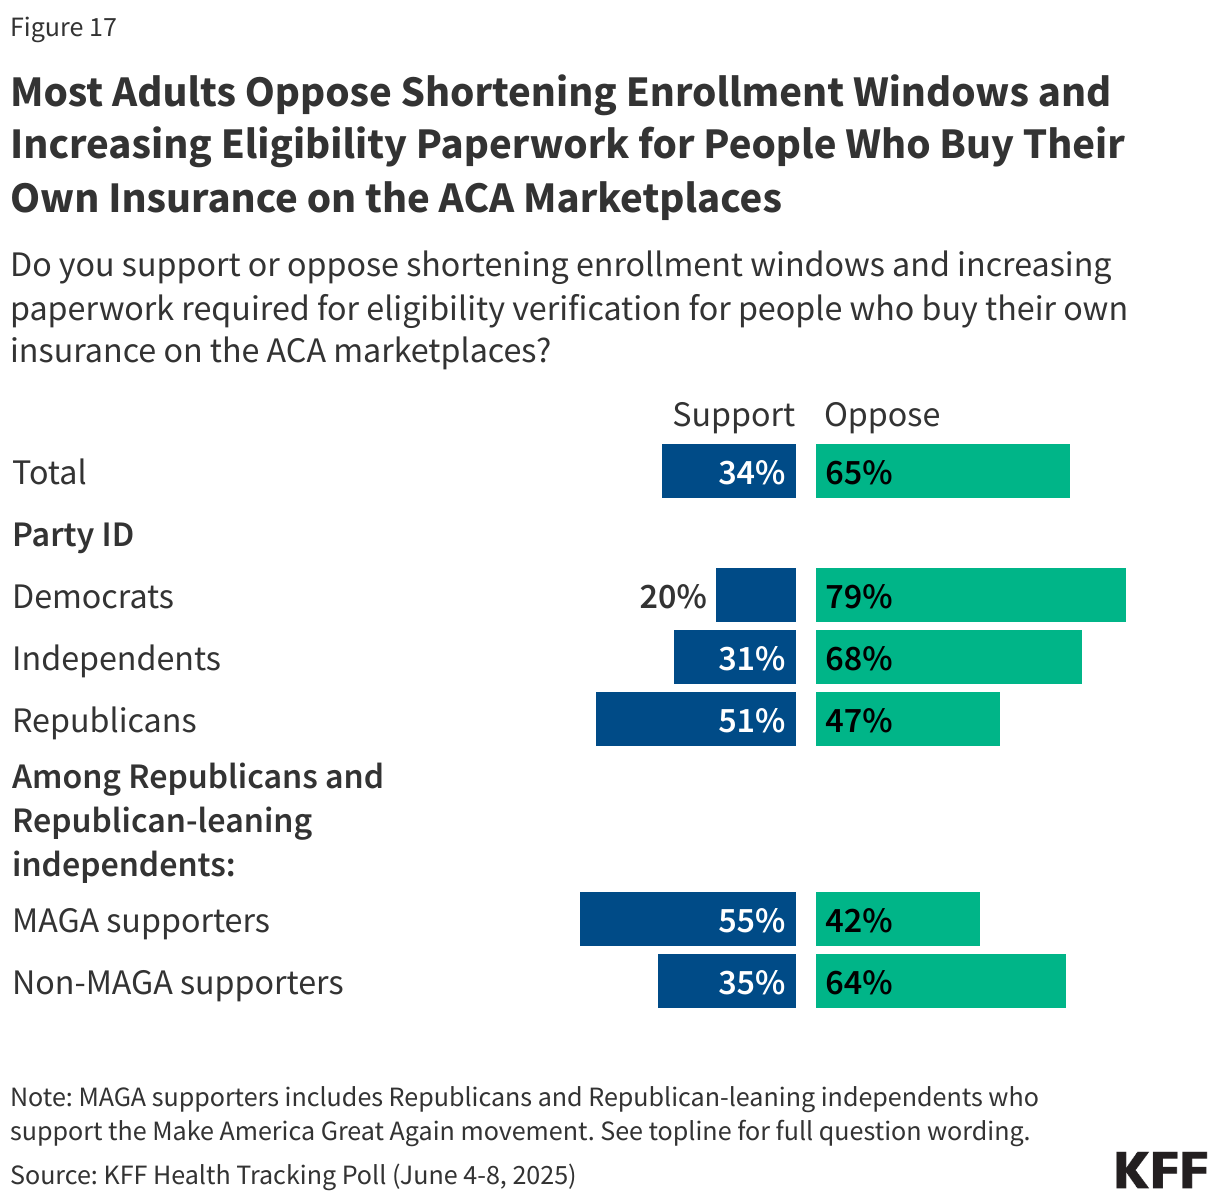
Provisions in the tax and budget bill passed by the House would reduce ACA enrollment by shortening enrollment windows and increasing required eligibility paperwork for adults who purchase their own health insurance through the ACA marketplaces.
About a third of the public (34%) support this provision, while two-thirds (65%) are opposed. Most Democrats (79%) and independents (68%) are opposed to this provision of the bill, as are half of Republicans (47%). Among supporters of the MAGA movement, more than half (55%) support shortening enrollment windows and increasing eligibility paperwork for those who purchase their own health insurance through the ACA marketplaces.
Public Concerned How the One Big Beautiful Bill Will Impact Families
In addition to gauging overall favorability of the tax and budget bill and its various health care provisions, the latest KFF Health Tracking Poll also asked the public how they expected themselves and others to be impacted by the legislation.
Public Believes Republican Tax and Budget Bill Will Hurt Them and Their Families
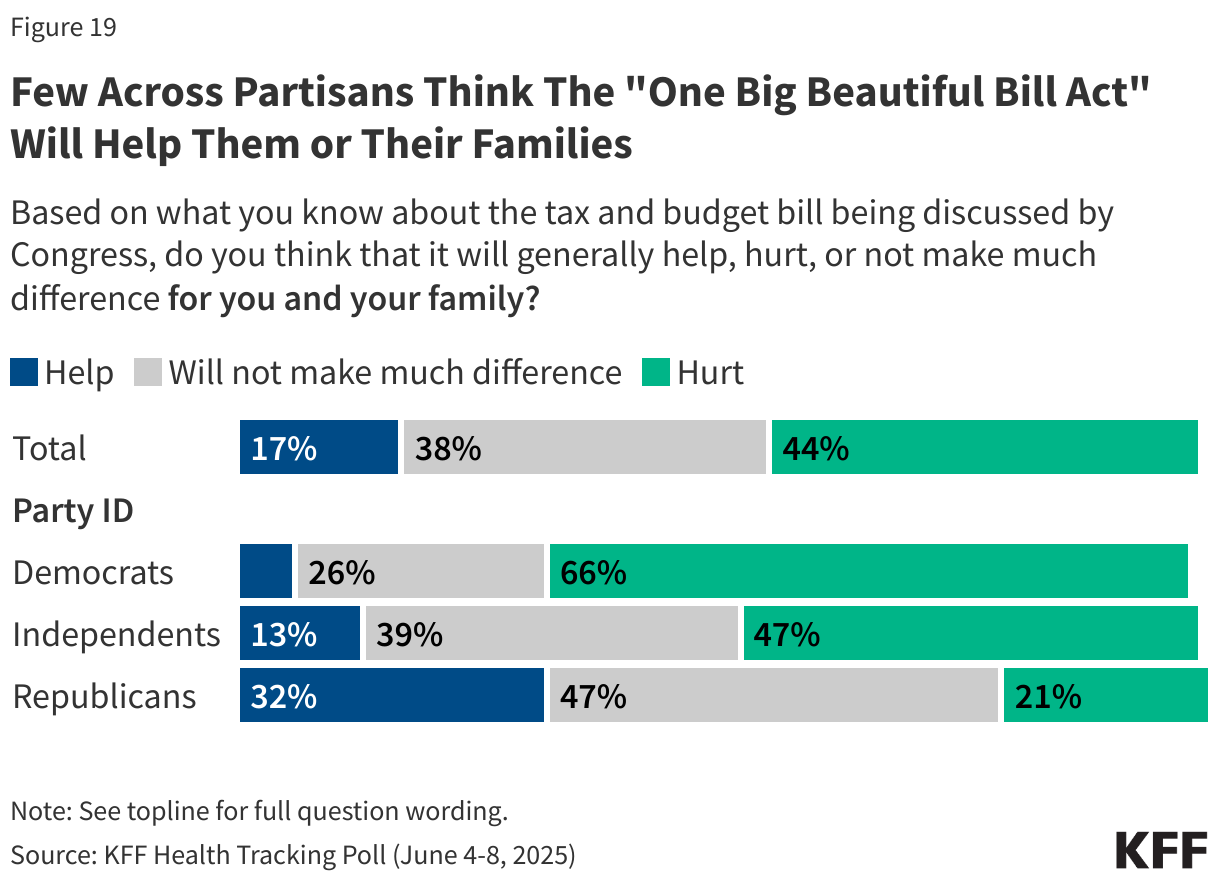
Nearly half of the public (44%) think the tax and budget bill will hurt them and their own family, and majorities say the bill will generally hurt undocumented immigrants (71%), people who receive SNAP benefits (60%), middle-class families (50%), people with Medicaid coverage (56%), and immigrants who are in the U.S. legally (52%). A majority of the public also say the bill will hurt people with lower incomes. On the other hand, half (51%) think the bill will help wealthy people. Despite the fact that the bill makes major changes to the ACA marketplaces for people who buy their own insurance, 47% of the public think the bill won’t make much difference for people who buy their own health insurance.

Republicans are much more likely to say they and their family will be helped by the tax and budget bill being discussed by Congress than independents or Democrats, as well as to say the other groups asked about will largely not be impacted. Yet just 32% of Republicans think the bill will help them or their family members. Democrats consistently think all of the groups asked about will be hurt by the GOP tax bill, except for wealthy Americans. Seven in ten Democrats say wealthy people will be helped by the bill as do six in ten independents. At least three-fourths of Democrats say people with lower incomes, immigrants in the country legally, undocumented immigrants, people with Medicaid, and people who get SNAP benefits will be hurt by the bill.
The Public, Especially Those Who Rely on Programs, Worry About Funding Cuts
Seven in ten adults are concerned that more adults and children will have trouble affording food because of changes to the food stamp program in the tax and budget bill. This includes about nine in ten Democrats and three-fourths of independents, and nearly half of Republicans (47%). Among the 42% of adults who are connected to the SNAP program either through themselves or a family member, more than three-fourths (77%) say they are concerned that families will have trouble affording food as a result of the tax and budget bill.
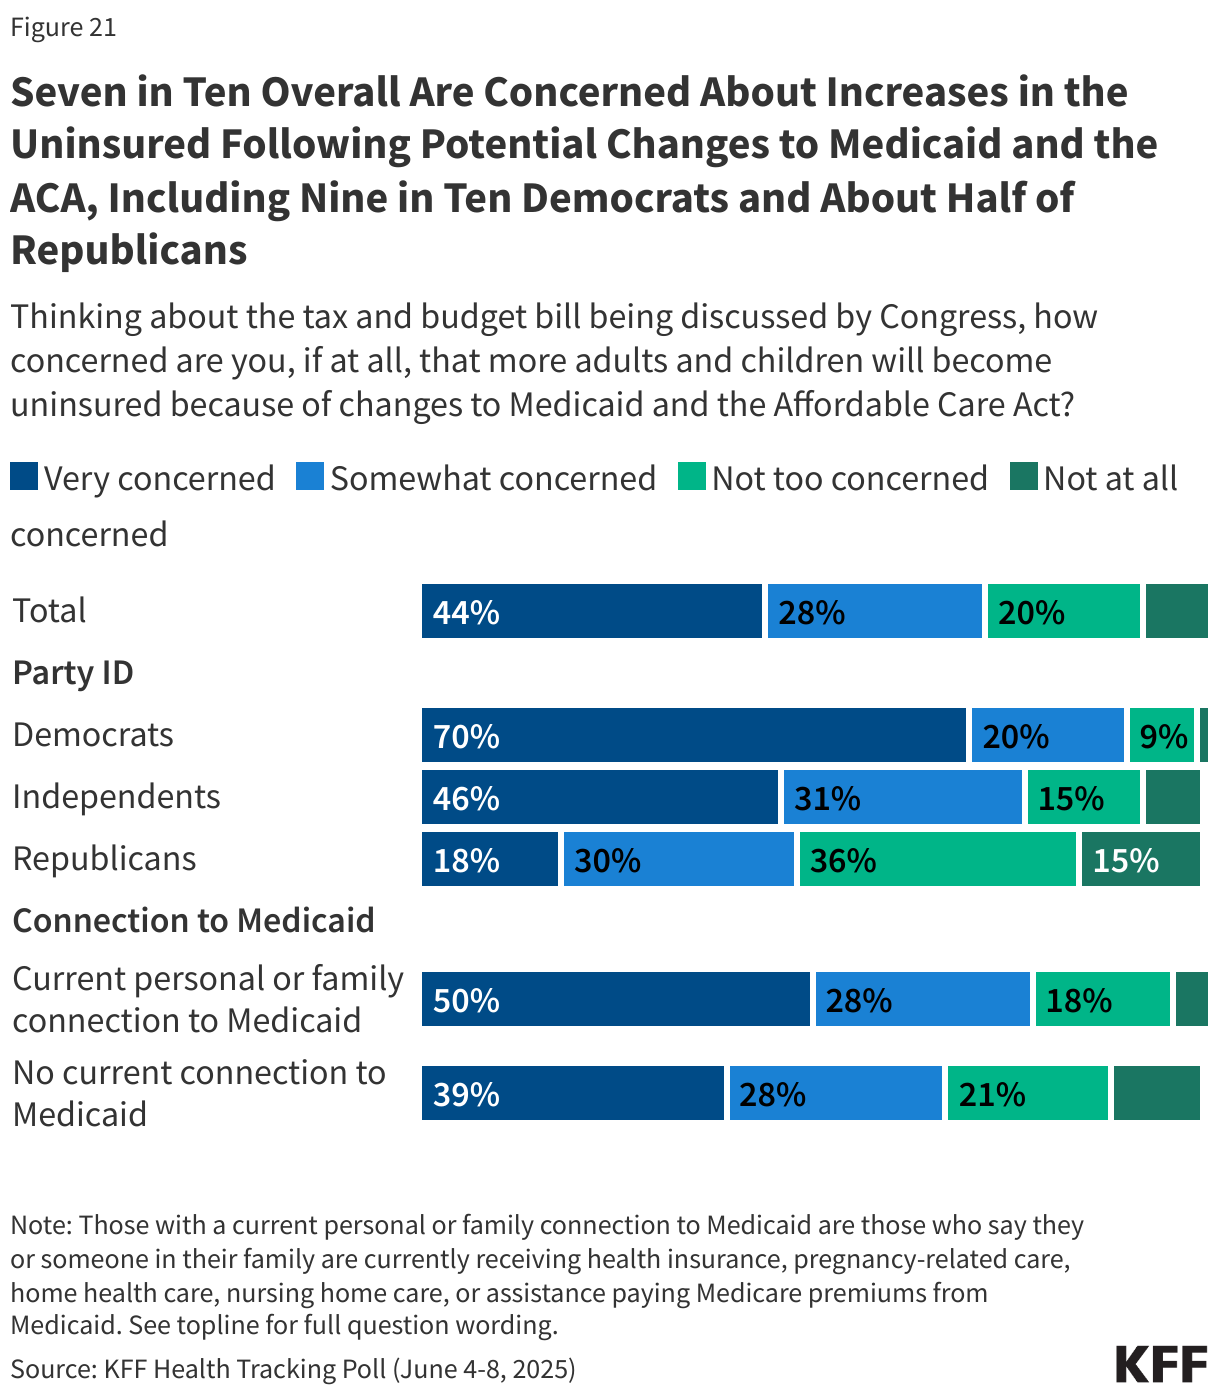
Large majorities of Democrats and independents are also concerned that more adults and children will become uninsured because of changes to Medicaid and the ACA in the tax and budget bill, as are nearly half of Republicans. Among the 44% of adults who have a current personal or family connection to the Medicaid program, nearly eight in ten say they are concerned about the number of people becoming uninsured as a result of the tax and budget bill.
People With Medicaid Are Worried About Impacts of Losing Coverage
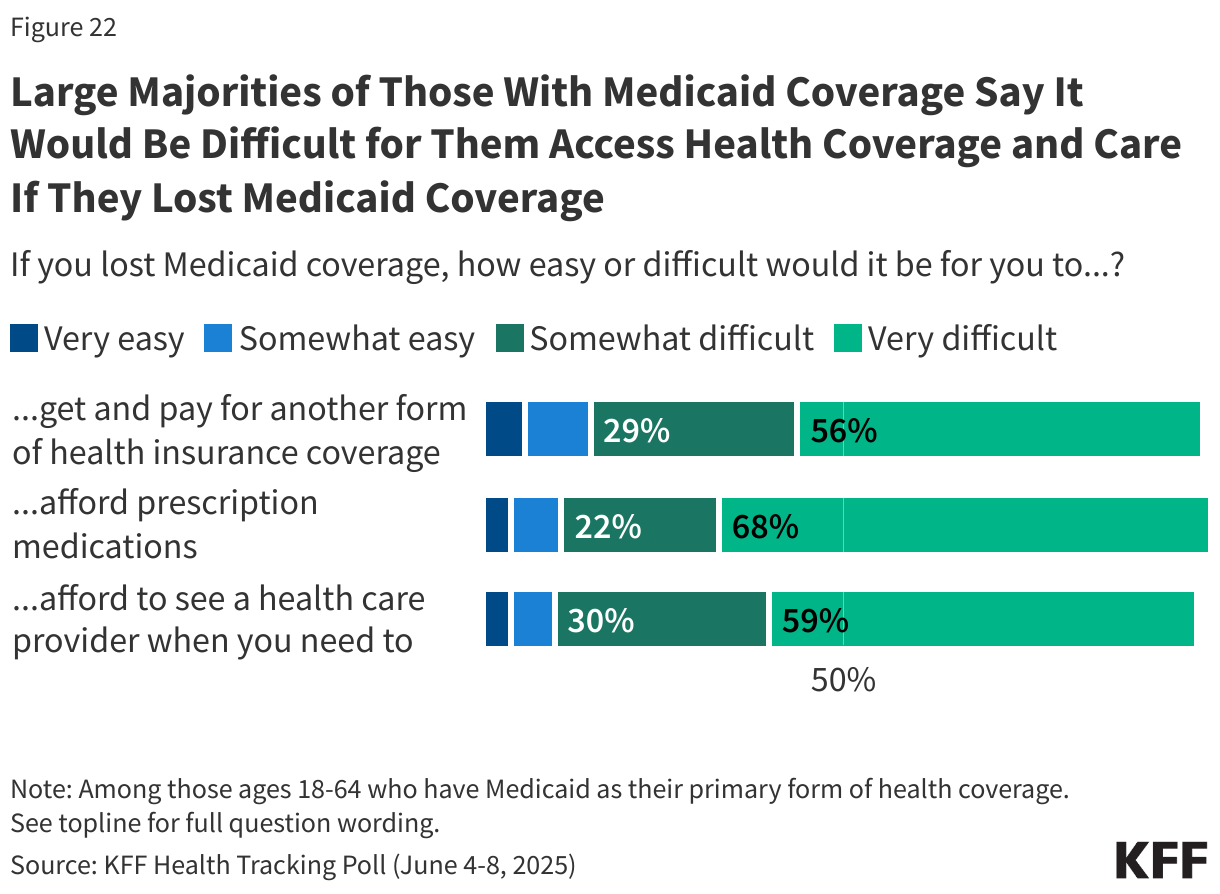
Currently more than 40 million adults receive coverage through the country’s Medicaid program and some of them could lose coverage under the tax and budget bill. Among adults 18-64 with Medicaid coverage, more than half say that if they lost Medicaid, it would be “very difficult” to afford their prescription medications (68%), afford to see a health care provider (59%) or get and pay for another form of coverage insurance coverage (56%).
In addition, most Medicaid enrollees say that losing Medicaid coverage would have a “major impact” on their financial well-being (75%), overall quality of life (69%), their mental health (66%), and their physical health (60%). Four in ten say it would have a “major impact” on their ability to work.