Implementation of 2025 Reconciliation Law: Medicaid Managed Care Rate Setting Uncertainty & Potential Plan Exits

Published: Sep 21, 2026

Managed care is the dominant delivery system for Medicaid enrollees with over three-quarters of Medicaid beneficiaries nationally enrolled in comprehensive managed care organizations (MCOs), accounting for half of total Medicaid spending in FY 2024. The 2025 federal budget reconciliation law is expected to create managed care rate setting challenges for states as the Medicaid provisions impacting enrollment and spending, including program financing changes, work requirements, and more frequent eligibility redeterminations for expansion adults, are rolled out. These changes can create uncertainty about enrollment and acuity as states and their actuaries develop capitation rates. Amid this uncertainty, executives from Elevance Health said during a July earnings call that they were exiting DC’s Medicaid market and expect to exit additional markets. Since then, Louisiana announced an Elevance Health plan will exit at the end of 2026. While MCO entries and exits in specific states or markets are not uncommon, decisions by Elevance Health and the other large, multi-state parent firms about overall participation in Medicaid markets could have broad implications for states, enrollees, and providers, given their large share of national MCO enrollment. This policy watch examines recent and anticipated managed care rate setting challenges and the potential implications of MCO exits.

States and plans expect to face new rate setting challenges with implementation of the 2025 reconciliation law. MCOs are at financial risk for services covered under their contracts, receiving a per member per month “capitation” payment for these services. Capitation rates must be actuarially sound and are applied prospectively, typically for a 12-month rating period, regardless of changes in health care costs or utilization.  States may use a variety of risk mitigation tools to ensure payments are not too high or too low, including risk sharing arrangements, risk and acuity adjustments, medical loss ratios (MLR), or incentive and withhold arrangements. In KFF’s 2025 Medicaid budget survey, many states reported anticipating challenges with projecting the potential impacts of federal policy changes, including work requirements and more frequent eligibility redeterminations for expansion adults, which have implications for member enrollment and acuity (or health risk) on average. Provider tax and state directed payment caps and reductions are also expected to create managed care plan rate setting challenges.

These expected rate setting challenges follow a period of rate setting uncertainty that occurred as millions of people were disenrolled during the “unwinding” of the pandemic-era Medicaid continuous enrollment provision. Higher member risk and utilization patterns began to emerge by late 2023, and many states sought federal approval to adjust rates to address these shifts in FY 2024 and FY 2025. KFF analysis of National Association of Insurance Commissioners (NAIC) data shows that the average medical loss ratio (percentage of premium revenue spent on medical care costs) for the Medicaid managed care market increased from 88% in 2023 to 91% in 2024, implying a potential decrease in profitability. This was the highest average MLR seen across health insurance markets (including group, individual, and Medicare Advantage) in 2024 and the highest average MLR observed for the Medicaid managed care market in the past decade.

Overall changes in acuity from work requirements are uncertain. During unwinding, plans experienced an increase in member acuity as enrollment declined and remaining enrollees had higher health care needs and costs. Some multi-state parent firms have indicated publicly on earnings calls that they do not expect acuity changes going forward to be as significant (as the shift that occurred during / post unwinding), in part, because work requirement and more frequent eligibility determination policies target expansion adults (and not all Medicaid populations).

Five for-profit, publicly traded companies – Centene, Elevance Health, UnitedHealth Group, Molina, and Aetna/CVS –account for nearly half of all Medicaid MCO enrollment (Figure 1). These firms have a wide geographic reach in Medicaid, each operating MCOs in 13 or more of the 42 MCO states.
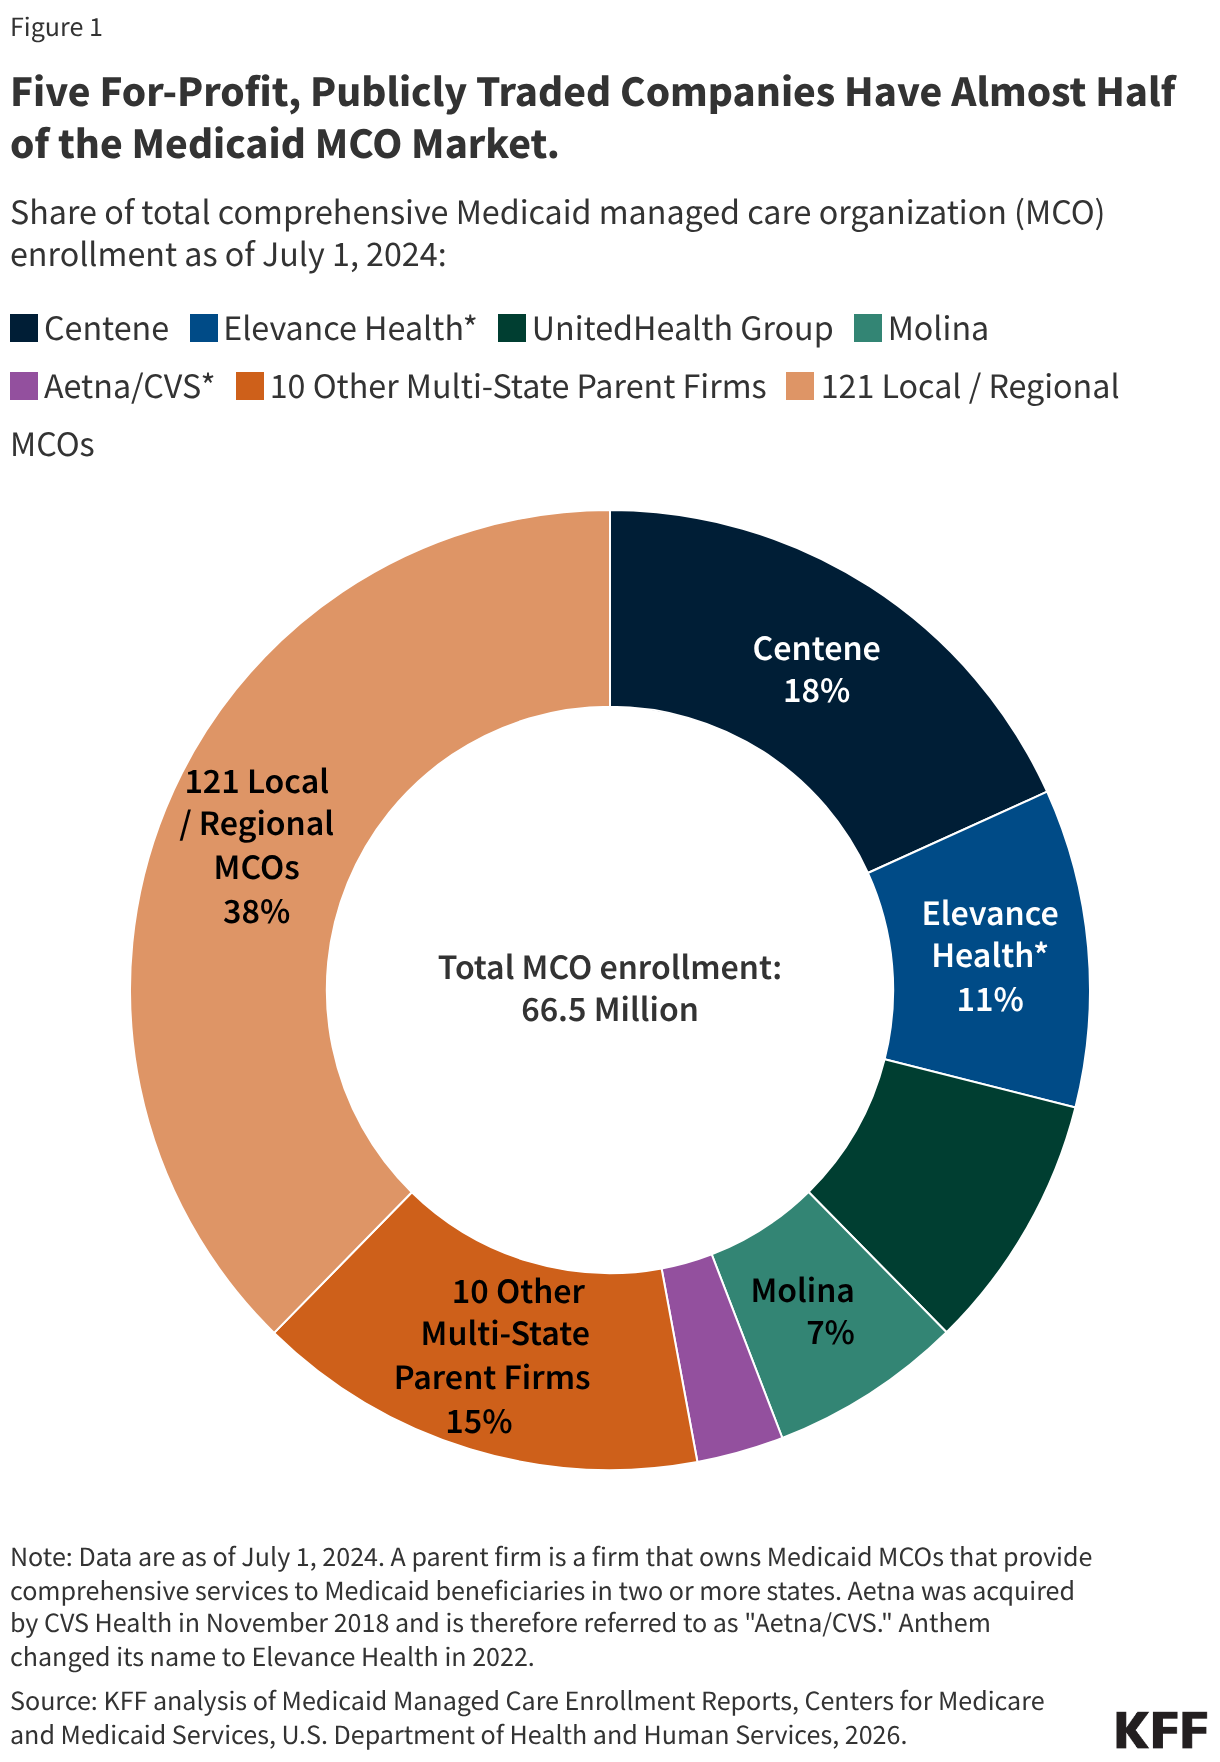
Five For-Profit, Publicly Traded Companies Have Almost Half of the Medicaid MCO Market. (Donut Chart)

In July 2026, executives from Elevance Health said they expect to exit Medicaid markets over the next 12 to 18 months. During its second quarter 2026 earnings call, executives reported they are reviewing their overall Medicaid portfolio and will plan to exit markets “where the economics don’t support sustainable performance.” Elevance executives did not identify the states/markets where the exits are expected to occur beyond DC, or how many enrollees could be affected. Elevance offers MCOs in 21 states (Figure 2). Its share of Medicaid MCO enrollment varies across states, ranging from 6% to 44% (as of July 2024). Medicaid members account for about 20% of the firm’s overall medical membership. Executives reported that while acuity shifts are moderating and rates are increasingly reflecting experience, utilization remains elevated compared to pre-pandemic levels. The firm expects its full-year 2026 Medicaid operating margin to be -1.75% (the percentage of revenue left over after paying operating costs) and to see incremental acuity pressure in 2027.
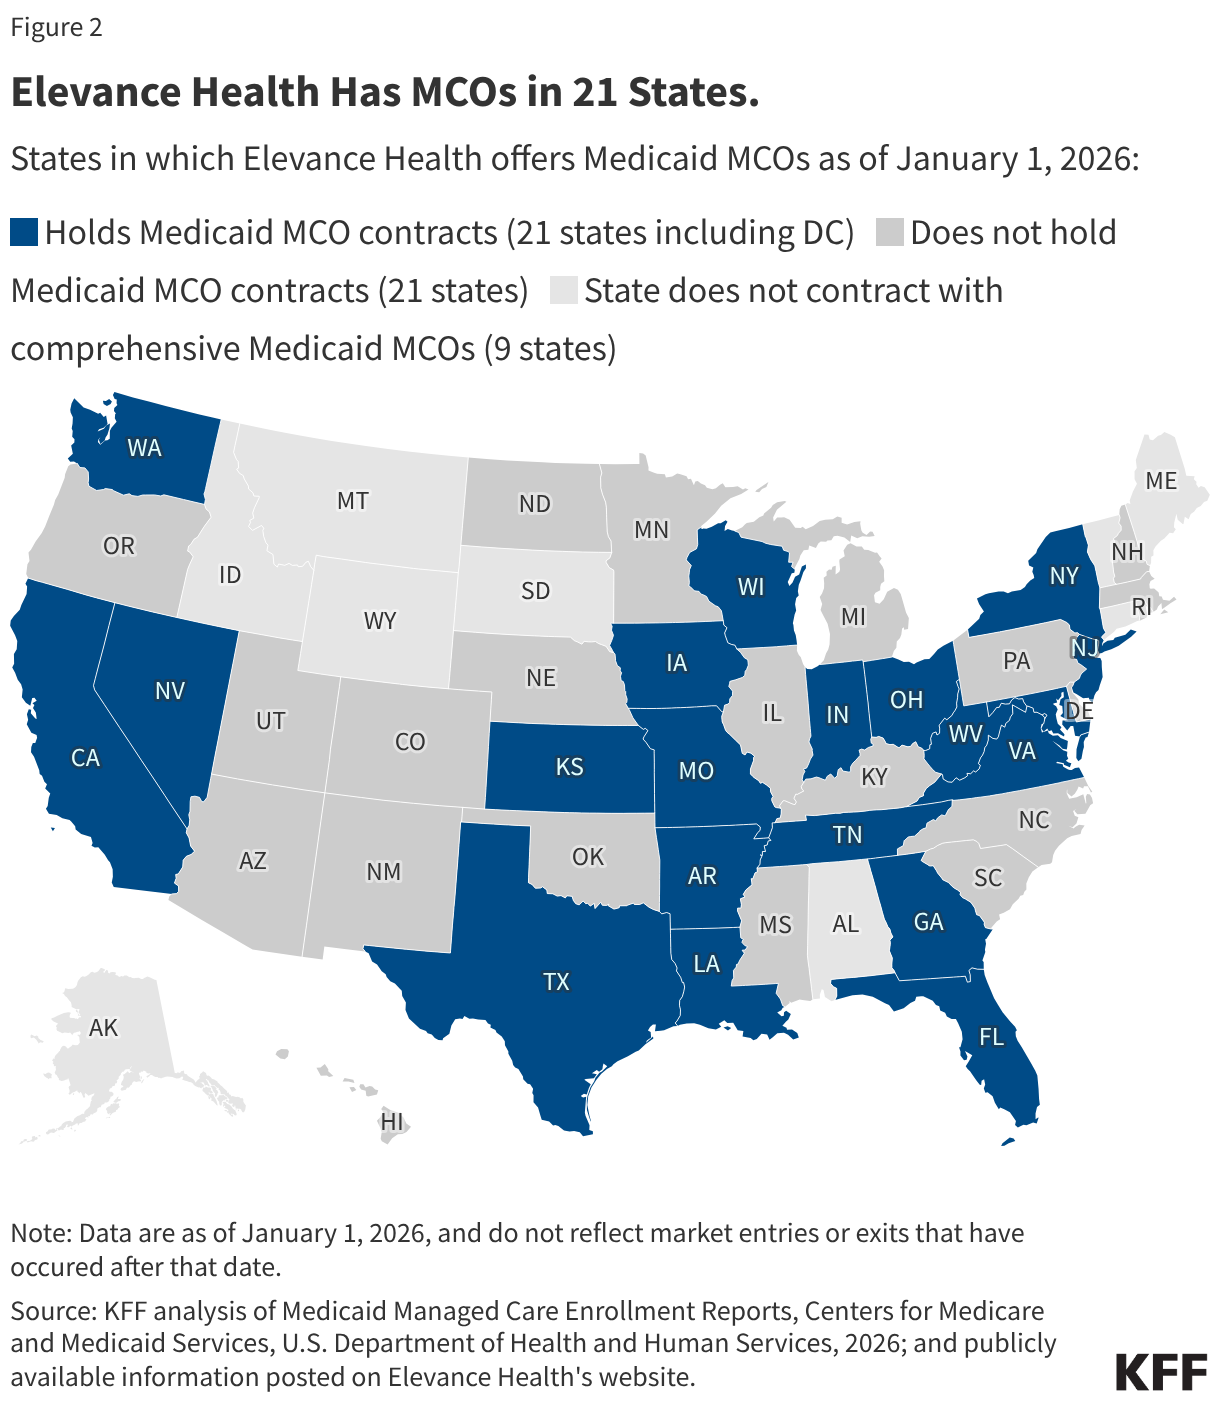
Elevance Health Has MCOs in 21 States. (Choropleth map)

Wellpoint DC (an Elevance subsidiary) exited DC’s Medicaid program effective August 1, 2026, following a “mutual agreement” with the DC Department of Health Care Finance.  (Wellpoint DC (formerly Amerigroup) was awarded its most recent DC Medicaid MCO contract in 2022 following a contested procurement process.) The contract, which began in April 2023, was scheduled to run through January 2028. In September 2026, the Louisiana Department of Health announced that Elevance’s Healthy Blue plan will exit the state’s Medicaid program after its contract expires at the end of 2026.

The other large for-profit parent firms (Centene, Molina, UnitedHealth, and CVS) did not discuss planning to exit Medicaid markets during their public Q2 2026 earnings calls. However, Centene reportedly plans to exit Arkansas’ Medicaid expansion program in 2027, which uses Medicaid funds to purchase Marketplace coverage, citing current funding challenges.

Managed care plan exits could lead to short-term administrative burden for providers and care disruptions for enrollees. For providers, plan transitions may create additional administrative burden at a time when many may also be helping enrollees navigate new eligibility requirements. Plan transitions may also cause disruptions in care for enrollees if their providers are now out-of-network or they need to obtain new prior authorizations. Disruptions may have more severe consequences for certain populations, such as enrollees who are pregnant or those in the middle of a course of treatment. Federal rules include requirements related to managed care enrollment processes and continuity of care. States can also set requirements for plan transitions through managed care contracts. For example, states can require exiting plans to provide notice of the exit within specified timeframes and to transfer data to the state and the plans receiving their enrollees. States can also set requirements for the receiving plans such as honoring prior authorizations granted by an enrollee’s previous plan and allowing enrollees to see out-of-network providers for a certain period after the transition.

Managed care plan exits could also have longer-term effects on the market.  For example, plan exits could result in higher quality of care in the market if lower performing plans exit. At the same time, fewer plans in an (already concentrated) market could reduce competition which could have negative effects on cost, quality, and/or access. State procurement policies and program design can be used to help promote competition and quality in the market by influencing the number and mix of plans in a state.

This work was supported in part by Arnold Ventures. KFF maintains full editorial control over all of its policy analysis, polling, and journalism activities.
Overview of Health Coverage and Care for Individuals with Limited English Proficiency (LEP)

Published: Sep 21, 2026

Introduction

As of 2024, approximately 28.5 million people in the United States ages five and older have limited English proficiency (LEP). The federal government defines people with LEP as those who do not speak English as their primary language and who have a limited ability to read, write, speak, or understand English (also described as speaking English “less than very well”). Individuals with LEP disproportionately experience gaps in health insurance coverage and poor health outcomes, in part, due to language access barriers. Because people of color are more likely than White people to have LEP, these barriers can also exacerbate racial and ethnic disparities in health and health care.

This brief provides an overview of individuals ages five and older who have LEP and their health coverage based on KFF analysis of the 2024 American Community Survey (ACS) data. It also incorporates data on health and access to health care for adults with LEP from the 2023 KFF Survey on Racism, Discrimination, and Health. For this analysis, individuals with LEP are identified as those who are ages five or older who report speaking a language other than English at home and speaking English less than “very well.” Key takeaways include:

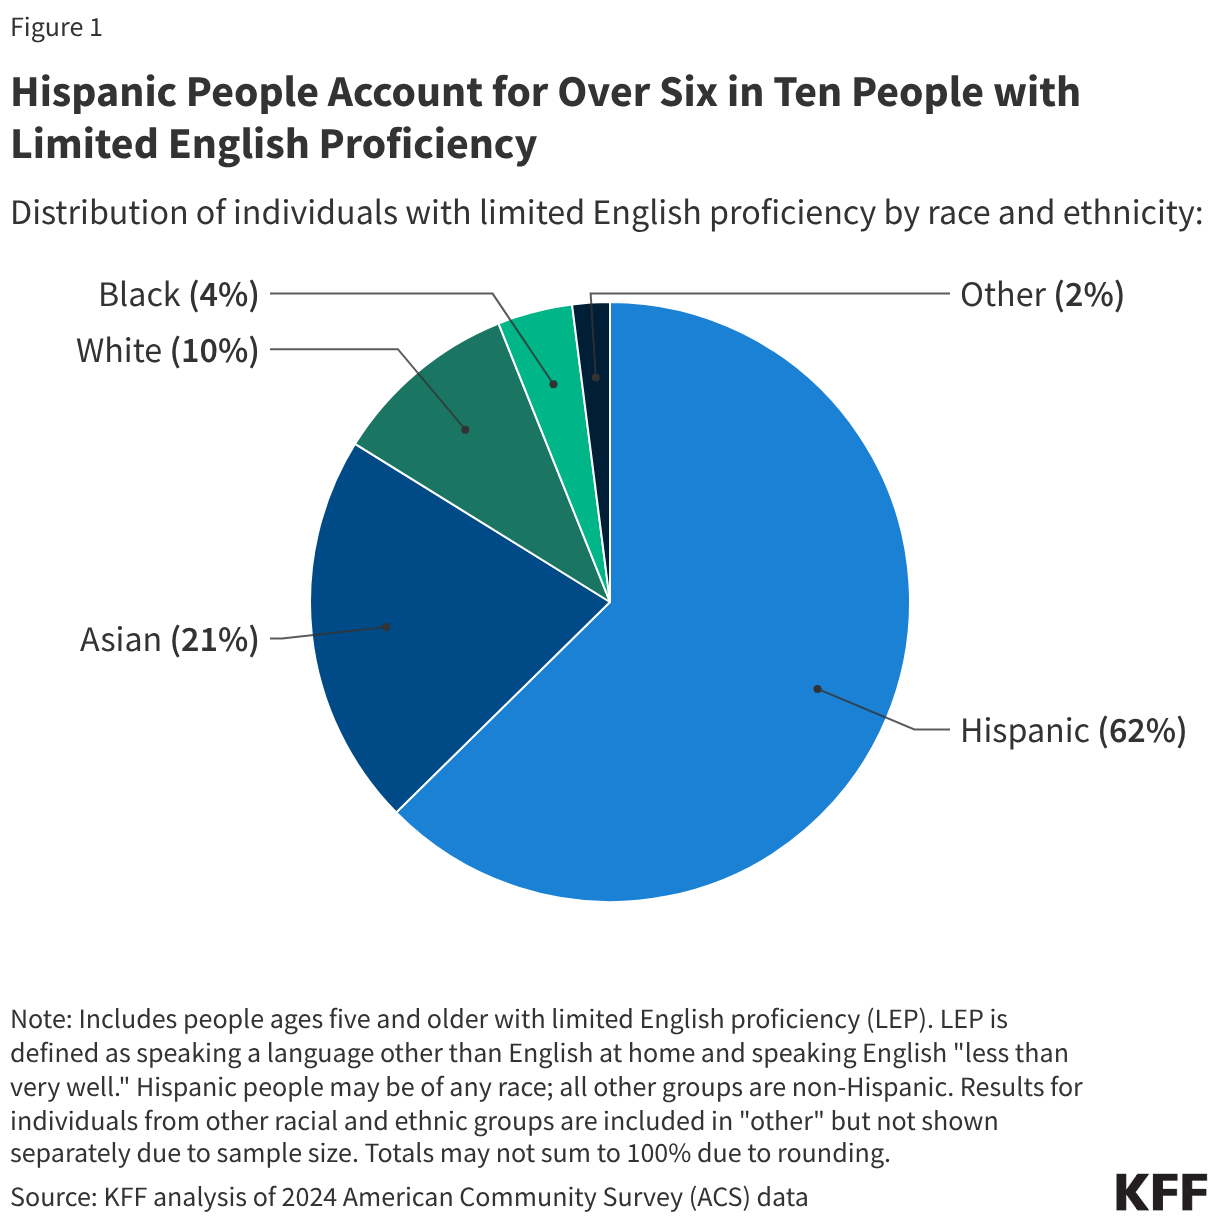
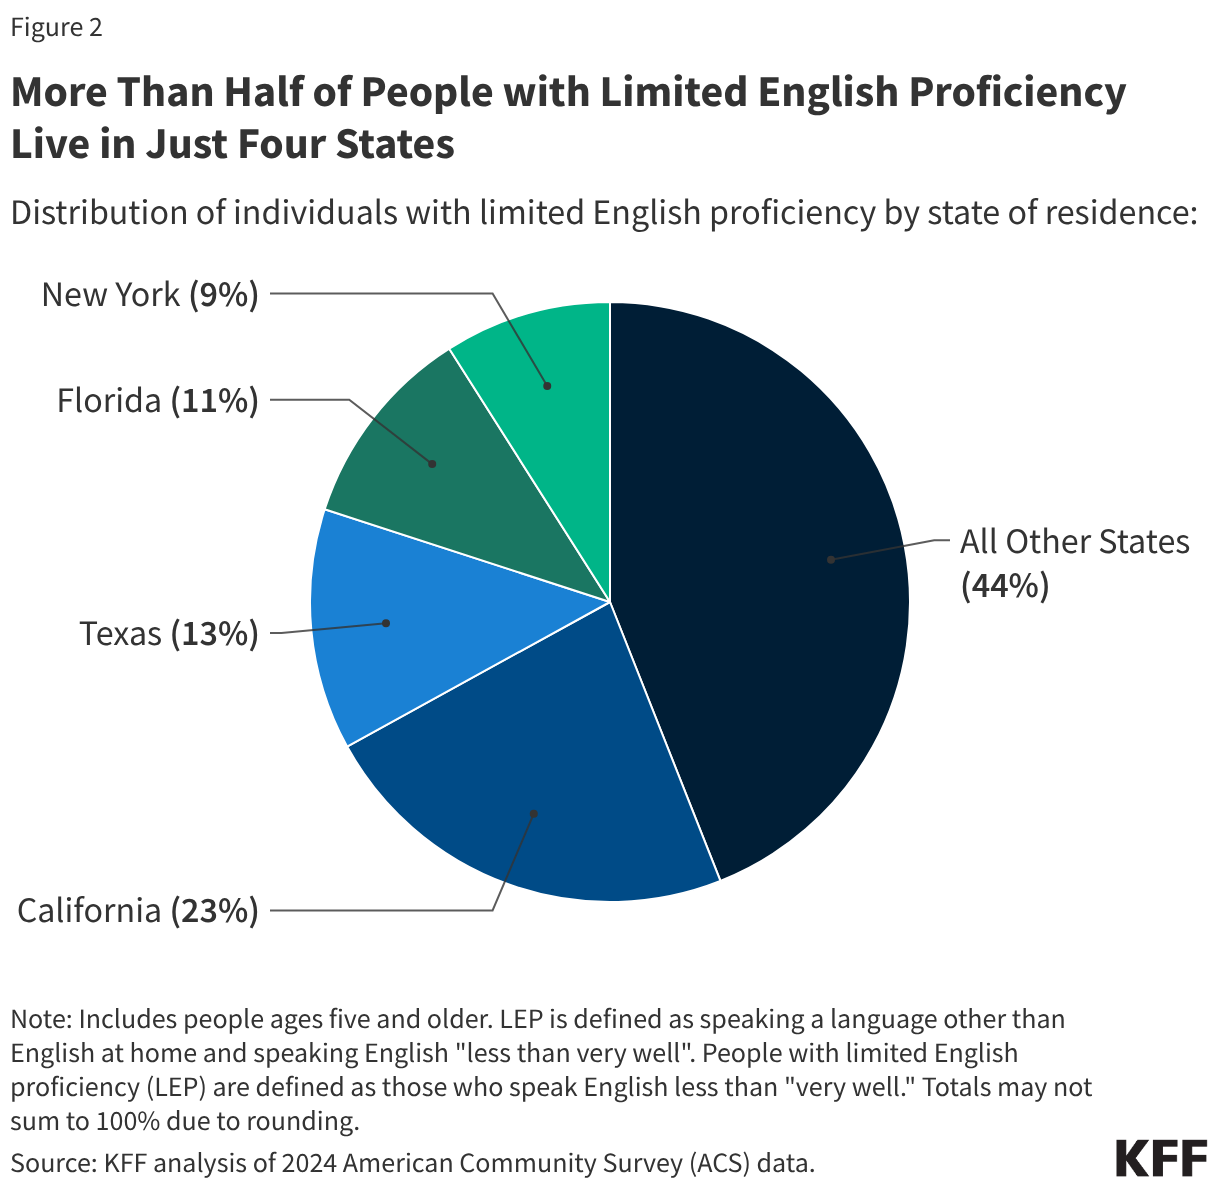
  • People with LEP are a large and growing population who are disproportionately likely to be Hispanic or Asian and largely concentrated in a handful of states. The number of people ages five and older with LEP in the U.S. has grown from 25.7 million or 8% of the population as of 2021 to 28.5 million or 9% of the population as of 2024. Most individuals with LEP are Hispanic or Asian, with Hispanic people accounting for nearly two thirds (62%) of the population with LEP and Asian people accounting for about one in five (21%) of people with LEP. More than half of people with LEP live in just four states: California (23%), Texas (13%), Florida (11%), and New York (9%).
  • Individuals with LEP are more than three times as likely to be uninsured as people who are English proficient (23% vs. 7%). This higher uninsured rate is driven by a lower rate of private coverage, likely reflecting that people with LEP are disproportionately employed in jobs and industries less likely to offer health coverage and may face challenges affording it when it is available. Medicaid coverage helps fill this gap in private coverage but does not fully offset the difference.
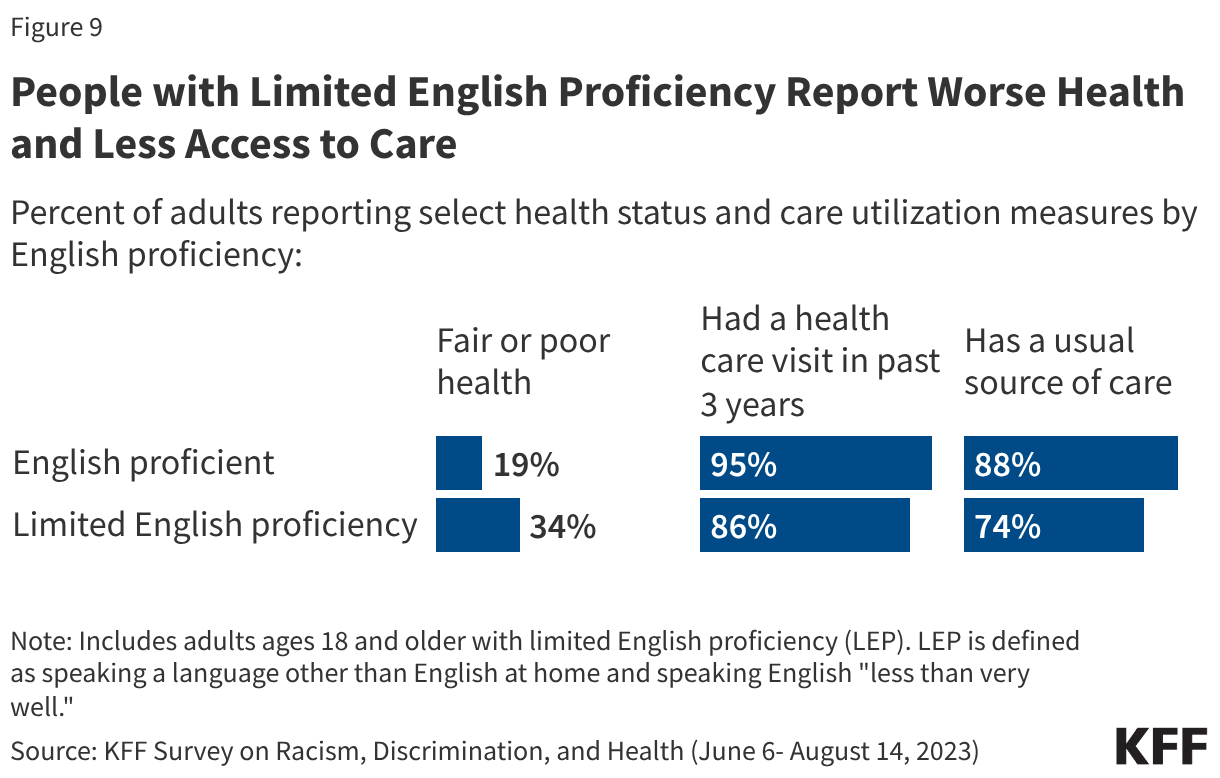
  • Adults with LEP report worse access to care and health outcomes than those who are English proficient. Adults with LEP are less likely than English proficient adults to say they had a health care visit in the past three years (86% vs. 95%) and are less likely to have a usual source of care other than the emergency room (74% vs. 88%). Additionally, about a third (34%) of adults with LEP describe their physical health as “fair” or “poor” compared to about one in five (19%) English proficient adults. Language barriers can make it difficult for people with LEP to access and navigate the health care system. For example, they may face difficulty understanding eligibility rules, completing applications, scheduling appointments, filling out provider forms, communicating with medical office staff, or understanding care or medication instructions.
  • Federal policy changes will likely make it harder for people with LEP to access health coverage and care. The Trump Administration designated English as the official language of the U.S., which may reduce availability of language access services. People with LEP may also face challenges navigating new Medicaid requirements  under the 2025 reconciliation law, including work requirements and more frequent redeterminations, particularly if outreach and communications are not available in their language. People with LEP who are lawfully present immigrants may face compounding challenges associated with reduced eligibility for coverage under the same law and increased immigration-related fears in the current environment.Amid these challenges, key protections remain in place for people with LEP. Title VI of the Civil Rights Act and Section 1557 of the Affordable Care Act prohibit discrimination against people based on their national origin, including their ability to communicate in English, and require many health care entities, including Medicaid agencies, to provide meaningful access to people with LEP.

Overview of People With LEP

As of 2024, 28.5 million, or nearly one in ten (9%) people ages five or older living in the United States had LEP, up from 25.7 million, or 8%, in 2021. Most people with LEP are Hispanic and Spanish speaking. Hispanic people account for over six in ten (62%) people with LEP, and Asian people account for about one in five (21%), with other racial and ethnic groups accounting for smaller shares (Figure 1). Reflecting the racial and ethnic distribution of this population, Spanish is the primary language spoken among people with LEP (63%), followed by Chinese (7%), Vietnamese (3%), Tagalog (2%), and Arabic (2%).

Hispanic People Account for Over Six in Ten People with Limited English Proficiency (Pie Chart)

While people with LEP live across the country, more than half (56%) live in four states: California (23%), Texas (13%), Florida (11%), and New York (9%) (Figure 2). The remaining 44% of the population is spread across the rest of the country.

More Than Half of People with Limited English Proficiency Live in Just Four States (Pie Chart)

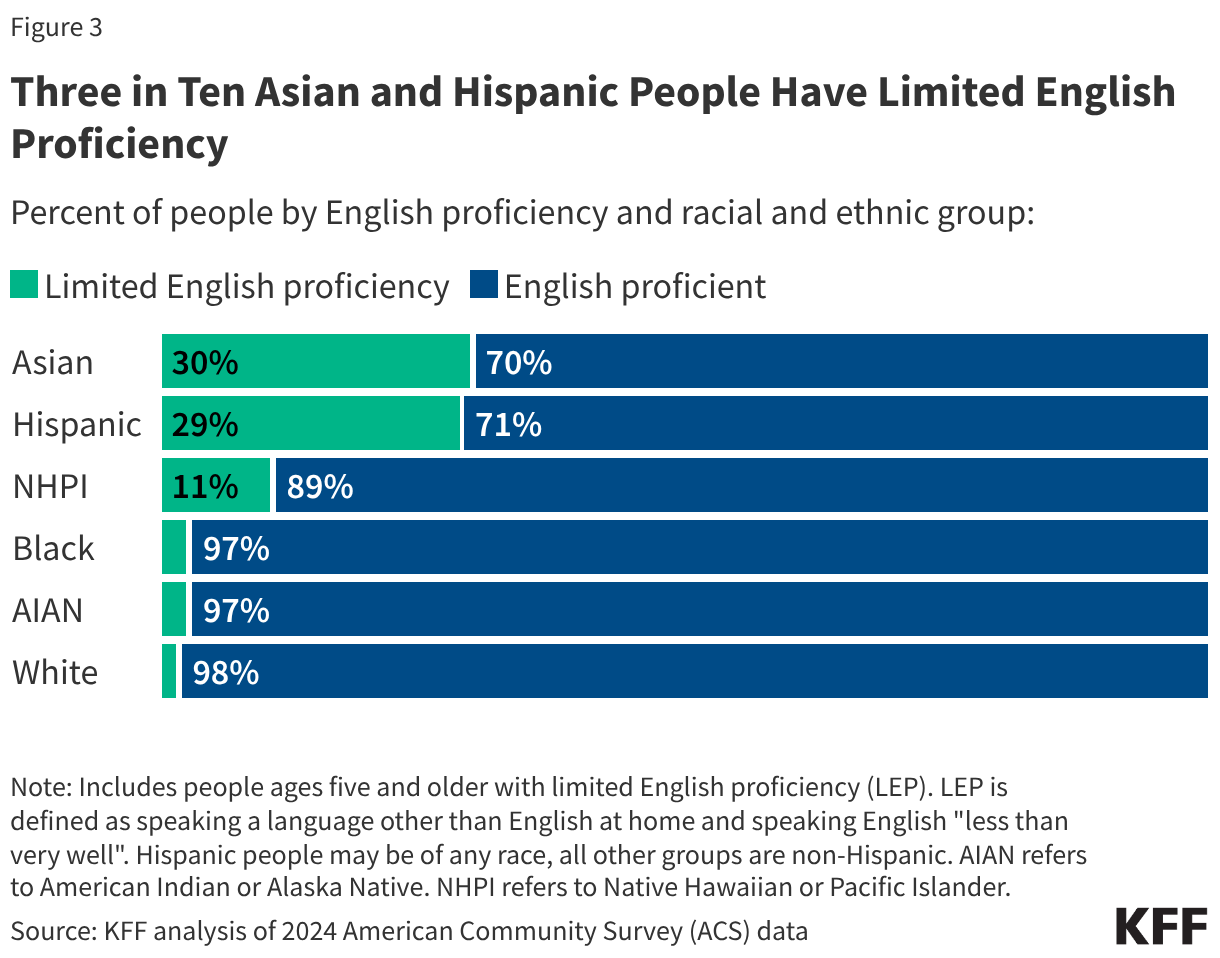
Asian and Hispanic adults have the highest rates of LEP across racial and ethnic groups. About three in ten Asian (30%) and Hispanic (29%) people have LEP, while rates are lower for Native Hawaiian or Pacific Islander (NHPI) (11%), Black (3%), American Indian or Alaska Native (AIAN) (3%), and White people (2%).

Three in Ten Asian and Hispanic People Have Limited English Proficiency (Stacked Bars)

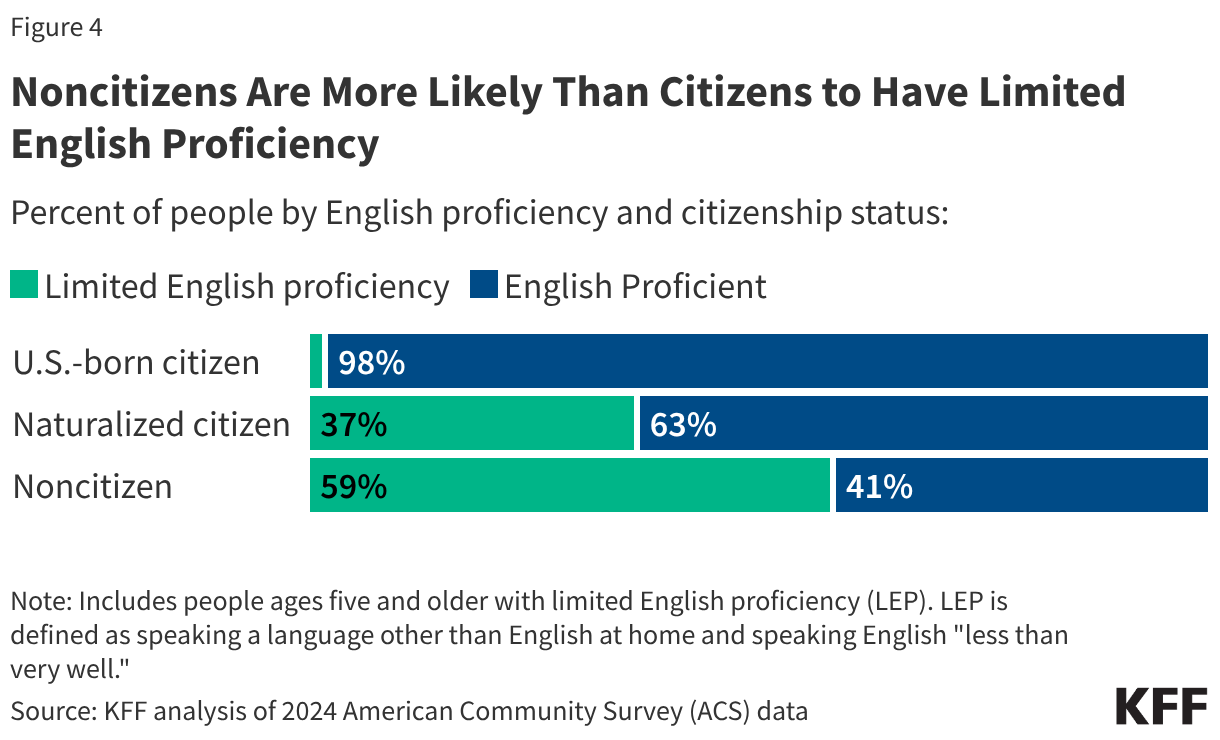
Noncitizen immigrants are more likely than citizens to report having LEP. Nearly six in ten (59%) noncitizen immigrants have LEP compared to over a third (37%) of naturalized citizens and just 2% of U.S.- born citizens (Figure 4).

Noncitizens Are More Likely Than Citizens to Have Limited English Proficiency (Stacked Bars)

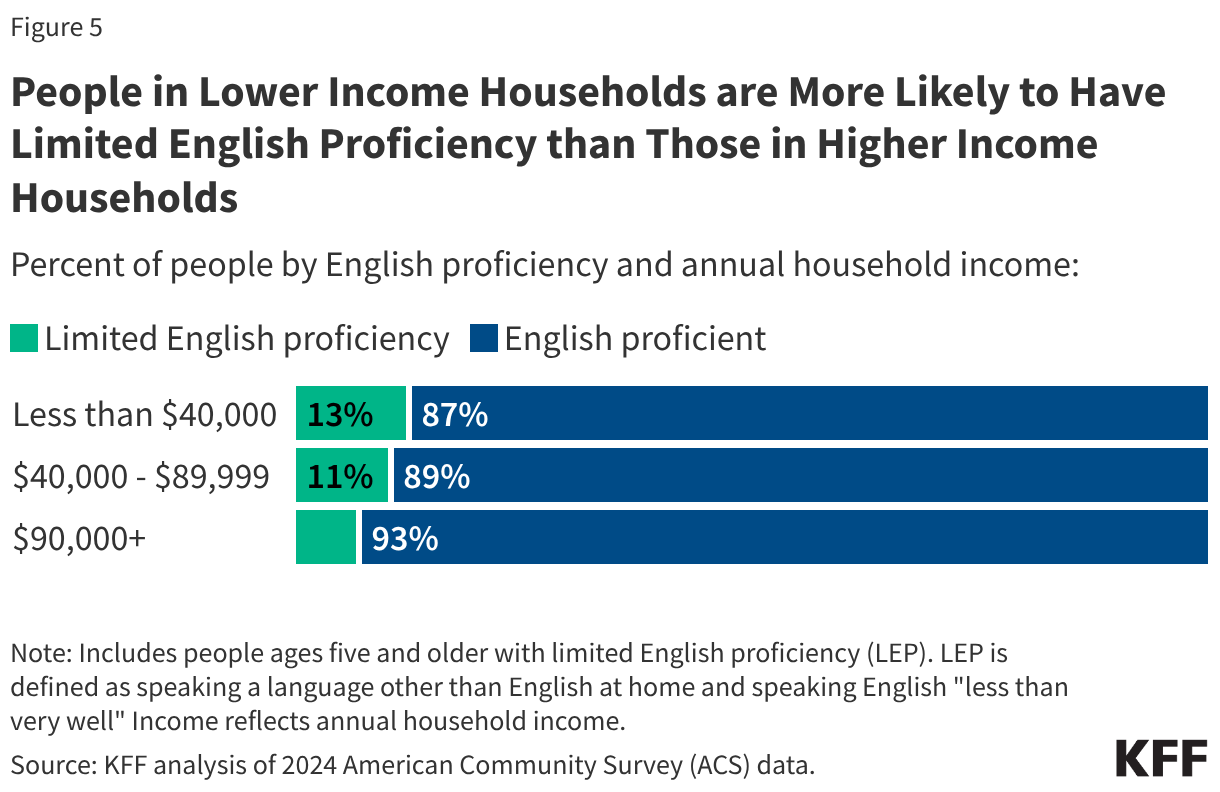
LEP is also more common among people with lower household incomes. Over one in ten (13%) of individuals in households with an annual income below $40,000 have LEP compared to 7% in households with an annual income of $90,000 or more (Figure 5).

People in Lower Income Households are More Likely to Have Limited English Proficiency than Those in Higher Income Households (Stacked Bars)

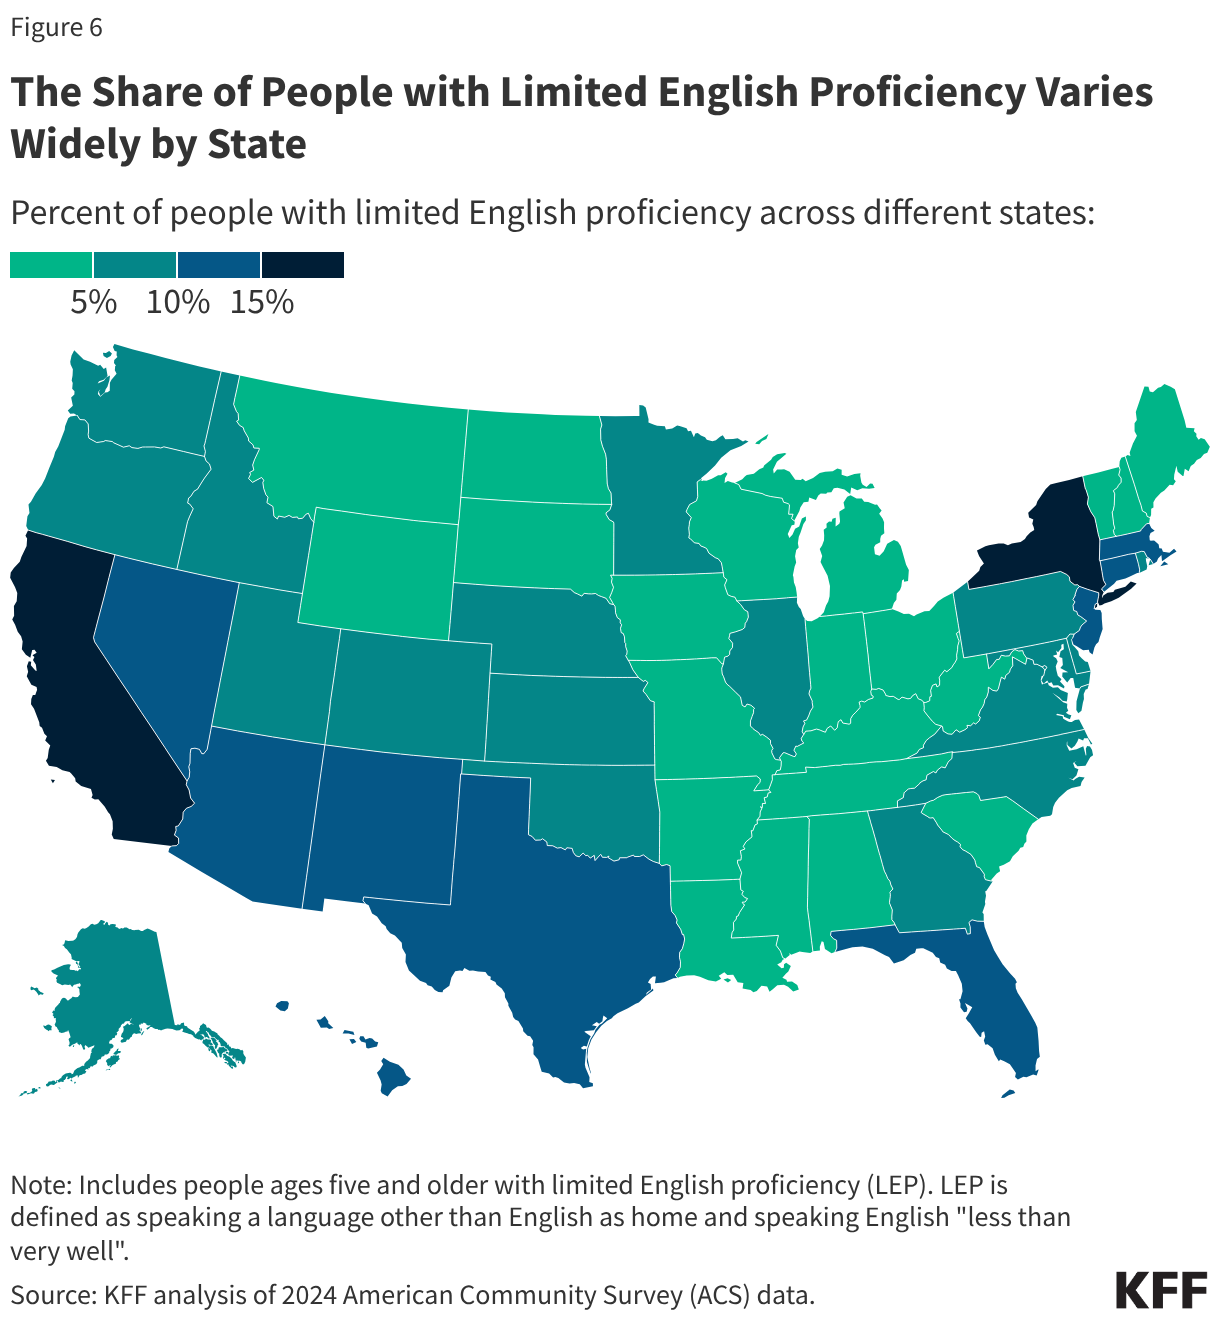
The share of people with LEP varies widely across states, from less than 1% in West Virginia to 18% in California. Other states with relatively high rates of people with LEP include New York (15%), New Jersey (14%), Florida (14%), Texas (13%), Nevada (12%), Hawaii (11%), and Massachusetts (10%) (Figure 6). This pattern likely reflects the high shares of Hispanic and Asian people and immigrants residing in those states.

The Share of People with Limited English Proficiency Varies Widely by State (Choropleth map)

Health Coverage Among People with LEP

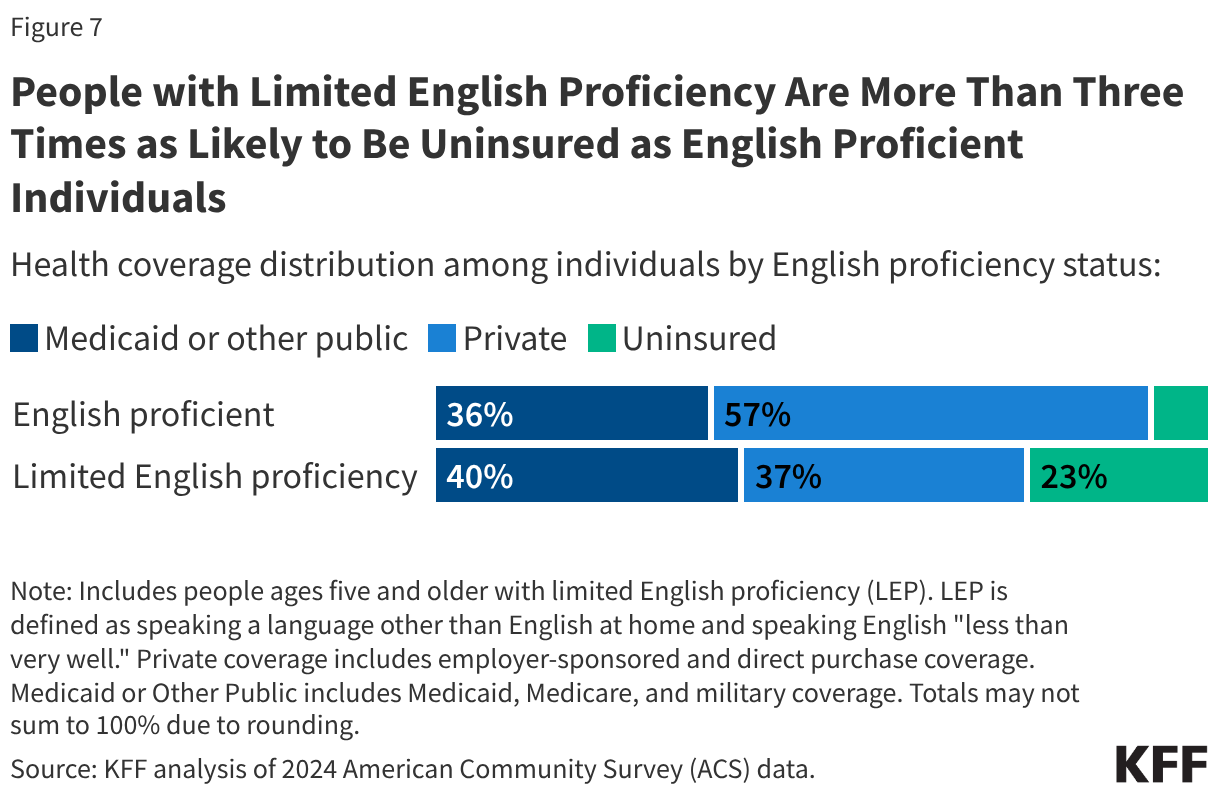
Individuals with LEP are more than three times as likely to be uninsured as English proficient individuals (23% vs. 7%). This higher uninsured rate is driven by a lower rate of private coverage. Just over a third (37%) of people with LEP have private coverage, compared to nearly six in ten (57%) English proficient individuals, a gap that likely reflects a disproportionate share of people with LEP working in lower income jobs and industries that are less likely to offer employer-sponsored coverage. While Medicaid coverage helps offset some of this gap, it does not fully close it, leaving people with LEP more likely to be uninsured than those who are English proficient (Figure 7).

People with Limited English Proficiency Are More Than Three Times as Likely to Be Uninsured as English Proficient Individuals (Stacked Bars)

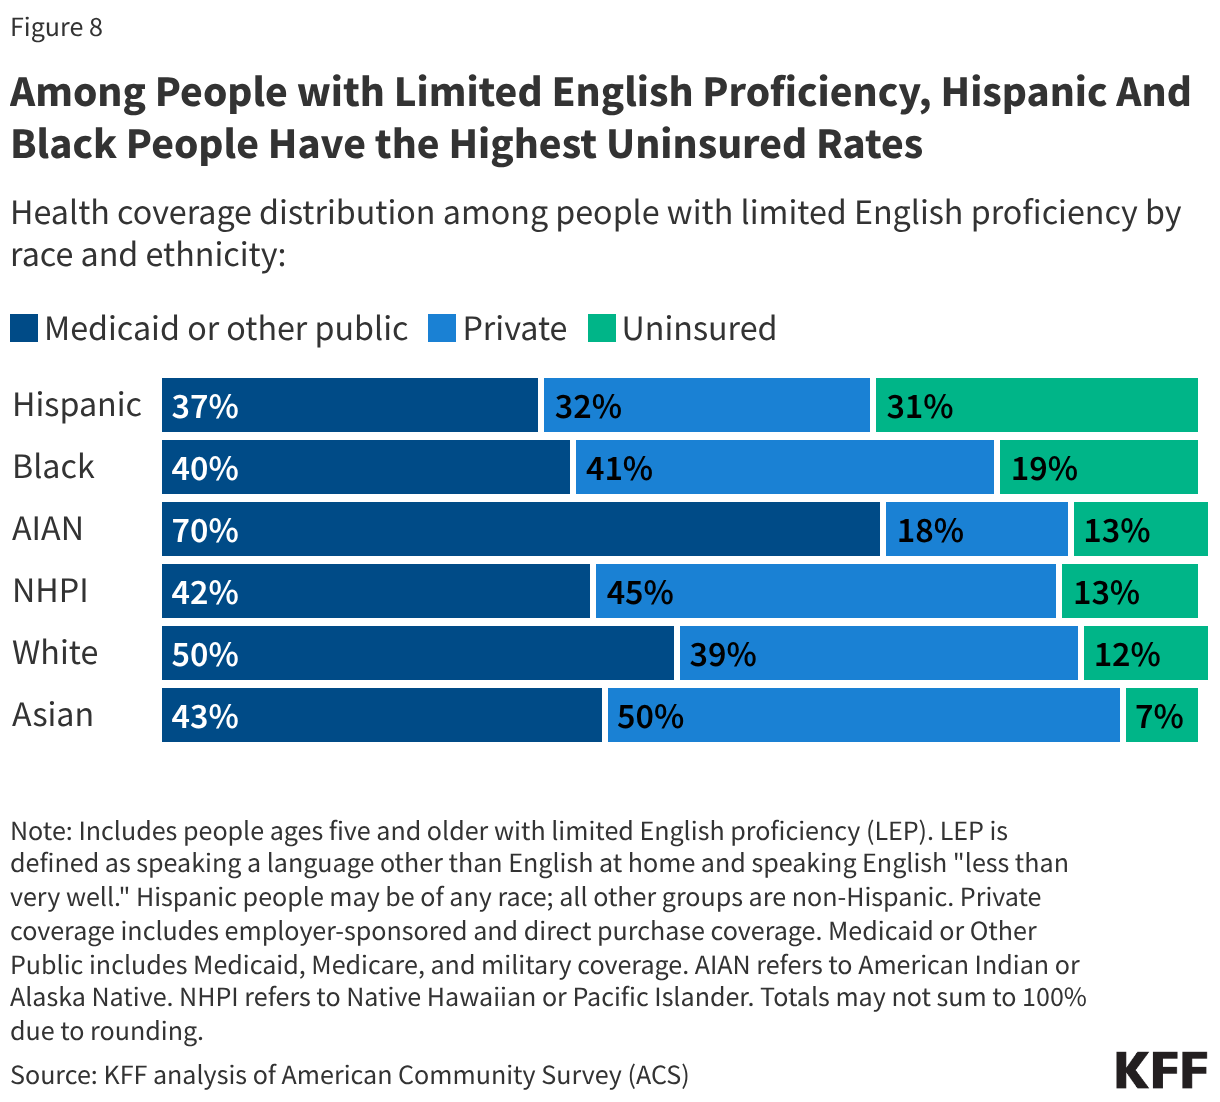
Among people with LEP, Hispanic (31%) and Black people (19%) have higher uninsured rates than their White counterparts (12%) (Figure 8). In contrast, Asian people with LEP have the highest rate of private coverage (50%) and the lowest uninsured rate (7%) across racial and ethnic groups. These racial and ethnic patterns are consistent with patterns among the broader population and likely reflect a variety of factors, including differences in access to private coverage, income, and citizenship status.

Among People with Limited English Proficiency, Hispanic And Black People Have the Highest Uninsured Rates (Stacked Bars)

Challenges and Barriers to Care for People with LEP

Adults with LEP report more limited access to and use of care and worse health outcomes than their English proficient counterparts. KFF survey data from 2023 show that adults with LEP are less likely than those who are English proficient to have had a health care visit in the past three years (86% vs. 95%) and less likely to have a usual source of care other than the emergency room (74% vs. 88%). Additionally, over one in three (34%) of adults with LEP report their physical health as fair or poor compared to 19% of their English proficient counterparts (Figure 9).Other research also shows that people with LEP experience worse access to care and health outcomes than those who are English proficient. A 2024 review found that people with LEP are less likely to access ambulatory care, hospitalization, cancer screening, chronic care management, and general health care. Having LEP is associated with lower use of preventative health care and with health behaviors linked to chronic disease. Beyond utilization, a 2025 review of cardiovascular disease found that patients with LEP and heart failure were more likely to have higher rates of hospital readmission and emergency care than English proficient patients with heart failure. Having LEP is also associated with lower rates of cancer screening.

People with Limited English Proficiency Report Worse Health and Less Access to Care (Split Bars)

Language barriers can make it difficult for people with LEP to enroll in health coverage even if they are eligible. Enrolling in health coverage requires understanding plan options, eligibility rules, and application processes, which can be challenging without translation options. A 2022 KFF analysis of state Medicaid websites found that 39 of 50 states offered a translated Medicaid PDF application online, but only 13 of those states offered a translation in a language other than Spanish, leaving most people with LEP who speak other languages with no in-language option. Call centers, often a primary resource for enrollees, showed similar gaps. While 40 states offered assistance in another language, 31 only offered it in Spanish. Gaps in language access can also make it more difficult for people to stay enrolled in coverage even if they are eligible. For example, among Medicaid enrollees in Illinois, individuals with LEP were over five times more likely than English proficient enrollees to be disenrolled, with 85% reporting they needed help reading their renewal notice, and 94% saying they needed help completing the enrollment form.

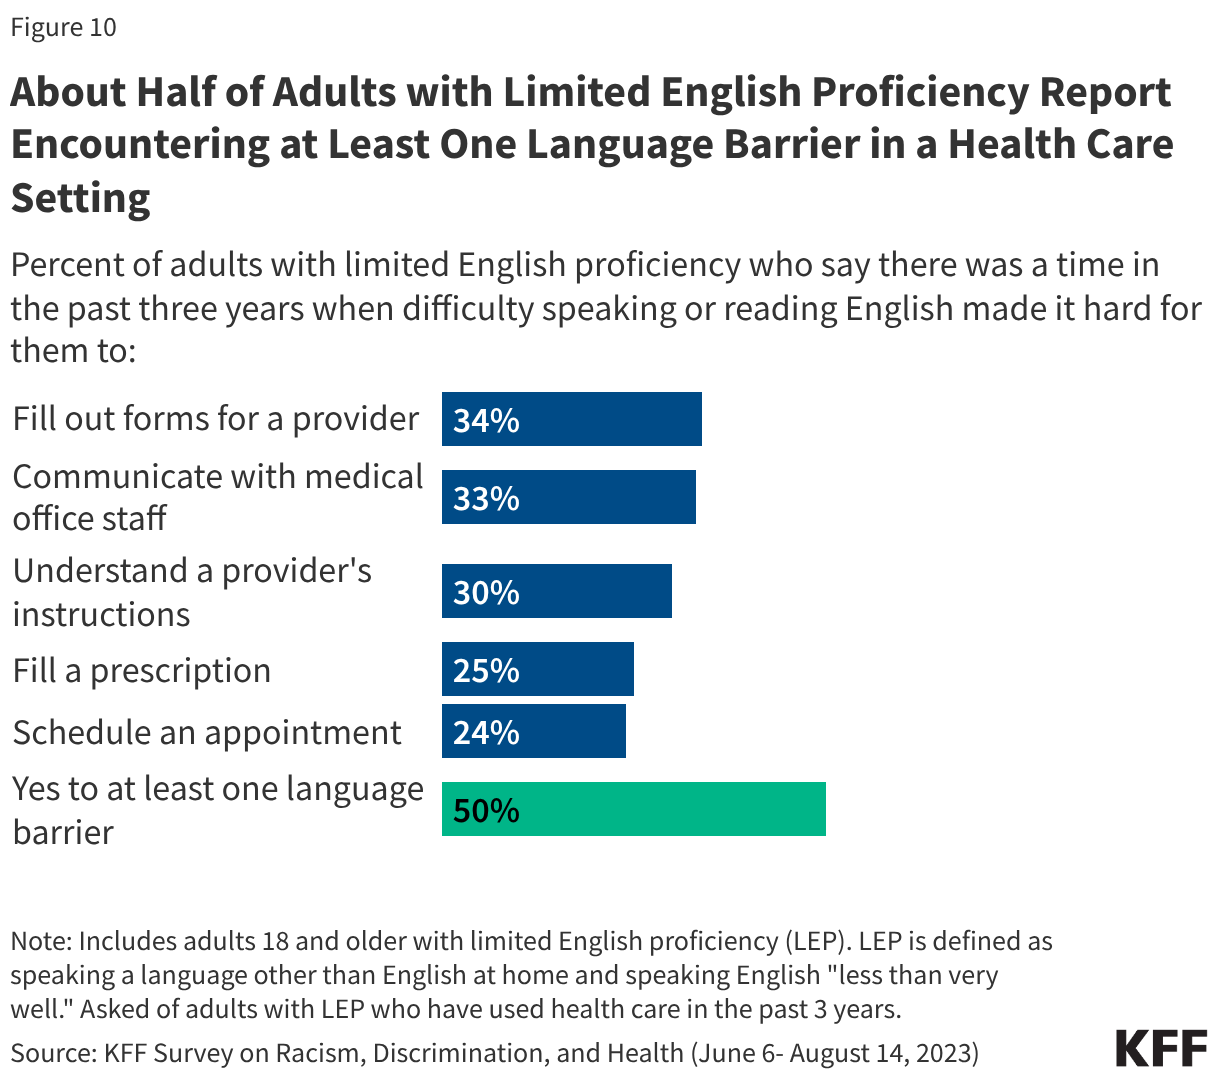
Beyond enrollment in health coverage, language barriers can create challenges to accessing care. KFF 2023 survey data show that about half (50%) of adults with LEP said they encountered at least one language barrier in a health care setting in the past three years, including difficulty filling out forms for a provider (34%), communicating with medical office staff (33%), understanding a provider’s instructions (30%), filling a prescription or understanding how to use it (27%), or scheduling a medical appointment (25%) (Figure 10). Language barriers also shape the quality of care people receive. For example, adults with LEP are less likely than English proficient adults to report that their provider explained things in a way they could understand (81% vs. 89%), spent enough time with them during visits (68% vs. 76%), and involved them in decision making about their care (63% vs. 82%).

About Half of Adults with Limited English Proficiency Report Encountering at Least One Language Barrier in a Health Care Setting (Bar Chart)

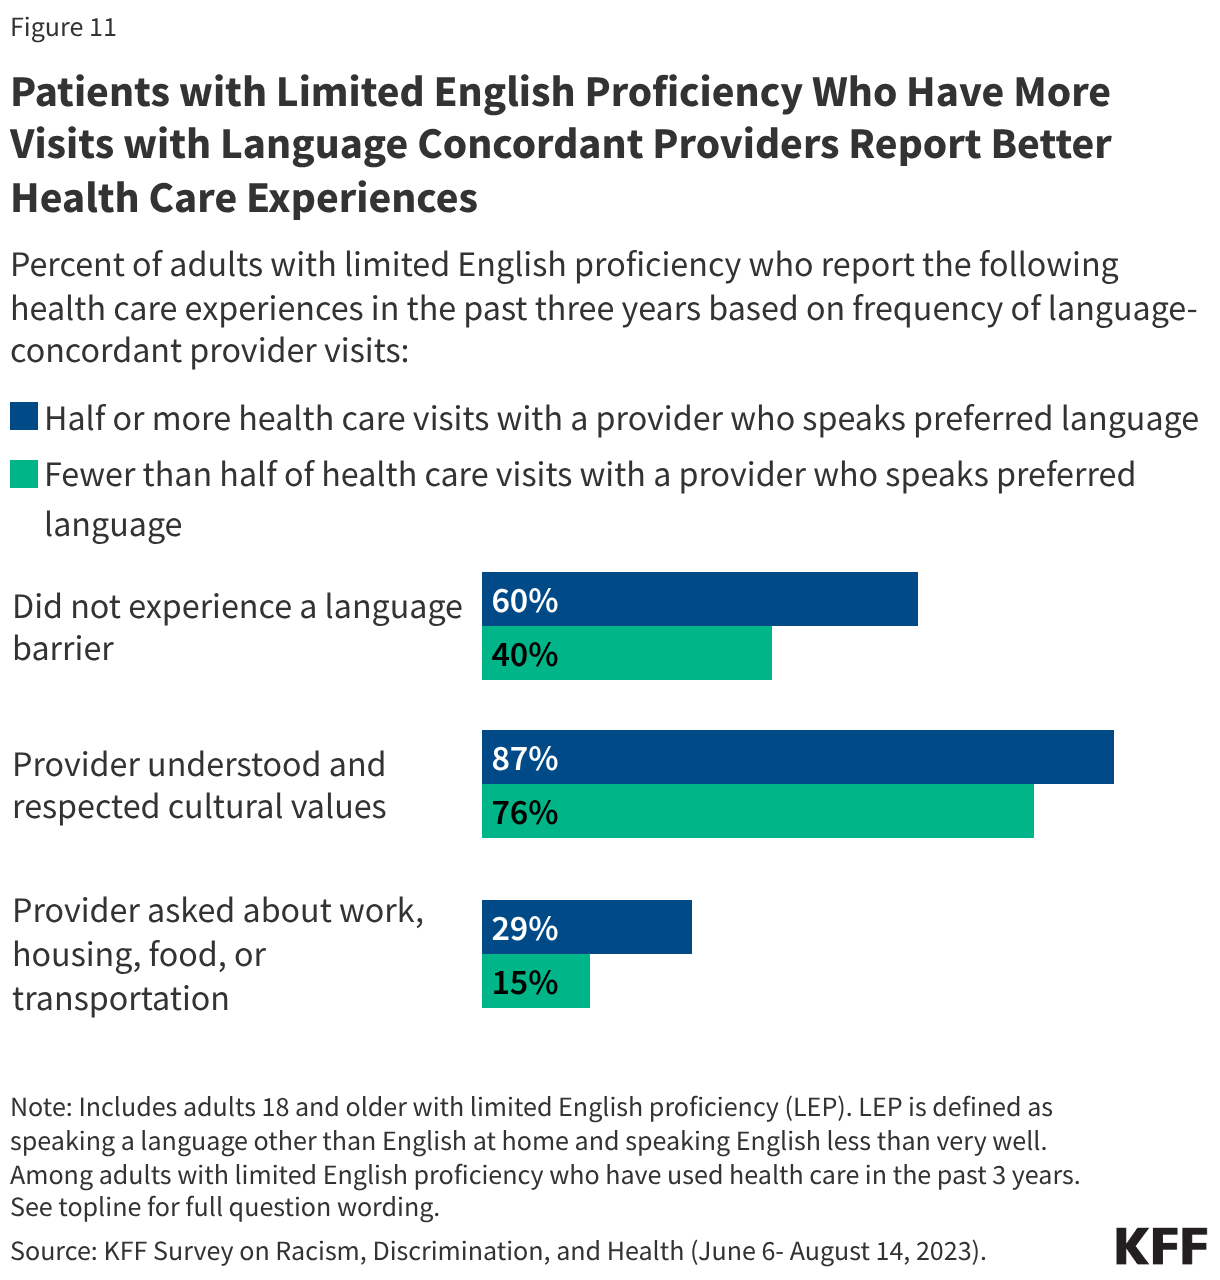
Having access to providers who speak a preferred language helps reduce barriers and improve health care experiences for people with LEP. KFF 2023 survey data show that adults with LEP who reported having at least half of their visits with a language concordant provider were less likely to experience a language barrier (40% vs. 60%).  They were also more likely to report their provider understood and respected their cultural values (87% vs. 76%) and more likely to report their provider asked about their social needs, like housing, food, or transportation, than their counterparts who had fewer than half of their visits with a language concordant provider (29% vs. 15%) (Figure 11).

Patients with Limited English Proficiency Who Have More Visits with Language Concordant Providers Report Better Health Care Experiences (Grouped Bars)

Federal policy changes will likely make it harder for people with LEP to access health coverage and care. The Trump Administration designated English as the official language of the U.S., which may lead to a reduction in availability in language access services. Additionally, people with LEP may face challenges navigating new Medicaid requirements that will be implemented under the 2025 reconciliation law, including work requirements and more frequent eligibility redeterminations, particularly if outreach and communications are not available in their language. People with LEP who are lawfully present immigrants may also face compounding challenges associated with reduced eligibility for coverage under the 2025 reconciliation law and increased immigration-related fears in the current environment. Amid these challenges, key protections remain in place for people with LEP. Title VI of the Civil Rights Act and Section 1557 of the Affordable Care Act prohibit discrimination against people based on their national origin, including their ability to communicate in English. Under these laws, certain entities, including Medicaid agencies and health care providers, must take reasonable steps to provide meaningful access to applicants and enrollees with LEP. However, the Trump Administration issued new regulations eliminating disparate impact, a discriminatory effect without intentional discrimination, as a basis for claims under Title VI of the Civil Rights Act, which may limit enforcement under this avenue, though Section 1557 requirements remain in place.

State Profiles for Women’s Health

  • Abortion Policies: State gestational limits, waiting periods & ultrasound requirements, insurance coverage and medication abortion restrictions
  • Abortion Data: Share of abortions by age, gestational age and method type
  • Maternal and Infant Health: Data on births by race/ethnicity, teen birth rates, preterm and low weight births, and maternal and infant mortality
  • Demographics: Age distribution, race/ethnicity, poverty level
  • Coverage: Health insurance coverage, ACA Medicaid expansion, Medicaid eligibility levels, Medicaid family planning programs, coverage policies on contraception and fertility care
  • Access and Utilization: Rates of cancer screenings, HPV vaccination, provider visits
  • Health Status: Rates of breast and cervical cancer by race/ethnicity, physical and mental health status, chronic conditions, pre-existing conditions
  • Sexual Health: Data on rates of STIs, HIV infections, cervical cancer screening and incidence

A Closer Look at the $50 Billion Rural Health Transformation Program

Published: Sep 18, 2026

Editorial Note: Originally published on July 16, 2025, this brief has been updated over time to include new information and data about the Rural Health Transformation Program.

On July 4, 2025, President Trump signed a budget reconciliation bill—once known as the “One Big Beautiful Bill”—into law that included significant reductions in federal health care spending, large tax cuts, and other changes. It was projected that the law would reduce federal Medicaid spending by $911 billion over ten years (based on estimates released shortly after enactment), including by an estimated $137 billion in rural areas, according to KFF analysis. To help mitigate the impact on rural areas, the law created the Rural Health Transformation Program (referred to here as the “rural health fund”), which will award $50 billion in state grants from 2026 to 2030 to support rural health care.

This brief provides an overview of the rural health fund. Key takeaways include the following:

  • The $50 billion rural health fund represents a large investment in rural health care and is intended to transform the delivery of care through a wide variety of activities.
  • The $50 billion fund could mitigate but will not fully offset estimated cuts to federal Medicaid spending in rural areas ($137 billion over ten years according to KFF analysis) included in the same law. Unlike most of the federal Medicaid spending cuts, the fund is also time limited.
  • While the fund was established in part to address concerns about the impact of the reconciliation law on rural hospitals, the funding is being used for a much broader set of purposes, and there are restrictions on how hospitals can benefit.
  • Half of the funding is being divided equally among approved states. The rest is being distributed based on measures of state need, state initiative scores, state policy, and other factors.
  • All 50 states were approved, with first-year awards ranging from $147 million to $281 million. First-year awards per rural resident range from less than $100 in ten states to more than $500 in eight.
  • It remains to be seen how the funding will be distributed within states across various activities and entities.

How Is the Rural Health Fund Structured and How Can Funds Be Used?

Structure

The rural health fund will provide $50 billion in grants to states over five years.

The rural health fund was added to the 2025 reconciliation law as a political compromise just prior to the law’s passage. The fund emerged during Senate negotiations in response to concerns about the impact of federal spending cuts on rural hospitals. Nonetheless, the program is not specific to rural hospitals but instead supports a much broader set of activities (see below). The law specifies that the Centers for Medicare & Medicaid Services (CMS) will oversee the program. It grants the agency substantial leeway to determine how to distribute funding across states and flexibility to expand the permitted uses of funding and determine the terms and conditions. CMS is administering the program through the new Office of Rural Health Transformation.

Under the rural health fund, CMS will award $10 billion in grants to approved states each year from fiscal years 2026 to 2030, a five-year period, for a total of $50 billion. States will be allowed to spend funds that they receive at a given point through the end of the following fiscal year, and CMS will redistribute any unused funds over time, but all funds must be spent by the end of fiscal year 2032. States will administer their programs, subject to terms agreed upon with CMS. However, the funding is occurring through a mechanism known as a “cooperative agreement,” which “require[s] substantial CMS project involvement after an award is made.”  

States had a one-time opportunity to apply for funding and all states were approved, meaning that they are eligible for funding for all five years of the program. However, CMS may withhold, reduce, eliminate, or recover funding over time if it determines that a state is not in compliance with program rules, the state has not made “satisfactory progress,” or that funding is no longer “in the government’s best interest.” The law indicates that there will be no administrative or judicial review of these and other funding decisions made by CMS.

The law and CMS established a fast-paced timeline for states to apply for funding and initiate programs during the first year of the program. CMS issued a Notice of Funding Opportunity in September 2025 with guidance on how to apply. States then had less than two months to prepare their applications. Those applications affect the scope of activities states can engage in and the amount of funding they receive for the life of the program. CMS announced first-year awards in December 2025. States were then given less than a year to finalize their plans through discussions with CMS, develop their own application process for entities within the state to receive funding, process applications, obligate funding, and submit their first annual progress reports (which will affect second-year awards). States likely differ in their capacity to manage procurement processes and have varied widely in terms of how quickly they have distributed funds during the first year.

Key Dates

Enactment and State Applications

  • July 4, 2025: The 2025 reconciliation law is enacted. The law includes large cuts to federal health care spending and the creation of the rural health fund.
  • September 15, 2025: CMS releases Notice of Funding Opportunity that includes guidance on how CMS will administer the program and how states can apply.
  • November 5, 2025: Deadline for states to apply.

First-Year Awards (fiscal year 2026)

  • December 29, 2025: CMS announces awards, totaling $10 billion.
  • Following first-year award announcement: States work with CMS to reconcile their plans with awarded amounts and program requirements and to determine how funds will be apportioned across initiatives, after which CMS makes first-year funding available.
  • August 31, 2026: Deadline for states to submit first of five annual reports.
  • October 30, 2026: Deadline for states to obligate funding.
  • November 29, 2026: Deadline for states to submit first of thirteen quarterly reports.
  • September 30, 2027. Deadline for states to spend first-year awards. CMS will redistribute unused funds in fiscal year 2028.

Second-Through Fifth-Year Awards (fiscal years 2027-2030)

  • October 31 of fiscal year: CMS will announce fiscal year awards totaling $10 billion by this date.
  • September 30 of following fiscal year: Deadline for states to spend awards. CMS will redistribute unused funds in the following fiscal year.

Program Wind-Down

  • February 27, 2031: Deadline for states to submit final report.
  • September 30, 2031: Deadline for states to spend fifth-year awards. CMS will redistribute unused funds in the next fiscal year.
  • September 30, 2032: Deadline for states to spend any remaining dollars redistributed by CMS.
  • October 1, 2032: Unused funds returned to Treasury Department.

The rural health fund is intended to transform the delivery of health care in rural communities and is being used to support a wide variety of activities.

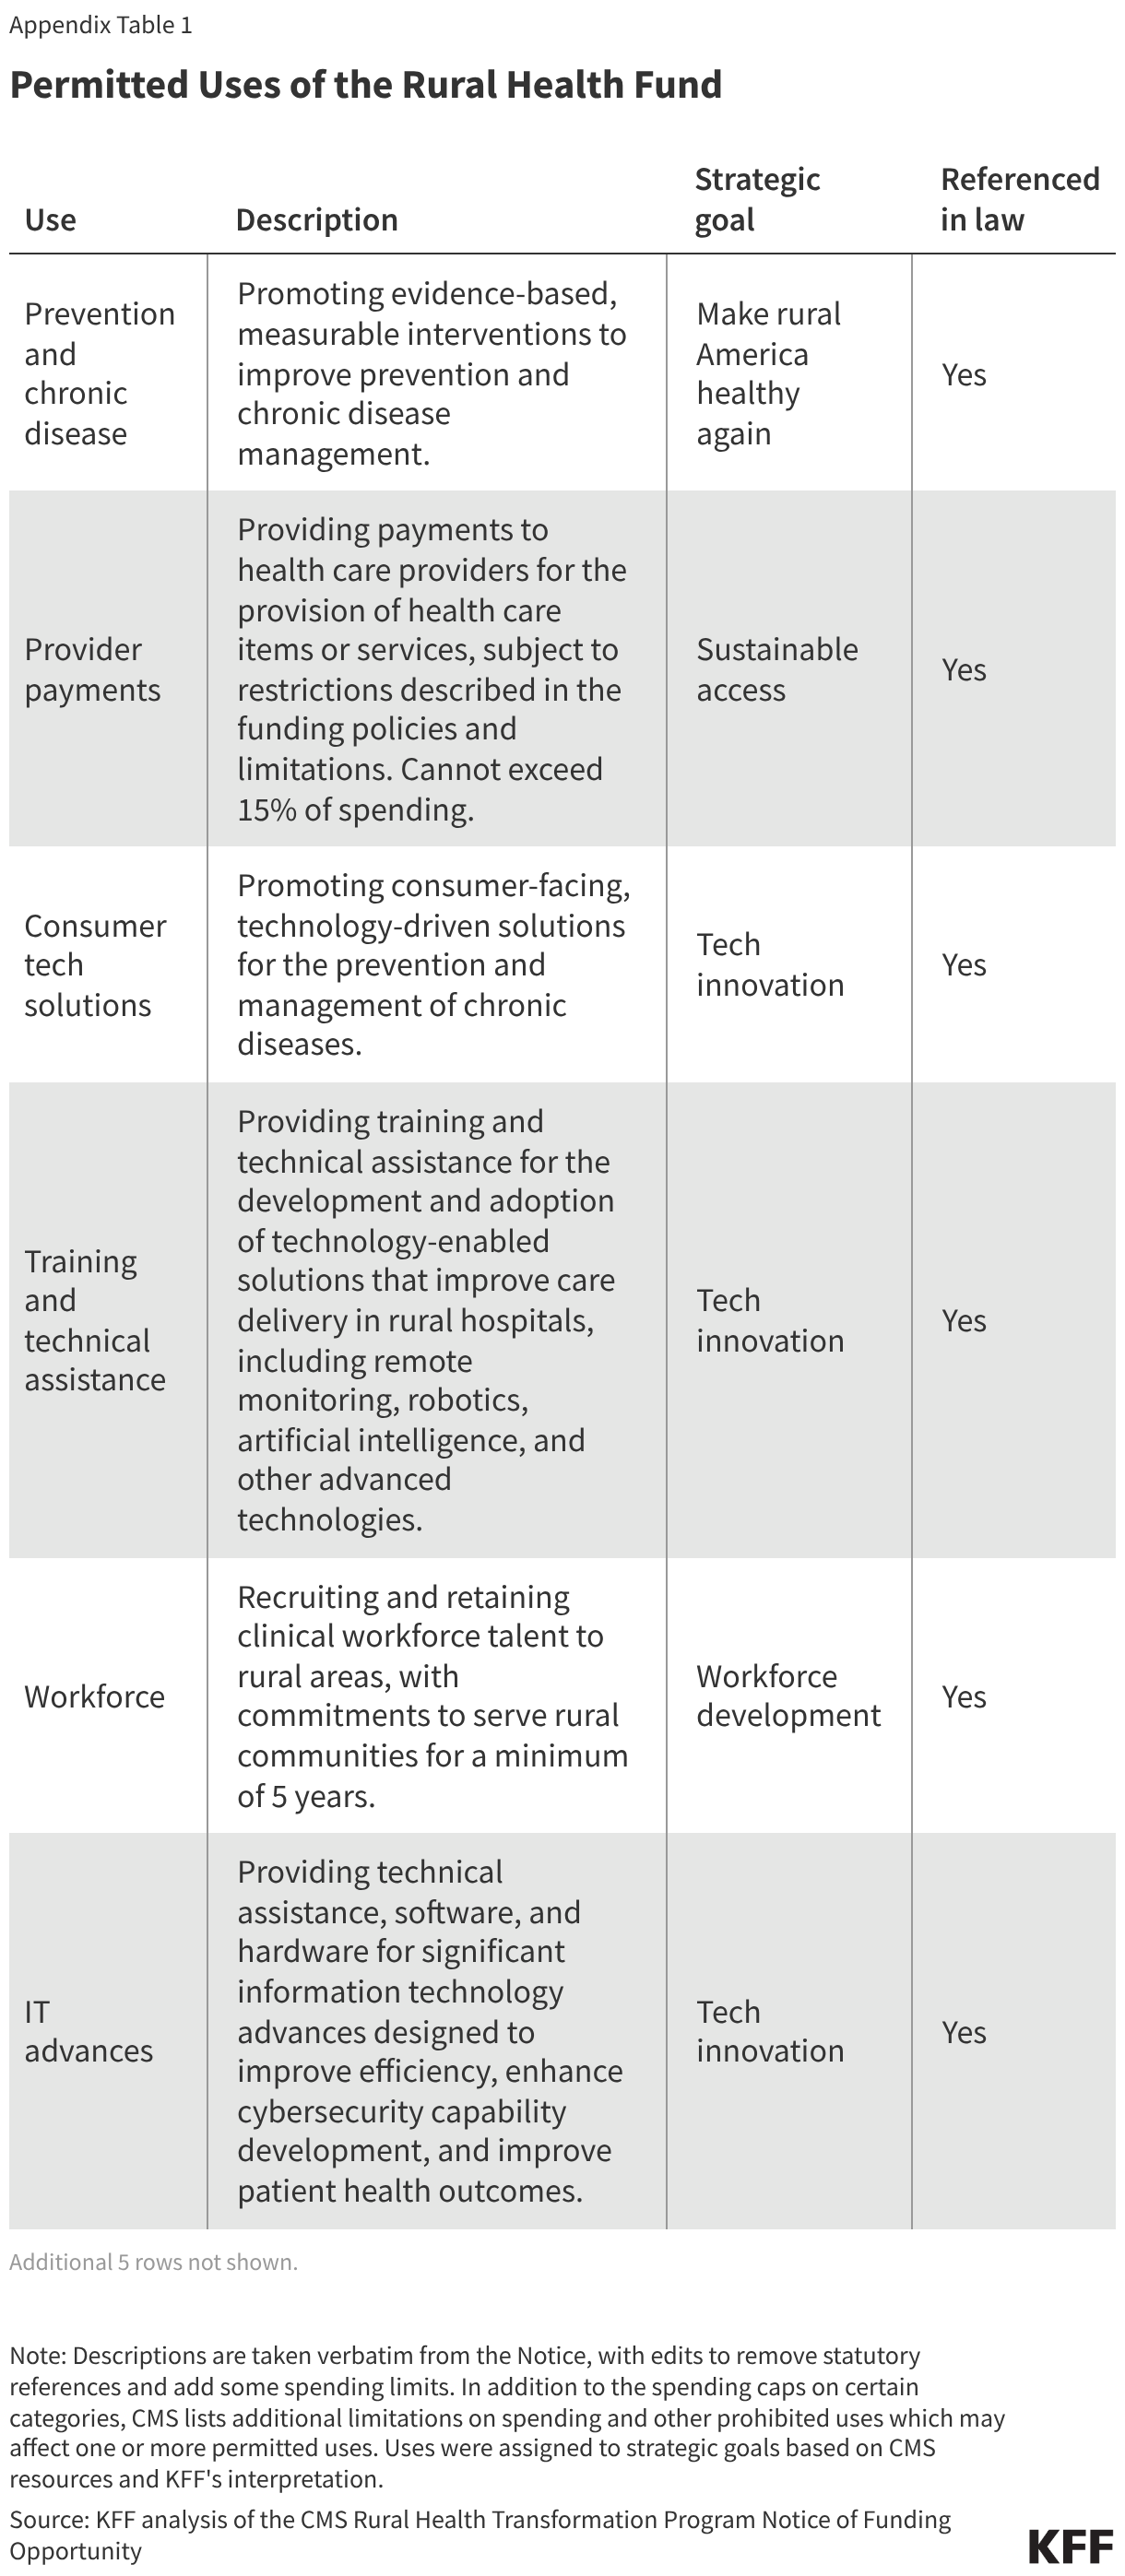
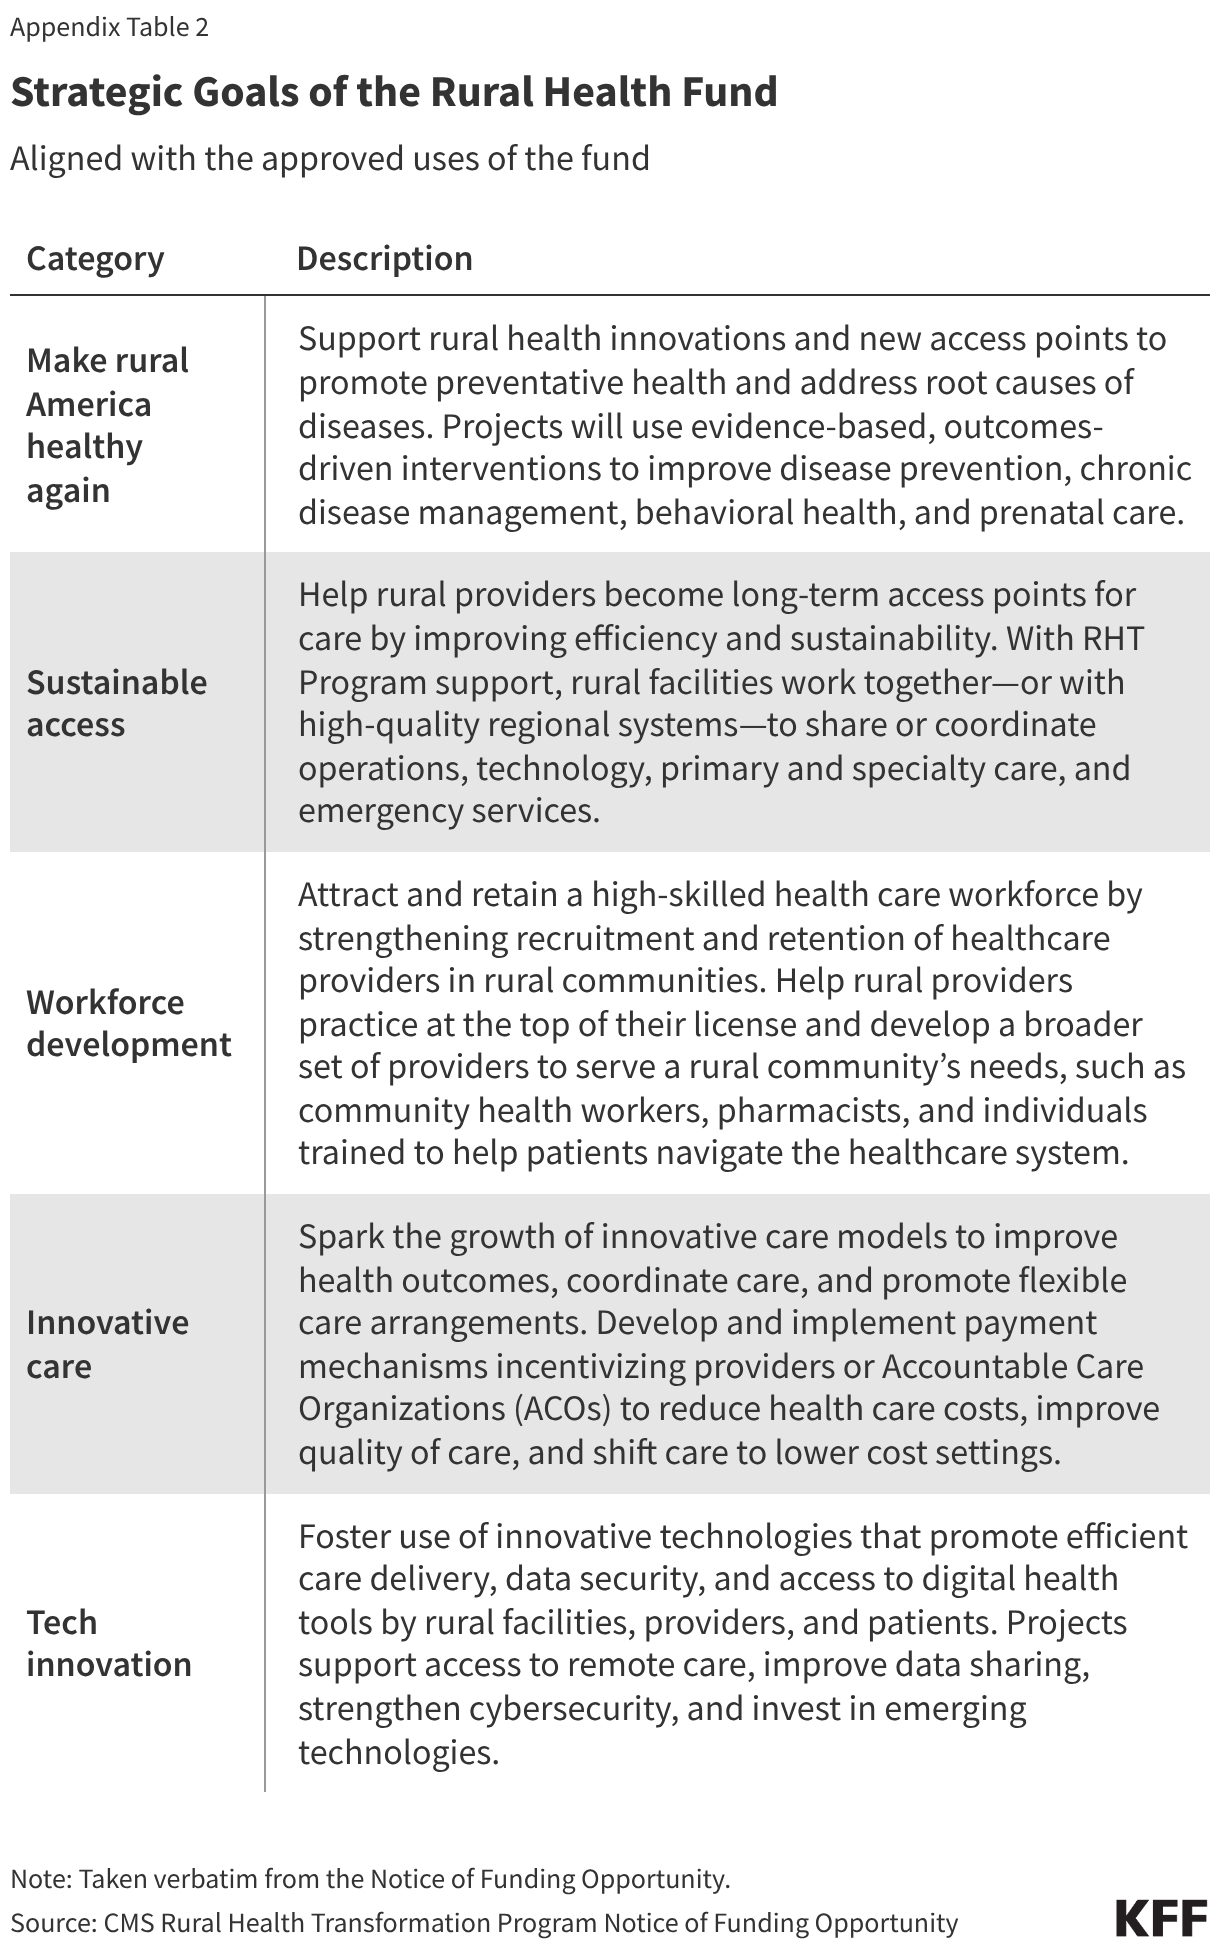
The rural health fund is designed to help “support…rural communities to improve healthcare access, quality, and outcomes through system transformation” according to CMS. CMS also indicated that it “expects States to design initiatives that invest in long-term, sustainable improvements rather than temporary fixes or funding perpetual operating expenses.” States can use funding for eleven purposes detailed in law and through guidance from CMS, with certain restrictions (see textbox below and Appendix Table 1). CMS has also identified five strategic goals of the program that align with these uses: make rural America healthy again, sustainable access, workforce development, innovative care, and tech innovation (see Appendix Table 2).

In line with the broad scope of the rural health fund, states are implementing a wide variety of activities under the program. For example, states are using funds to promote prevention and chronic disease management interventions, support collaboration among rural health care facilities (such as by sharing administrative services) and between rural providers and regional health systems, recruit clinical workers to rural areas, promote technological advancements (such as by expanding telehealth or promoting AI diagnostic tools), invest in existing hospital buildings and infrastructure, help hospitals determine which services should and should not be maintained, and support the adoption of value-based care and alternative payment models.

Specific state examples include the following (each state is undertaking multiple initiatives):

  • Alabama is funding the use of telerobotics to provide ultrasounds remotely.
  • Alaska is funding the use of drones to deliver medications to remote areas.
  • California is funding new provider collaboration networks, connecting regional hospitals with critical access hospitals, clinics, birthing centers, and other providers.
  • Michigan is funding an initiative to bring “services closer to where people work and live,” such as by “expanding…home-based care for older adults to allow them to age in place.”
  • North Carolina is increasing access to healthy foods, such as by “facilitat[ing] farm-to-hospital [programs], mobile food markets, and community-based food access.”
  • Montana is helping rural hospitals “right size” their services, which could entail eliminating some service offerings to improve hospitals’ financial sustainability.
  • Nevada is funding an expansion of its rural workforce, such as through provider recruitment incentives.

Permitted Uses

States must use funding for at least three of the following permitted uses.

  • Promote consumer tech solutions. For the prevention and management of chronic diseases. Examples include remote patient monitoring (e.g., through wearable devices), apps that connect patients with providers and health information, and digital health tools in community access points. States can also provide seed funding for innovative, high-impact tech solutions through a Rural Tech Catalyst Fund, subject to spending restrictions.
  • Support IT advances. Such as by expanding access to telehealth, upgrading or replacing electronic health record systems (replacements are subject to spending restrictions), facilitating health information exchange and interoperability, enhancing cybersecurity, and promoting artificial intelligence for clinical and administrative uses.
  • Provide training and technical assistance for technology that improves care delivery in rural hospitals. Such as for “remote [patient] monitoring, robotics, artificial intelligence, and other advanced technologies.”
  • Recruiting and retaining clinical workers. Such as by promoting health careers among local high school students, developing new residency and fellowship programs, offering advanced training for clinical workers, and providing tuition reimbursement or other incentives. Clinical workers who directly benefit must commit to serve rural areas for at least five years.
  • Improving prevention and chronic disease management. Such as through screening and early detection (e.g., mobile cancer screening), nutrition education, improving access to healthy food and to outdoor activities, early maternal and infant interventions (e.g., home visits), and care management programs.
  • Matching service offerings to local need. Such as by expanding access through telehealth, mobile units and satellite sites, strengthening emergency medical services, and providing non-medical transportation. This could also include “right sizing” delivery systems by eliminating services that cannot be sustained.
  • Paying providers for health care items or services. Provider payments are subject to a number of restrictions: they cannot exceed 15% of a state award in a given budget period, be used for short-term relief, supplement or duplicate existing funding sources (including Medicaid), or cover gender-affirming care or most abortion services. Examples of permitted uses include incentive payments for providers to improve quality or reduce costs.
  • Supporting innovative models of care. Including value-based care arrangements and alternative payment models. Such as by helping providers participate in the Achieving Healthcare Efficiency through Accountable Design (AHEAD) model (which, among other things, replaces traditional hospital reimbursement from multiple payers with global budgets for a given facility).
  • Investing in existing health care facility buildings and infrastructure. Investments cannot exceed 20% of a state award in a given budget period and cannot be used for new buildings or equipment. Examples include repairing existing buildings and equipment, minor renovations, interior modifications, upgrading lighting and electrical systems, and installing or upgrading security systems.
  • Fostering collaboration among providers. Such as through hub-and-spoke models (which connect anchor facilities, like larger regional hospitals, with local “spokes,” like clinics and small rural hospitals), shared services or group purchasing (e.g., of administrative services), or clinically integrated networks (groups of providers that join together to improve care and reduce costs without formally merging).
  • Supporting access to behavioral health care services. Such as through telehealth options, substance use disorder and opioid treatment, Certified Community Behavioral Health Clinics, and mobile crisis teams and centers.

States may also use up to 10% of their award in a given budget period on administrative expenses. Program restrictions listed above are not comprehensive.

Uses for Hospitals

Rural health funds are not just for hospitals, and there are restrictions on how hospitals can benefit.

While the fund emerged in response to concerns about the impact of the reconciliation law on rural hospitals, the extent to which it will benefit these facilities is unclear. States can choose how much of the funds will go to hospitals versus other rural providers and various other entities, such as contractors providing technical assistance, universities participating in workforce initiatives, regional health systems in urban areas collaborating with rural providers, and vendors developing new health technologies. Of the dollars going to rural hospitals, it is not yet clear which specific facilities will receive funding and the extent to which states will target resources to particular types of hospitals, such as those that are isolated or in financial distress. Additionally, hospitals that are not in rural areas can also receive funding, as long as it is to the benefit of rural communities and residents.

Initiatives could benefit hospitals to varying degrees. For example, uses of the funds that could more directly benefit hospitals include investing in existing hospital infrastructure (permitted within limits), strengthening collaboration among rural facilities and other providers, and supporting alternative payment models. Other initiatives, such as programs to promote health literacy and healthy behaviors, may have less direct or no obvious benefits for hospitals. The benefit to rural hospitals—and to other providers, patients, and rural communities—will also depend on how effective state initiatives are, which is difficult to predict. 

While funding could benefit hospitals in a number of ways, there are also limitations on how it can do so. For example, CMS guidance indicates that rural health funds cannot be used for:

  • Propping up struggling hospitals with temporary relief. The funds are not intended “to be used for perpetual operating expenses, but rather for investments…that will have sustainable impact beyond the end of the program,” according to CMS.
  • Payments to providers for care that exceed 15% of a state award in a given budget period. Payments to providers must be related to the strategic goals of the program, such as bonus payments for providing high-quality care, and cannot be used to supplement or duplicate existing funding, including payments from Medicaid or private insurance.
  • Construction, building expansion, or purchasing buildings, though they can be used for certain investments in existing rural health care facility buildings and infrastructure, not to exceed 20% of a state award in a given budget period.
  • Replacements for previous HITECH-certified electronic medical record (EMR) systems that exceed 5% of a state award in a given budget period.
  • Funds for gender-affirming care (a limitation that is not restricted to care for minors, as are many other federal measures) and reimbursement for most abortion services. There are also limitations related to “citizenship documentation requirements for payments made with respect to an individual.” Many hospitals do not currently collect patient immigration status but may need to do so to be reimbursed for patient care with rural health funds.

The rural health fund may help hospitals adapt to the loss of federal funding under the reconciliation law, though the extent to which it will do so is unclear. The reconciliation law made historic reductions in federal support for health care and is expected to result in an unprecedented increase in the number of people without health insurance. An increasing uninsured rate results in fewer patients with health coverage for hospital care, and an increase in the amount of uncompensated care hospitals provide. At the same time, the 2025 reconciliation law made significant changes to Medicaid financing that could result in major reductions to the rates Medicaid pays for hospital services in most states.

Just as it is unclear how much hospitals will benefit under the rural health fund, it is also hard to predict how much hospitals will lose due to spending cuts under the reconciliation law. As detailed below, the rural health fund is smaller than estimated cuts to federal Medicaid spending when looking at rural areas in aggregate, and most of the cuts will persist over time, in contrast to the rural health fund.

The hospital industry and some members of Congress have called for a greater focus on hospitals. The hospital industry has recommended that the rural health fund give greater priority to supporting rural hospitals, including by lifting restrictions on provider payments and capital investments. A group of Senators also recommended that the program focus more on rural hospitals and other rural providers and expressed concern that small rural providers will have a harder time vying with larger systems and organizations for funding. Increasing funding for rural hospitals would do more to address concerns about the financial standing of these facilities, an original motivation for the program, but would involve tradeoffs with competing initiatives.

How Does the Fund Compare to Medicaid Reductions?

Amount

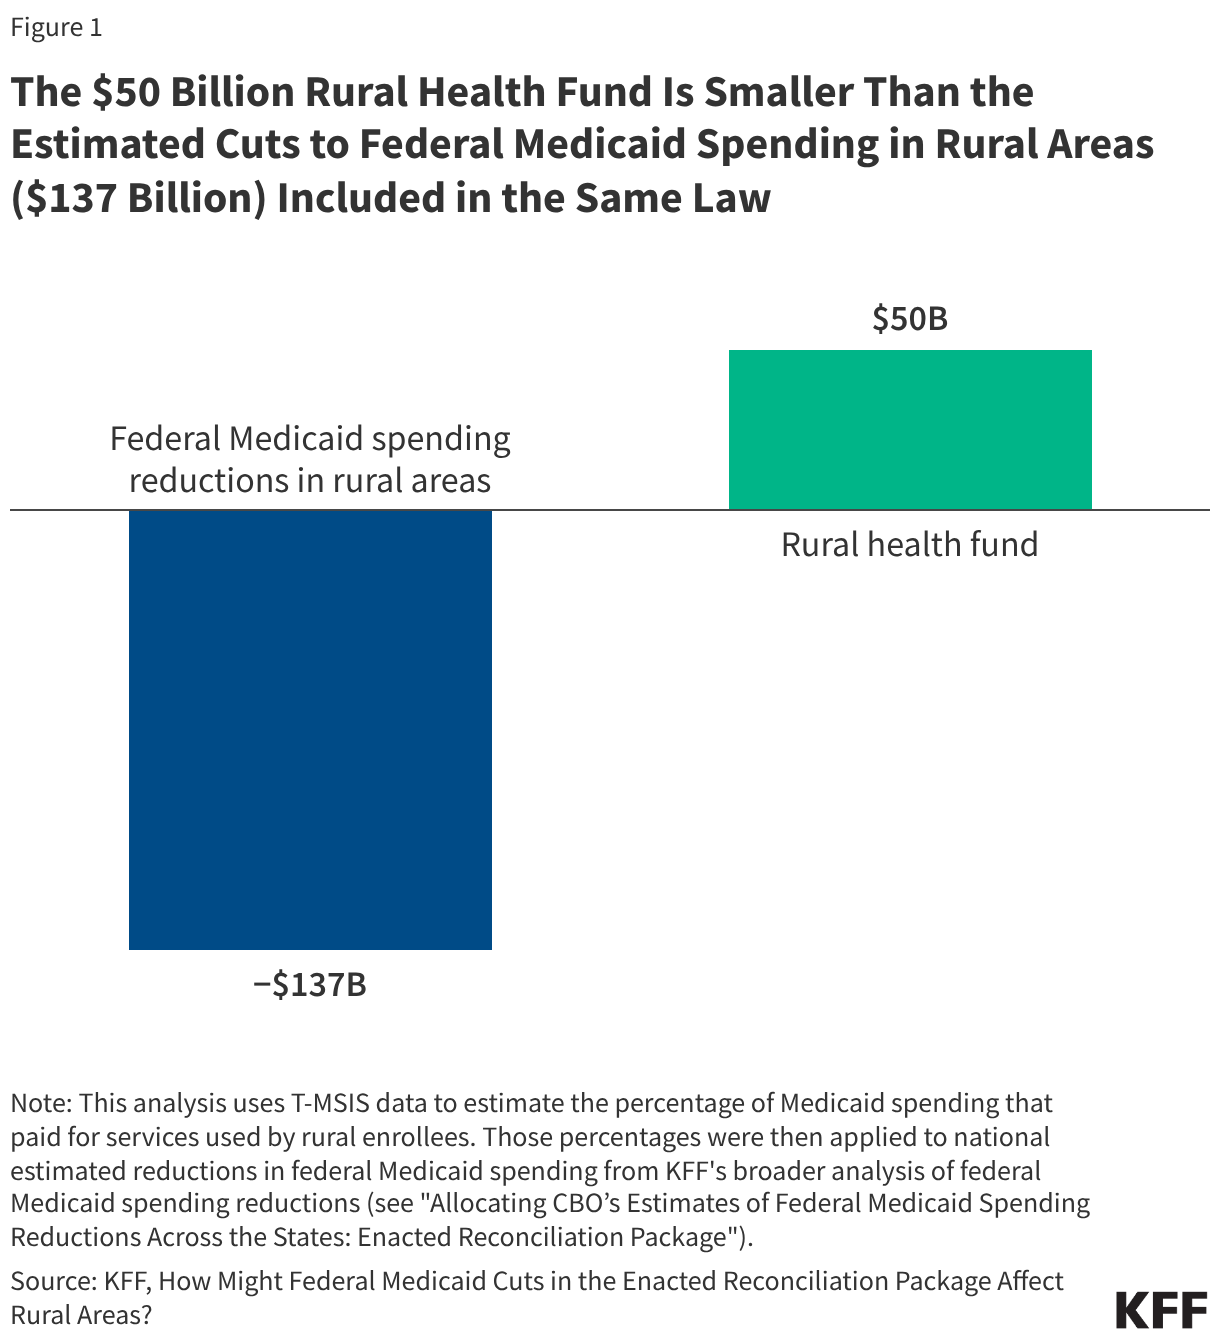
The $50 billion rural health fund is smaller than the $137 billion in estimated cuts to federal Medicaid spending in rural areas included in the same law.

The $50 billion in new funding could offset a little over a third (37%) of the estimated cuts to federal Medicaid spending in rural areas ($137 billion over ten years) based on KFF analysis of CBO estimates from July 2025, or about 5% of the total estimated cuts to federal Medicaid spending ($911 billion over ten years). This does not account for other revenue losses related to the law, including cuts to federal spending for the ACA Marketplaces. Nor does it include revenue losses stemming from the increased number of people who will be uninsured because of the expiration of the enhanced ACA premium tax credits and the implementation of 2025 Marketplace integrity rules. The impact of all of these changes on rural areas, and the extent to which the rural health fund offsets losses, will vary across the country.  

The  Billion Rural Health Fund Is Smaller Than the Estimated Cuts to Federal Medicaid Spending in Rural Areas (7 Billion) Included in the Same Law (Column Chart)

Timing

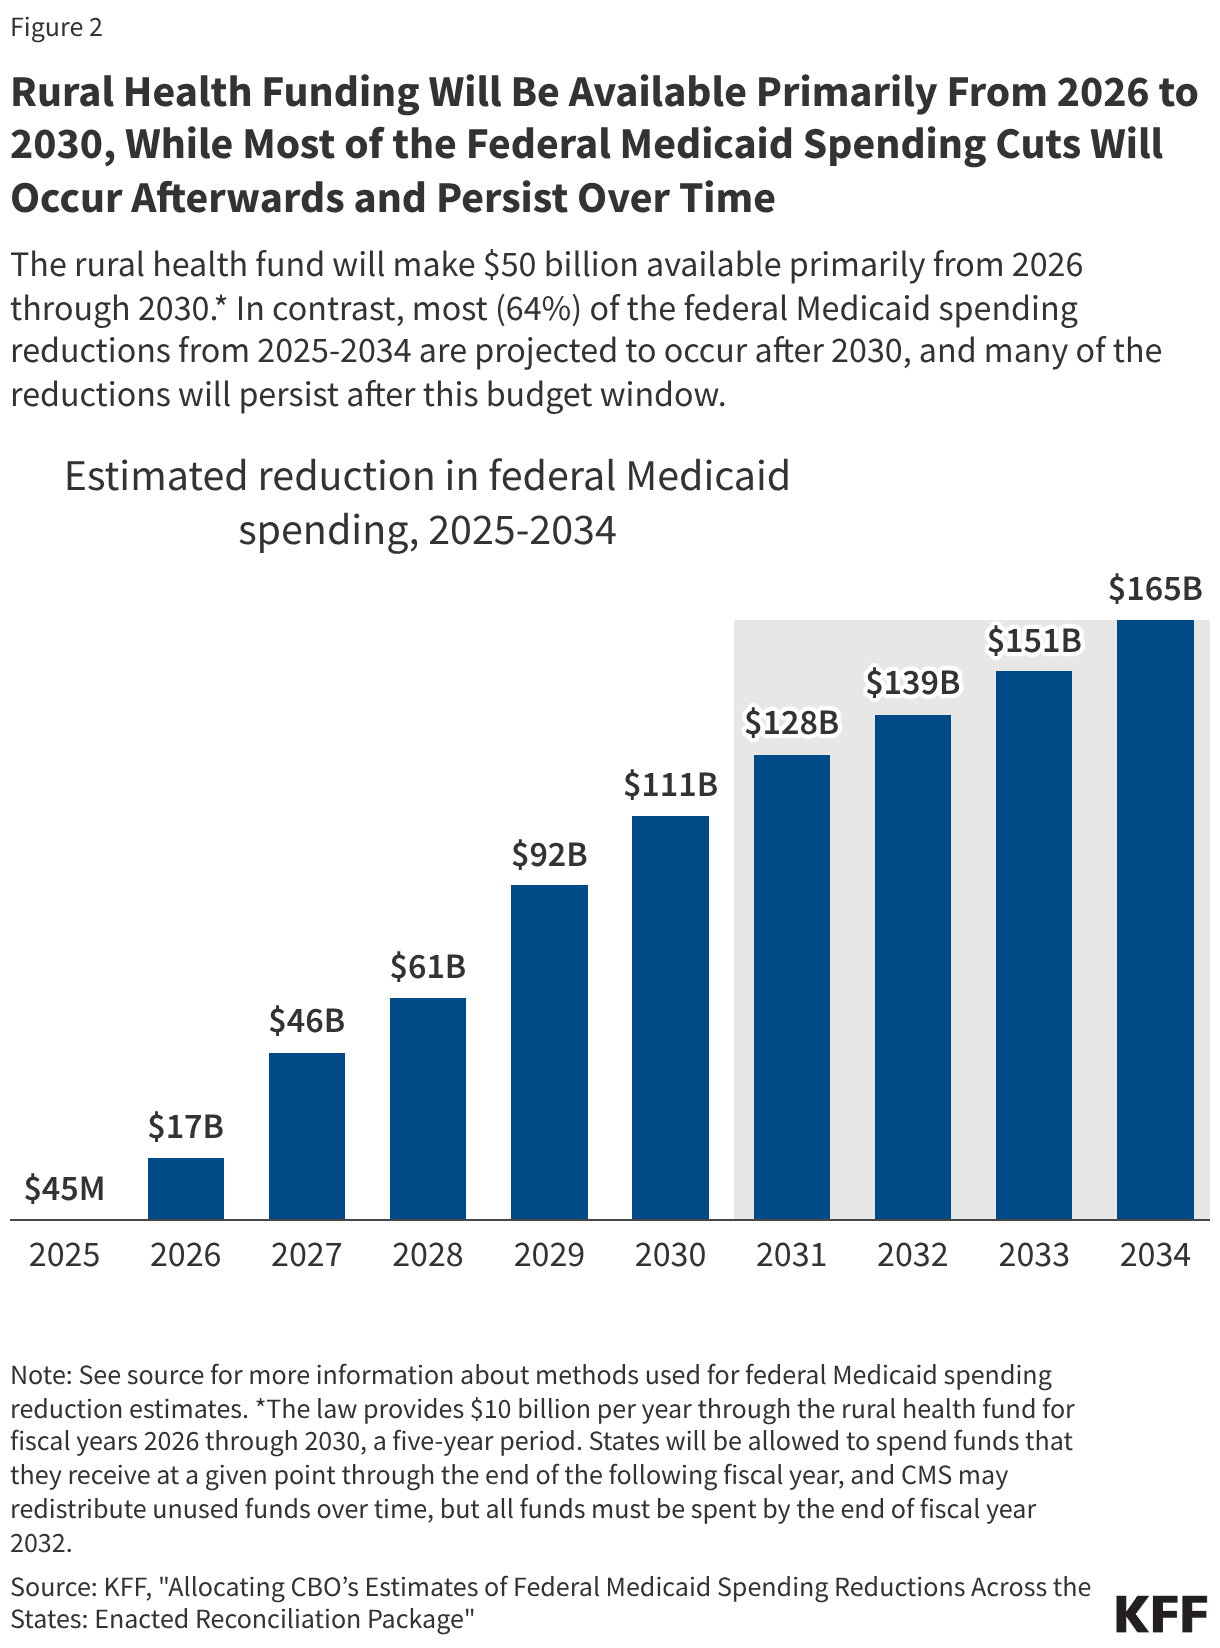
Rural health funding will be available primarily from 2026 to 2030, while most of the federal Medicaid spending cuts will occur afterwards and persist over time.

While many of the major cuts related to Medicaid and the ACA Marketplaces under the law are not time limited, the rural health fund is temporary. The law provides $10 billion per year through the rural health fund for fiscal years 2026 through 2030, a five-year period. States will be allowed to spend funds that they receive at a given point through the end of the following fiscal year, and CMS will redistribute any unused funds over time, but all funds must be spent by the end of fiscal year 2032.  New legislation would be required to provide additional support to rural areas after the funds dry up.

Rural health funds will be made available before many of the health care spending cuts under the law are fully realized (Figure 2). The rural health fund was put in place to address concerns of lawmakers from rural states, and front-loading these dollars could allow rural communities to make progress in improving care delivery in advance of forthcoming cuts. As described above, funding will first be available for fiscal year 2026, with $10 billion dollars available per year over five years through fiscal year 2030, and all funds must be spent by the end of fiscal year 2032. Yet most of the health care spending reductions are backloaded and occur after fiscal year 2030. For example, based on KFF analysis of CBO estimates, nearly two thirds (64%) of the ten-year reductions in federal Medicaid spending would occur after fiscal year 2030.

Rural Health Funding Will Be Available Primarily From 2026 to 2030, While Most of the Federal Medicaid Spending Cuts Will Occur Afterwards and Persist Over Time (Column Chart)

How Are Funds Being Distributed Across States?

Approach

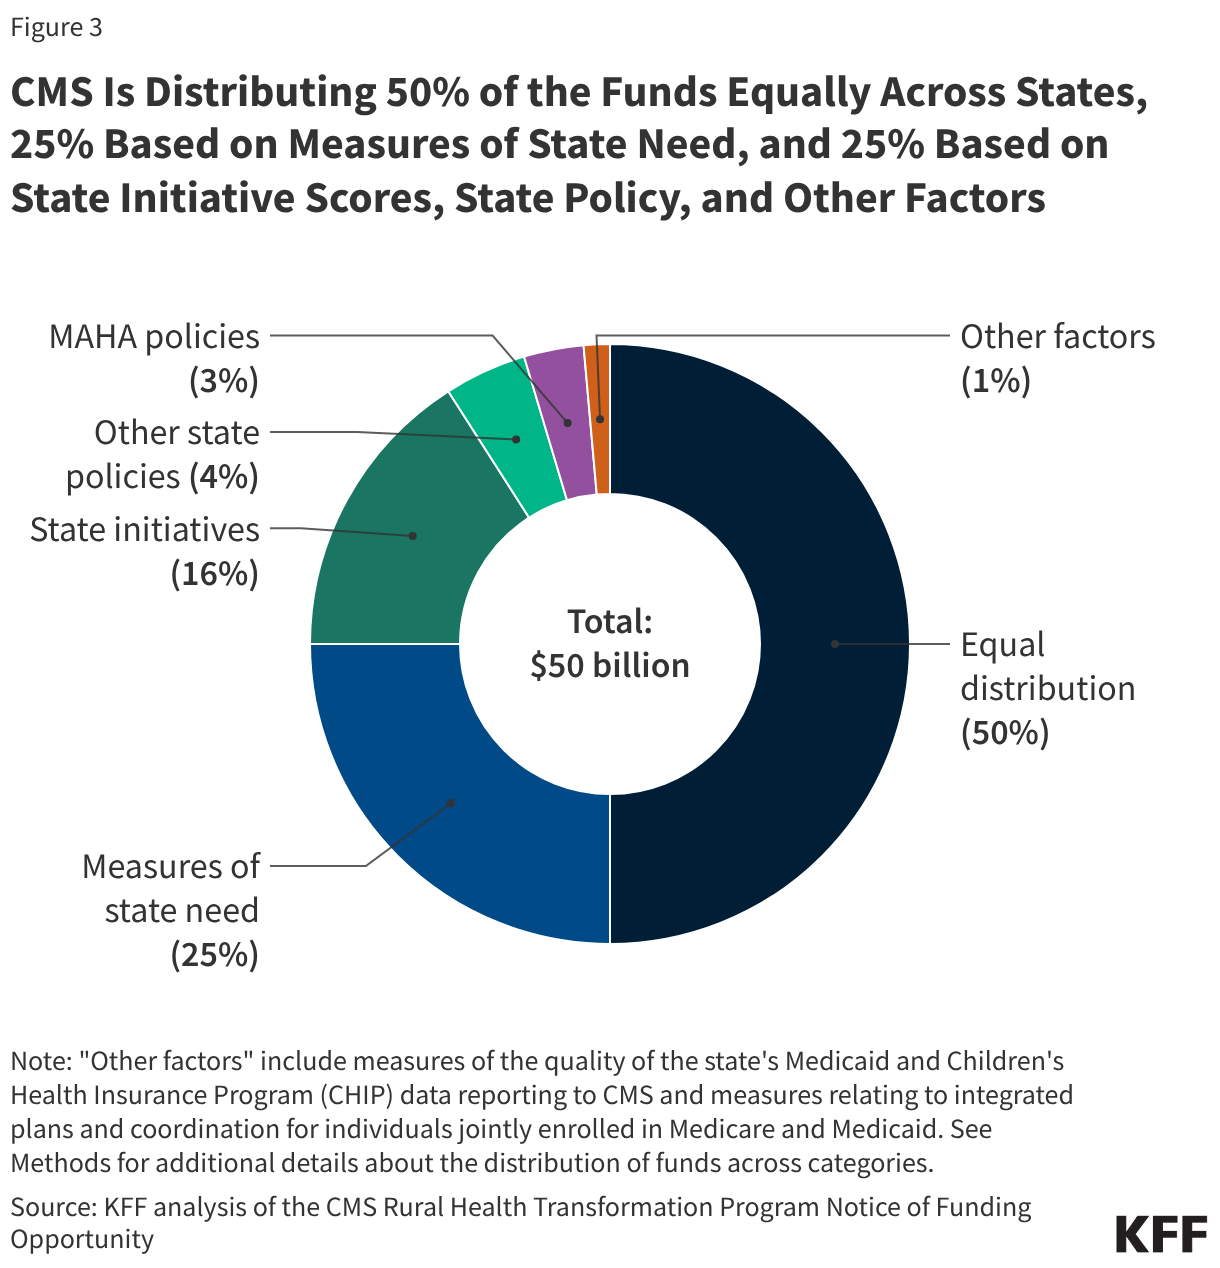
CMS is distributing half of the funds equally across states, a quarter based on measures of state need, and a quarter based on state initiative scores, state policy, and other factors.

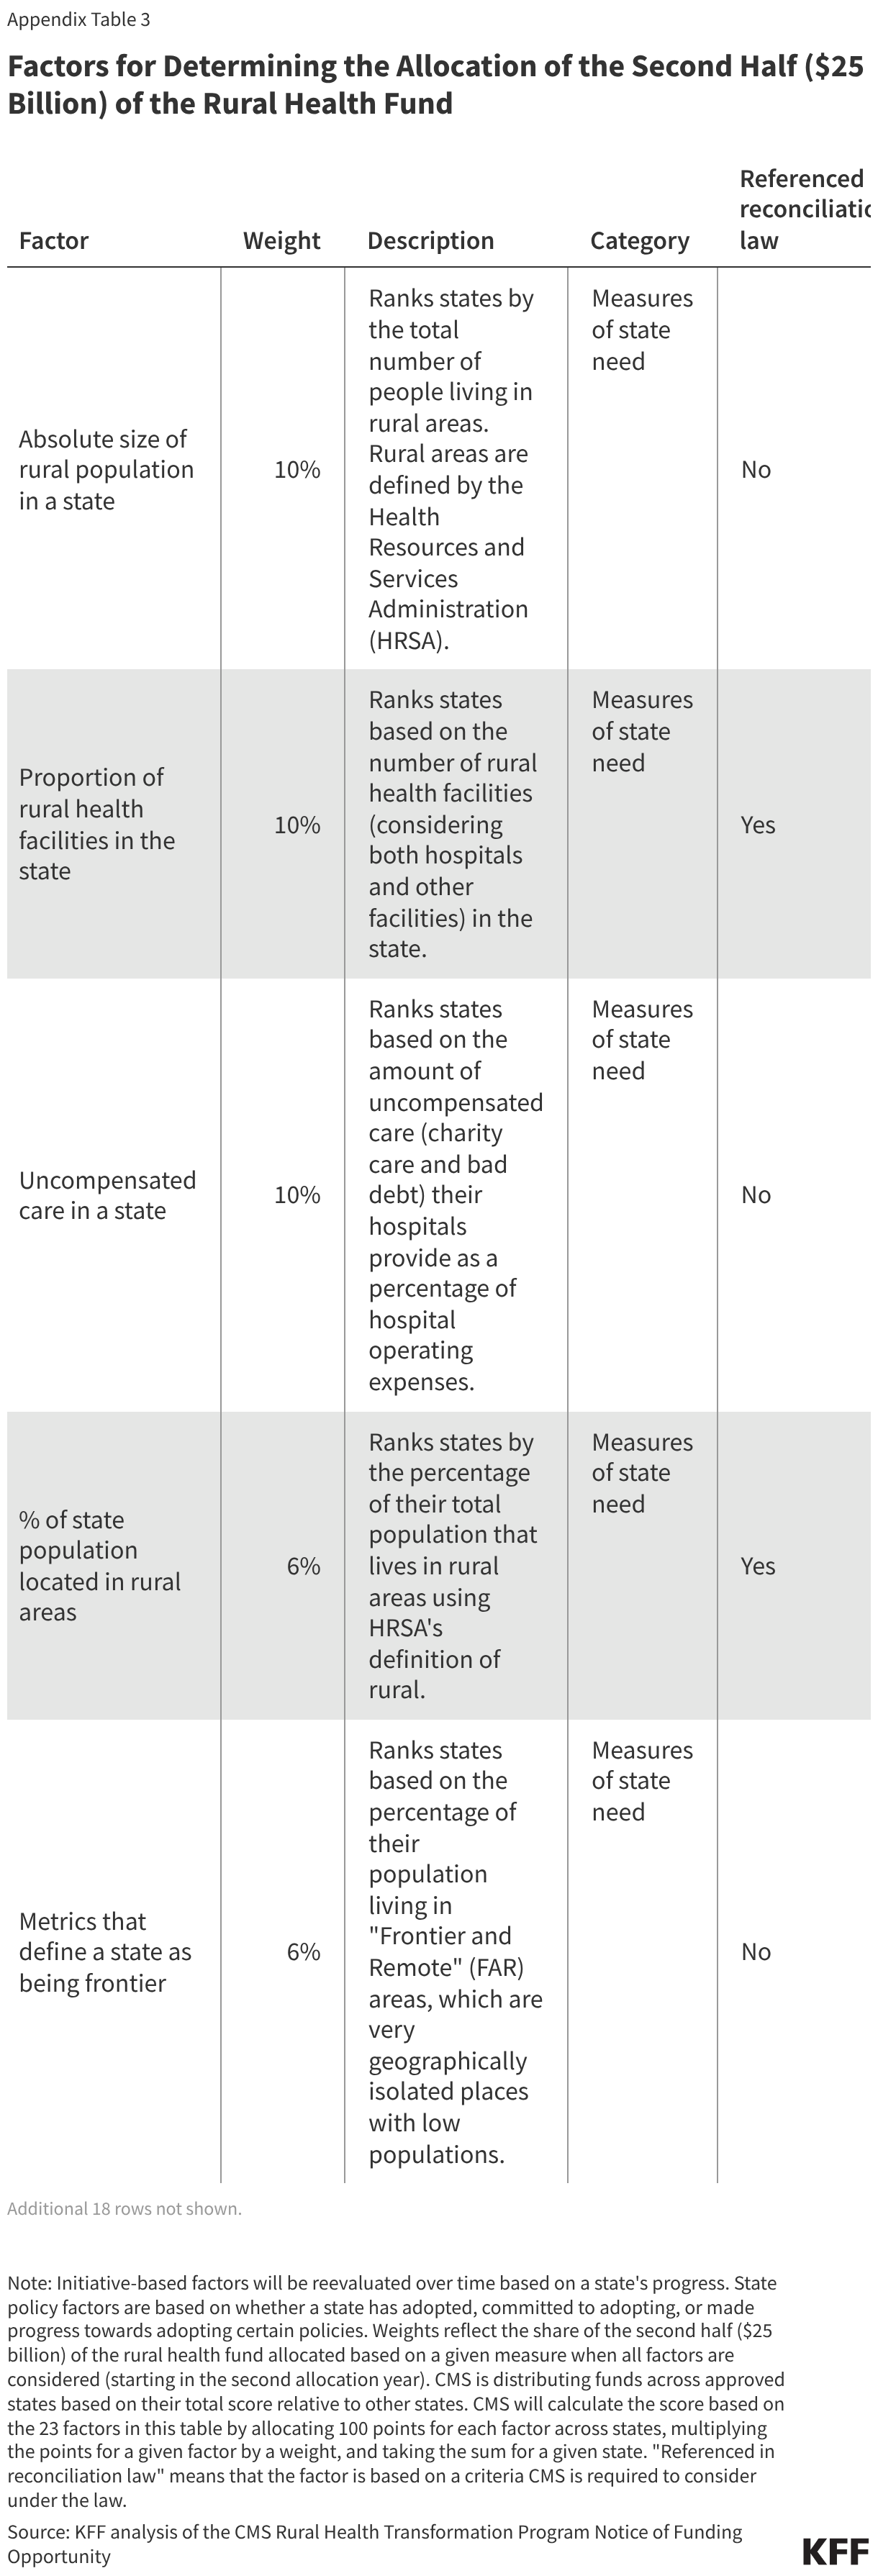
The reconciliation law requires that half ($25 billion) of the rural health fund be distributed equally among states with approved applications while providing CMS with substantial discretion over how to distribute the second half ($25 billion). CMS refers to the former as “baseline funding” and the latter as “workload funding.” CMS is distributing workload funding (the second $25 billion) across all approved states based on 23 factors, weighted to varying degrees (see Appendix Table 3). CMS announced state awards from the $10 billion available for funding in the first year based on this approach and will use the same general approach in subsequent years.

The $50 billion rural health fund is being distributed as follows across all 50 states (CMS will use the same approach but for fewer states if it rescinds funding for some later on) (Figure 3):

  • Equal distribution. Half of the funding (50% or $25 billion) is being distributed equally across states, as required by law.
  • Measures of state need. A quarter of the funding (25% or $12.5 billion) is being distributed across states based on measures of state need, as specified by CMS (Appendix Figure 2 and Appendix Table 3).  Multiple measures have a rural focus, such as the size of the state’s rural population and the number of rural health facilities (a blend of hospitals and other facilities) in the state. Other measures are not explicitly focused on rural areas, such as hospitals’ uncompensated care as a percent of operating expenses and the share of hospitals in the state that receive Medicaid disproportionate share hospital payments (which are payments for hospitals that serve disproportionate numbers of people who are uninsured or enrolled in Medicaid). These factors were calculated once and will be used in all subsequent allocation periods (i.e., will not reflect changes over time, such as in uncompensated care).
  • State proposed initiatives. About one sixth of the funding (16% or $8.0 billion) is being distributed based on how state initiatives are scored. This reflects a qualitative review of the state’s plan and, in later years, the state’s progress in implementing the plan. Not all of the initiatives allowed under the rural health fund are being considered for the allocation, but CMS has laid out those that are being taken into account, such as initiatives related to population health clinical infrastructure, health and lifestyle, rural provider strategic partnerships, and talent recruitment.
  • Make America Health Again (MAHA) and other state policies. Eight percent of the funding ($3.8 billion) is being distributed based on whether a state has adopted, committed to adopting, or made progress towards adopting certain policies that are priorities of the Trump administration. Each of these policies reflect state-wide changes that are not specific to rural areas. Some of the policies are tied to the administration’s MAHA agenda, including requiring schools to reestablish the Presidential Fitness Test; prohibiting SNAP spending on non-nutritious items, like soda or candy; and requiring that nutrition be included in continuing medical education for physicians. Most other policies aim to promote competition among health care providers, such as by not having certificate of need (CON) laws, making it easier for providers to practice in multiple states, and providing an expansive scope of practice for nurse practitioners and other non-physicians.
  • Other factors. The remaining funds (1% or $0.7 billion) are being distributed based on other factors, such as the share of dual eligibles (people who have both Medicare and Medicaid) that are enrolled in plans integrating Medicare and Medicaid benefits and the quality of Medicaid and Children’s Health Insurance Program (CHIP) data reporting to CMS.
CMS Is Distributing 50% of the Funds Equally Across States, 25% Based on Measures of State Need, and 25% Based on State Initiative Scores, State Policy, and Other Factors (Donut Chart)

Amount

All 50 states were approved for funding, with first-year awards ranging from $147 million in New Jersey to $281 million in Texas.

States had a one-time opportunity to apply for funding and all states were approved, meaning that they are eligible for funding for all five years of the program. However, as noted above, CMS may choose to scale back, withhold, reduce, eliminate, or recover funding from a given state over time.

State awards for 2026, the first of five years, average $200 million, ranging from $147 million in New Jersey to $281 million in Texas (Figure 4). Differences in total awards across states in the first year (and most likely in future years) are modest relative to large differences in rural populations and rural health needs more generally. For example, Texas has about thirty times as many rural residents as New Jersey (4.3 million versus about 140,000) but is only receiving about twice as much funding in the first year ($281 million versus $147 million). Differences in total awards across states are relatively modest primarily because half of the rural health fund (50%) is being distributed equally across approved states, regardless of need. Because all states have been approved for funding, each is slated to receive $100 million from this half of the fund in 2026 and in each year from 2027 through 2030.

Texas, Alaska, and California are receiving the largest total awards in the first year. While Texas and California have the largest and fourth-largest rural populations in the country respectively, Alaska has the fifth-smallest rural population. Alaska received a relatively large award, at least in part, because a portion of the fund is being distributed to the five largest states based on land area. Alaska also received the largest award from the pool based on state initiatives, state policy, and other funding factors according to estimates from the UNC Sheps Center (see Appendix Figure 3). New Jersey, Connecticut, and Rhode Island are receiving the smallest awards in the first year. These are all states with relatively small rural populations.

Figure 4

Amount per Rural Resident

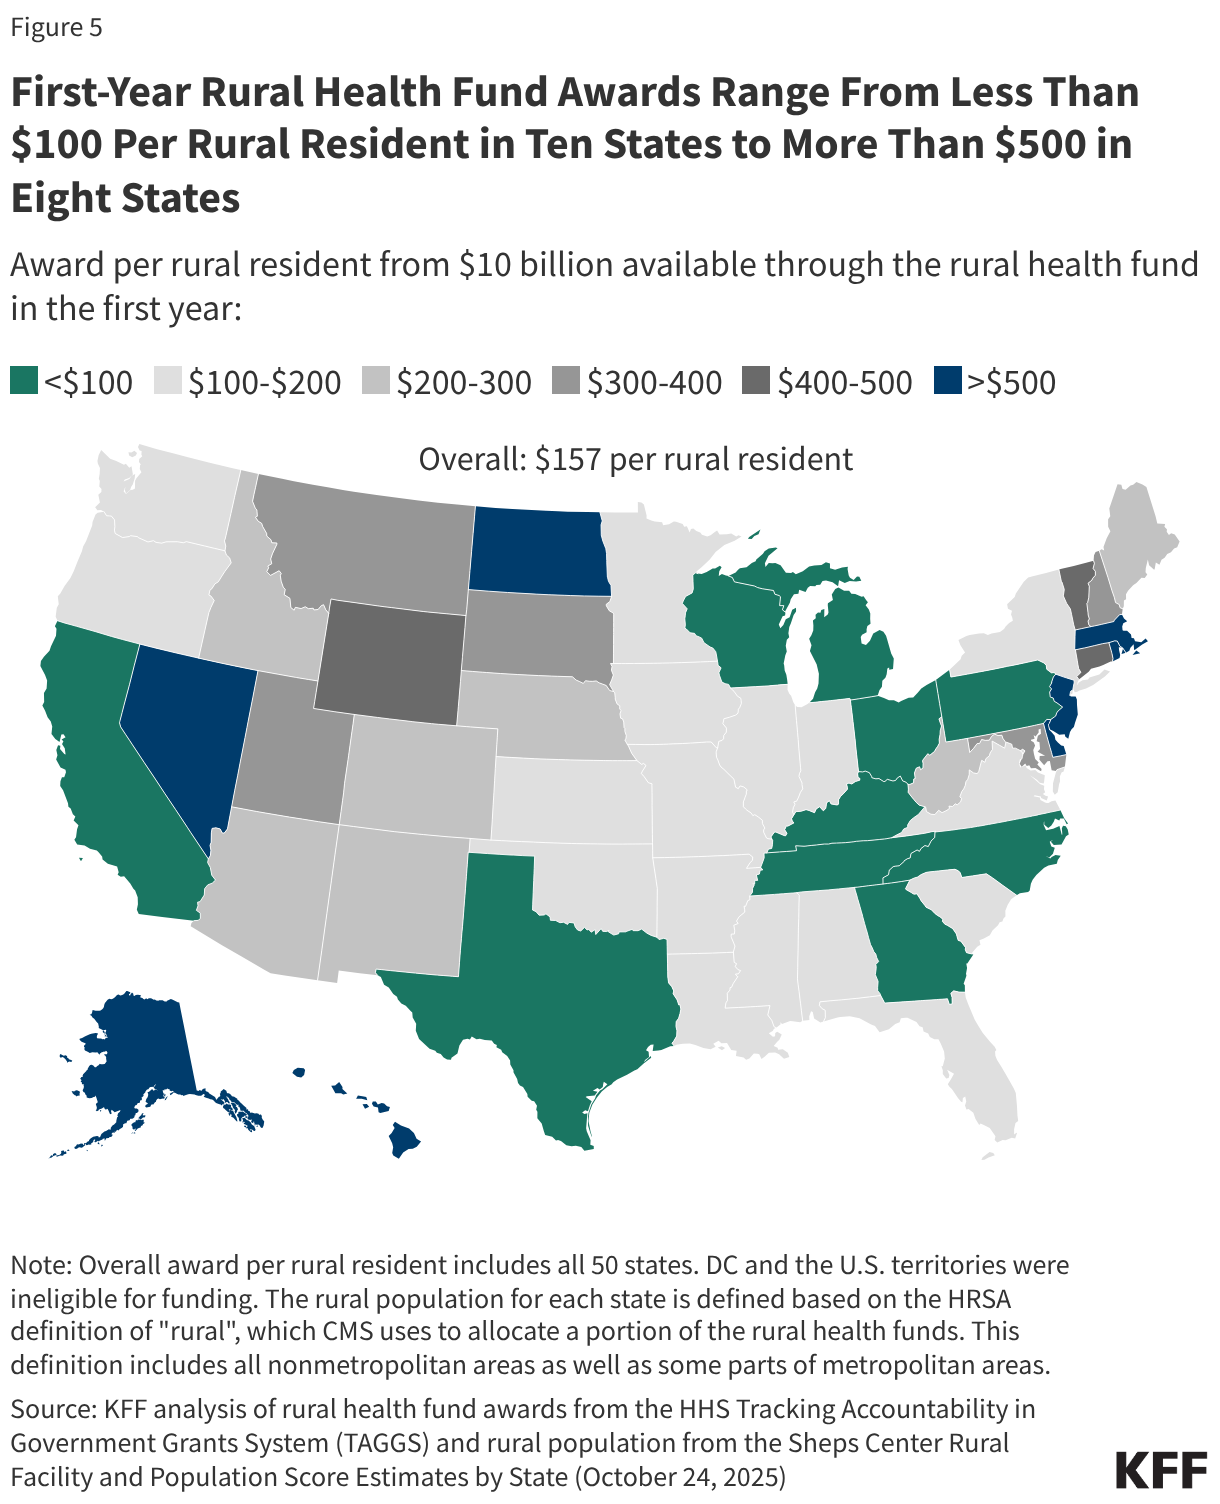
First-year awards per rural resident vary widely, ranging from less than $100 in ten states to more than $500 in eight.

State awards are partially, but not closely, tied to rural population, meaning that first-year awards per rural resident are generally relatively small among states with the largest rural populations (Figure 5). For example, Texas has the largest rural population in the country—and the largest total award in the first year—but received the smallest award per rural resident ($66 in 2026). In contrast, states like Rhode Island, New Jersey, and Alaska, with far fewer rural residents, received substantially higher amounts per rural resident ($6,305, $1,069, and $990 respectively, with Rhode Island being an extreme outlier).

First-Year Rural Health Fund Awards Range From Less Than 0 Per Rural Resident in Ten States to More Than 0 in Eight States (Choropleth map)

How Are Funds Being Distributed Within States?

Distribution Within States

It remains to be seen how states will distribute funding across various entities and activities

CMS is tracking the flow of state funding to different entities and activities and will have information about all first-year state obligations to direct recipients towards the end of 2026. CMS is collecting information from states about the distribution of funding across entities and permitted uses (see above) as part of states’ annual and quarterly reporting process. Recipients of state funding will be categorized into standardized groups, including different types of health care providers, state and local government agencies, tribal entities, educational organizations, health IT vendors, other consultants, and other entity types. Beginning with the first quarterly report, CMS will begin tracking the flow of dollars downstream (e.g., if a state pays a contractor to manage a program, and the contractor then sends a portion of the funds to a rural hospital). States are required to obligate first-year funding by October 30, 2026, meaning that all first-year obligations to direct recipients of the funding should be captured in the first quarterly report, due November 29, 2026.

Some information about how states plan to distribute funding are available through approved plans and budgets, but with much less detail.

Some groups have called for greater transparency around funding streams. CMS will release progress reports to the public upon request but does not plan to do so proactively. Obtaining information through a Freedom of Information Act (FOIA) request, if required, could be a long and arduous process. The Bipartisan Policy Center recommended that CMS make key information easily available to the public, such as through an online dashboard. The hospital industry has also recommended greater public reporting as well as collecting additional information, such as existing hospital identifiers, which could facilitate oversight of the types of hospitals receiving funding.

Transparency around state funding will likely be of interest for policymakers, journalists, and researchers as they seek to track where funds are going, who is benefiting, and how effective they are.

Changes Over Time

The distribution of funding across and within states will change over time.

CMS has broad leeway to change the distribution of funding across states in later years, though it is unclear how much it will use its discretion. As described, CMS has broad discretion to withhold, reduce, eliminate, or recover funding over time as it sees fit (e.g., if a state has not made satisfactory progress). If CMS does not do so, changes in state awards in later years could be modest, given that most of the funding is locked in place over time based on statute and CMS guidance (see above).

Funding priorities may shift over time as states learn what does and does not work. The head of CMS, Dr. Mehmet Oz, indicated that states were given room to be creative with their applications, and that the expectation is that states will learn from both program successes and failures over time. States may adjust the details of their work plans but cannot significantly change their underlying strategy according to guidance from CMS. However, it is possible that CMS could reduce funding for states with less successful initiatives over time (see above) or work with states to shift their funding towards more successful programs.

This work was supported in part by Arnold Ventures. KFF maintains full editorial control over all of its policy analysis, polling, and journalism activities.
Distribution of Funding by Factor

This brief identifies the share of the $50 billion rural health fund that is being distributed based on an equal distribution across states; measures of state need, initiatives, and policies; and other factors (Figure 3). The reconciliation law specifies that half of the fund ($25 billion) must be distributed equally across states, while CMS has indicated that it is distributing the second half ($25 billion) among approved states based on a set of 23 factors, weighted to varying degrees (see Appendix Table 3). CMS refers to the former as “baseline funding” and the latter as “workload funding.” While CMS considers all 23 factors in each year, its calculations for 2 of the 23 factors change beginning in the second year of the program; this brief describes the distribution of funding as of the second year of the program.

The distribution of workload funding ($25 billion) across different categories of factors was calculated based on CMS weights. CMS is scoring some factors (health and lifestyle, individuals dually eligible for Medicare and Medicaid, remote care services, and data infrastructure)—representing $3.75 billion of the $50 billion rural health fund—by evaluating how states rank based on a weighted average of measures from two buckets. For example, health and lifestyle factors are being evaluated based on the state rank of a weighted average of their score on certain state initiatives (75%) and the adoption of a certain policy (25%). The contribution of each bucket in those cases cannot be fully disentangled because of the structure of the calculation, which involves a ranking of a weighted average. In those cases, funding based on these factors was apportioned to each bucket based on the weights used to generate the weighted average (e.g., 75% or 25%).

First-Year State Awards

First-year state awards from the rural health fund (Figure 4) were obtained from the HHS Tracking Accountability in Government Grants System (TAGGS). First-year awards per rural resident (Figure 5) were calculated based on the HRSA definition of “rural”, which CMS uses to allocate a portion of the rural health funds. This definition includes all nonmetropolitan areas as well as some parts of metropolitan areas. Rural population, as defined by HRSA, by state was obtained from the UNC Sheps Center Rural Facility and Population Score Estimates by State, as updated on October 24, 2025.

This brief also describes the estimated first-year awards based on each of the seven measures of state need (Appendix Figure 1), which CMS refers to as “rural facility and population factors.” Appendix Table 3 includes details about these factors. We obtained estimated scores by state for each of these factors and their weighted total by state from the Sheps Center Rural Facility and Population Score Estimates by State. The Sheps Center generated these estimates based on their interpretation of CMS’s Notice of Funding Opportunity (NOFO) and available data. We converted estimated scores for a given factor into a dollar amount by: (1) calculating the share of workload funding in the first year distributed based on that factor (i.e., multiplying $5 billion by the weight for that factor) and (2) multiplying the result by the state share of the distribution based on that factor (i.e., the score divided by 100). Each state’s total distribution from the $2.5 billion based on state need in the first year is the sum of the factor allocations calculated in (2).

Finally, the brief describes estimated first-year awards based on state initiatives, state policy, and other factors (Appendix Figure 3). These numbers were pulled directly from the Sheps Center Funding Amounts and State Policy Actions, as updated on January 8, 2026. The Sheps Center estimated this amount for each state by starting with a given state’s first-year award and subtracting out the allocation distributed equally across states ($100 million per state) and the estimated allocation based on measures of state need.

First-Year Awards by Factor

The five states with the largest land areas received the largest estimated awards in the first year from the pool based on measures of state need.

These five states (Texas, California, New Mexico, Montana, and Alaska) received an estimated $88 to $105 million in the first year from the quarter of funding based exclusively on measures of state need compared to the $50 million states received on average from this pool (Appendix Figure 1). Most of the extra dollars that these five states are estimated to have received relative to other states reflects the fact that a portion of funding is earmarked for them based on their large land area (see below). CMS intends to use the same data and measures for distributing funding based on state need over time.

Appendix Figure 1

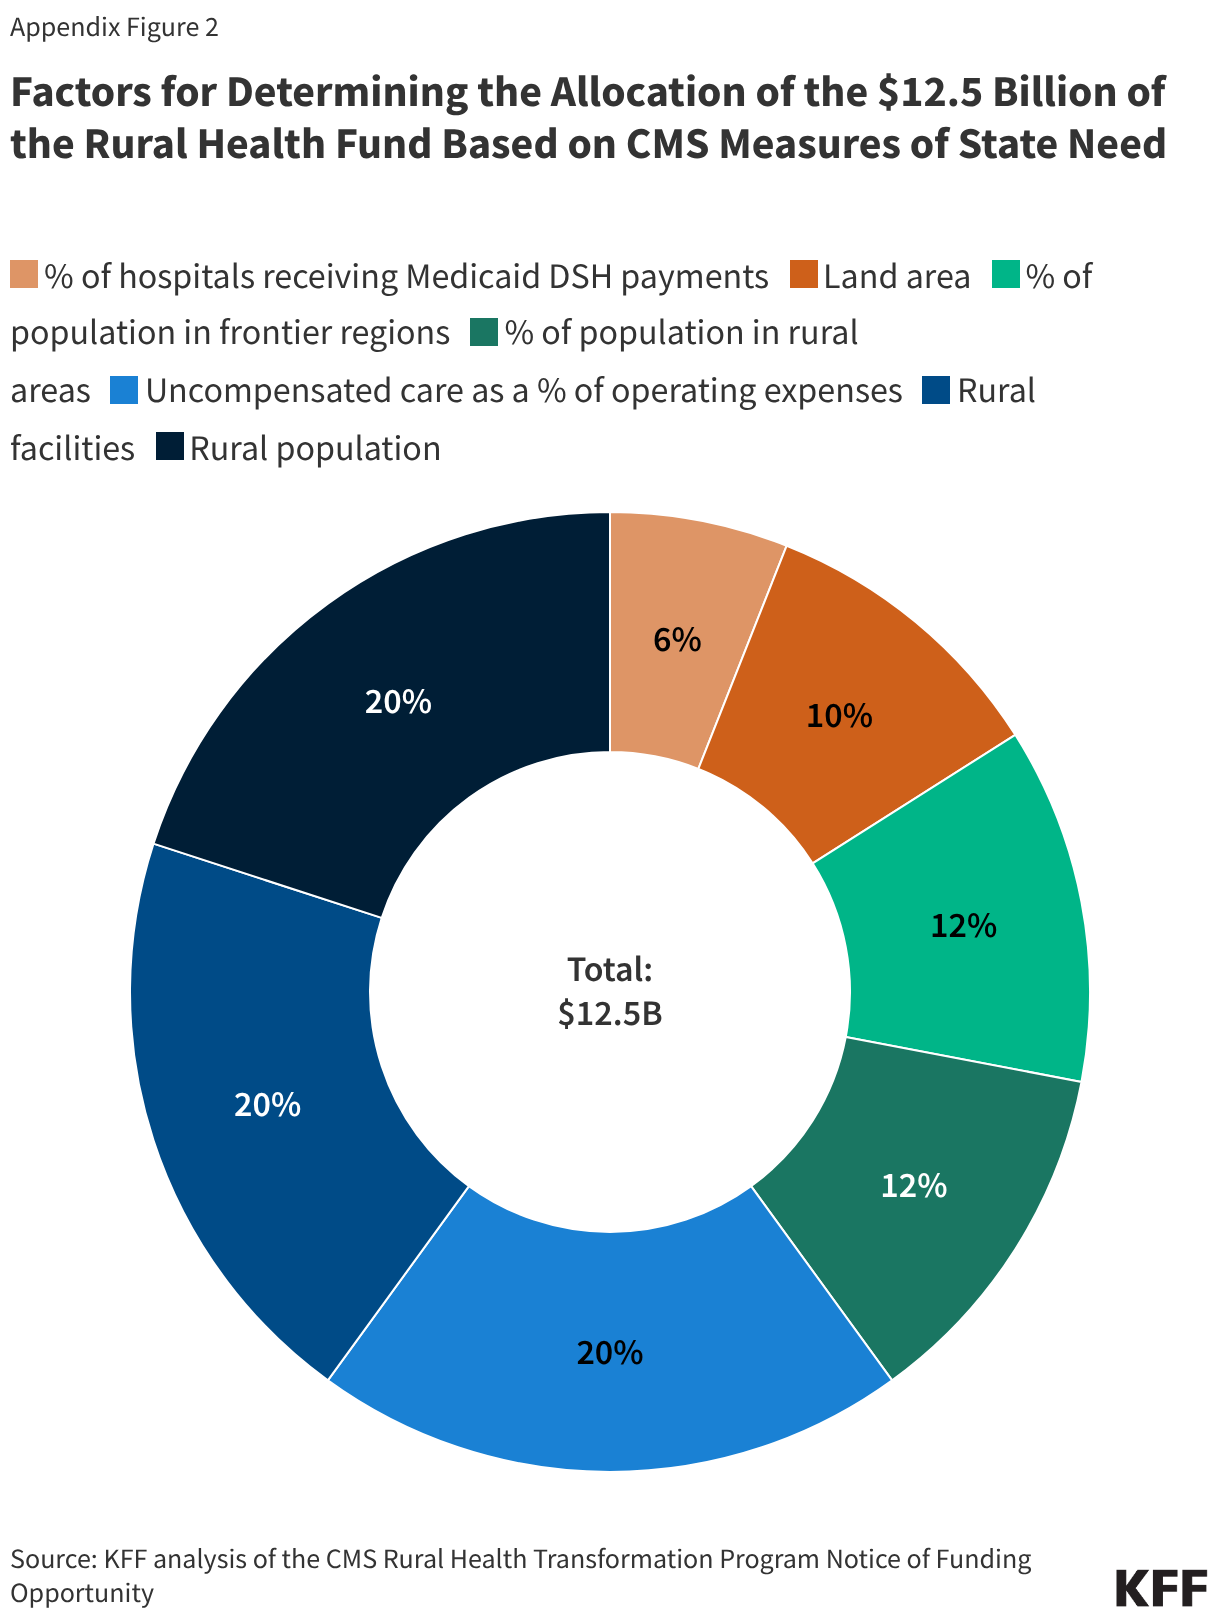
Based on criteria published by CMS, the funding tied to measures of need ($2.5 billion in the first year and $12.5 billion in total) is being distributed as follows (Appendix Figure 2):

  • Rural population and rural facilities. 40% of the $12.5 billion is based on the rural population and number of rural health care facilities in a state (20% each). CMS has published how it defines “rural” for purposes of distributing these dollars, though there are many potential ways of doing so. For example, CMS uses a broad definition of “rural hospitals” that includes all hospitals in areas classified as rural by the Health Resources & Services Administration (HRSA) (which itself is broader than some definitions) as well as any other hospital that receives certain Medicare rural payment designations or that is classified by Medicare as urban but reclassified as rural for certain payment purposes.
  • Uncompensated care as a percent of hospital operating expenses. 20% of the $12.5 billion is based on this measure, which is among all hospitals (i.e., not just those in rural areas). Uncompensated care tends to be higher in states that have not expanded Medicaid under the Affordable Care Act, such as Texas and Georgia. Further, CMS is using data from 2021; uncompensated care may have dropped over time among states that have recently expanded Medicaid (like Oklahoma and Missouri in 2021 and North Carolina and South Dakota in 2023).
  • Percent of population in rural areas and percent in frontier regions. 24% of the $12.5 billion is based on these measures (12% each). These factors do not account for the total size of the population in each state or the size of rural health care systems (which is also the case for three other factors, like land area). As a result, states with a relatively large share of the population living in rural and frontier areas but relatively small rural populations and few rural hospitals may still receive a greater than average share of these dollars (e.g., as is the case for Alaska, North Dakota, and Wyoming) while the reverse may be true for states with large rural populations and many rural hospitals (e.g., as is the case for California, Florida, and Texas). Nonetheless, as noted above, 20% of the $12.5 billion is based directly on rural population and 20% on rural facilities.
  • Land area. 10% of the $12.5 billion is based on land area and is only going to the five largest states. These five states will each receive large allocations from this pool (ranging from an estimated $240 to $260 million if all five continue to receive funding), while states just outside of the top five and all other states will not receive funds based on land mass.
  • Percent of hospitals receiving Medicaid disproportionate share hospital (DSH) payments. 6% of the $12.5 billion is based on this measure, which is among all hospitals (not just those in rural areas). Medicaid DSH status is based in part on the extent to which hospitals care for Medicaid and other low-income patients but also on specific criteria that vary across states.
Factors for Determining the Allocation of the .5 Billion of the Rural Health Fund Based on CMS Measures of State Need (Donut Chart)

Estimated awards in the first year based on state initiatives, state policies, and other factors ranged from $21 million in New Mexico to $84 million in Alaska.

Alaska, Texas, Nebraska, New Hampshire, and Hawaii received the largest estimated awards from this pool in the first year, ranging from $65 million to $84 million compared to the $50 million states received on average. This is a diverse group of states. For example, Alaska has the fifth-smallest rural population in the country (about 275,000) while Texas has the largest (about 4.3 million), and President Trump carried three of these states in the 2024 presidential election (Alaska, Nebraska, and Texas) but lost two (Hawaii and New Hampshire). The distribution of these dollars will change over time, for example, based on states’ progress on their proposed initiatives and on fulfilling policy commitments made in their applications.

Appendix Figure 3

Appendix Tables

Permitted Uses of the Rural Health Fund (Table)
Strategic Goals of the Rural Health Fund (Table)
Factors for Determining the Allocation of the Second Half ( Billion) of the Rural Health Fund (Table)

State Fiscal Conditions: Context on Medicaid Budgets for FY 2027

Published: Sep 18, 2026

Medicaid is the primary program providing comprehensive health and long-term care to one in five people living in the U.S. and accounts for nearly $1 out of every $5 spent on health care. Medicaid is administered by states within broad federal rules and jointly funded by states and the federal government through a federal matching program with no cap. Overall, the federal government typically pays about two-thirds of total Medicaid costs and states pay one-third, though the matching rate varies by state. States also have flexibility to determine how to finance their share of Medicaid payments, within certain limits. Flexibility in administration and financing results in variation in Medicaid eligibility, benefits, and provider payments across the nation.

Medicaid funding is often central to overall state budgetary decisions as it is simultaneously a significant spending item as well as the largest source of federal revenues for states. According to data from the National Association of State Budget Officers (NASBO), in state fiscal year (FY) 2025, Medicaid accounted for 31% of total state spending for all items in the budget. Medicaid accounted for only 17% of expenditures from state funds (including general funds and other state funds) but accounted for 57% of all expenditures from federal funds.

State fiscal conditions are tightening due to slowing revenue growth and increased spending pressures. This, combined with other budgetary pressures, like the implementation of the 2025 reconciliation law that includes significant reductions in federal Medicaid spending, may increase the likelihood of states enacting Medicaid restrictions. This brief describes current fiscal conditions using the latest state revenue and spending data from NASBO and analyzes how these conditions may impact states’ Medicaid budget decisions going forward.

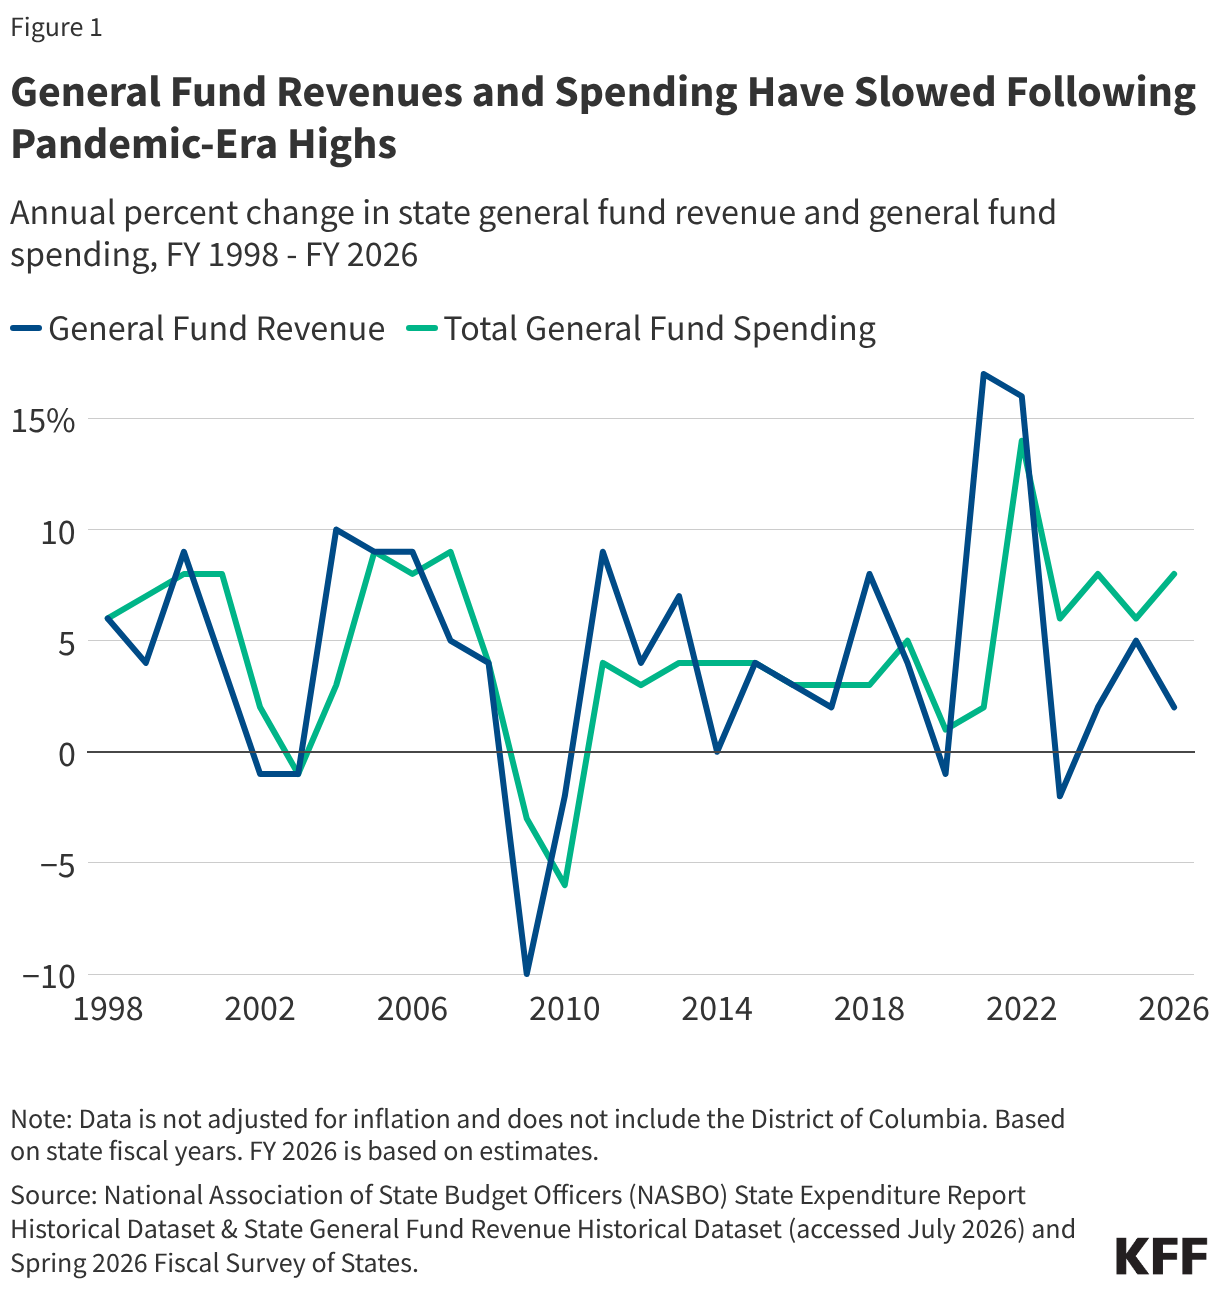
States continue to experience slow revenue growth following pandemic-era highs (Figure 1). State economic conditions worsened rapidly when the pandemic hit but recovered quickly, leading to a period of record-breaking revenue and spending growth for states. However, tax cuts combined with inflationary pressures, stock market volatility, and changes in consumer consumption patterns led to slowing state revenue growth in FY 2023 through FY 2026. While many states ended FY 2026 with revenues above projected amounts, estimated total revenue growth was 2% compared with 5% in FY 2025, and many states saw declines in revenue collections. States’ enacted budgets for FY 2027 are based on projections of another fiscal year of revenue growth between 2-3%. In addition, recent data along with federal policy changes that impact tax codes and reduce federal funding suggest long-term weakness that may present challenges in future years.

General fund spending growth has also moderated in recent years. Spending growth generally follows trends in revenue growth because states generally need to enact balanced budgets. Similar to revenue trends, spending growth peaked in FY 2022 at 14% and then moderated from FY 2023 through FY 2026 (Figure 1). Estimated total general fund spending growth was 8% in FY 2026, and enacted FY 2027 budgets on average included spending growth between 2-3%, indicating that spending growth continues to slow. Rather than expanding state services and committing to new spending items, recently enacted budgets focus on funding for core services and targeted spending adjustments to maintain balance between ongoing revenue and recurring spending items, highlighting the tightening fiscal environment and future uncertainty.

General Fund Revenues and Spending Have Slowed Following Pandemic-Era Highs (Line chart)

How do fiscal conditions vary across states?

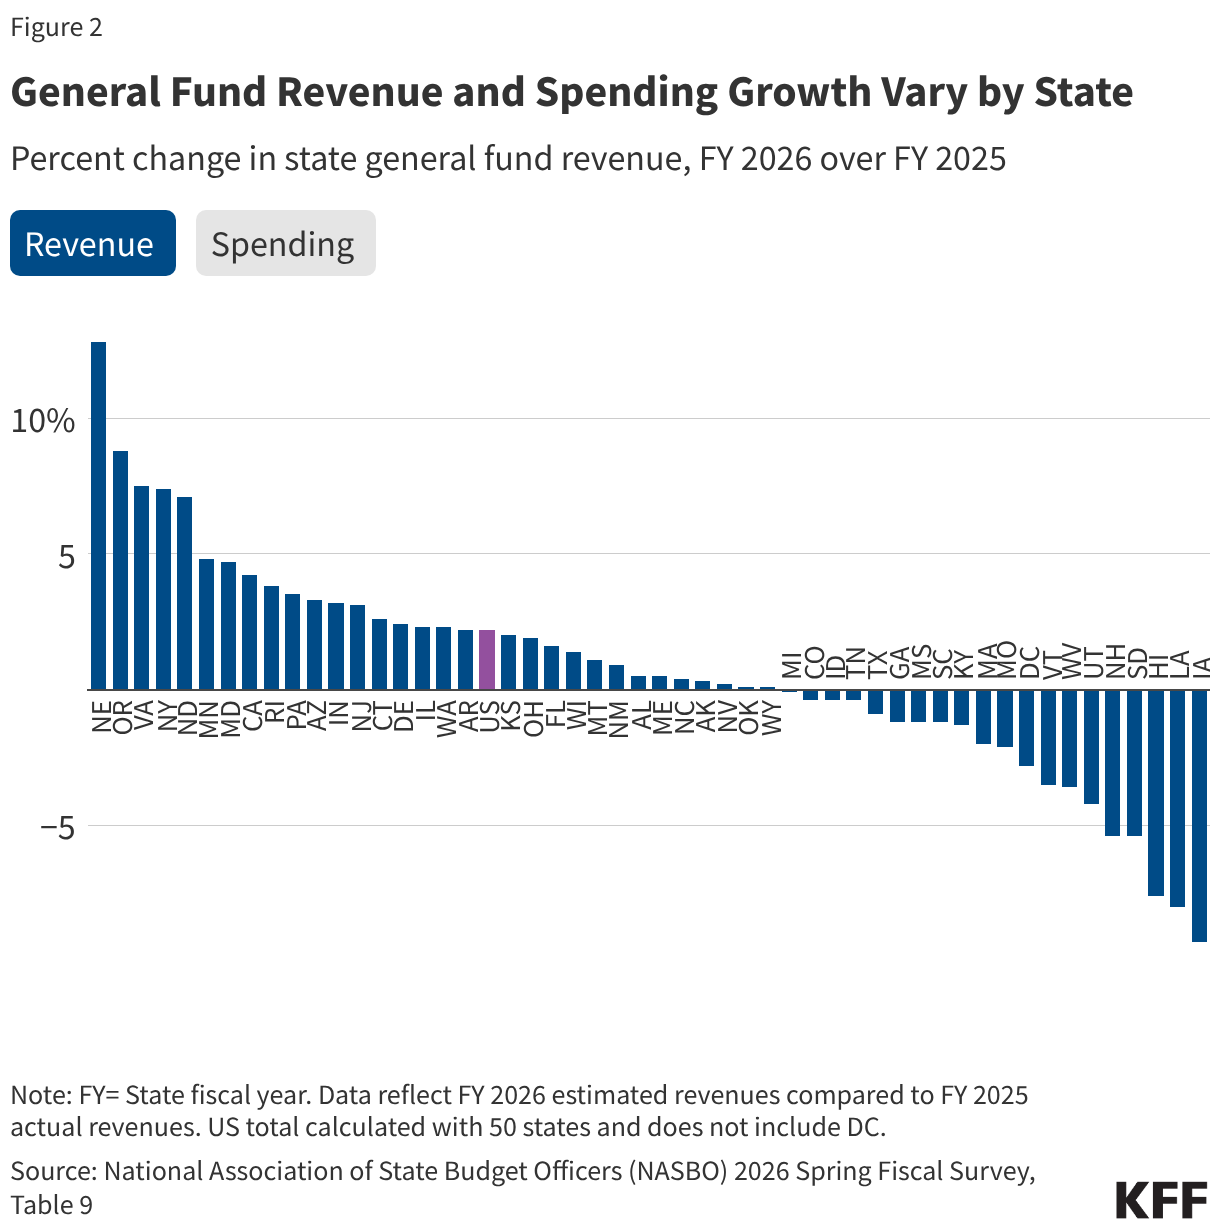
State revenue growth varies by state, with 20 states experiencing revenue declines in FY 2026 (Figure 2). At the same time, 30 states had revenue increases above 0% but below 10% and one state saw revenue increases over 10% in FY 2026. On average across states, general fund revenues increased by 2% from FY 2025 to FY 2026. State general fund revenues are mostly comprised of personal income, corporate income, and sales taxes, and revenue growth varies depending on state policy decisions and reliance on tax types. Strong revenue collections from personal income tax have driven the modest revenue growth seen in recent years, though several states have recently enacted cuts to income tax rates which could impact future revenue growth.

In addition, 11 states experienced reductions in general fund spending in FY 2026. This is notable because state spending must typically increase to keep pace with rising costs – particularly in a period of high general inflation – and signals some states have implemented targeted spending cuts or other budget maneuvers. In FY 2026, five states had to enact mid-year budget cuts to avoid shortfalls, which is a small share but the most that have done so since FY 2021. A majority of states (34) had modest general fund spending growth above 0% but below 10%, and six states saw spending growth over 10% from FY 2025 to FY 2026. On average across states, general fund spending increased by 8% in FY 2026. FY 2027 enacted budgets include more budget management strategies like spending cuts or other cost containment measures, with some states reducing spending levels from FY 2026.

General Fund Revenue and Spending Growth Vary by State (Column Chart)

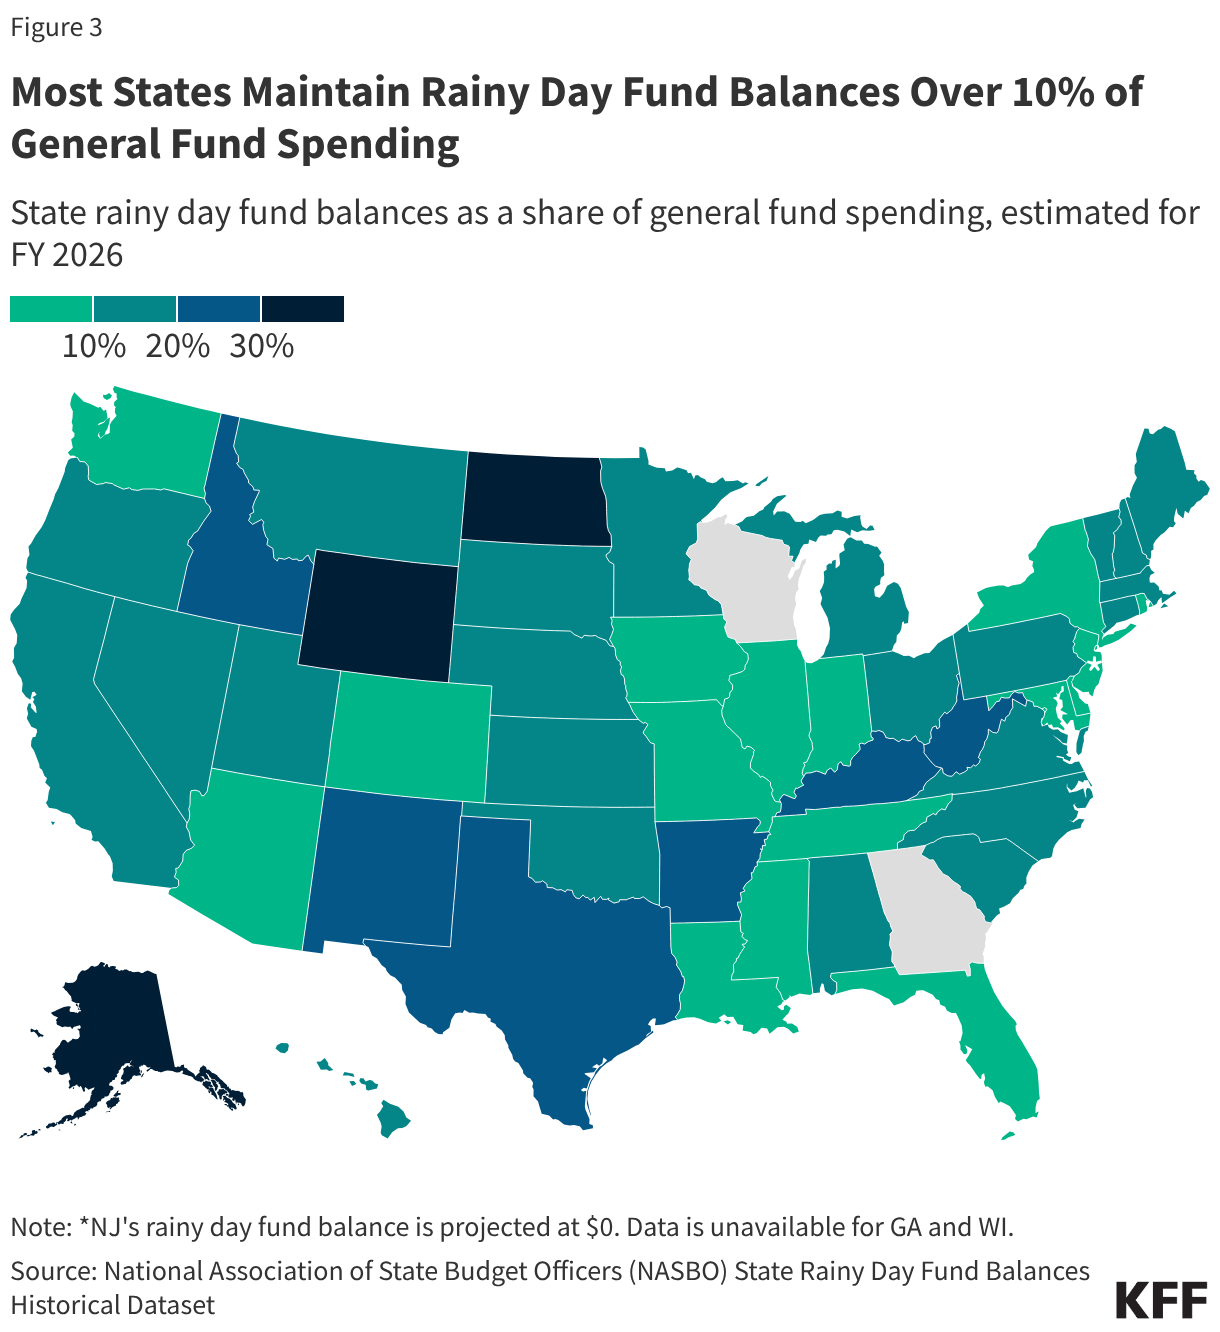
While most states have rainy day funds, balances varied significantly by state and had fallen slightly from pandemic-era highs in FY 2026 (Figure 3). Pandemic-era growth in tax revenues left states with large revenue surpluses over multiple fiscal years. Some of these funds were transferred to rainy day funds that reached record high balances. As revenues moderated, states spent surplus funds, largely on one-time expenditures, or used other one-time budget maneuvers to balance their budgets. By FY 2026, rainy day funds remained elevated but had fallen from their pandemic-era peak, ranging from less than 10% of general fund spending in 17 states to over 30% in three states. General fund ending balances as well as total balances, which include both general fund ending balances and rainy day funds, have also decreased, softening states’ ability to rely on savings. While most states plan to increase or maintain rainy day funds in FY 2027, general fund ending balances and total balances are expected to continue to decline as states spend down prior-year surplus funds.

Most States Maintain Rainy Day Fund Balances Over 10% of General Fund Spending (Choropleth map)

What factors will affect state budgets in FY 2027 and beyond?

State budget priorities may shift after the 2026 elections. As constituents struggle with the cost of living, state legislatures may opt to provide relief through enhancing social support or by enacting tax relief, though both options may become more difficult as fiscal conditions tighten. States are also contending with increasing spending demands from Medicaid, employee health care, education, housing, and disaster response. Following 2026 elections, new governors may shift priorities reflected in state budgets. Of the 37 states with gubernatorial elections (including DC’s mayoral election), there are 19 states where the incumbent is not running and a new governor or mayor may be elected. New governors’ administrations often bring in new policy priorities, new agency staff, and different implementation approaches that may be reflected in future budgets.

Economic changes and recent federal actions, including the passage of the 2025 reconciliation law, create additional budget uncertainty. States’ fiscal outlooks may be affected by continued inflationary pressures and slowing consumer spending. States are also facing uncertainty about tariffs, increasing national debt, and a fluctuating job market. In addition, the 2025 reconciliation law includes significant policy changes and federal funding cuts, such as tax code changes as well as Medicaid and SNAP funding cuts. The implementation of the reconciliation law’s provisions also requires costly administrative and systems changes for many states.

In response to mounting budget pressures and the 2025 reconciliation law, states may reduce Medicaid spending. The combination of tighter state fiscal conditions, other economic factors, and the implementation of the 2025 reconciliation law may result in state reductions to Medicaid spending. The impact of the 2025 reconciliation law will vary across states based on expansion status and reliance on provider taxes and state-directed payments. States have limited options to respond to reductions in federal Medicaid spending (Figure 4). States may try to raise additional revenues or reduce spending in other areas of the budget, though this is likely challenging given tightening state fiscal conditions. Instead, states may seek to restrict Medicaid provider reimbursement rates, benefits, or eligibility to reduce state Medicaid spending. A few states had already implemented Medicaid spending cuts for FY 2026 (and proposed cuts for FY 2027), and Medicaid cuts may ramp up as more provisions of the 2025 reconciliation law are implemented.  

Figure 4

State and Federal Reproductive Rights and Abortion Litigation Tracker

Last updated on

The Supreme Court’s Dobbs ruling, overturning Roe v. Wade, returned the decision to restrict or protect abortion to states. In many states, abortion providers and advocates are challenging state abortion bans contending that the bans violate the state constitution or another state law. Additionally, new questions have arisen regarding the intersection of federal and state authority when it impacts access to abortion and contraception.

This litigation tracker presents up-to-date information on the ongoing litigation in state and federal courts involving access to contraception and abortion. Use the buttons below to navigate between cases related to: Pregnancy and Work, Emergency Care, Family Planning, Privacy, Medication Abortion, Minors Access, and State Abortion Bans. 

Litigation Involving Reproductive Health and Rights in the Courts, as of September 16, 2026 (Table)

Women’s Experiences Accessing Health Information Online: Trusted Sources and Contraceptive Information

Findings from the 2026 KFF Women's Health Survey

Published: Sep 16, 2026

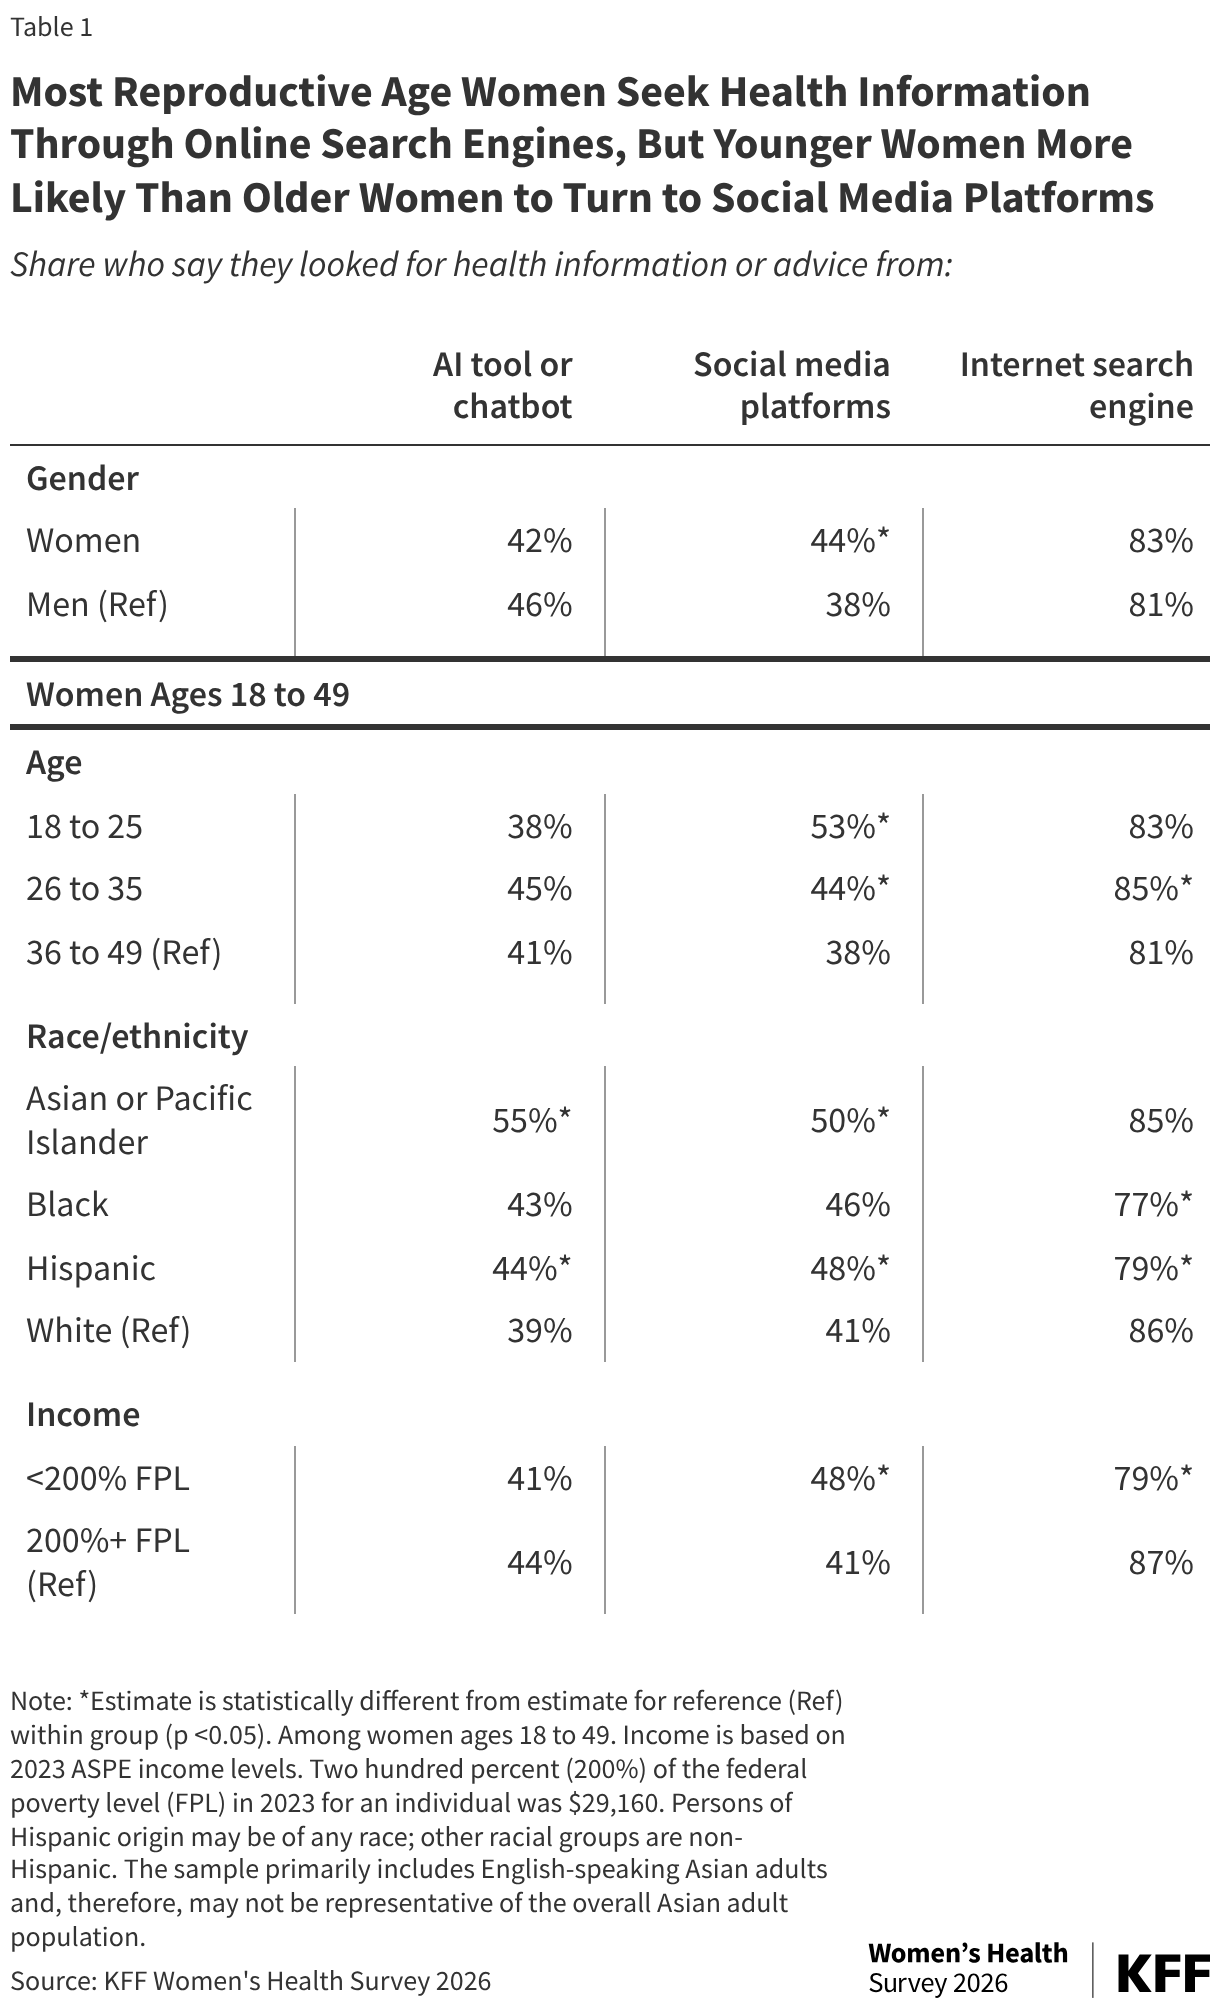
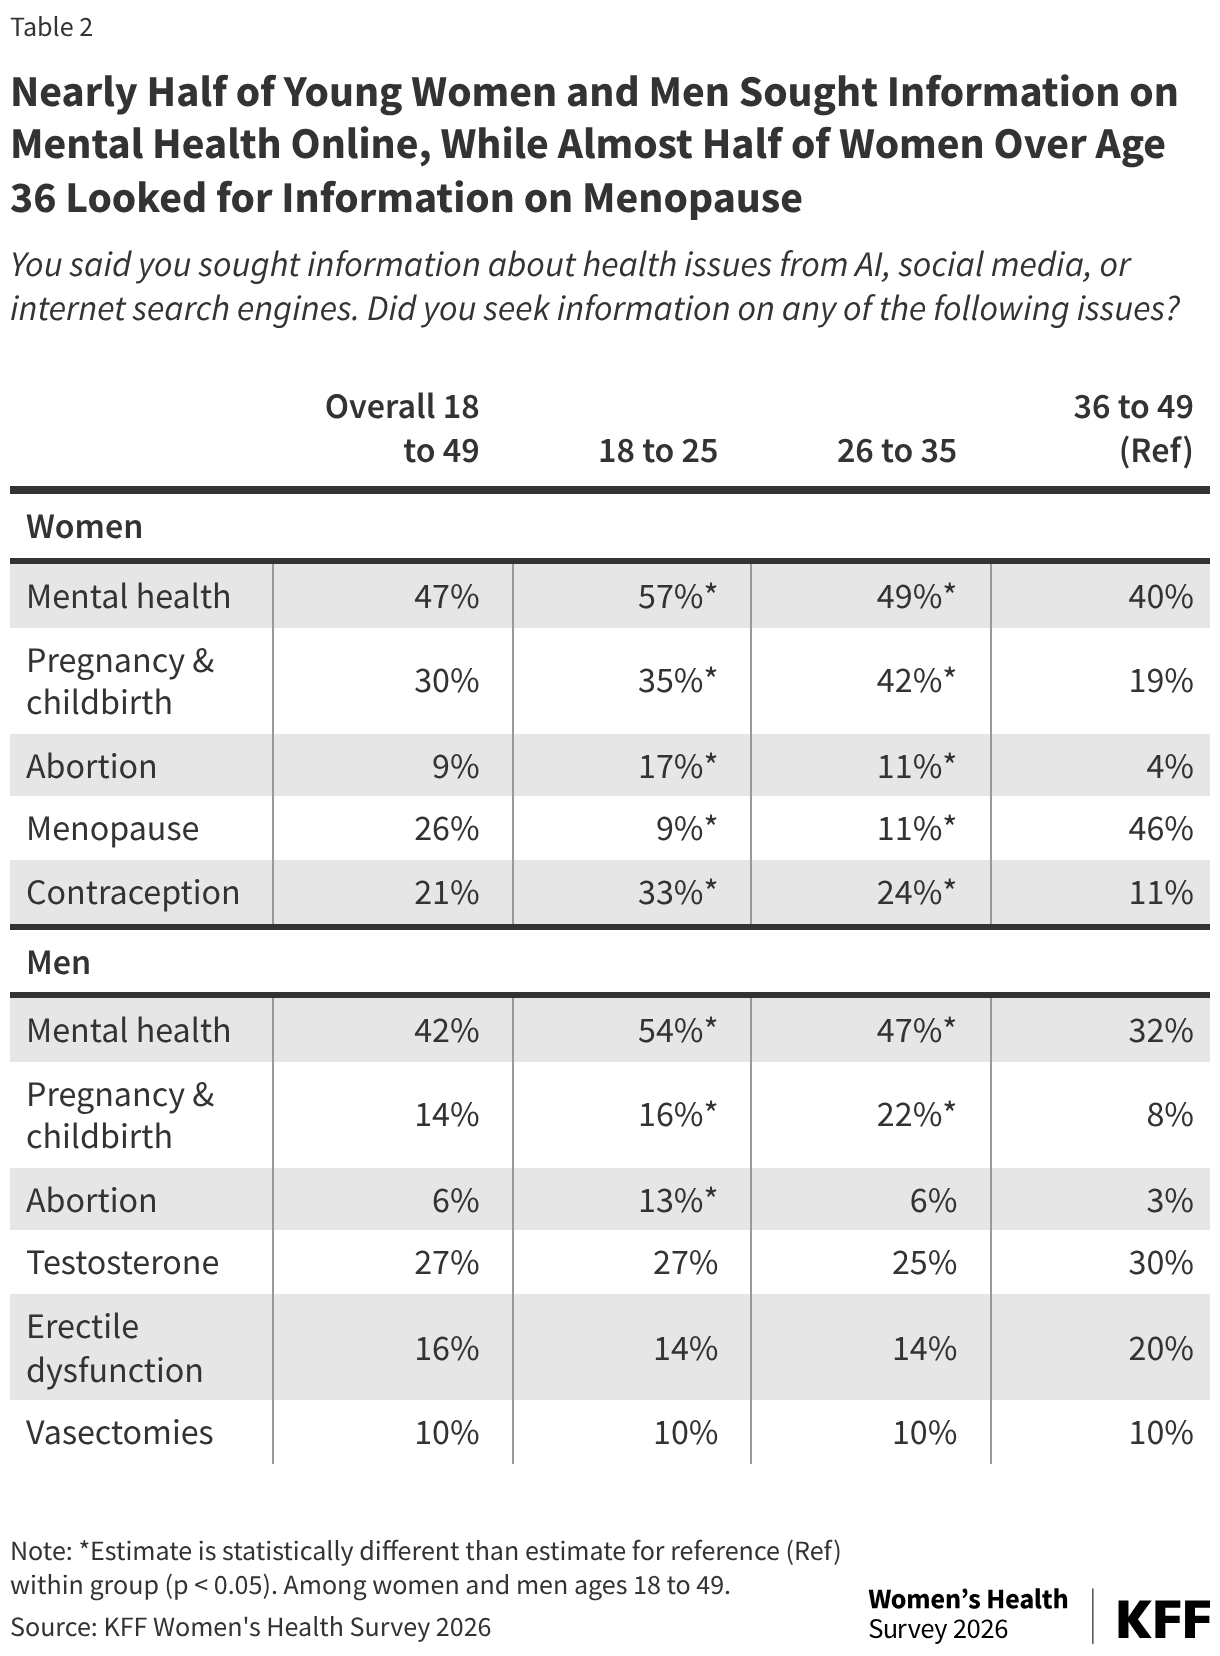
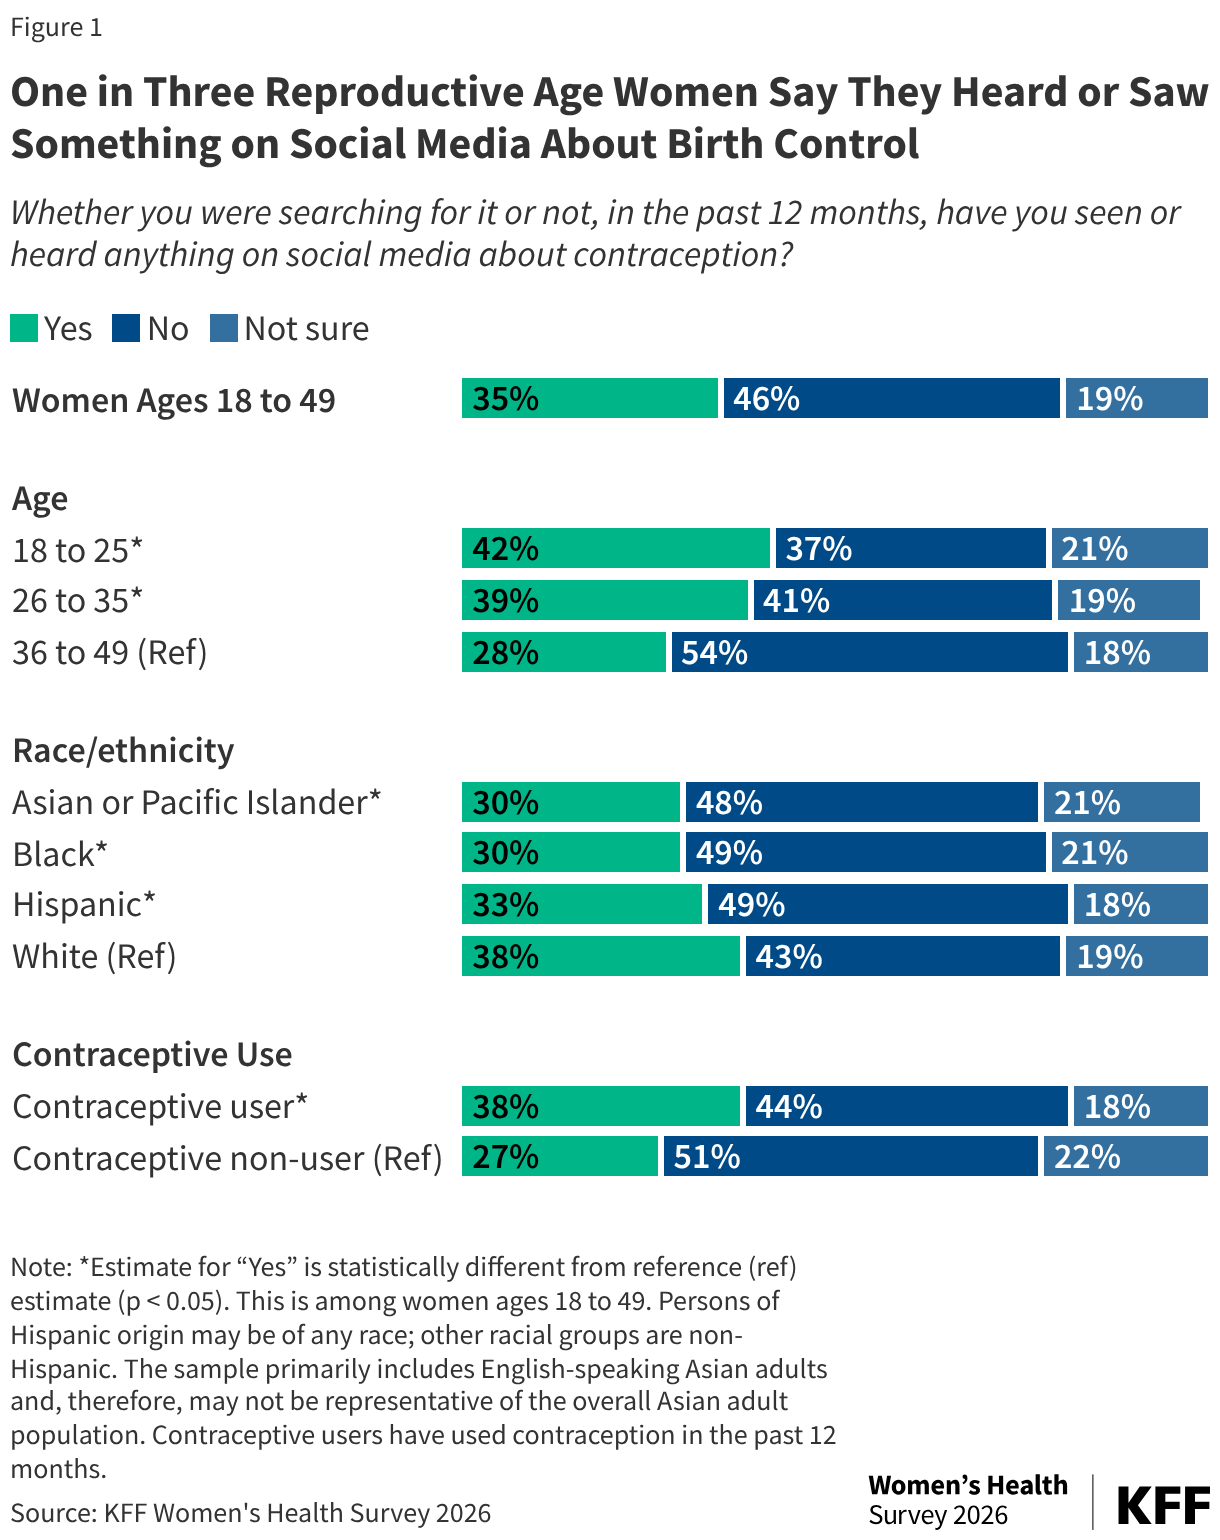
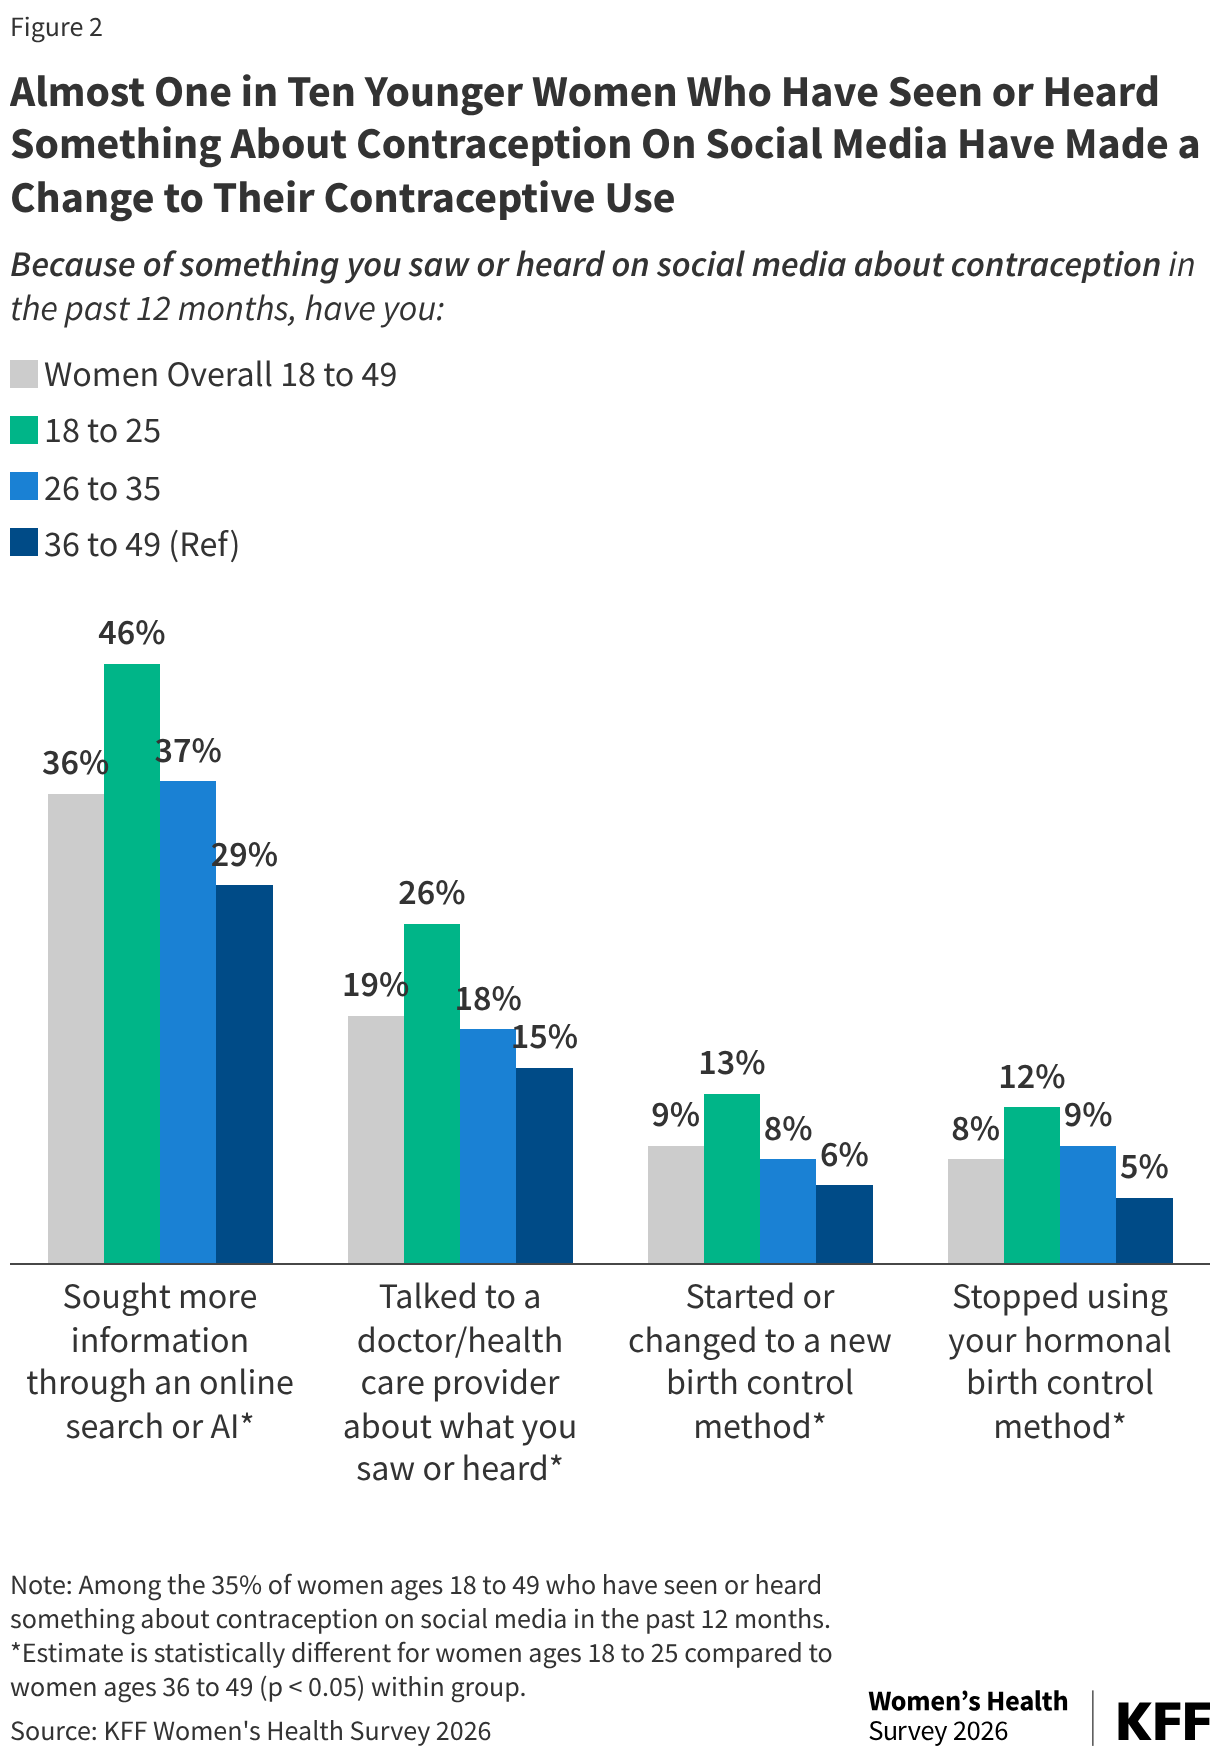
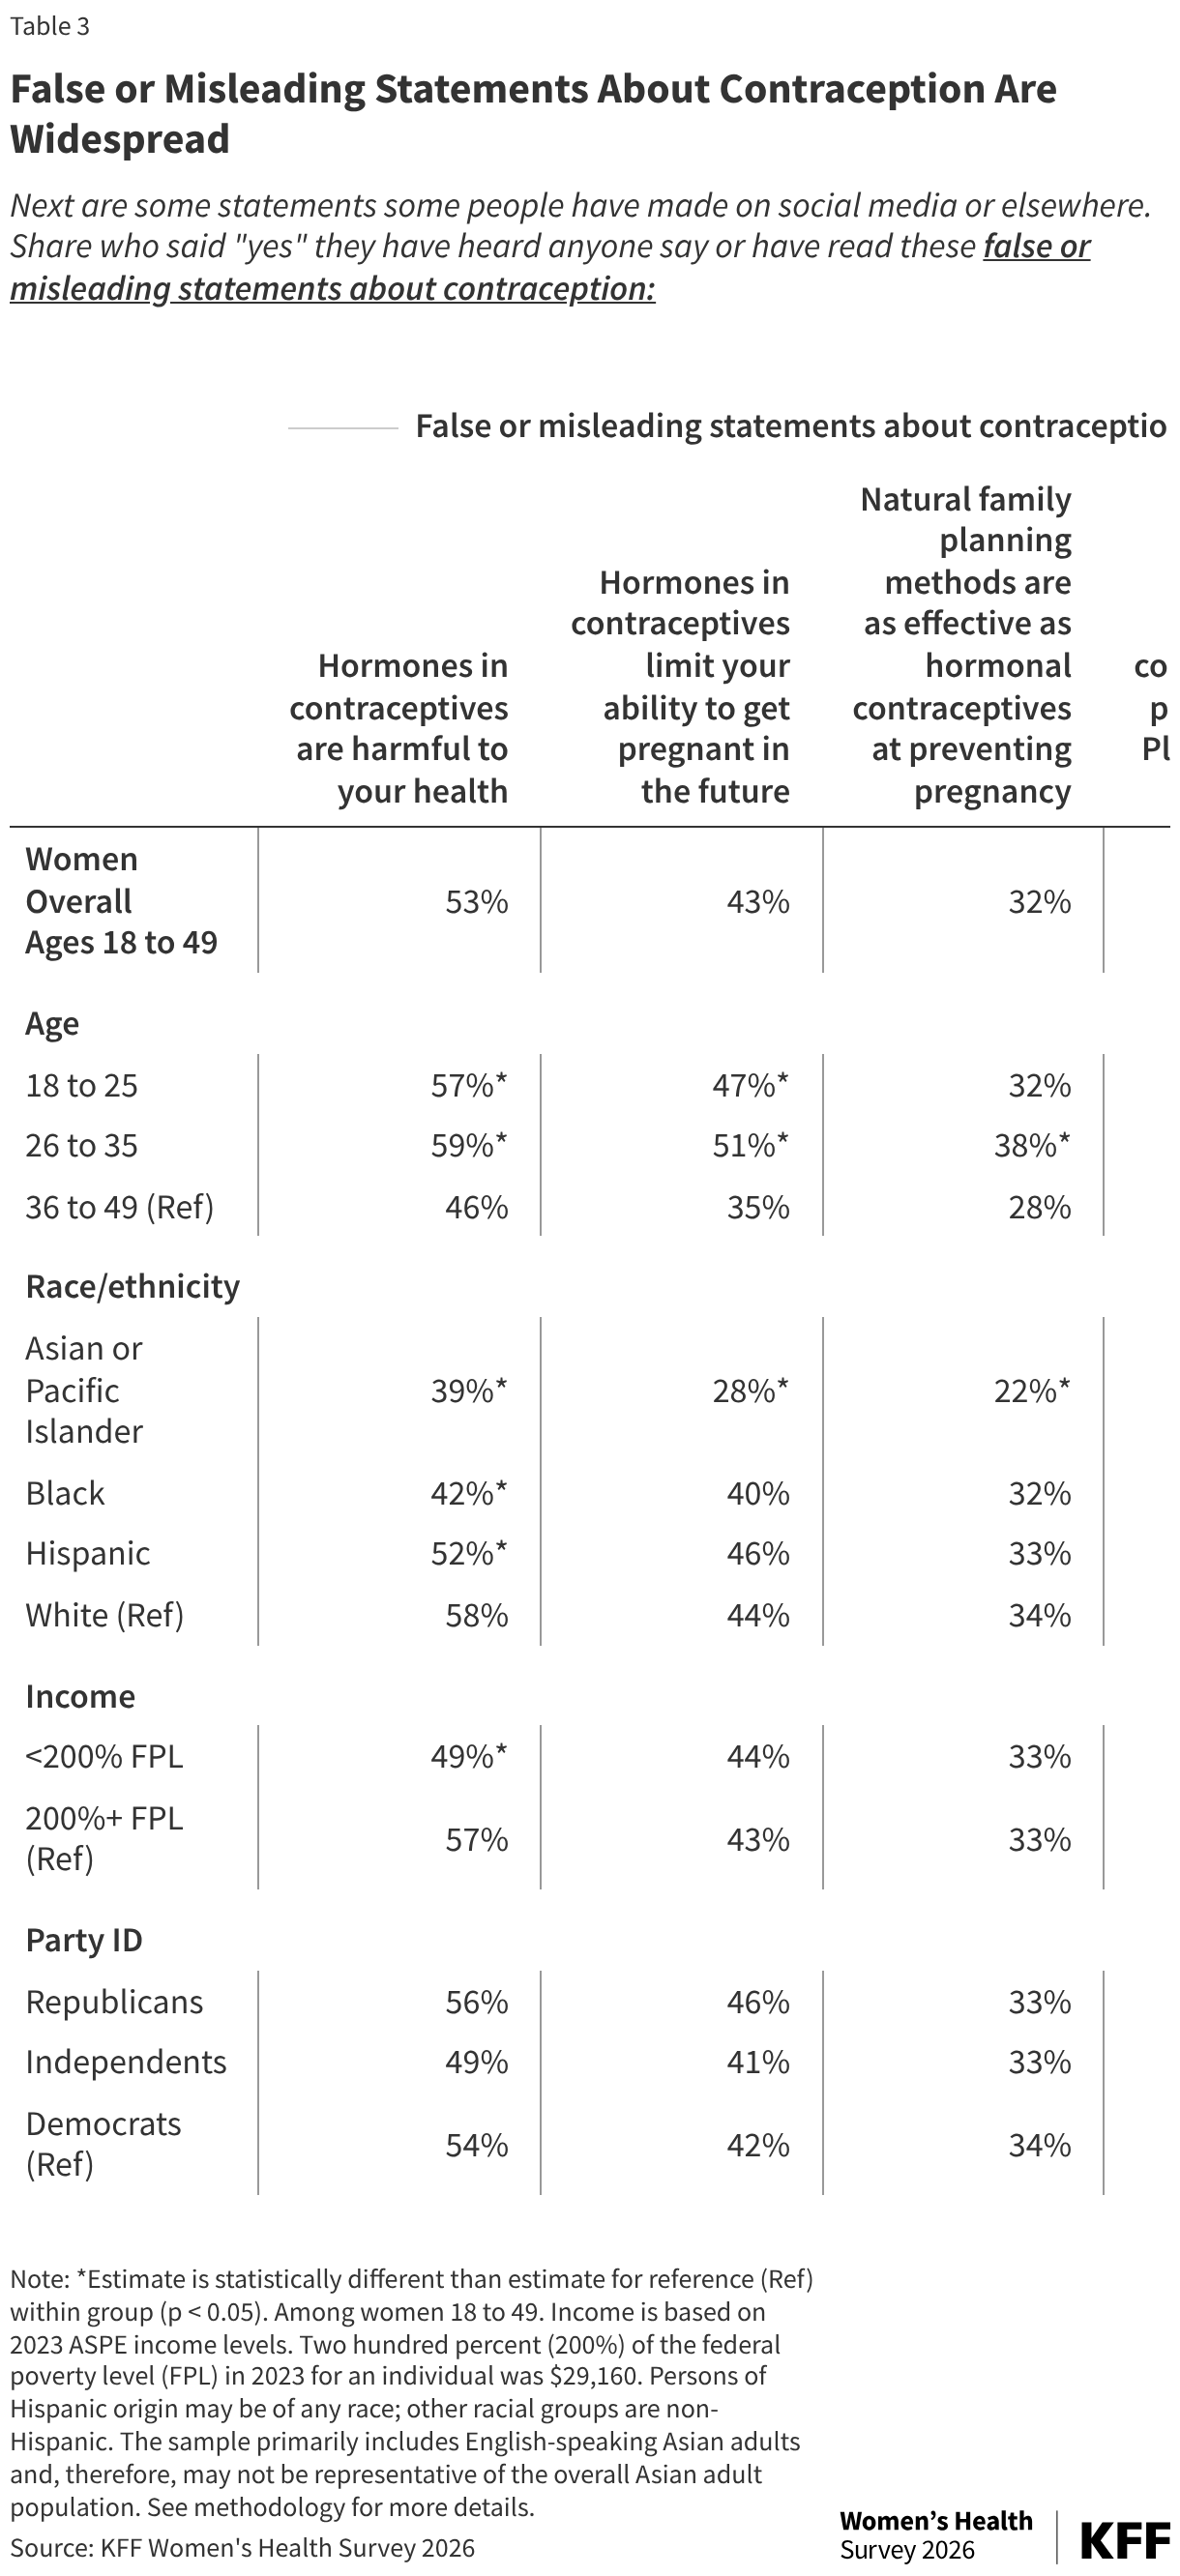
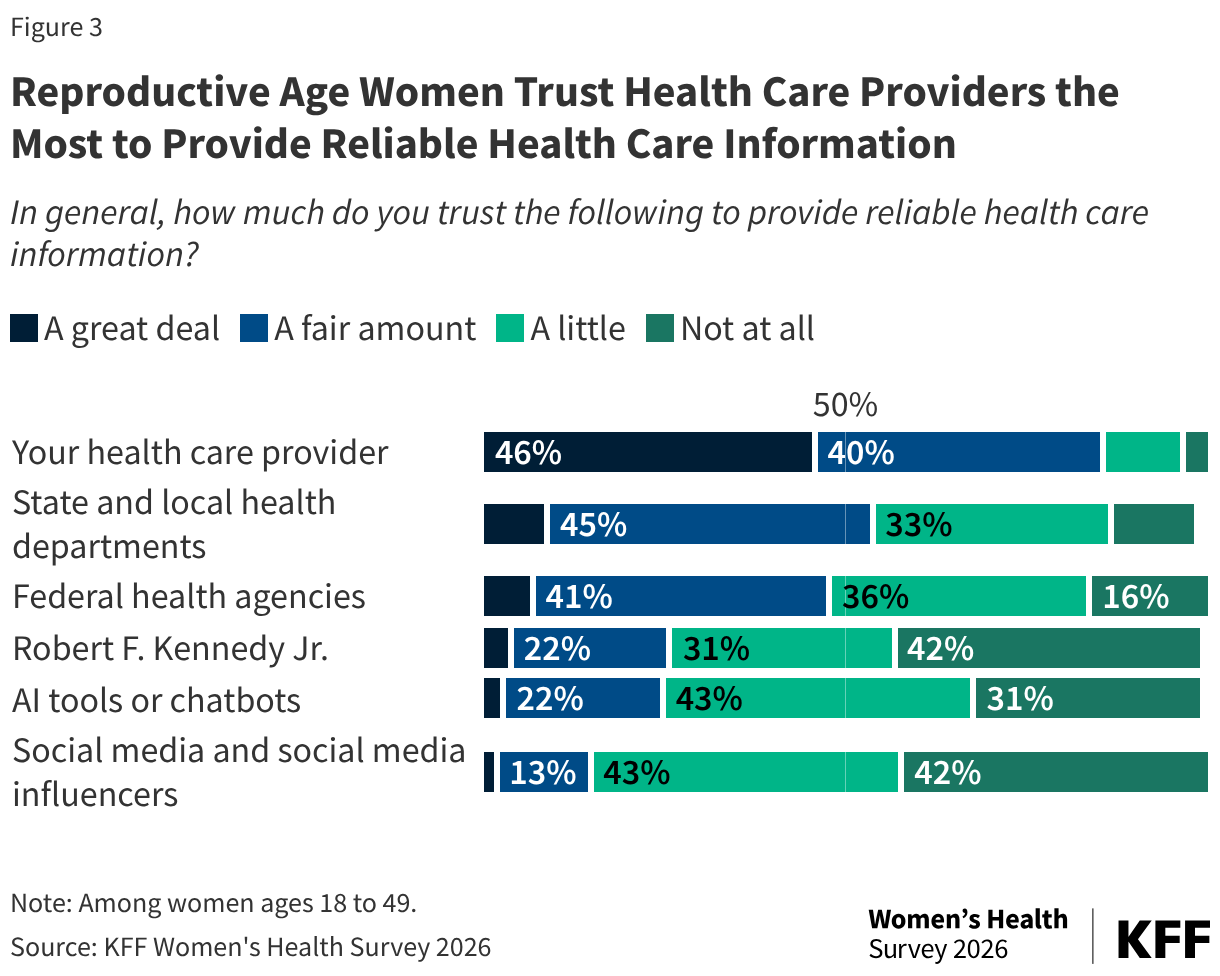
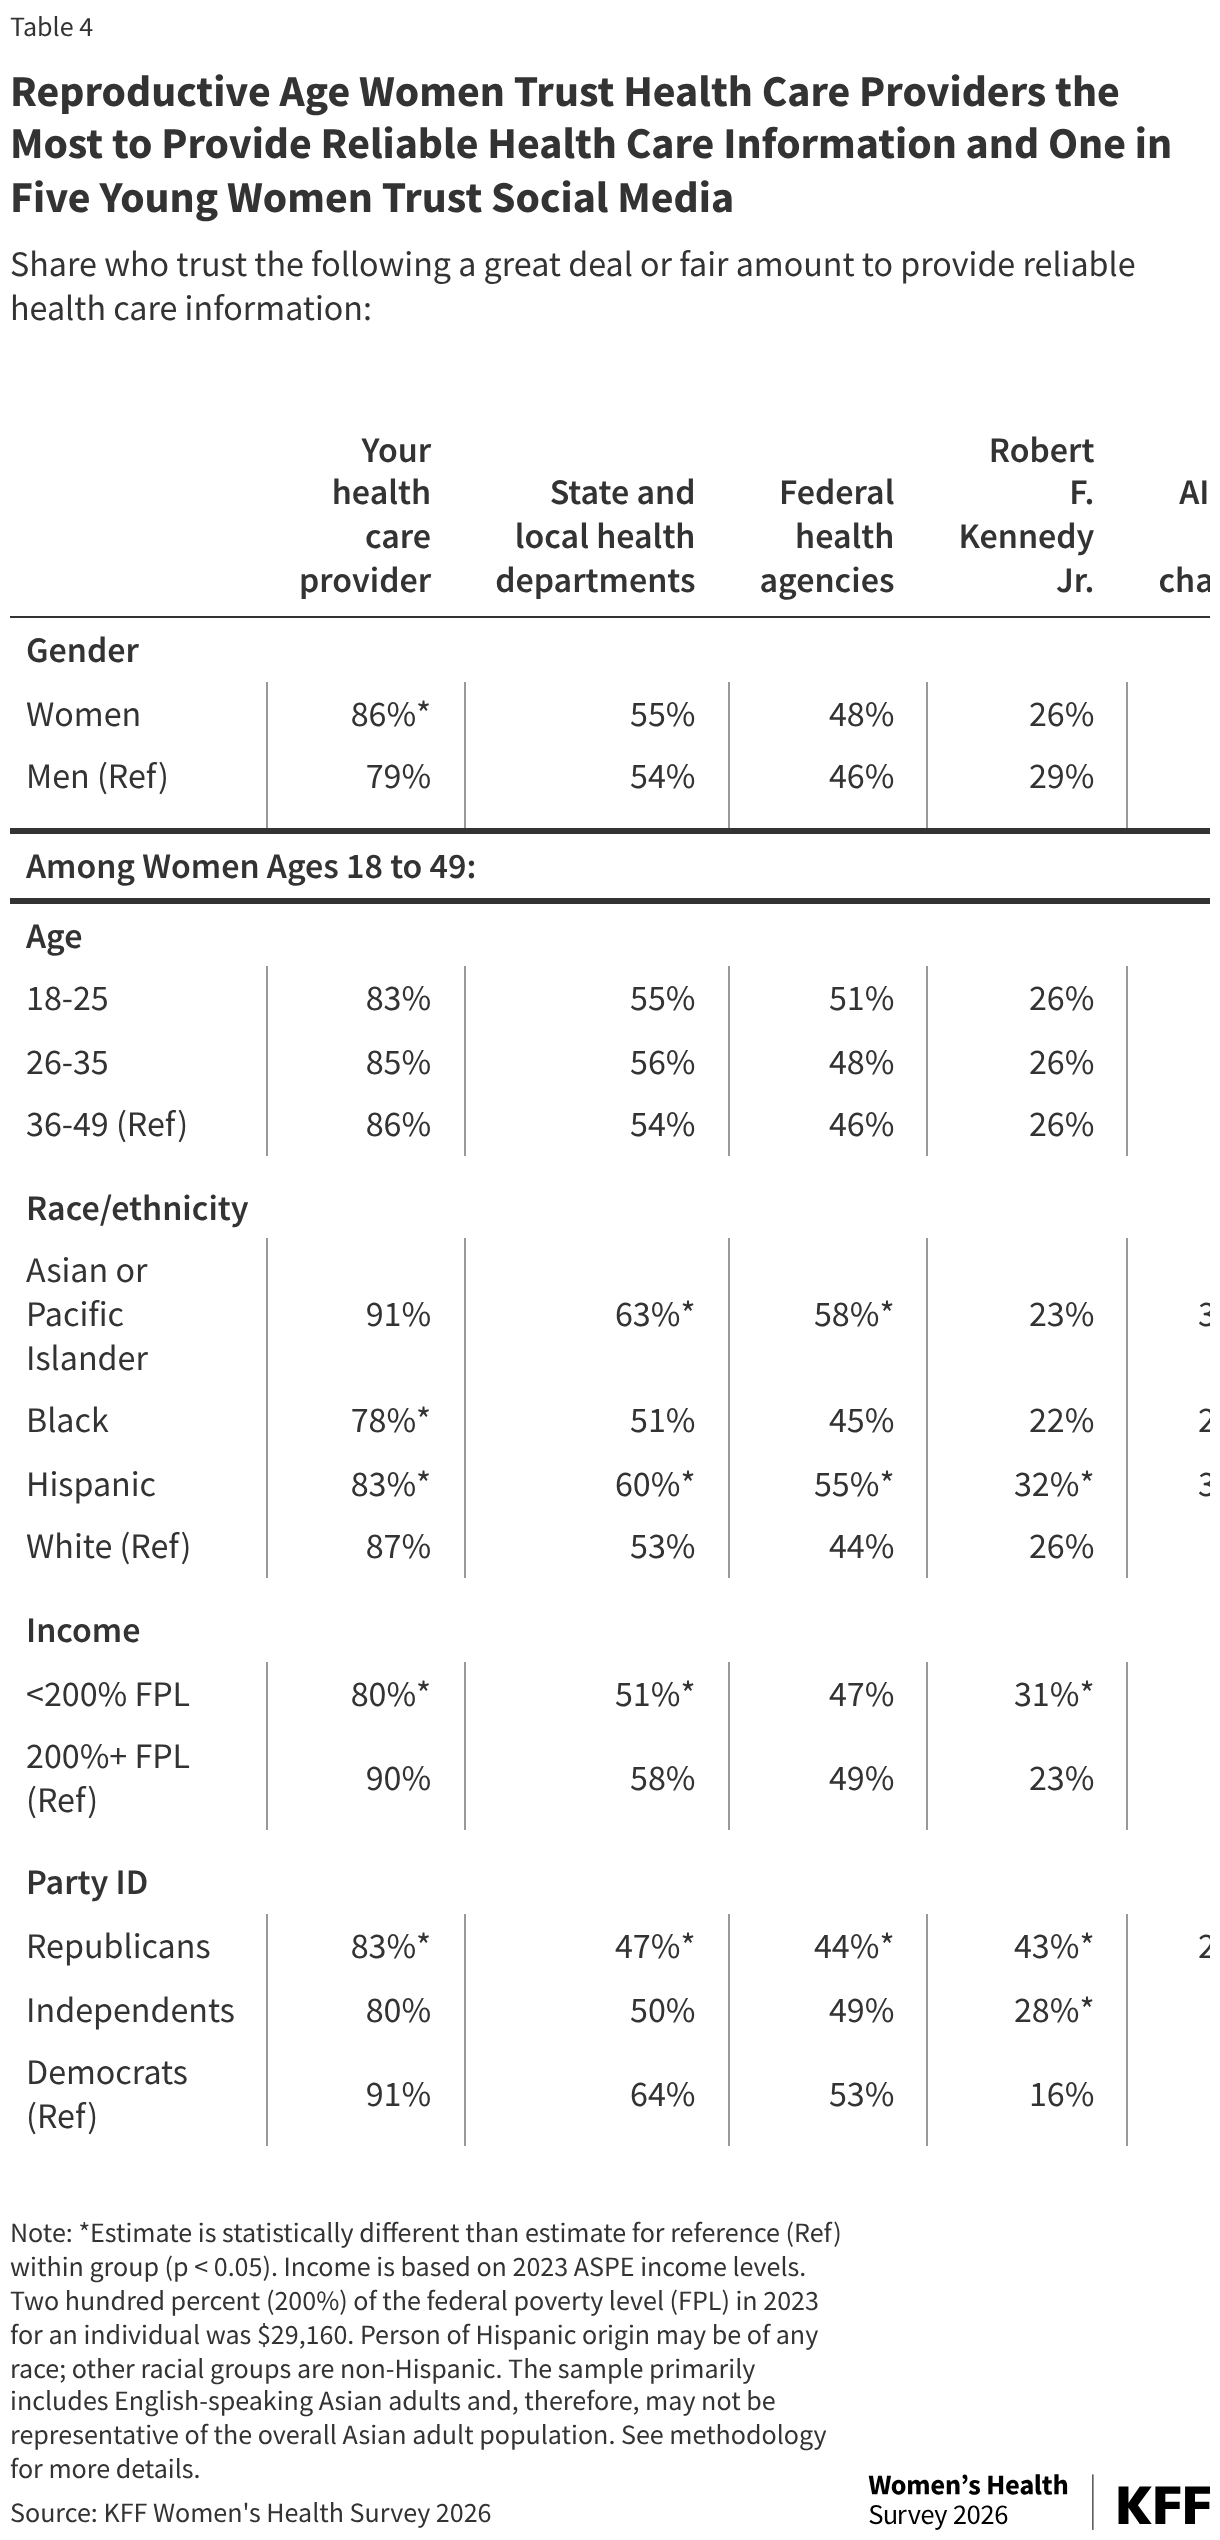
The internet, social media, and artificial intelligence (AI) have all changed the way people share and research health information. All of these platforms can make health information extremely accessible but also can increase the ability of misinformation to spread rapidly. KFF has been tracking these dynamics through its extensive polling work on Health Information and Trust. The KFF Women’s Health Survey, a nationally representative survey of 4,688 women and 1,148 men ages 18 to 64 fielded between March 11, 2026 and April 14, 2026, asked people whether they have used these platforms to look for health information or advice and whether they trust the information they are receiving.  This brief focuses on reproductive age (18 to 49) women (n = 3,538) and men (n = 840). It also looks at exposure to false and misleading information about contraception and assesses changes in contraceptive use in response to online information among reproductive age women.   

Accessing Health Information

  • The majority of reproductive age people ages 18 to 49 have looked for health information online, and large shares seek mental health information. Most reproductive age women (83%) and men (81%) have looked for health information or advice through an internet search engine in the past year, while four in ten have used an AI tool or chatbot or social media. Nearly half of women (47%) and men (42%) ages 18 to 49 have sought information on mental health. This rises to 57% of women and 54% of men ages 18 to 25 who have sought information on mental health. Almost half (46%) of women ages 36 to 49 have looked for information about menopause, and over a quarter (27%) of all men (ages 18 to 49) have sought information on testosterone.  
  • Health care providers remain the most trusted sources for reliable health care information for reproductive-age women despite widespread use of online sources and social media. Health care providers are the most trusted source for reliable health care information among reproductive age women (85% say they trust them a great deal or a fair amount), while one in four say they trust AI tools and chatbots (25%) for reliable health information and fewer (14%) trust social media and social media influencers. About half (48%) of women trust federal health agencies for reliable health care information and 26% trust the head of Health and Human Services (HHS), Robert F. Kennedy Jr. Higher shares of Democratic women trust their health care provider, state and local health departments and Federal health agencies compared to Republican women, while higher shares of Republican women trust Robert F. Kennedy Jr. And AI tools and chatbots compared to Democratic women.  

Contraception on Social Media 

  • Regardless of whether they sought it out, a higher share of younger women has seen or heard information about contraception on social media compared to their older counterparts. One in three (35%) women of reproductive age have seen or heard something about contraception on social media in the past 12 months, rising to 42% of younger women (ages 18 to 25). 
  • Younger women (18 to 25) are more likely than women ages 36 to 49 to talk to their doctor, seek more information online, or change their contraceptive behavior based on something they saw on social media. Among women who saw or heard something about contraception on social media, larger shares of young women ages 18 to 25 compared to women ages 36 to 49 stopped using their hormonal birth control method (12% vs. 5%), started or changed to a new birth control method (13% vs. 6%), sought more information from a doctor or healthcare provider (26% vs. 15%), or sought more information through an online search or AI (46% vs. 29%). 

Exposure to False or Misleading Statements About Contraception 

Large shares of reproductive age women report being exposed to false and misleading statements about contraception. About half (53%) of women of reproductive age say they have seen or heard the false statement that hormones in contraceptives are harmful to your health on social media or elsewhere and about four in ten (43%) have been exposed to the false claim that hormones in contraceptives limit your ability to get pregnant in the future. About one in three (32%) have heard that natural family planning methods are as effective as hormonal contraceptives at preventing pregnancy (when it is less effective) and emergency contraceptive pills, such as Plan B, cause abortions (emergency contraceptive pills do not end a pregnancy).  

Accessing Health Information  

The majority of reproductive age women (87%) and men (86%) have looked for health information or advice online either through an internet search engine, social media, or AI tools. Most reproductive age women (83%) and men (81%) have used internet search engines, such as Google or Bing, in the past year to look for health information or advice (Table 1). Women are more likely than men to use social media to search for health information (44% vs. 38%) but are as likely to look for health information through an AI tool or chatbot such as ChatGPT, Google Gemini, or Claude (42% for women vs. 46% for men). Nearly one in four (24%) women say they have used all three methods — internet search engines, AI tools, and social media — to search for health information (data not shown).

Table 1 shows the share of women ages 18 to 49 who say they have looked for health information or advice from an AI tool or chatbot (42%), social media platforms (44%), or an internet search engine (83%) in the past year. The table compares women and men ages 18 to 49. Larger shares of reproductive age women have looked for health information or advice on social media platforms compared to men. Among women ages 18 to 49 the table presents data by age, race/ethnicity, and income. Larger shares of younger women less than age 36 have looked for health information or advice through social media platforms compared to women ages 36 to 49.

Larger shares of Asian (55%) and Hispanic (44%) women say they used AI tools or chatbots for health information in the past year compared to White women (39%).  In general, smaller shares of people report using social media platforms for health information or advice. However, half of Asian (50%) and Hispanic (48%) women report looking for health information or advice on social media compared to four in ten White women (41%). Over half (53%) of women ages 18 to 25 also report using social media for health information. Larger shares of women with low incomes looked for health information on social media compared to women with higher incomes (48% vs. 41%). This aligns with previous KFF polling findings that have found younger adults and adults with lower incomes are more likely to use social medial for health information and are more likely to say they do so because they can’t afford to see a provider or don’t have a regular provider.  

The survey asked whether individuals sought information about different health topics through these various platforms and nearly half of reproductive age women say they sought information about mental health (47%) (Table 2). This rose to 57% of women ages 18 to 25. A quarter of women of reproductive age (26%) sought information about menopause online, but almost half (46%) of women between the ages of 36 and 49 looked for this information online. Three in ten women of reproductive age (30%) say they looked for information about pregnancy and childbirth. However, among women who were pregnant or gave birth in the past three years, seven in ten (71%) report seeking information about pregnancy and childbirth online (data not shown in table). One in three (33%) women ages 18 to 25 sought information about contraception and one in six (18%) sought information about abortion.

Table 2 is titled "Nearly Half of Young Women and Men Sought Information on Mental Health Online, While Almost Half of Women Over Age 36 Looked for Information on Menopause." This table shows certain topics that men and women sought information about online from AI, social media, or internet search engines. Of the topics asked about, the largest share of men and women sought information about mental health.

Slightly smaller shares of reproductive age men sought health information through social media (38% vs. 44%) compared to women, but similar shares looked for information via internet search engines (81% vs. 83%) and AI tools and chatbots (46% vs. 42%). Of the health topics the survey asked about, the largest share of reproductive age men sought information about mental health (42%), including over half (54%) of men ages 18 to 25 and 47% of men ages 26 to 35. Over a quarter (27%) of men looked for information about testosterone levels and 16% searched for information about erectile dysfunction. Not surprisingly, fewer men than women looked for information about pregnancy and childbirth, but nearly one in four (22%) men ages 26 to 35 did. One in ten (10%) reproductive age men sought information about vasectomies and 6% of men looked for information about abortion, although 13% of men ages 18 to 25 looked for information on abortion.

Contraception on Social Media  

Regardless of whether they sought it out, one in three (35%) women of reproductive age have seen or heard something about contraception on social media in the past 12 months, with larger shares of younger women reporting exposure (Figure 1). Social media has become a common place for people to view information about contraception. Of those who have seen or heard something about contraception on social media, 78% report using contraception in the past 12 months with the majority using hormonal methods (62%) (data not shown). A larger share of contraceptive users report seeing information about contraception on social media compared to non-contraceptive users (38% vs. 27%). 

Figure 1 is a stacked horizontal bar chart among women ages 18 to 49 titled "One in Three Reproductive Age Women Say They Heard or Saw Something on Social Media About Birth Control." The green bar shows the share of reproductive age women who have seen or heard anything on social media about contraception (35%), the dark blue bar is the share of reproductive age women who have not seen or heard anything on social media about contraception (46%), and the light blue bar shows the share of reproductive age women who are not sure if they have seen or heard anything on social media about contraception (19%). Larger shares of women ages 18 to 25 (42%) and 26 to 35 (39%) compared to women ages 36 to 49 (28%) have seen or heard something about contraception on social media in the past 12 months, as well as contraceptive users (38%) compared to contraceptive non-users (27%). Smaller shares of Asian (30%), Black (30%), and Hispanic (33%) women have seen or heard anything on social media about contraception compared to White women (38%).

Contraceptive information seen online can lead women to seek more information or make a change to the contraceptive practices. One in ten women who saw contraceptive information on social media said they changed their contraceptive use behavior, such as stopping their hormonal birth control (8%, 3% of all women ages 18 to 49) or starting or changing to a new birth control method (9%, 3% of all women ages 18 to 49), one in five (19%) who saw contraceptive information (7% of all women ages 18 to 49) talked to a doctor or health care provider about what they saw or heard, and a third (36%) sought more information through an online search or AI (12% of all women ages 18 to 49) (Figure 2). Larger shares of young women ages 18 to 25 compared to women ages 36 to 49 stopped using their hormonal birth control (12% vs. 5%), started or changed to a new birth control method (13% vs. 6%), sought more information from a doctor or healthcare provider (26% vs. 15%), or sought more information through an online search or AI (46% vs. 29%). 

Figure 2 is a grouped vertical bar chart titled "One in Ten Younger Women Who Have Seen Something About Contraception On Social Media Have Made a Change to Their Contraceptive Use" and shows women overall ages 18 to 49 in gray, women ages 18 to 25 in green, women ages 26 to 35 in blue, and women ages 36 to 49 in dark blue. Among women who have seen or heard something on social media about contraception, one in three (36%) have sought more information through an online search or AI, one in five (19%) have talked talked to a doctor or health care provider about what they saw or heard, and one in ten (12%) have stopped using hormonal birth control or started or changed to a new birth control method. Higher shares of younger women ages 18 to 25 have done all of these things compared to women ages 36 to 49.

False or Misleading Statements About Contraception 

Many women report seeing content on social media or elsewhere that promotes contraceptive misinformation. The survey asked whether women had seen or heard four widely spread pieces of contraceptive misinformation (Table 3). About half (53%) of women of reproductive age had seen or heard that hormones in contraceptives are harmful to your health and about four in ten (43%) had seen or heard that hormones in contraceptives limit your ability to get pregnant in the future. Women of color report lower exposure to hearing that hormones are harmful, while larger shares of young women had been exposed to this false statement.

Table 3 is titled "False or Misleading Statements About Contraception Are Widespread" and shows the share of women ages 18 to 49 who have heard or read four false or misleading statements about contraception, including: hormones in contraceptives are harmful to your health (53%), hormones in contraceptives limit your ability to get pregnant in the future (43%), natural family planning methods are as effective as hormonal contraceptives at preventing pregnancy (32%), and emergency contraceptive pills, such as Plan B, cause abortions (32%). Higher shares of young women ages 18 to 25 and 26 to 35 compared to women ages 36 to 49 have heard or read that hormones contraceptives are harmful to your health and hormones in contraceptives limit your ability to get pregnant. Lower shares of of Asian women have heard or read all four false and misleading statements and lower shares of Black and Hispanic women have heard or read that hormones in contraceptives are harmful to your health. Women with low incomes were less like to have heard or read that hormones in contraceptive are harmful to your health, but more likely to have heard that emergency contraceptive pills, such as Plan B, cause abortions. There were no differences by party ID.

Natural family planning or fertility awareness-based methods have been promoted on social media to appeal to people who erroneously think hormones are harmful to your health or those who are seeking non-hormonal methods. One in three (32%) reproductive age women say they have seen or heard that natural family methods are as effective as hormonal contraceptives at preventing pregnancy. Natural family planning methods fall under fertility awareness-based methods, which the American College of Obstetricians & Gynecologists say are 77%-98% effective at preventing pregnancy, whereas hormonal contraceptives are 93-99.9% effective.  

One in three (32%) reproductive age women have seen or heard on social media that emergency contraceptive pills, such as Plan B, cause abortions, which is also untrue. Emergency contraceptive pills cannot terminate an existing pregnancy, cannot prevent the implantation of a fertilized egg, and cannot affect a developing embryo.  

Trusted Sources for Health Care Information 

When asked who they trust to provide reliable health information, the majority of reproductive age women say they trust their health care provider a great deal or fair amount (86%) slightly higher than 79% of reproductive age men (Figure 3 and Table 4). While trust in health care providers is consistently highest across different groups, it declines slightly among lower income groups (Table 4). Over half (55%) of all women also say they trust state and local health departments and even higher shares of Asians (63%) and Democrats (64%) trust these sources.  

The survey also finds one quarter (25%) of reproductive age women trust AI tools and chatbots a great deal or a fair amount for reliable health information, which is similar across demographic groups. A higher share of reproductive age Asian women trust AI tools or chatbots. Few women trust social media and social media influencers (15%) for reliable health care information; however, this rises to over one in five (21%) 18- to 25-year-women.

Figure 3 is a stacked horizontal bar chart titled "Reproductive Age Women Trust Health Care Providers the Most to Provide Reliable Health Care Information" with "A great deal" colored dark blue, "A fair amount" colored blue, "A little" colored green, and "Not at all" colored dark green. The majority of women ages 18 to 49 trust their health care provider and state and local health departments a great deal or fair amount to provide reliable health care information. Women trust social media and AI tools or chatbots the least to provide reliable health care information, with majorities of women also having little trust in federal health agencies and Robert F. Kennedy Jr.

About half (48%) of women ages 18 to 49 trust federal health agencies a great deal or fair amount for reliable health care information (Figure 3). This comes after a year of significant layoffs of federal health workers and changes to federal health websites like the Centers for Disease Control and Prevention (CDC) and Health and Human Services (HHS). About a quarter (26%) of reproductive age women say they trust the head of HHS, Robert F. Kennedy Jr. to provide reliable health care information.

Table 4 show the share of reproductive age women who trust each of the following a great deal or fair amount to provide reliable health care information: your health care provider (86%), state and local health departments (55%), federal health agencies (48%), Robert F. Kennedy Jr. (26%), AI tools or chatbots (25%), and social media and social media influencers (15%). Larger shares of women trust their health care providers to provide reliable health care information compared to men (86% vs. 79%). Young women ages 18 to 25 are more likely to trust social media and social media influencers compared to women ages 36 to 49 (21% vs. 12%). Smaller shares of Black and Hispanic women trust their health care provider compared to White women and larger shares of women of color trust AI tools or chatbots and social media and social media influencers compared to White women. Smaller shares of women with low incomes trust their health care providers and state and local health departments compared to women with higher incomes. Republican women were also less likely to trust their health care providers, state and local health departments, and federal health agencies compared to Democratic women and more likely to trust Robert F. Kennedy Jr. and AI tools or chatbots.

Contraception: False or Misleading Statements Compared to What the Experts Say (Table)

The 2026 KFF Women’s Health Survey was designed and analyzed by women’s health researchers at KFF. The survey was conducted from March 11 – April 14, 2026, online and by telephone among a nationally representative sample of 5,854 adults ages 18 to 64, including 3,538 women ages 18 to 49. Women include anyone who selected woman as their gender. Sampling, data collection, weighting, tabulation, and IRB approval by the University of Southern Maine’s Collaborative Institutional Review Board were managed by SSRS of Glenn Mills, Pennsylvania in collaboration with women’s health researchers at KFF.

Throughout the reports of findings, we refer to “women.” This includes respondents who said their gender is “woman,” and includes those who selected “woman” in addition to another gender, such as “transgender,” or “non-binary,” or another gender. We followed this approach to try to include as many people as possible but recognize that some people who need and seek abortion and other reproductive health care services may not be represented in the findings or identify as women. Some questions about sexual and reproductive health were only asked among those with a specific sex assigned at birth (i.e. male or female).

The national sample was drawn from two nationally representative probability-based panels: the SSRS Opinion Panel and the Ipsos Knowledge-Panel. The SSRS Opinion Panel is a nationally representative probability-based panel where panel members are recruited randomly in one of two ways: (a) Through invitations mailed to respondents randomly sampled from an Address-Based Sample (ABS) provided by Marketing Systems Groups (MSG) through the U.S. Postal Service’s Computerized Delivery Sequence (CDS); (b) from a dual-frame random digit dial (RDD) sample provided by MSG. For the online panel component, invitations were sent to panel members by email followed by up to five reminder emails. 5,660 panel members completed the survey online and panel members who do not use the internet were reached by phone (n=194). Another 514 respondents were reached online through the Ipsos Knowledge Panel to help reach adequate sample sizes among subgroups of interest, specifically women ages 18 to 49. This panel is recruited using ABS, based on a stratified sample from the CDS. The questionnaire was translated into Spanish, so respondents were able to complete the survey in English or Spanish. 

The national sample was weighted by splitting the sample into three groups: [1] Women 18-49, [2] Women 50-64, and [3] Men 18-64 and each group was separately weighted to match known population parameters (see table below for weighting variables and sources). Weights within the three groups were then trimmed at the 4th and 96th percentiles, to ensure that individual respondents do not have too much influence on survey-derived estimates. After the weights were trimmed, the samples were combined, and the weights adjusted, so that the groups were represented in their proper proportions for a final combined, gender by age-adjusted weight.

DimensionsSource
AgeCurrent Population Survey 2025
Education
Age by Education
Age by Gender
Census Region
Race/Ethnicity by Nativity
Home Tenure
Civic Engagement2023 CPS Volunteering and Civic Life Supplement
Internet FrequencyPew Research Center’s National Public Opinion Reference Survey (NPORS 2025)
Population DensityClaritas Pop-Facts Premier 2026
Voter RegistrationCPS 2024 Voting and Registration Supplement

The margins of sampling error for the national sample of women ages 18 to 64 and reproductive age women ages 18 to 49 are plus or minus 2 percentage points. Numbers of respondents and margins of sampling error for key subgroups are shown in the table below. For results based on other subgroups, the margin of sampling error may be higher. Sampling error is only one of many potential sources of error and there may be other unmeasured error in this survey.

GroupN (unweighted)M.O.S.E.
National Women Ages 18-493,538± 2 percentage points
White, non-Hispanic1,536± 3 percentage points
Black, non-Hispanic620± 5 percentage points
Hispanic944± 4 percentage points
Asian or Pacific Islander304± 6 percentage points
<200% FPL1,300± 3 percentage points
200%+ FPL1,949± 3 percentage points
Private2,117± 3 percentage points
Medicaid785± 4 percentage points
Uninsured456± 6 percentage points
Democrat/Democrat leaning1,752± 3 percentage points
Independent496± 5 percentage points
Republican/Republican leaning896± 4 percentage points

Global COVID-19 Tracker

Published: Sep 15, 2026

Editorial Note: The Policy Actions tracker will no longer be updated as the data source has ceased tracking government responses to COVID-19. For more information, please visit the Oxford Covid-19 Government Response Tracker.

This tracker provides the cumulative number of confirmed COVID-19 cases and deaths, as well as the rate of daily COVID-19 cases and deaths by country, income, region, and globally. It will be updated weekly, as new data are released. As of March 7, 2023, all data on COVID-19 cases and deaths are drawn from the World Health Organization’s (WHO) Coronavirus (COVID-19) Dashboard. Prior to March 7, 2023, this tracker relied on data provided by the Johns Hopkins University (JHU) Coronavirus Resource Center’s COVID-19 Map, which ended on March 10, 2023. Please see the Methods tab for more detailed information on data sources and notes. To prevent slow load times, the tracker only contains data from the last 200 days. However, the full data set can be downloaded from our GitHub page. While the tracker provides the most recent data available, there is a two-week lag in the data reporting.

Note: The data in this tool were corrected on March 18, 2024, to clarify that they represent new cases and deaths over a full week rather than the average per day over a seven-day period.

This tracker contains information on policy measures currently in place to address the COVID-19 pandemic. Policy categories currently being tracked include social distancing & closure measures, economic measures, and health systems measures. Policies are tracked at the country-, income-, and region-level. Please see the Methods tab for more detailed information on data sources and notes.

Social Distancing and Closure Measures

As countries continue to implement policies to prevent the transmission of SARS-CoV-2, the virus that causes COVID-19, these tables and charts show which social distancing and closure measures are currently in place by country.

Global COVID-19 Policy Actions

Economic Measures

The COVID-19 pandemic has placed an unprecedented strain on country economies. These tables and charts show which economic-related measures, namely income support and debt relief, are currently in place by country.

Global COVID-19 Policy Actions

Health Systems Measures

The COVID-19 pandemic continues to strain and disrupt global health systems. These tables and charts show which health systems measures are currently in place by country.

Global COVID-19 Policy Actions

Cases and Deaths

SOURCES

As of March 7, 2023, all data on COVID-19 cases and deaths are drawn from the World Health Organization’s (WHO) Coronavirus (COVID-19) Dashboard. Prior to March 7, 2023, this tracker relied on data provided by the Johns Hopkins University (JHU) Coronavirus Resource Center’s COVID-19 Map, which ends on March 10, 2023. Population data are obtained from the United Nations World Population Prospects using 2021 total population estimates. Income-level classifications are obtained from the latest World Bank Country and Lending Groups. Regional classifications are obtained from the World Health Organization.
Policy Actions

NOTES

Policy actions data include the measure that was in place for each indicator at the country-level as of the end of 2022. Policy actions data will no longer be updated as the data source has ceased tracking government responses to COVID-19. For more information, please visit the Oxford Covid-19 Government Response Tracker.

Social Distancing and Closure Measures

Under 'Stay At Home Requirements', exceptions for leaving the house may include anything from being able to leave for daily exercise, grocery shopping, and essential trips, to only being allowed to leave once a week, or one person may leave at a time, etc. Under 'Workplace Closing', partial closing includes instances in which a country recommends closing the workplace (or working from home); businesses are open but with significant COVID-19-related operational adjustments; or when workplaces require closing for only some, but not all, sectors or categories of workers. Under 'School Closing', partial closing includes instances in which a country has recommended school closures; all schools are open but with significant COVID-19-related operational adjustments; or some schools, but not all, are closed; full closing includes schools that are in session but operating virtually. Under 'Restrictions On Gatherings', partial restrictions include restrictions on gatherings of more than 10 people; full restrictions include restrictions on gatherings of 10 people or less. Under 'International Travel Controls', partial restrictions include screening and quarantine requirements for those entering the country. Values for ‘Cancel Public Events’ were not recodified.

Economic Measures

Under 'Income Support', narrow support includes instances in which a country's government is replacing less than 50% of lost salary (or if a flat sum, it is less than 50% median salary); broad support includes instances in which a country's government is replacing 50% or more of lost salary (or if a flat sum, it is greater than 50% median salary). Under 'Debt/Contract Relief', narrow support includes instances in which a country's government is providing narrow relief, such as relief specific to one kind of contract.

Health Systems Measures

Under 'Vaccine Eligibility', partial availability includes availability for some or all of the following groups: key workers, non-elderly clinically vulnerable groups, and elderly groups, or for select broad groups/ages. Under 'Facial Coverings', recommend/partial requirement includes instances in which a country's government recommends wearing facial coverings, requires facial coverings in some situations, and requires facial coverings when social distancing is not possible. 

SOURCES

Data on and descriptions of government measures related to COVID-19 provided by the Oxford Covid-19 Government Response Tracker (OxCGRT). For more detailed information on their data collection and methodology, please see their codebook and interpretation guide.

KFF Tracker: America First MOU Bilateral Global Health Agreements

Published: Sep 15, 2026

Editorial Note: Originally published on January 13, 2026, this resource will be updated as needed, most recently on September 15, 2026, to reflect additional developments.

On September 18, 2025, the U.S. government (USG) released its new America First Global Health Strategy, which details how the U.S. will engage in global health efforts moving forward. As part of this new strategy, the U.S. has announced that it will be establishing bilateral health cooperation agreements with countries that receive U.S. global health assistance. These agreements, or Memorandums of Understanding (MOUs), between the U.S. and partner countries represent five-year plans (for the period 2026-2030) outlining U.S. engagement in each country’s health efforts with the goal of “helping countries move toward more resilient and durable health systems.” Central to these plans is transitioning country programs from U.S. assistance to long-term country ownership, with a pledge from each partner country to increase its domestic health spending, or co-investment in health, over the next five years as the U.S. decreases its health assistance. The U.S. began signing these agreements in late 2025 and this process is ongoing. Implementation is slated for later this year.

This tracker provides an overview of the MOUs signed to date. Data are based on press releases issued by the State Department, U.S. embassies, and partner country Ministries of Health, as well as MOU documents (if publicly available). See Methods for more information. This tracker will be updated as agreements are signed and more data become available.

USG Global Health MOUs by Country (Table)
Signed USG Global Health MOUs by Country (Choropleth map)
Global Health MOU Funding by Country (Bar Chart)
USG Global Health MOU Co-Financing Share by Country (Stacked Bars)
USG Global Health MOU Program Areas by Country (Table)
Historical vs. Proposed 5-Year USG Global Health MOU Funding by Country (Grouped Bars)

Methods

This tracker provides information on U.S. MOU bilateral global health agreements to date. Information is sourced from publicly available U.S. Department of State, U.S. embassies, and partner country Ministries of Health press release statements and MOU texts, and will be updated as more information becomes available and when additional agreements are signed. Currently, MOU text, which contains the most detailed information of these sources, is publicly available for only a limited number of countries; for these countries, data were sourced directly from these MOU documents. For countries with available MOU documents, overall totals are based on the sum of annual amounts presented in the text. 

Program areas are captured using keyword searches; for global health security (GHS) specifically, country agreements were categorized as targeting GHS if they specifically mentioned GHS, or if they included descriptions of outbreak preparedness and response activities and containing health threats. Due to the limited nature of press release statements, this tracker may not comprehensively capture the global health program areas targeted in each country’s agreement.

News Release

Survey: Adults With Multiple or Complex Health Conditions Face Significant Challenges with Health Costs and Commonly Struggle to Access Care 

Uninsured Adults With Multiple Conditions Struggle the Most to Afford and Access Care

Published: Sep 15, 2026

Adults with multiple or complex health conditions, who already face unique physical and mental challenges, commonly struggle to pay their medical bills and access needed care and medication—challenges that fall hardest on uninsured adults, according to a new KFF survey of more than 25 thousand adults. A companion Beyond the Data column by KFF Founding President and CEO Dr. Drew Altman explores the survey’s findings about uninsured adults with greater health needs and considers why the national discussion of the affordability crisis has largely ignored this group.

“If the first obligation of a health care system is to take care of the sick, we are failing that test. Cost and access problems are hitting the chronically ill hard, and the chronically ill and uninsured especially hard,” said Dr. Drew Altman.

The survey’s large sample size allowed KFF analysts to examine the experiences of adults with certain serious health conditions—including cancer, lung disease, diabetes, cardiovascular disease, or a mental health condition—as well as those managing care for multiple health problems.

About a third of adults ages 18-64 with multiple or certain complex health conditions say they struggled to pay or could not pay their medical bills in the past year. Adults with three or more conditions (36%), those with cardiovascular disease (37%), and those with a mental health condition (36%) are particularly likely to report struggling with medical bills. As part of these affordability challenges, about a quarter of adults with three or more conditions say they have had to cut back on household expenses to cover medical costs, compared to just about 1 in 10 of those without active health conditions.

High health costs can create major barriers to care, sometimes determining who is able to access the treatments and medications they need. About half of adults with three or more health conditions say they skipped or delayed care in the past year, including about 1 in 3 who did so due to cost. About 1 in 5 or more adults with multiple or complex health conditions also report not taking their medications as prescribed because they could not afford the cost.

Skipping or delaying care can have serious consequences. Substantial shares of adults across health conditions say their health got worse because they skipped or delayed care, including about 3 in 10 of those with a mental health condition (32%) or lung disease (29%), one quarter of those with cardiovascular disease (24%), and about 1 in 5 of those with cancer (18%) or diabetes (21%).

In addition to challenges with costs, insured adults with greater health needs commonly encounter insurance coverage delays or denials—problems that occur across specific health conditions. About half of insured adults ages 18-64 with three or more conditions say their insurer denied or delayed coverage for a service, treatment, or medication their doctor prescribed, as do about 4 in 10 or more insured adults with certain complex conditions, including diabetes (38%), lung disease (43%), cancer (43%), cardiovascular disease (45%), or a mental health condition (47%).

Uninsured Adults Struggle the Most to Afford and Access Care
As Drew Altman writes in his new column, health care affordability is most challenging for uninsured adults with multiple health conditions—most of whom say they struggle with medical bills (72%) and half of whom say they cut back on household spending to cover their health costs. Uninsured adults with three or more health conditions are twenty percentage points more likely than their insured counterparts to say they skipped or delayed needed care in the past year (71% vs. 51%). They are also about twice as likely as those who are insured to say they did not take their medication as prescribed due to cost (51% vs. 24%).

For uninsured adults, going without needed care and medications may carry even greater risks that worsen existing barriers to care. Untreated health conditions can worsen over time and become more difficult and costly to treat. Among uninsured adults, about 4 in 10 with multiple conditions (43%) and about half with a mental health condition (47%) say their health got worse after skipping or delaying care—making them about one and a half times as likely as their insured counterparts to experience a decline in health.

Other findings about older adults (aged 65+) with multiple and complex health conditions are available in the full report.

Dr. Altman will discuss KFF’s findings about chronic health conditions and the broader health policy landscape in his keynote address at the National Academy of Medicine’s Annual Meeting in October.

Designed and analyzed by KFF public opinion researchers, KFF’s Survey of Health Access and Caregiving was conducted in English and in Spanish May 4 – 26, 2026, online and by telephone among a large, nationally representative sample of 25,873 adults, including 16,677 who say they have received treatment for at least one serious or complex health condition in the past year. The margin of sampling error is plus or minus one percentage point for the full sample. For results based on other subgroups, the margin of sampling error may be higher.