Key Facts About Medicare Drug Price Negotiation

Published: Mar 11, 2026

Editorial Note: This brief was updated in March 2026 to reflect the results of the second round of Medicare drug price negotiation and details about the third cycle of the negotiation program, including the list of drugs selected for negotiation in early 2026.

Under the Medicare Drug Price Negotiation Program, the Secretary of Health and Human Services (HHS) is required to negotiate prices with drug companies for certain high-cost drugs covered under Medicare. This requirement, a provision of the Inflation Reduction Act of 2022 (IRA), was the culmination of years of debate among lawmakers over whether to grant the federal government the authority to negotiate drug prices in Medicare.

Medicare’s drug price negotiation program is now in its third cycle, with CMS having concluded two rounds of drug price negotiation to date. Negotiated prices for the first set of 10 Medicare Part D drugs selected for negotiation went into effect on January 1, 2026, while negotiated prices for the second set of 15 Part D selected drugs (including the popular GLP-1 diabetes and obesity drugs Ozempic and Wegovy) will take effect in 2027. In January 2026, CMS announced an additional 15 Part D and Part B drugs selected for negotiation, with negotiated prices effective in 2028. Total Medicare spending on the 40 drug products that have been selected for negotiation to date accounted for more than one-third (36%) of total Medicare spending on all drugs covered under Part B and Part D in 2024, or $125 billion out of $350 billion (not accounting for rebates in Part D and excluding spending on Part B drugs under Medicare Advantage since data are unavailable). The Centers for Medicare & Medicaid Services (CMS) has estimated several billion dollars in net savings to Medicare for round one and round two Part D drugs based on Medicare’s negotiated prices relative to existing net prices paid by Part D plans.

This brief provides information about several key aspects of the Medicare drug price negotiation program, with a focus on the 2028 implementation year, drawing on guidance from the Centers for Medicare & Medicaid Services (CMS). This is the first year CMS is required to negotiate physician-administered drugs covered under Medicare Part B. It is also the first year that a change to the IRA’s orphan drug exclusion is in effect, based on a provision in the 2025 reconciliation law that broadened this exclusion and exempted more drugs from negotiation.

Table of Contents

In 2026, CMS selected 15 Medicare Part B and D drugs for price negotiation, with negotiated prices taking effect in 2028

Copy link to In 2026, CMS selected 15 Medicare Part B and D drugs for price negotiation, with negotiated prices taking effect in 2028

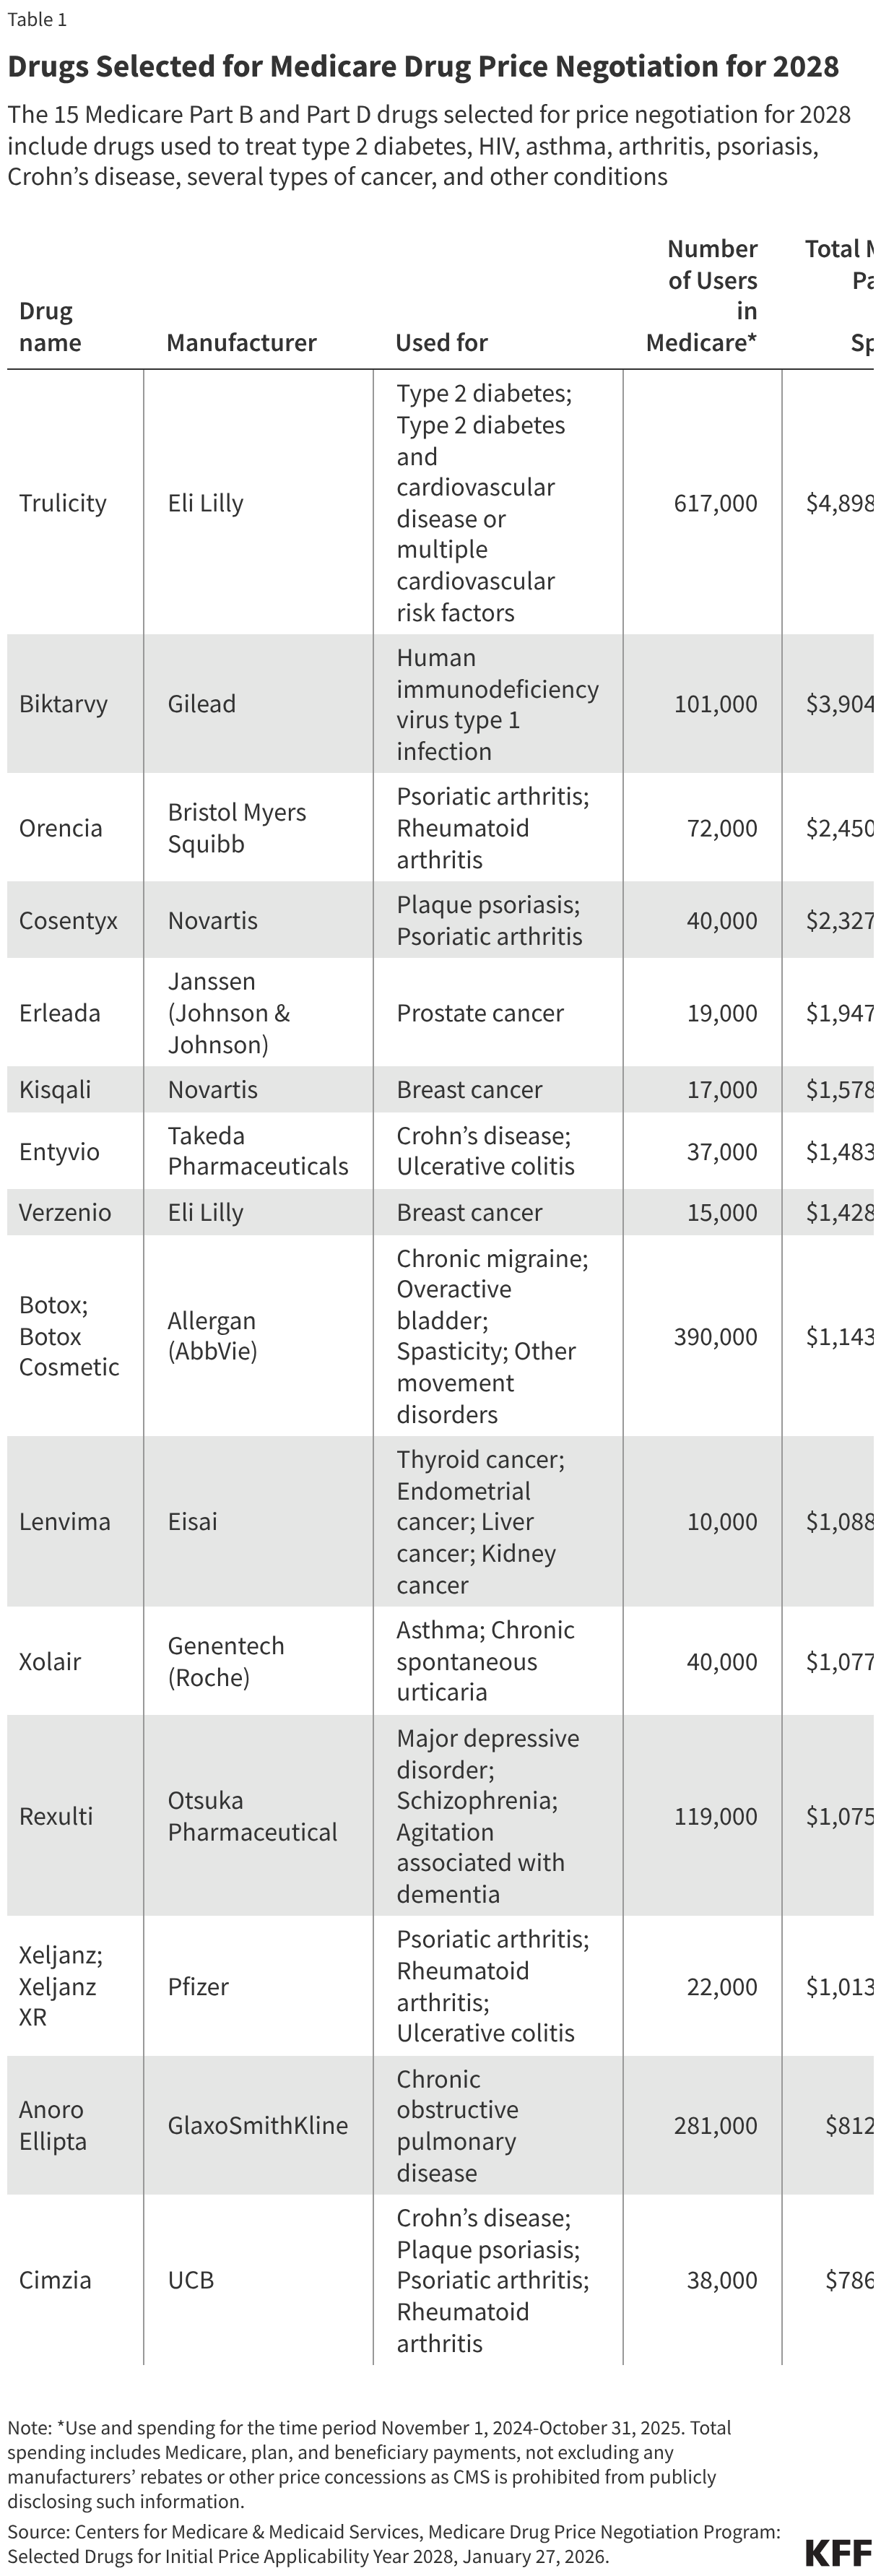
Fifteen drugs covered under Medicare Part B, which covers physician-administered drugs, or Medicare Part D, Medicare’s outpatient prescription drug benefit program, were selected for price negotiation in 2026, with Medicare’s negotiated prices for these drugs taking effect on January 1, 2028 (Table 1). These 15 drugs include treatments for type 2 diabetes, HIV, asthma, arthritis, psoriasis, Crohn’s disease, several types of cancer, and other conditions (See Table 1). Total gross Medicare spending on these 15 drugs between November 2024 and October 2025 was $27 billion, with 1.8 million Medicare beneficiaries using these medications during that time. Starting in 2027 and in each subsequent year, up to 20 additional drugs covered under Part B or Part D will be selected for negotiation. The number of drugs with negotiated prices available will accumulate over time.

Drugs Selected for Medicare Drug Price Negotiation for 2028 (Table)

CMS has concluded two rounds of drug price negotiation to date, with estimated savings of several billion dollars based on Medicare’s negotiated prices relative to existing net prices

Copy link to CMS has concluded two rounds of drug price negotiation to date, with estimated savings of several billion dollars based on Medicare’s negotiated prices relative to existing net prices

Based on the negotiated prices for first 10 Part D drugs selected for negotiation, CMS estimated that Medicare would have saved $6 billion if the prices that CMS negotiated had been in effect in 2023, amounting to net savings of 22% on these drugs. CMS also estimated that Medicare beneficiaries will save $1.5 billion when these negotiated prices take effect in 2026. Based on negotiated prices for the next 15 Part D drugs selected for negotiation, CMS estimated even greater savings of $12 billion relative to existing net prices in 2024, amounting to net savings of 44% on these medications – higher due in part to the larger number of drugs subject to negotiation. CMS has also estimated that Medicare beneficiaries will save $685 million when these negotiated prices take effect in 2027.

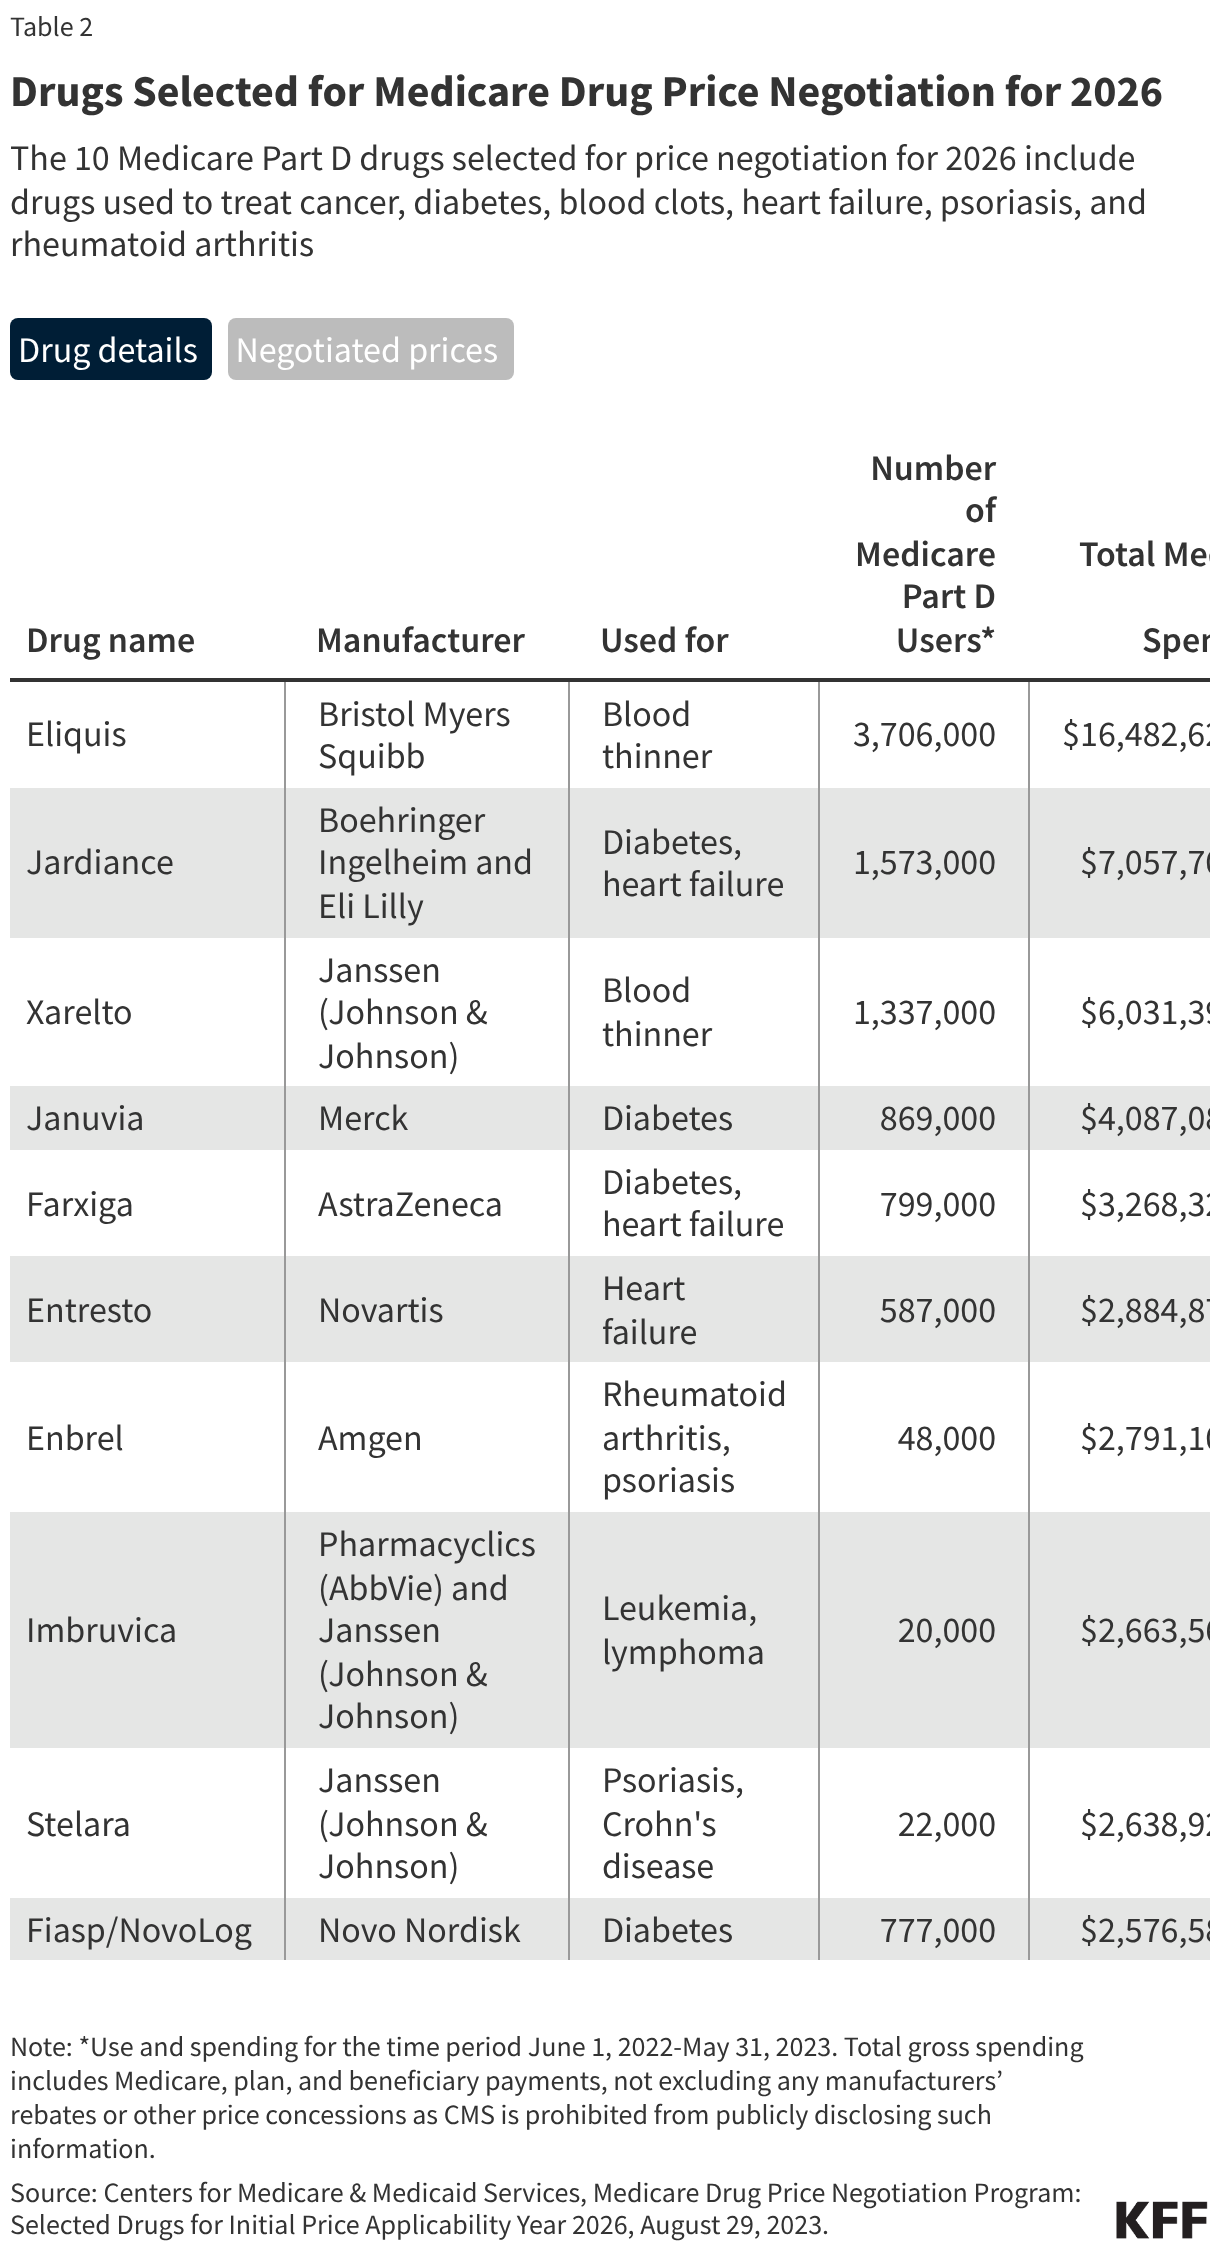
Selected Drugs for Implementation Year 2026: The first 10 Medicare Part D drugs that were selected for negotiation include treatments for several medical conditions, including diabetes (Farxiga, Fiasp/NovoLog, Januvia, Jardiance), blood clots (Eliquis, Xarelto), heart failure (Entresto, Farxiga), psoriasis (Stelara, Enbrel), rheumatoid arthritis (Enbrel), Crohn’s disease (Stelara), and blood cancers (Imbruvica) (Table 2). Medicare’s negotiated prices took effect on January 1, 2026. CMS published explanations of its negotiated prices and the factors that were considered in the negotiation process, including manufacturer-specific financial data about the selected drugs and evidence about the clinical benefits of selected drugs compared to alternative treatments.

Drugs Selected for Medicare Drug Price Negotiation for 2026 (Table)

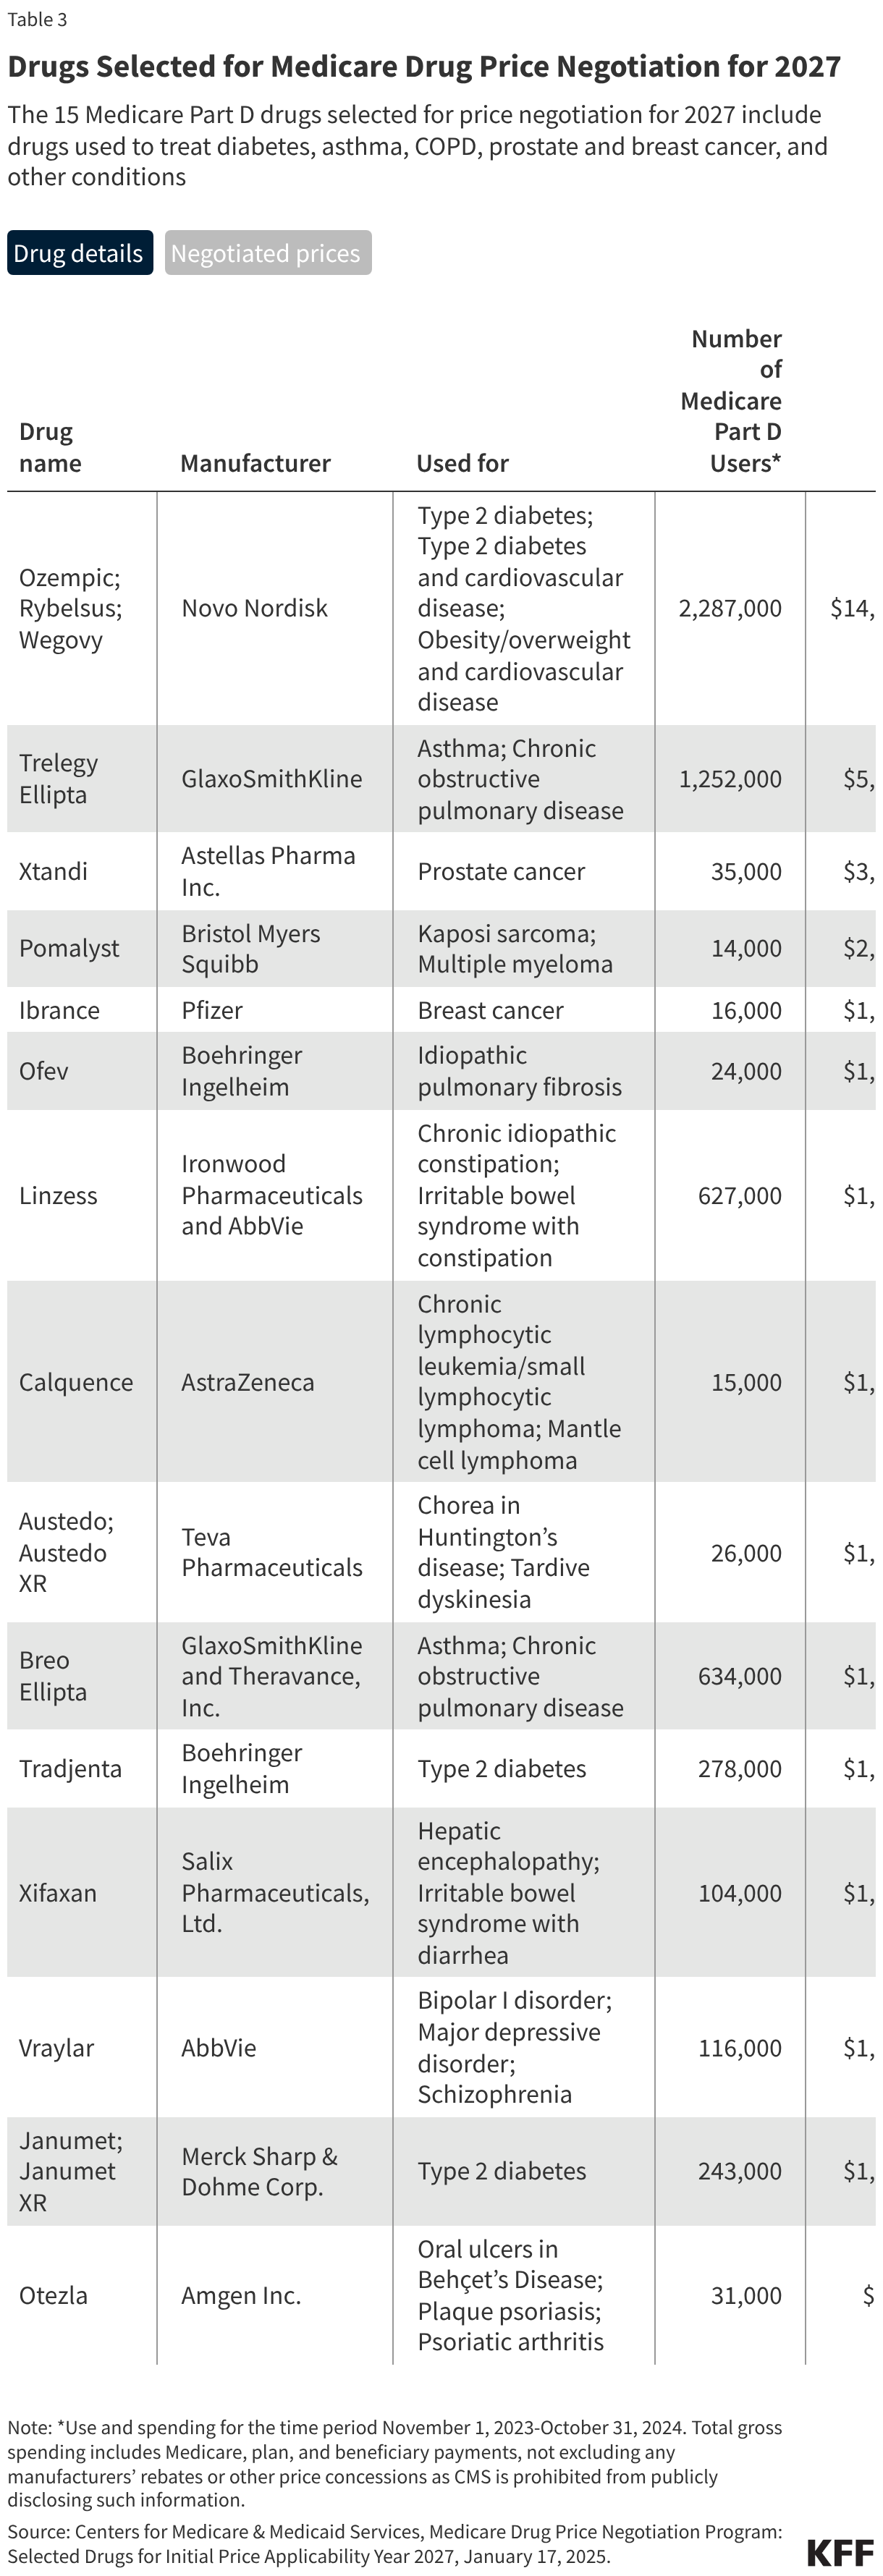
Selected Drugs for Implementation Year 2027: The 15 Medicare Part D drugs selected for price negotiation in round two included the popular GLP-1 diabetes and obesity drugs Ozempic and Wegovy, along with other drugs used to treat asthma and chronic obstructive pulmonary disease, type 2 diabetes, prostate and breast cancer, and other conditions (Table 3). Negotiated prices for these drugs will take effect on January 1, 2027.

Drugs Selected for Medicare Drug Price Negotiation for 2027 (Table)

Drugs qualify for price negotiations if they have high total Medicare spending, no generic or biosimilar equivalents, and are several years past FDA approval

Copy link to Drugs qualify for price negotiations if they have high total Medicare spending, no generic or biosimilar equivalents, and are several years past FDA approval

Drugs qualify for price negotiation if they are single source brand-name drugs or biological products without therapeutically-equivalent generic or biosimilar alternatives that are approved or licensed and marketed on a “bona fide” basis – a determination to be made by CMS using FDA reference sources to determine whether a generic or biosimilar has been approved, along with claims and pricing data to assess utilization and sales of generics or biosimilars and other public information related to product launch and distribution. In addition, a drug product must be at least 7 years (for small-molecule drugs) or 11 years (for biologics) past its FDA approval or licensure date, as of the date that the list of drugs selected for negotiation is published, giving manufacturers several years to market their products before being eligible for negotiation. This means that for a single source drug to be eligible for negotiation for 2028, a drug product must have been approved on or before February 1, 2019, and a biological product must have been licensed on or before February 1, 2015. For drugs with multiple FDA approvals, CMS uses the earliest approval date to determine the number of years that have elapsed.

The definition of ‘qualifying single source drug’ excludes certain types of drugs:

  • Orphan-drugs – drugs that are designated for rare diseases or conditions and approved only for those diseases or conditions (known as the orphan drug exclusion, which was modified by the 2025 reconciliation law, as described below),
  • Low-spending drugs – drugs with combined total spending under Part B and Part D of less than an inflation-adjusted threshold amount (originally set at $200 million, inflation adjusted by the growth in the consumer price index for all urban consumers (CPI-U) to $207 million for negotiation year 2027),
  • Plasma-derived products, and
  • For 2026 to 2028, “small biotech” drugs (i.e., drugs that account for 1% or less of total Medicare drug spending on all qualifying single source drugs under either Part B or Part D but 80% or more of Part B or Part D spending for a given manufacturer’s Part B or Part D covered qualifying single source drugs).

Policy for Fixed Combination Drugs: To identify potential qualifying single source drugs, the IRA requires aggregating data across dosage forms (such as tablets and capsules) and strengths of a given drug product. However, the law does not address how to handle fixed combination drugs (that is, a drug that includes two or more active ingredients). According to CMS guidance for 2028, data for a fixed combination drug will not be aggregated with data for a drug that includes only one of those active ingredients. Instead, CMS will treat these as distinct drug products for the purposes of identifying potential qualifying single source drugs. CMS has acknowledged the possibility that manufacturers might try to avoid or delay having a drug selected for negotiation by modifying the formulation to add an active ingredient, a “program integrity risk” that CMS stated it plans to address in future rulemaking around the negotiation program for 2029.

The 2025 reconciliation law changed the orphan drug exclusion to delay or make more drugs ineligible for negotiation

Copy link to The 2025 reconciliation law changed the orphan drug exclusion to delay or make more drugs ineligible for negotiation

The IRA excluded orphan drugs from Medicare drug price negotiation if they were designated for only one rare disease or condition with approvals under that one designation. The 2025 reconciliation law broadened the orphan drug exclusion in two ways: 1) making orphan drugs that are designated for multiple rare diseases or conditions, not just a single rare disease, ineligible for Medicare drug price negotiation; and 2) delaying the start of the 7- or 11-year period before a drug can be selected for price negotiation for orphan drugs that subsequently receive FDA approval for a non-orphan indication.

These changes likely had an impact on which drugs were selected for Medicare price negotiation for 2028 by delaying the selection of the biologic drugs Keytruda and Opdivo, which were likely to have been selected for negotiation in 2026 based on their total Medicare spending levels and meeting other statutory criteria. In 2023, Medicare and beneficiaries spent $5.6 billion on Keytruda and $2.0 billion on Opdivo. Both drugs were initially approved as orphan drugs in 2014 and subsequently approved for non-orphan indications beginning in 2015. However, due to the change in law, the time that they were on the market as orphan-only drugs no longer counts towards the 11-year period following FDA licensure that biologics become eligible for the negotiation program. Therefore, selection of Keytruda and Opdivo for Medicare drug price negotiation has been delayed beyond 2026. Overall, the provision in the reconciliation law that delays or excludes additional orphan drugs from Medicare drug price negotiation will cost the federal government $8.8 billion over the coming decade, according to CBO, and will also mean higher out-of-pocket costs for Medicare beneficiaries who use these medications.

Drugs selected for negotiation are chosen from the top-ranking qualifying negotiation eligible drugs based on total Medicare Part B and Part D spending

Copy link to Drugs selected for negotiation are chosen from the top-ranking qualifying negotiation eligible drugs based on total Medicare Part B and Part D spending

The 15 Part B and Part D drugs that were selected for price negotiation for 2028 were chosen from the top 50 negotiation-eligible Part D drugs with the highest total Medicare Part D expenditures and the top 50 negotiation-eligible Part B drugs with the highest total Medicare Part B expenditures. For this purpose, total Part D expenditures are defined as total gross covered prescription drug costs from Part D prescription drug event (PDE) data, and total Part B expenditures are for separately payable Part B covered drugs (that is, not bundled or packaged into the payment for another service, such as anesthesia drugs, or most drugs used in treatment of end-stage renal disease) and include traditional Medicare claims data and Medicare Advantage encounter data. (Since encounter data do not include spending amounts, CMS estimates spending on Part B drugs in Medicare Advantage based on what would have been paid in traditional Medicare.)

To derive these lists, CMS first identified the qualifying single source drugs among all covered Part B and Part D drugs, applying the relevant statutory exclusions (as described above). CMS then calculated total expenditures for each qualifying drug separately under Part B and Part D, based on spending data for the 12-month period from November 1, 2024 to October 31, 2025. The top 50 Part B drugs and the top 50 Part D drugs with the highest total expenditures for this 12-month period were the negotiation-eligible drugs for 2028. CMS combined total expenditures under Part B and Part D for each negotiation-eligible drug (where applicable), ranked negotiation-eligible drugs by total spending, and selected the 15 highest-ranked drugs. (Drugs already selected for negotiation in previous rounds are removed from the list of qualifying single source drugs prior to ranking.)

The IRA provides for a delay in selecting drugs for negotiation if they are biological products where there is a “high likelihood” of biosimilar market entry within two years of the publication date of the selected drug list. The rationale for this delay is to not create financial incentives that could deter biosimilars from entering the market if, for example, a reference product (the original biological product approved by FDA against which a proposed biosimilar product is compared) is selected for negotiation and ultimately priced lower than potential competitor biosimilar products. CMS announced that for 2028, when selecting the 15 highest-ranked Part B and Part D drugs, no products qualified for delayed selection based on a high likelihood of biosimilar market entry.

Drugs that were previously selected for negotiation can be selected for renegotiation under certain circumstances

Copy link to Drugs that were previously selected for negotiation can be selected for renegotiation under certain circumstances

In addition to the 15 drugs selected for negotiation for 2028, CMS announced that one drug (Tradjenta) has been selected for renegotiation. This drug was initially included on the list of drugs selected for price negotiation in January 2025 (see Table 3 below). CMS identifies renegotiation-eligible drugs from the list of drugs previously selected for negotiation based on: (1) a change in status to “long-monopoly” (that is, at least 16 years have passed since the date of FDA approval or licensure, which would affect the ceiling price that applied during the negotiation process; such drugs are automatically selected for renegotiation); (2) the availability of new indications; or (3) a material change in the factors that CMS uses in negotiating drug prices that could meaningfully affect the outcome of renegotiation relative to the original negotiation process. In determining whether a renegotiation-eligible drug will be selected for renegotiation, CMS will evaluate whether a new indication or a material change in negotiation factors will result in a 15% or greater change in the negotiated price (higher or lower) and whether that would have a significant impact on the Medicare program.

The annual timeline for Medicare drug price negotiation begins with the announcement of selected drugs by February 1 and ends with the announcement of negotiated prices by November 30

Copy link to The annual timeline for Medicare drug price negotiation begins with the announcement of selected drugs by February 1 and ends with the announcement of negotiated prices by November 30

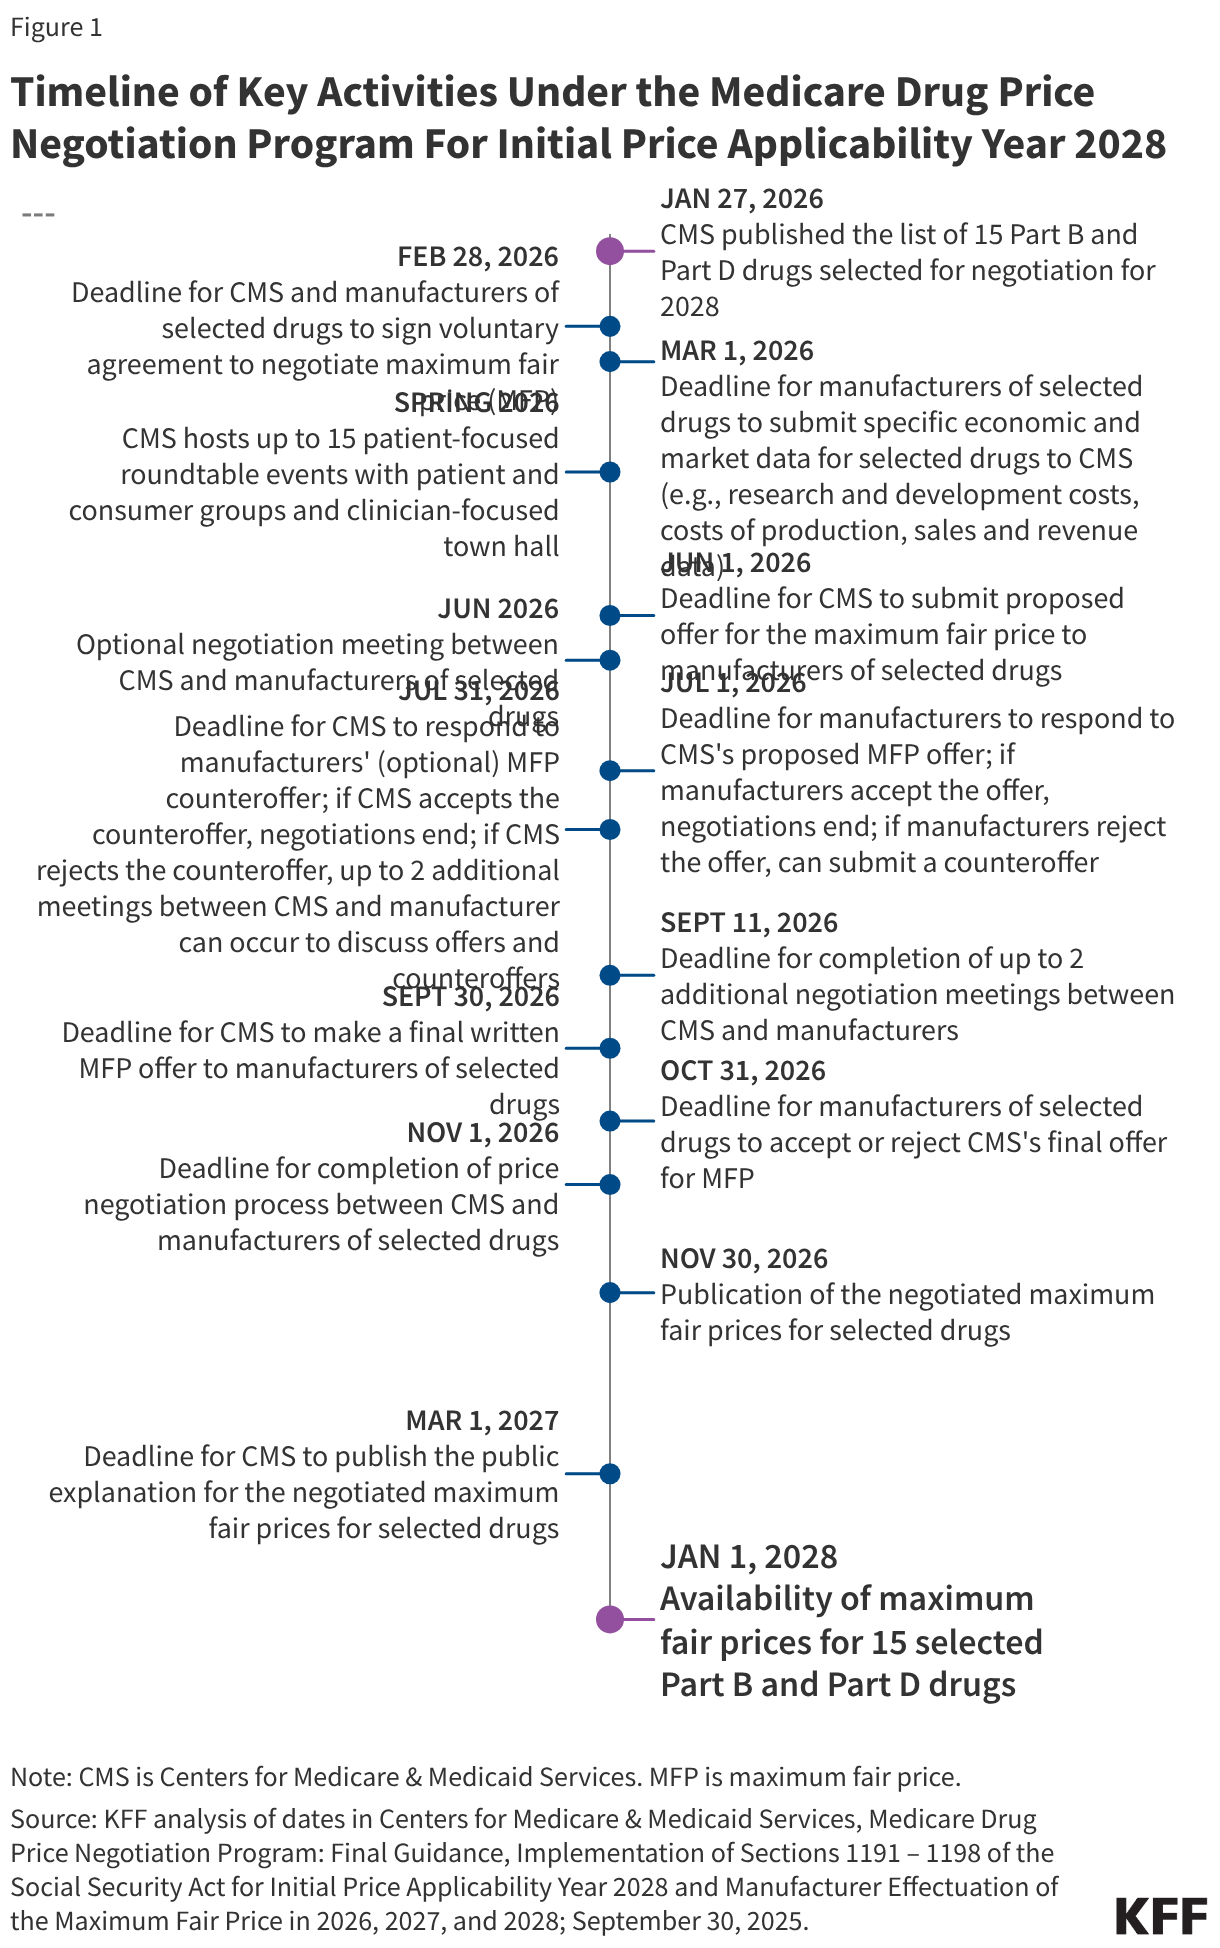
The annual timeline of key activities in the negotiation process begins no later than February 1 of a given year when the list of selected drugs is announced and ends no later than November 30, the statutory deadline for CMS to announce negotiated prices for selected drugs (Figure 1). The price negotiation process between CMS and drug manufacturers spans several months between spring and fall.

Timeline of Key Activities Under the Medicare Drug Price Negotiation Program For Initial Price Applicability Year 2028 (Scatter Plot)

CMS is required to consider certain manufacturer-specific factors and information about therapeutic alternatives in its price negotiations

Copy link to CMS is required to consider certain manufacturer-specific factors and information about therapeutic alternatives in its price negotiations

The IRA requires CMS to consider certain manufacturer-specific factors and information about therapeutic alternatives to selected drugs in negotiating the “maximum fair price” (MFP) for selected drugs, although the law does not specify how CMS should weigh these different elements in the process of developing its offer for the maximum fair price.

The manufacturer-specific factors related to selected drugs include:

  • The manufacturer’s research and development costs and the extent to which the manufacturer has recouped these costs.
  • The current unit costs of production and distribution.
  • Federal financial support for novel therapeutic discovery and development related to the drug.
  • Data on pending and approved patent applications, exclusivities, and certain other applications and approvals.
  • Market data and revenue and sales volume data in the U.S.

For the manufacturers of the 15 selected drugs for 2028, these data elements are required to be reported to CMS by March 1, 2026.

Information about therapeutic alternatives includes:

  • The extent to which the selected drug represents a therapeutic advance compared to existing therapeutic alternatives and the costs of these alternatives.
  • Prescribing information for the selected drug and its therapeutic alternatives, which may include generics or biosimilars.
  • Comparative effectiveness of the selected drug and its therapeutic alternatives, taking into account their effects on specific populations, such as individuals with disabilities, the elderly, the terminally ill, children, and other patient populations.
  • The extent to which the selected drug and its therapeutic alternatives address unmet needs for a condition that is not adequately addressed by available therapy.

According to CMS guidance, information on these factors may be submitted by several entities, including the manufacturer of the selected drug, other drug manufacturers, people with Medicare, academic experts, clinicians, and others. Submissions are due by March 1, 2026 for the selected drugs for 2028. In addition to evaluating the information in these submissions, CMS will review the literature and real-world evidence, conduct internal analysis, and consult with experts regarding evidence of the clinical benefits of the selected drugs and their therapeutic alternatives.

The IRA explicitly directs that the HHS Secretary “shall not use evidence from comparative clinical effectiveness research in a manner that treats extending the life of an elderly, disabled, or terminally ill individual as of lower value than extending the life of an individual who is younger, non-disabled, or not terminally ill.” In other words, the use of health outcomes evidence based on quality-adjusted life years (QALYs) in the process of negotiating a maximum fair price is not permitted.

CMS determines its initial offer for the negotiated price of a selected drug based in part on the price of therapeutic alternatives, information about clinical benefits, and manufacturer-specific data

Copy link to CMS determines its initial offer for the negotiated price of a selected drug based in part on the price of therapeutic alternatives, information about clinical benefits, and manufacturer-specific data

To determine its initial offer for a maximum fair price for a selected drug, CMS: (1) identifies therapeutic alternative(s) for the selected drug; (2) determines pricing information about the therapeutic alternatives to determine the starting point for the initial offer; (3) adjusts the initial offer based on information about the clinical benefit of the selected drug compared to its therapeutic alternatives; and (4) makes further adjustments to the offer price as needed based on manufacturer-specific data to determine the initial offer price. (The IRA does not include international drug price data as a benchmark to be used in CMS’s initial pricing decisions or the negotiation process overall.)

CMS uses the price of therapeutic alternative(s) as the starting point for determining the initial offer for the maximum fair price for a given selected drug. Specifically, for the 2028 negotiation year, CMS will use the lower of: for Part D drugs, the net Part D plan payment and beneficiary liability, which excludes both rebates as well as Manufacturer Discount Program payments, the wholesale acquisition cost (WAC), or the maximum fair price negotiated for previously selected drugs if any are therapeutic alternatives for 2028 selected drugs; and for Part B drugs, the average sales price (ASP) or WAC. If there is more than one therapeutic alternative for a selected drug, CMS will determine the starting point within the range of prices for those products.

For selected drugs with no therapeutic alternative or where the price of the alternative(s) is above the ceiling price, CMS will use the Federal Supply Schedule (FSS) or “Big Four Agency” price as the starting point, whichever is lower. (Drug prices listed on the FSS, which establishes prices available to all direct federal purchasers, are determined through both statutory rules and negotiation. A statutory cap on drug prices for the Big Four agencies (the Department of Veterans Affairs, the Department of Defense, the Public Health Service, and the Coast Guard) means the prices they pay are generally lower than prices paid by other direct federal purchasers.) If the FSS or Big Four prices are above the statutory ceiling, CMS will use the statutory ceiling as the starting point for its initial offer.

CMS will adjust the starting point for the initial offer based on a broad evaluation of evidence, including that which is submitted by manufacturers and the public, about the clinical benefit the selected drug provides relative to its therapeutic alternatives, including information about potential safety concerns and side effects, whether the selected drug represents a therapeutic advance as measured by improvements in clinical outcomes, and information about the effects of the selected drug and its therapeutic alternatives on specific populations, including people with disabilities and older adults. CMS will also consider comparative effectiveness data on patient-centered outcomes and patient experiences.

If a selected drug has no therapeutic alternatives, CMS will evaluate evidence about the selected drug’s clinical benefit, including improvements in outcomes, and also will consider the extent to which the selected drug fills an unmet medical need, meaning the drug treats a disease or condition where there are very limited or no other treatment options, or the existing treatments do not adequately address the disease or condition. This consideration will be made separately for each indication of a selected drug, where applicable.

After considering information about clinical benefit, CMS will adjust its starting point for the initial offer price to arrive at a “preliminary price.” After determining the preliminary price, CMS will take into account manufacturer-specific data elements. These data, and their illustrative effect on the preliminary price as described in CMS’s guidance, are:

  • Research and development (R&D) costs: if a manufacturer has recouped its R&D costs, CMS could adjust the preliminary price downward, or upward if such costs have not been recouped.
  • Current unit costs of production and distribution: if lower than the preliminary price, CMS could adjust the price downward, or upward if such costs are higher than the preliminary price.
  • Prior federal financial support: if discovery and development of the selected drug was supported by federal funding, CMS could adjust the preliminary price downward.
  • Patent information: this data will support CMS's evaluation of whether a selected drug represents a therapeutic advance or meets an unmet medical need, particularly in light of any exclusivities which mean that a selected drug is the only available therapy.
  • Market data and revenue and sales volume data for the drug in the U.S.: depending on how CMS’s preliminary price compares to other market pricing data for the selected drug, CMS could, for example, revise downward the preliminary price if the average commercial net price is lower, or upward if the average commercial net price is higher.

After making any necessary adjustments to the preliminary price based on a review of manufacturer-specific data, CMS will arrive at its initial offer for the maximum fair price.

The law establishes a ceiling on the negotiated price that Medicare will pay for selected drugs, based on existing price benchmarks

Copy link to The law establishes a ceiling on the negotiated price that Medicare will pay for selected drugs, based on existing price benchmarks

The IRA establishes an upper limit for the maximum fair price for a given drug, which varies depending on whether the drugs is covered under Part B only, Part D only, or both parts. The upper limit is the lower of the drug’s enrollment-weighted negotiated price (net of all price concessions, including rebates) for a Part D-only drug, the average sales price (the average price to all non-federal purchasers in the U.S., inclusive of rebates, other than rebates paid under the Medicaid program) or a percentage of a drug’s average non-federal average manufacturer price (non-FAMP) (the average price wholesalers pay manufacturers for drugs distributed to non-federal purchasers) for a Part B-only drug, or a weighted average of these amounts for drugs covered under both Part B and Part D. The percentage of non-FAMP varies depending on the number of years that have elapsed since FDA approval or licensure: 75% for small-molecule drugs and vaccines more than 9 years but less than 12 years beyond approval; 65% for drugs between 12 and 16 years beyond approval or licensure; and 40% for drugs more than 16 years beyond approval or licensure. This approach means that the longer a drug has been on the market, the lower the ceiling on the maximum fair price.

The negotiation process between CMS and drug manufacturers spans several months and allows for multiple opportunities to exchange price offers

Copy link to The negotiation process between CMS and drug manufacturers spans several months and allows for multiple opportunities to exchange price offers

CMS’s guidance outlines several steps in the negotiation process (Figure 1). These steps, and the relevant dates for selected drugs for 2028, are:

  • CMS and manufacturers of selected drugs enter into a written agreement to negotiate to determine the maximum fair price for selected drugs by February 28, 2026.
  • Submission of economic and market data from manufacturers of selected drugs to CMS and information about therapeutic alternatives is due on March 1, 2026.
  • CMS will host one meeting with manufacturers of selected drugs in Spring 2026 after the submission of manufacturer-specific data elements so that manufacturers can provide additional context for their data submission and share new information, if applicable.
  • CMS will host up to 15 patient-focused roundtable events with consumer and patient organizations (with selected drugs aggregated by condition, as appropriate) and one clinician-focused town hall event in Spring 2026 to solicit patient-focused and clinical information on therapeutic alternatives and other information for CMS to consider in developing its initial offer for selected drugs.
  • CMS will make a written offer to the manufacturer of a selected drug with its initial offer of the maximum fair price by June 1, 2026. This written offer will include a justification for CMS’s initial offer based on the methodology used, including how CMS evaluated various data submitted by manufacturers and evidence about alternative therapies.
  • An optional negotiation meeting between CMS and manufacturers of selected drugs could take place between the date of CMS’s initial offer and the deadline for manufacturers to respond.
  • Manufacturers respond to CMS’s initial offer in writing either accepting the offer or making a counteroffer within 30 days of receiving the initial offer (e.g., July 1, 2026, for initial offers made by CMS on June 1, 2026). The written counteroffer should include the manufacturer’s proposed maximum fair price, along with a justification for that amount and a response to CMS’s justification for its initial offer. If the manufacturer does not accept CMS’s initial offer, a written counteroffer must be submitted, If the manufacturer accepts CMS’s initial offer, the negotiation process ends.
  • CMS will provide a written response to the manufacturer in response to an optional written counteroffer, either accepting or rejecting the counteroffer, within 30 days (e.g., July 31, 2026, if the manufacturer’s counteroffer is made on July 1, 2026). If CMS accepts the manufacturer’s counteroffer, the negotiation process ends.
  • If CMS rejects the manufacturer’s counteroffer, up to 2 additional in-person or virtual meetings could occur between CMS and the manufacturer to discuss offers and counteroffers. The meetings would focus on manufacturer-submitted data and information about therapeutic alternatives, and how that information should factor into the maximum fair price. The timeframe for negotiation meetings would end no later than September 11, 2026. Additional written offers and counteroffers could be exchanged after CMS’s rejection of the manufacturer’s counteroffer and final agreement on the maximum fair price (up to one week prior to CMS submitting a final written offer).
  • After any negotiation meetings between CMS and the manufacturer, CMS makes a final written offer for the maximum fair price (no later than September 30, 2026 for the 2028 negotiation cycle).
  • Manufacturers consider CMS’s final offer and either accept or reject the offer in writing (by October 31, 2026 for the 2028 negotiation cycle).
  • The negotiation process ends when CMS and manufacturers of selected drugs reach agreement on the maximum fair price, but no later than the statutorily defined deadline for the negotiation process to end (October 31, 2026 for the 2028 negotiation cycle) and the end of the negotiation period (November 1).

If an agreement on the maximum fair price is not reached by the October 31 deadline, manufacturers may be subject to an excise tax, which is being administered by the IRS, as specified in the Inflation Reduction Act. CMS has outlined an expedited process manufacturers can follow if they choose to not participate in the negotiation program, which would enable them to withdraw their drugs from coverage under Medicare and Medicaid to avoid paying the excise tax.

According to CMS, manufacturers may disclose information related to the negotiation process with CMS if they choose to do so. CMS will not publicly discuss the specifics of the negotiation process related to any manufacturer but reserves the right to do so if manufacturers themselves choose to disclose this information.

The marketing of a generic or biosimilar version of a drug previously selected for negotiation affects the availability of the negotiated price for that product

Copy link to The marketing of a generic or biosimilar version of a drug previously selected for negotiation affects the availability of the negotiated price for that product

Drugs are not eligible to be selected for negotiation if there is a generic or biosimilar using that drug as the reference product approved or licensed by the FDA and being marketed. (Authorized generics do not count for this purpose, since they are not technically generic drugs as that term is commonly used, but rather the same drug product as the brand-name drug with a different label.) If a drug has already been selected for negotiation and CMS determines that a generic or biosimilar drug has been approved or licensed and is being “bona fide” marketed (as described above) – either before or during the negotiation process – the negotiation process will not start or will be suspended. The drug will continue to be a selected drug (not replaced by another drug), but no maximum fair price will be negotiated. To be removed from the list of selected drugs for 2028, CMS will need to make this determination between February 1, 2026 and November 1, 2026 (between the selected drug publication date and the end of the negotiation period.)

If CMS determines that a generic or biosimilar drug has been approved and marketed after a drug has been selected for negotiation and after a maximum fair price has been established, the maximum fair price will take effect, but depending on when the determination is made, that drug will no longer be a selected drug and the maximum fair price will not apply in subsequent years. For selected drugs for 2028, if the determination of generic drug availability is made between November 2, 2026 and March 31, 2028, the maximum fair price will only apply in 2028 and the drug will no longer be a selected drug for 2029; if the determination is made between April 1, 2028 and March 31, 2029, the maximum fair price will apply in 2028 and 2029 and the drug will no longer be a selected drug for 2030.

Potential savings for Medicare beneficiaries from Medicare’s negotiated drug prices depend on several factors

Copy link to Potential savings for Medicare beneficiaries from Medicare’s negotiated drug prices depend on several factors

There is uncertainty about how many Medicare beneficiaries will see lower out-of-pocket drug costs in any given year under the Medicare price negotiation program and the magnitude of potential savings, since both will depend on which drugs are subject to the negotiation process and the price reductions achieved through the negotiation process relative to what prices would otherwise be. In addition, whether Part D enrollees pay lower out-of-pocket costs for a given Part D selected drug will depend in part on whether they pay flat copayment amounts or a coinsurance rate for the drug in their chosen Part D plan. If they pay coinsurance, they could see savings from a Medicare-negotiated price that is lower than their plan’s negotiated price. This applies for Part B selected drugs as well, where beneficiaries in both traditional Medicare and Medicare Advantage typically face a coinsurance rate of 20% (although many beneficiaries in traditional Medicare have supplemental coverage that helps with Medicare cost-sharing requirements).

Aside from the potential for out-of-pocket cost savings, the drug price negotiation program could improve Medicare Part D enrollees’ access to Part D drugs that are selected for negotiation, since the IRA requires Part D plans to cover all selected drugs with negotiated maximum fair prices, including all dosage forms and strengths. (Part D plans generally can choose which drugs to cover and not cover on their formularies, subject to CMS’s formulary guidelines and requirements, except for drugs in six called “protected classes,” where all or substantially all drugs must be covered.) KFF analysis of 2026 Medicare Part D formulary coverage of drugs selected for negotiation shows that the IRA’s coverage requirement for selected drugs led to improved coverage of the Part D drugs with negotiated prices available in 2026.

CMS will use the annual formulary review process to ensure that all Part D plans cover all dosages and formulations of selected drugs. CMS will also review whether Part D plan sponsors place selected drugs on non-preferred tiers; place selected drugs on a higher tier than non-selected drugs in the same class; require utilization of an alternative brand prior to a selected drug; or impose more restrictive utilization management tools on a selected drug relative to a non-selected drug in the same class. In any such instances, CMS expects Part D plan sponsors to provide a clinical justification for these practices and will only approve those formularies that adhere to all statutory and regulatory guidelines and requirements.

This work was supported in part by Arnold Ventures. KFF maintains full editorial control over all of its policy analysis, polling, and journalism activities.

How Does Health Spending in the U.S. Compare to Other Countries?

Published: Mar 11, 2026

Relative to the size of its economy, the U.S. spends a greater amount on health care than other high-income nations. And while the U.S. has long had higher than average health spending, recent years have seen higher spending growth in peer nations. This chart collection compares health care spending in the U.S. and other OECD countries that are similarly large and wealthy, using data from the OECD Health Statistics database for peer countries, and from the 2024 National Health Expenditure Data for the U.S.

The analysis is available through the Peterson-KFF Health System Tracker, an online information hub dedicated to monitoring and assessing the performance of the U.S. health system.

How Does Cost Affect Access to Health Care?

Published: Mar 10, 2026

This analysis explores trends in how the cost of health care affects access to care in the U.S. using National Health Interview Survey (NHIS) data through 2024.

In 2024, about 1 in 6 adults (17%) reported delaying or not getting healthcare due to cost, including those who delayed or did not get medical or mental health care and those who rationed prescription drugs due to cost. Uninsured adults and adults who are in worse health are twice as likely to report that they or a family member had difficulty paying medical bills.

The analysis is available through the Peterson-KFF Health System Tracker, an online information hub dedicated to monitoring and assessing the performance of the U.S. health system.

Oral Contraceptive Pills: Access and Availability

Published: Mar 10, 2026

Editorial Note: Originally published on March 20, 2024, this brief was updated on March 10, 2026 to incorporate new data and the latest policy developments on contraceptive coverage.

For over 60 years, American women have relied on oral contraceptive pills to prevent pregnancy. Oral contraceptives are the most widely used form of reversible contraception and are also commonly used to manage other health conditions. In the U.S., daily oral contraceptive pills have traditionally only been available with a prescription. In July 2023, the U.S. Food and Drug Administration approved the first over-the-counter daily oral contraceptive pill, eliminating the requirement for a prescription from a clinician. This progestin-only pill is now available for purchase in stores and online at most major retailers. This brief provides an overview of oral contraception, discusses private insurance and Medicaid coverage, and reviews strategies to promote and expand women’s access to oral contraceptives. 

In 1960, the Food and Drug Administration (FDA) approved the sale of Enovid for use as the first oral contraceptive. Controversial from its earliest days, in 1965, the Supreme Court ruling in Griswold v Connecticut upheld married women’s rights to contraception, followed in 1972 by the Supreme Court’s decision in Eisenstadt v Baird which extended the right to single, unmarried individuals.

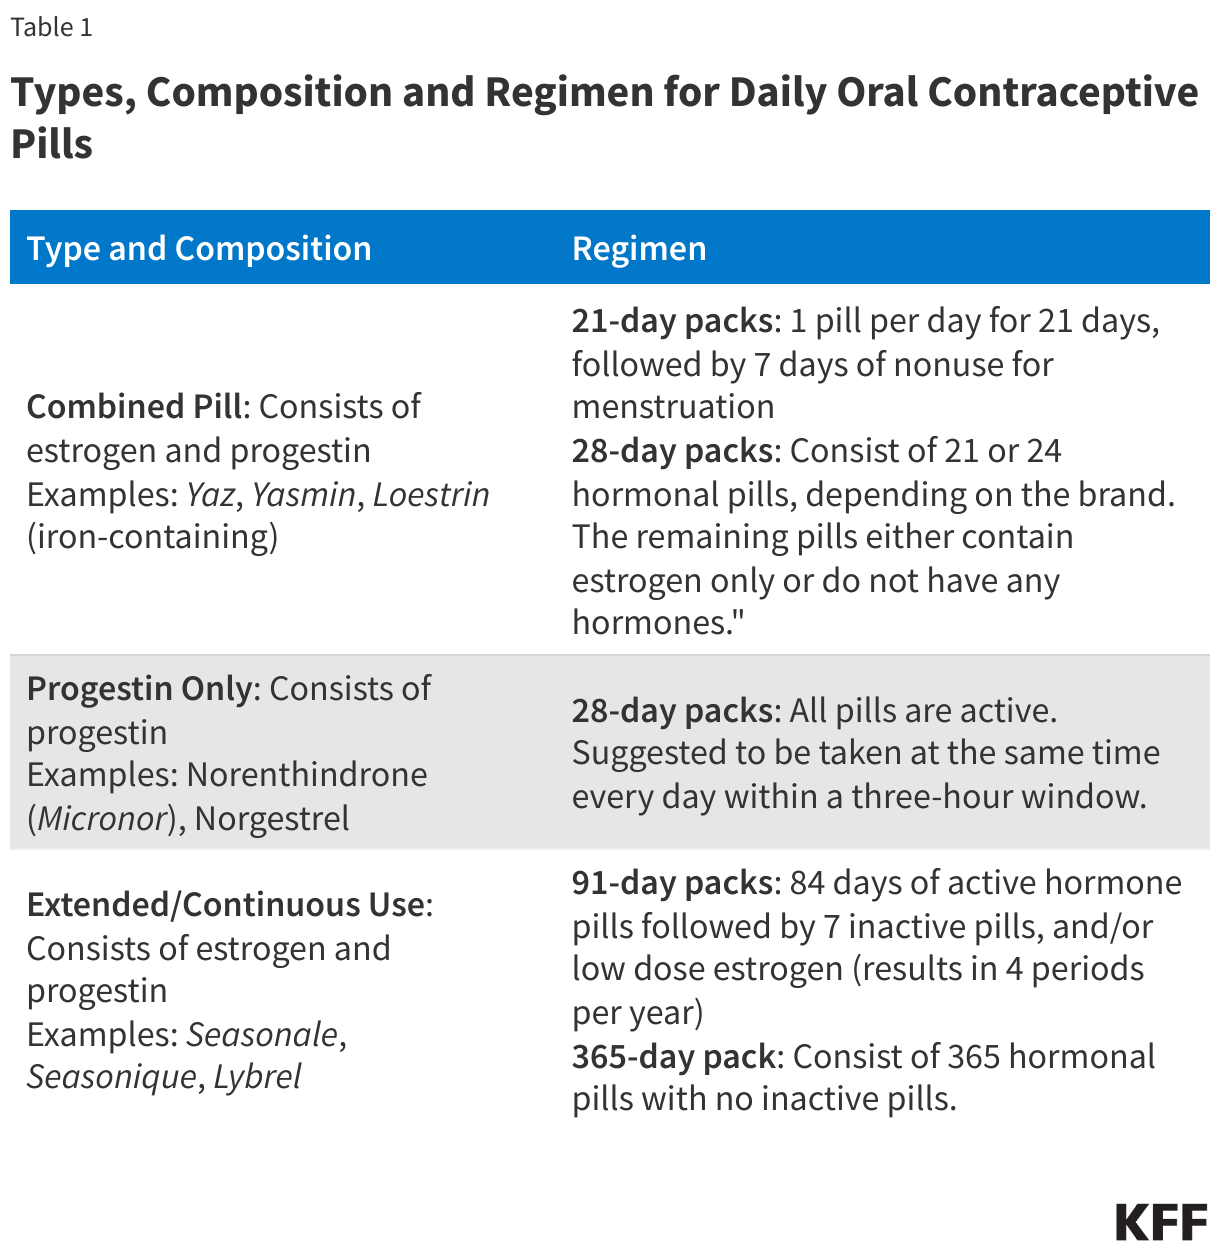
Oral contraceptive pills (OCP) consist of the hormones progestin and estrogen, or only progestin, and must be taken orally once per day in order to prevent pregnancy. Currently, there are three different types available on the market: the combination pill, the progestin-only pill, and the continuous use pill. The three formulations vary in their chemical hormonal composition as well as regimen for use (Table 1). Different brands further add to the diversity of OCP available by altering the type and/or dose of hormones. Emergency contraceptive pills are also a type of OCP, consisting of the progestin levonorgestrel, but are not intended for daily use. Rather, they are used to prevent pregnancy after unprotected sex.

Both the combined and progestin-only pills are highly effective with perfect use, with a failure rate (rate at which women become pregnant while using the contraceptive) of less than 1%. However, the failure rate with “typical use” is 9%, which accounts for inconsistent or incorrect use.

Types, Composition and Regimen for Daily Oral Contraceptive Pills (Table)

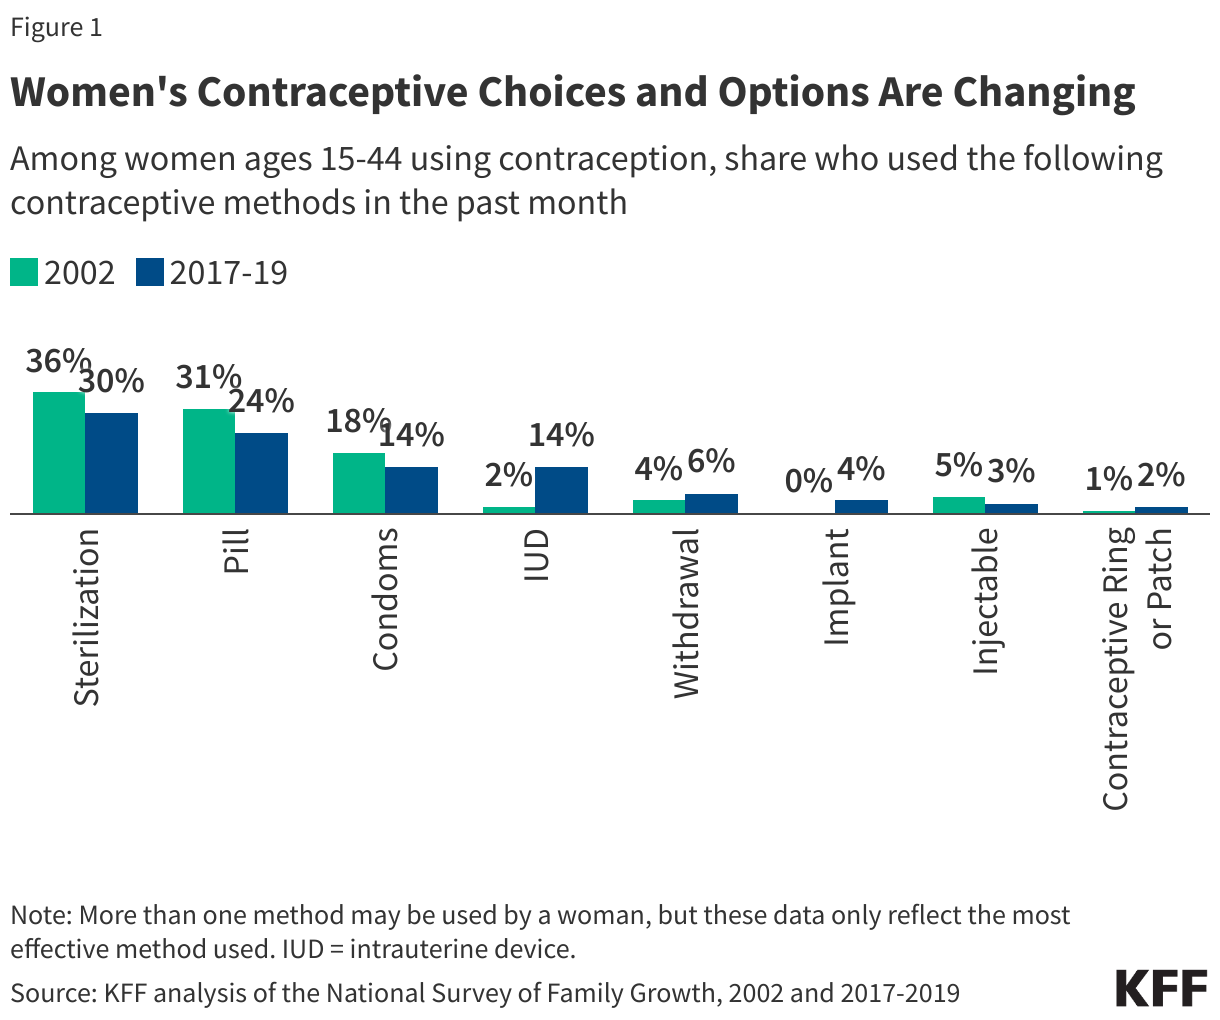
The pill was the first FDA-approved contraceptive to be used in the U.S. and is still the most commonly used form of reversible contraception. According to KFF analysis of the 2022-2023 National Survey of Family Growth, the most recent years for which data are available, about one-quarter (23%) of women ages 15-44 who currently use contraception reported using the pill as their method of choice (Figure 1). One in five reported using long-acting reversible contraceptives (LARCs) such as intrauterine devices (IUDs) (16%) and implants (5%), which have been promoted by several medical groups in recent years.

Oral Contraceptive Pills are the Most Commonly Used Method of Reversible Contraception (Grouped column chart)

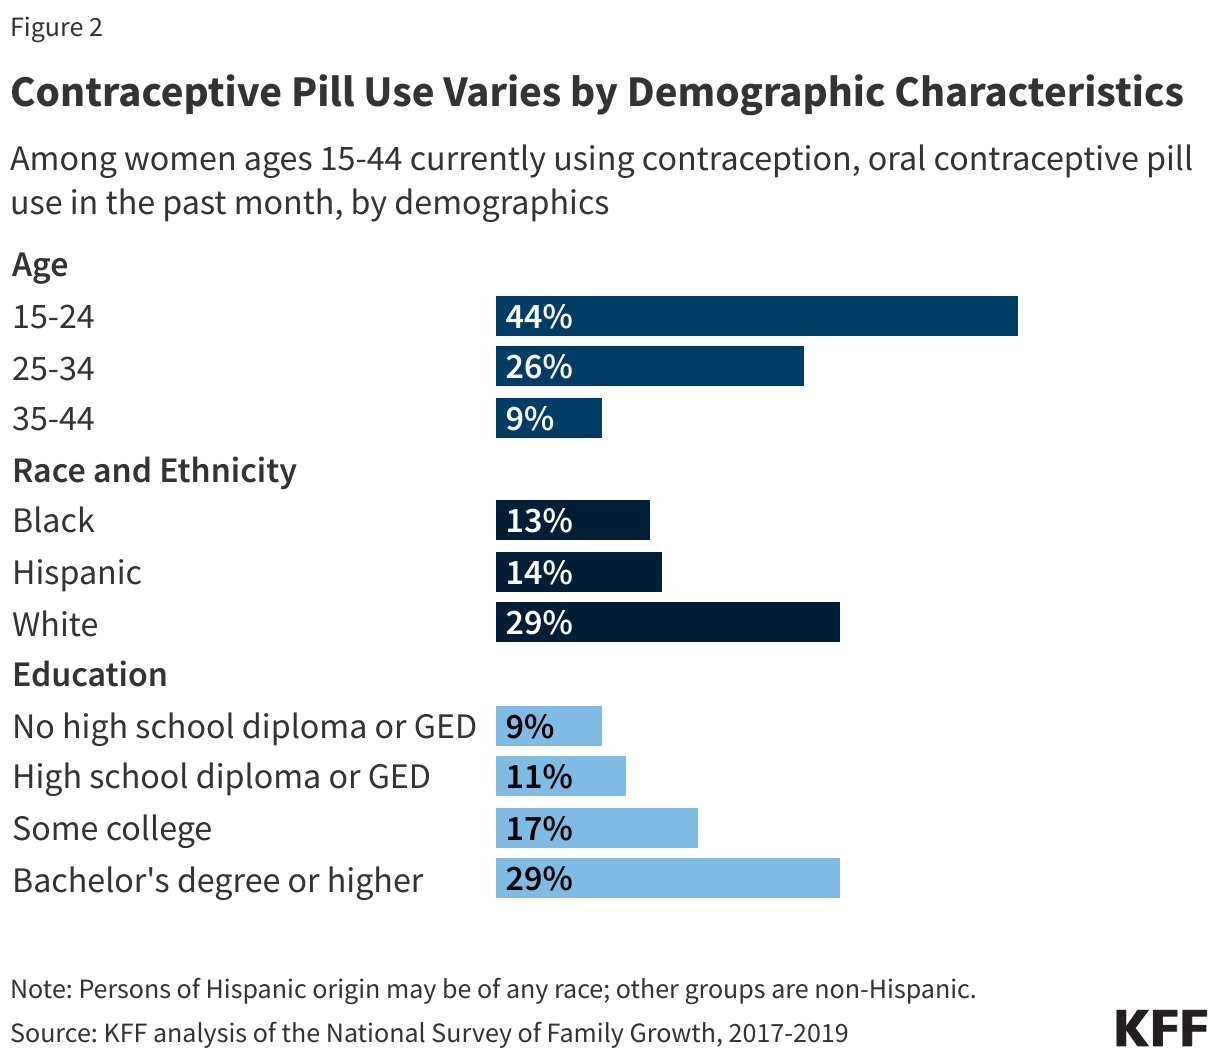
Among women ages 15-44 who use any form of contraception, OCP use is higher among younger women and decreases with age. A larger share of White women (27%) use OCP than Hispanic (19%) or Black (14%) women. OCP use increases with higher educational attainment (Figure 2).

Contraceptive Pill Use Varies by Demographic Characteristics (Bar Chart)

OCPs are primarily used for pregnancy prevention, but they can also be used to address other health conditions, particularly menstrual-related disorders such as menstrual pain, irregular menstruation, fibroids, endometriosis-related pain, and menstrual-related migraines. Use of combined pills for acne has been formally approved by the FDA for specific brands. While most (82%) women who use OCP take them primarily to prevent pregnancy, 18% use them solely for non-contraceptive reasons such as to manage a medical condition (unpublished analysis from the 2022 KFF Women’s Health Survey).

Oral contraceptives are safe for most women. Possible side effects include headache, nausea, breast tenderness, and breakthrough bleeding. The combined hormonal pills may be associated with a small increased risk of deep vein thrombosis, heart attack and stroke for some women.

Insurance Coverage and Financing of Oral Contraceptives

OCPs have not always been covered by insurance plans in the same way as other prescriptions drugs. This became the focus of legislative action in the early 1990’s, first at the state and then the federal level.State legislatures began passing “contraceptive equity” laws which typically required that plans offering prescription drug coverage also cover contraceptives on the same terms as other prescriptions. Some state laws went further to require that plans cover all FDA-approved contraceptives. However, these state laws only applied to plans that were regulated by the state and did not include self-funded employer-sponsored plans, which are federally regulated through ERISA and cover most workers with employer-sponsored insurance. Minimum coverage standards for employer-sponsored plans were established in 2000, when a federal ruling from the Employment Equal Opportunity Commission found it unlawful under the Civil Rights Act for plans to deny coverage for contraceptives if they covered other preventive prescription drugs and services. By 2010, 28 states required insurers that cover prescription drugs to provide coverage for the full range of FDA-approved contraceptives.

Private Insurance and the ACA

In 2010, the Affordable Care Act (ACA) took state laws further by requiring most private plans (including self-funded, small and large group, and individual plans) to cover a wide range of recommended preventive services, without patient cost-sharing. In 2011, the Health Resources and Services Administration (HRSA), following recommendations issued by the Institute of Medicine, added that all FDA-approved, prescribed contraceptive methods and patient counseling for women with reproductive capacity be covered, without cost sharing, as a preventive service. Plans that were in effect on or before March 23, 2010, known as "grandfathered plans," are not required to cover preventive services, or they may require cost sharing. Additionally, plans offered by an employer with a religious objection to contraception may exclude this coverage from their plan.

Under the ACA, most private health insurance plans must cover at least one form of each of the 18 FDA-approved contraceptive methods for women without cost sharing. This means that plans must cover at least one of each of the three different types of oral contraceptives – the combined pill, the progestin-only pill and the continuous use pill – though it is up to an insurer’s discretion using reasonable medical management practices whether to cover a brand name or generic contraceptive if both are available. Insurers are required to cover other contraceptives if medically necessary and must provide a process for policyholders to request coverage of a contraceptive that is not already covered without cost sharing by the plan. While some contraceptive methods are available over the counter without a prescription, plans typically require a prescription to trigger coverage.

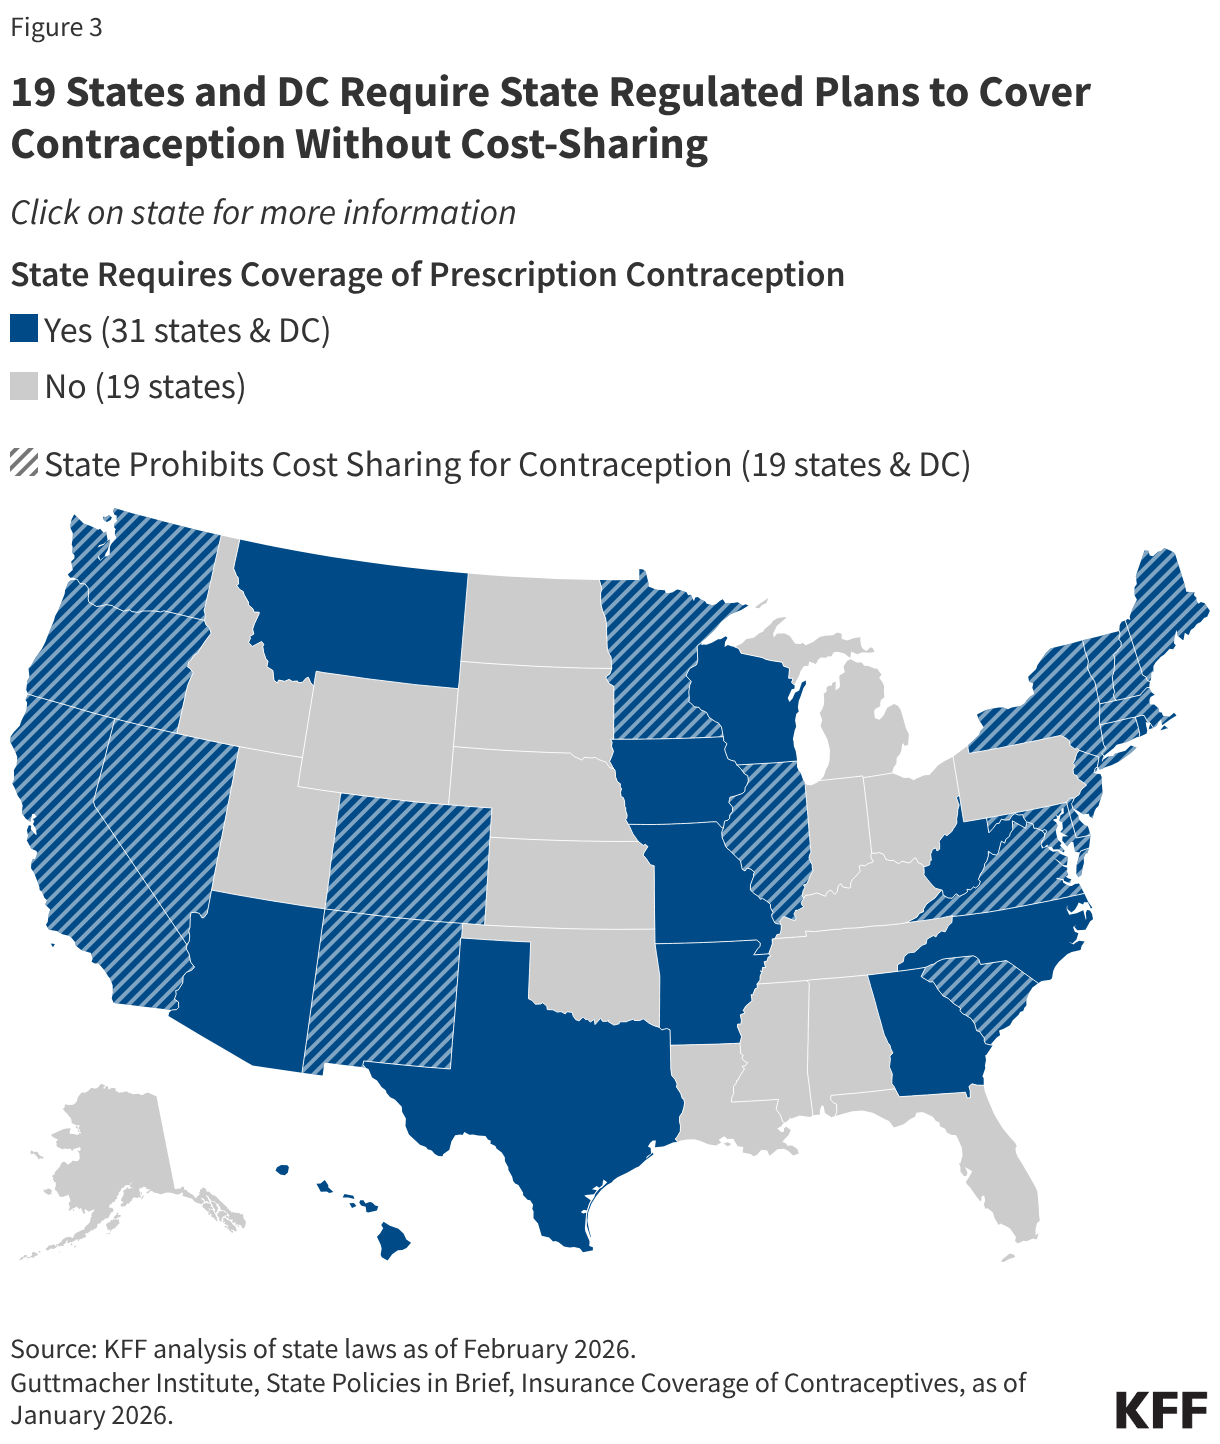
Additionally, 31 states and D.C. require state regulated plans to cover prescription contraception, and 19 of those states and D.C. passed laws that build on the federal requirement prohibiting cost-sharing for all FDA-approved contraceptive methods for women (Figure 3). Some of these states have gone beyond the ACA requirements, mandating coverage of vasectomies and/or over-the-counter contraceptives.

19 States and DC Require State Regulated Plans to Cover Contraception Without Cost-Sharing (Choropleth map)

Today, fewer women are paying out of pocket for contraceptives as a result of the ACA’s contraceptive coverage requirement. According to a 2019 KFF analysis of the IBM MarketScan Commercial Claims and Encounters Database, among women with health insurance from a large employer who use OCP, the share experiencing out-of-pocket spending on OCP declined from 96% in 2010 to 11% in 2017.

Controversial since its inception, the provision has sparked litigation and new regulations in response to lawsuits that have reached the Supreme Court. Although the Obama administration allowed certain religious employers with an objection to contraception to request an exemption from the requirement, in 2020, the Supreme Court upheld two Trump administration rules that expanded eligibility to almost all employers that have a religious or moral objection. Female employees, dependents, and students of these exempt employers are not entitled to coverage for the full range of FDA-approved contraceptives.  

Public Programs

Federal law has long required state Medicaid programs to cover family planning services and supplies without cost sharing and provides states with an enhanced federal match for providing these services. States that expanded Medicaid under the ACA must follow the ACA requirements for private plans and are required to cover at least one form of all 18 FDA-approved contraceptive methods for women. There is no similar requirement for traditional full-scope Medicaid or through a Medicaid family planning expansion program, and there is variation between states on the specific services that are covered. 

Since the passage of the ACA, some states have also strengthened their contraceptive coverage requirements for Medicaid (Figure 3). For example, California passed the Contraceptive Coverage Equity Act of 2014 which extends the ACA’s coverage policy beyond private plan beneficiaries to all Medicaid managed care enrollees, regardless of whether they qualify as a result of the ACA expansion or through traditional pathways. California expanded this coverage in 2022 to cover OTC contraceptive drugs and products without a clinician’s prescription and extends this coverage to fee-for-service Medicaid beneficiaries. Thirteen (13) other states and D.C. have since enacted similar contraceptive equity laws that apply to both private insurance plans and Medicaid.

Medicare, the federal program for seniors 65 and older as well as younger adults with permanent disabilities, does not require coverage for oral contraceptives. According to KFF analysis of the 2021 Medicare Current Beneficiary Survey, over 1 million women under age 50 were enrolled in Medicare. Medicare beneficiaries that have enrolled in private Medicare Advantage plans or who have opted into the Medicare Part D prescription drug benefit may have coverage for oral contraceptives, but the scope of coverage varies between plans. Nearly 8 in 10 women of reproductive age in Medicare are dually eligible for Medicaid coverage. Coverage for oral contraceptives is also required in the Indian Health Service, the federal program that provides care on or near Indian reservations as well as in the Tricare program for active military personnel and their dependents.

Expanding Access to Contraception

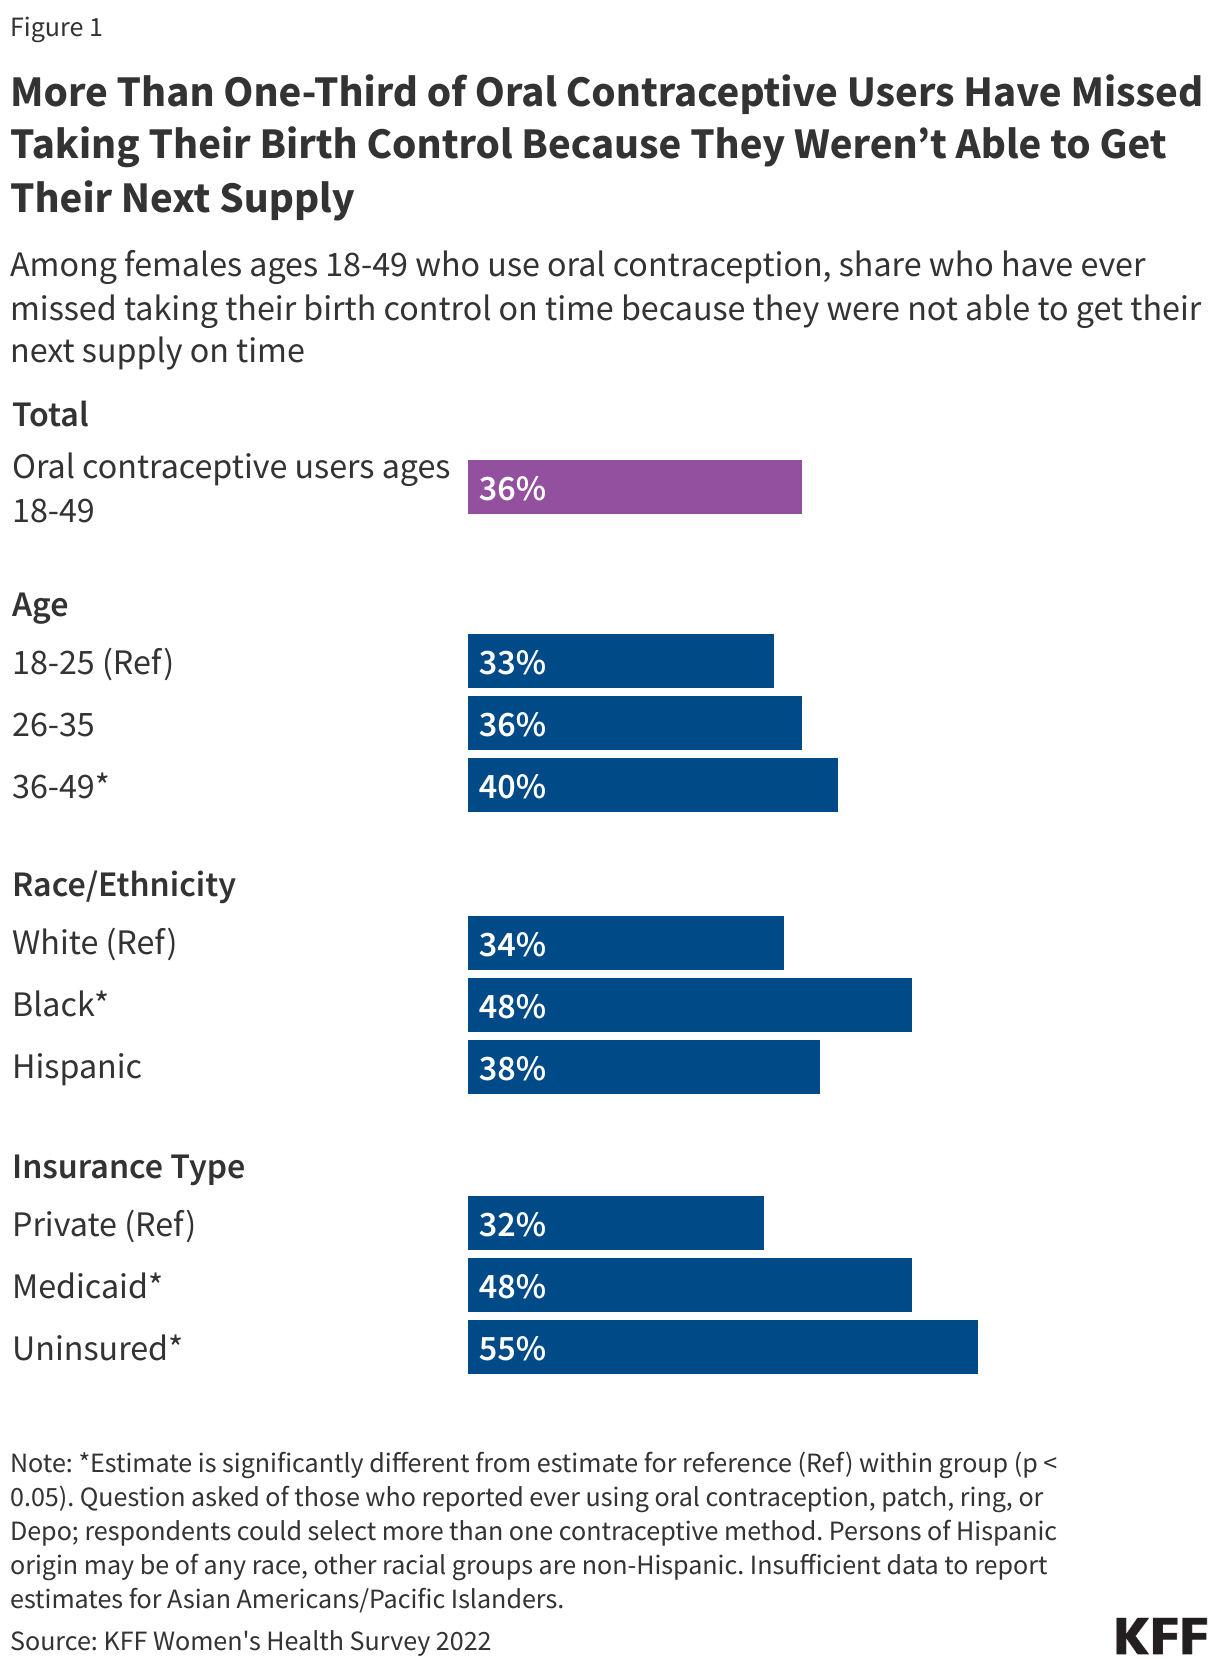
The 2022 KFF Women’s Health Survey found that one-third (33%) of female hormonal contraceptive users have missed taking their birth control because they were not able to get their next supply on time. Furthermore, it is estimated that more than 19 million women of reproductive age in need of publicly-funded contraception live in an area considered to be a contraceptive desert, meaning there is limited access to a publicly-funded provider who offers contraception. Research also points to the impacts of state and federal policies on the shrinking number of family planning providers that offer the full scope of contraceptive methods in some communities.

In recent years, there has been public discussion and state and federal policy action to reduce contraceptive access barriers by expanding the availability of daily oral contraceptive pills through different mechanisms. Approaches that have been adopted include making OCP available over the counter without a prescription; expanding the ability of pharmacists to dispense or prescribe OCP; extending the supply of contraception that is dispensed at one time; and using mail-based online services or smartphone applications.  

Over the Counter (OTC) Access

In July 2023, the U.S. Food and Drug Administration (FDA) approved the progestin-only Opill for OTC use, making it the first OTC daily oral contraceptive pill. Opill is available for over-the-counter purchase without age restriction in stores and online. The suggested retail price of Opill is $19.99 for one month’s supply or $49.99 for three month’s supply. Although it is farther behind in the process, another pharmaceutical company, Cadence, is working toward FDA approval of an OTC version of its combined (progestin and estrogen) oral contraceptive pill, Zena.

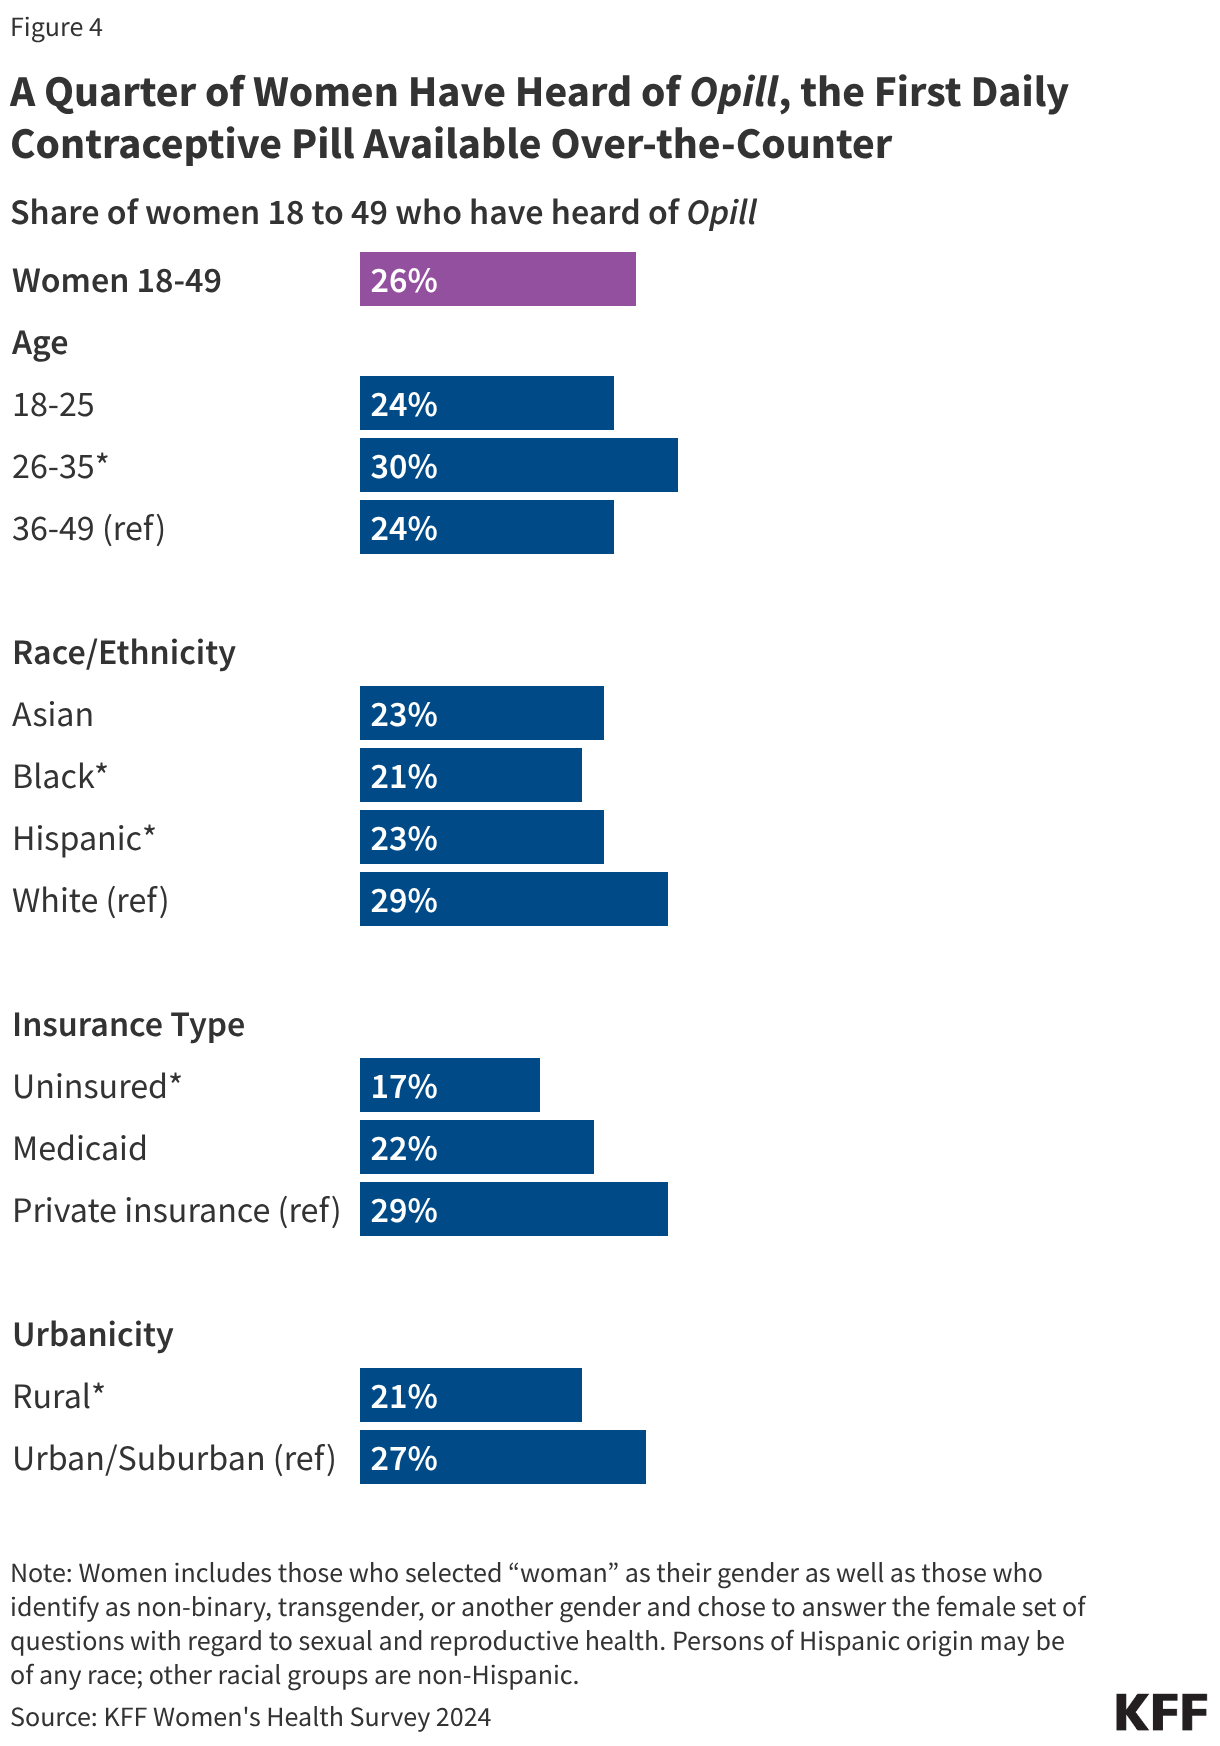
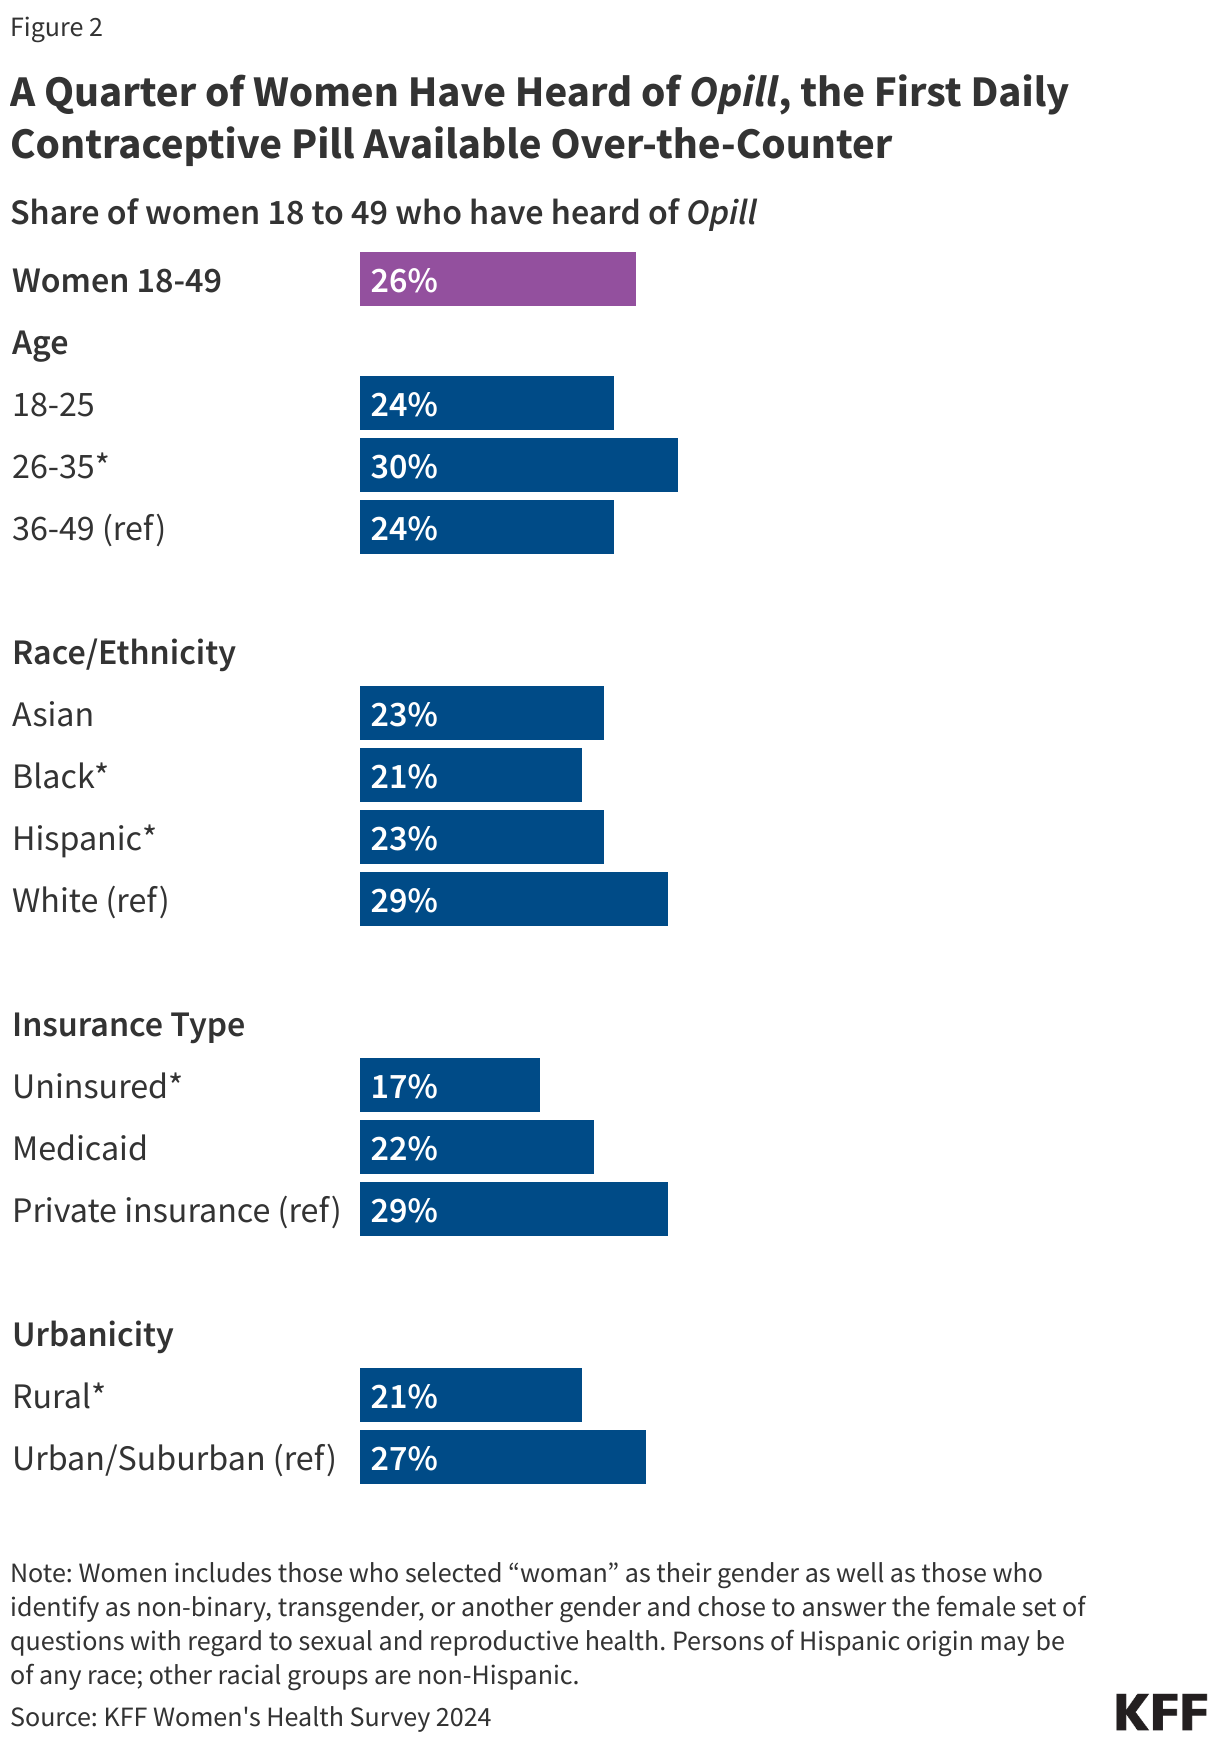
Research suggests that OTC access would increase the use of contraception and facilitate continuity of use. It could also allow women to save time spent on travel, at doctor’s office, and off work. Other research suggest that OTC oral contraceptives can especially benefit populations who have historically faced barriers to accessing contraceptive care, such as young adults and adolescents, those who are uninsured, and those living in contraceptive deserts or areas with limited access to health centers offering the full range of contraceptive methods. However, just a quarter (26%) of women 18 to 49 saying they have heard of the new daily oral contraceptive pill, and smaller shares of women who are uninsured (17%) and who live in rural areas (21%) have heard of Opill compared to those with private insurance (29%) and those living in urban or suburban areas (27%) (Figure 4).

A Quarter of Women Have Heard of Opill, the First Daily Contraceptive Pill Available Over-the-Counter (Bar Chart)

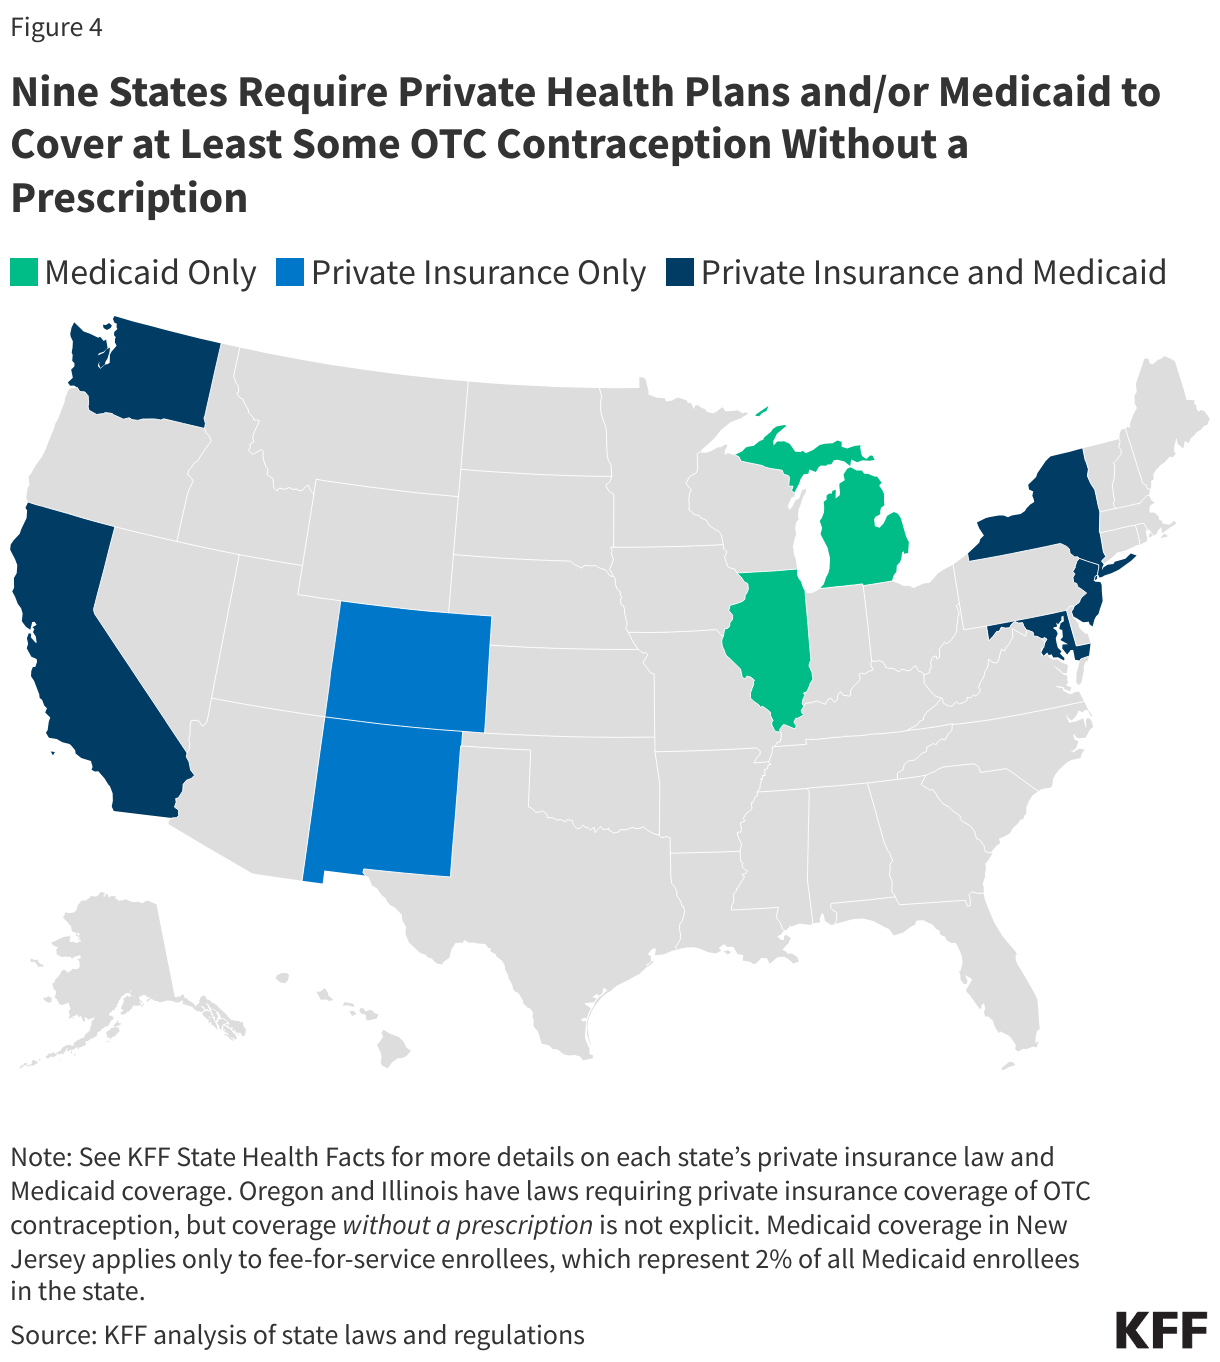
The ACA currently requires no-cost coverage for contraceptives in most private plans and for Medicaid expansion populations but plans typically require a prescription in order to trigger coverage, even for contraceptive methods that are available OTC without a prescription. Requiring plans to cover non-prescribed contraceptives would require legislation at the federal or state level, or administrative changes to the ACA’s preventive services policy. Nine states (CA, CO, DE, MD, ME, NJ, NM, NY, and WA) have laws or regulations requiring state-regulated private health insurance plans (individual, small group, and large group markets) to cover, without cost sharing, OTC contraception without a prescription. While New York’s law applies to emergency contraception only, the other state laws apply to non-prescribed contraceptive drugs broadly(Figure 5).

Eight states (CA, IL, MD, MI, NC, NJ, NY, and WA) use state-only funds to cover at least some OTC contraception without a prescription for Medicaid enrollees. However, these states, with the exception of California, cover non-prescribed emergency contraception and/or condoms only, so a change in law or policy would be needed to cover a daily oral contraceptive pill without a prescription. States wishing to cover OTC contraception without a prescription for enrollees must use state-only funds as federal funds are only available for prescribed drugs. (See KFF State Health Facts for more details on each state’s  private insurance law and Medicaid coverage, including contraceptive methods covered.)

Eleven States Require Private Health Plans and/or Medicaid to Cover at Least Some OTC Contraception Without a Prescription (Choropleth map)

For more information on how states have implemented insurance of OTC contraceptives, see KFF’s report Insurance Coverage of OTC Oral Contraceptives: Lessons from the Field and issue brief Over-the-Counter Oral Contraceptive Pills.

Pharmacist Prescribing

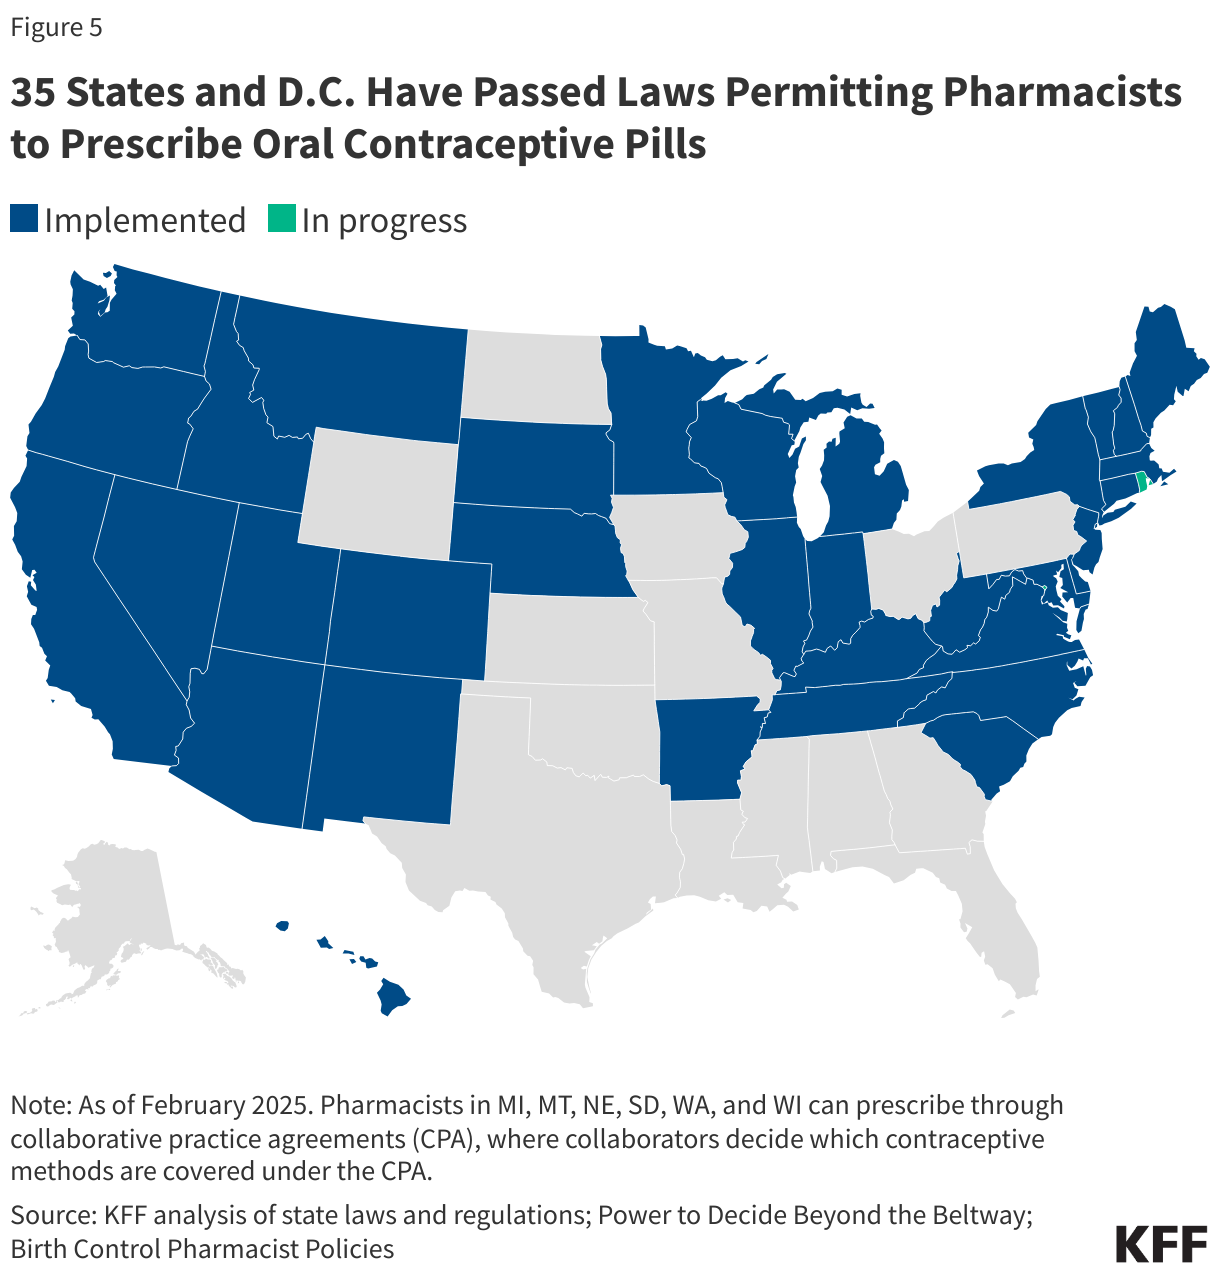
Another avenue that is gaining support in some states allows pharmacists to prescribe or dispense OCP without requiring an in-person medical visit to a physician. As of February 2026, 36 states and D.C. passed legislation to allow pharmacists to prescribe certain self-administered contraceptives to women (Figure 6). All of these states allow pharmacists to prescribe at least oral contraceptives, but states vary in other details, such as the type of prescriptive authority (e.g., collaborative practice agreements, statewide protocols, and standing orders), minimum age requirements, the type of contraceptive that pharmacists can prescribe, the length of the supply, and whether the patient needs a prior prescription from a physician.

36 States and D.C. Have Passed Laws Permitting Pharmacists to Prescribe Oral Contraceptive Pills (Choropleth map)

Although expanded scope of pharmacist practice can remove some barriers to obtaining contraceptives, challenges still remain for women seeking a prescription for contraception from a pharmacist. For example, pharmacies typically charge consultation fees, which some reports suggest can be as high as $50 in certain areas. Although insurers are generally required to cover contraceptives without cost sharing, they are not obligated to cover this fee. Also, pharmacies can choose not to participate or may not have any pharmacists trained to provide this service.

From the pharmacy perspective, pharmacists must elect to complete additional education requirements, which vary by state, and often include several hours of continuing education from an accredited training program. Additionally, states may not have a reimbursement mechanism in place to pay pharmacists for providing this service. For example, while Oregon and Hawaii require plans to reimburse the dispensing entities, California’s law does not require reimbursement for payers other than Medicaid. Lack of or low reimbursement for pharmacist prescribing can result in fewer pharmacies choosing to provide this service.

12-Month Supply

Another approach to facilitate access to oral contraceptives involves increasing the dispensing period of contraceptives to 12 months per prescription. Currently, dispensing patterns vary by insurer, with many plans limiting supply of pills to 1-3 packs at a time. The 2022 KFF Women’s Health Survey found that among females who reported using birth control pills in the past year, 32% receive 1-2 packs at a time, 63% receive 3-5 packs, and just 3% receive a 12-month supply. Providing women with an extended supply of pill packs may lead to more consistent contraceptive use. Women who receive a one-year supply have been found to be 30% less likely to have an unintended pregnancy compared to women receiving a 1–3-month supply.

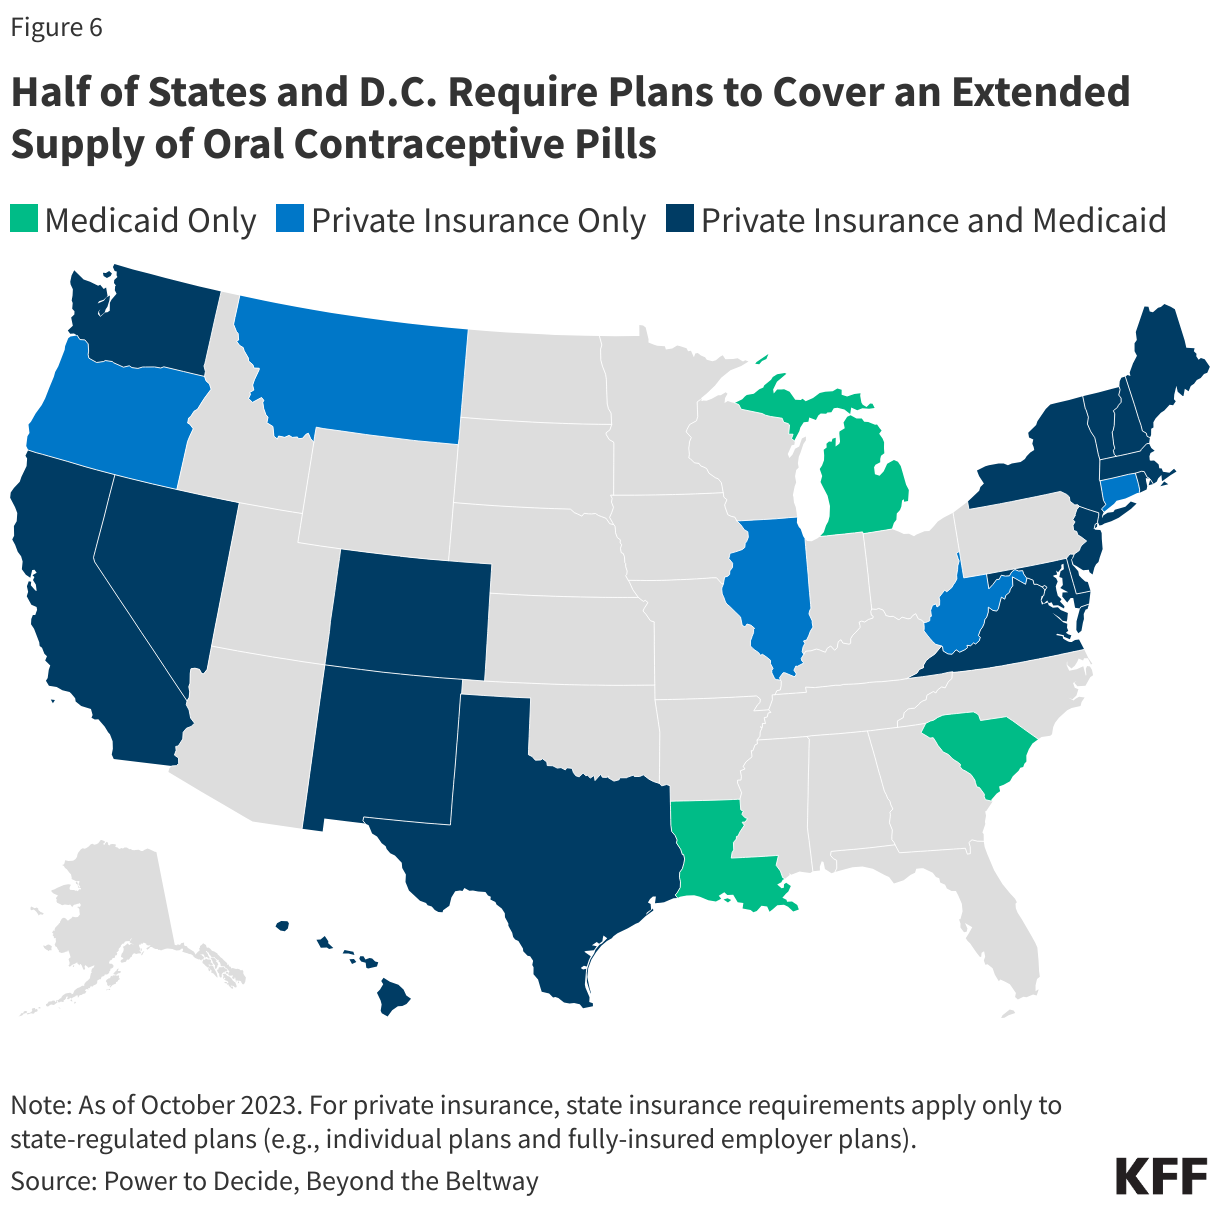
In 2015, Oregon became the first state to pass a law requiring state-regulated plans to cover a three-month supply of contraceptives when first prescribed, followed by a 12-month supply of contraceptives. Laws requiring coverage for 12 months of oral contraceptives have since been enacted in 29 additional states and DC (Figure 6). Idaho, Louisiana, and New Mexico require coverage for a 6-month supply. While most of these states have also enacted policies that require no-cost contraceptive coverage similar to the ACA’s contraceptive coverage provision, eight states (HI, ID, LA, MI, MT, OK, TX, and WV) with extended supply laws have not done so. This means that although insurers must cover a 12-month supply in these states, state law does not prohibit cost sharing; however, most plans must abide by the federal requirement and not charge any cost sharing for prescribed, FDA-approved contraceptive methods.

More Than Half of States and D.C. Require Plans to Cover an Extended Supply of Oral Contraceptive Pills (Choropleth map)

Telecontraception

In recent years, a growing number of companies providing contraception through online platforms (“telecontraception”) have entered the market and are providing a new option for people to obtain contraceptive supplies without the need for an in-person visit. A growing number of online services and smartphone applications offer options for patients to speak with providers by video or chat, get prescriptions, and order birth control pills through mail delivery. These services work by collaborating with physicians, pharmacies, and sometimes health insurers to prescribe and ship OCP to the patient’s home or a local pharmacy.

Costs for these services vary between companies. Most charge a fee for the service, which is typically not covered by insurance and can range from a $15 fee per consultation/prescription to a $99 yearly membership that covers the medical evaluation and customer support for the duration of the prescription.

A KFF study on telecontraception companies found considerable variation in method availability and acceptance of insurance. Many telecontraception companies accept private insurance and/or Medicaid, to pay for the cost of the pills, while others do not. The price of contraception offered by these platforms vary by method and by brand; generic pills typically range in price from $5 to $25 per pack without insurance.

Most companies ship OCPs free of charge to the patient’s home, while some require pick up from a local pharmacy. Prescriptions are often valid for 12 months and patients are sent either a one- or three-month supply of pills. Video/audio consultations are required by certain services before receiving the prescription. Services that do not require a consultation do require patients to complete a health assessment or questionnaire to determine eligibility and the appropriate pill. People in every U.S. state have access to at least one of these services, but the minimum age to use the service varies by company and state law, although many require the person to be at least 18 years old.

Oral contraceptives are the most commonly used form of reversible contraception in the U.S. Most women with private insurance or Medicaid can receive no-cost coverage for OCPs. The FDA recently approved Opill, the first ever daily OCP available over the counter, though insurance coverage of the product will largely depend on state efforts in the absence of federal guidance.Several states have enacted policies to broaden OCP access, particularly through pharmacist prescribing and insurance coverage for extended supplies and non-prescribed OTC contraceptives. The use of telemedicine to expand OCP access continues to evolve, with many women now able to obtain OCP using smartphone and web-based services.

Over-the-Counter Oral Contraceptive Pills

Published: Mar 10, 2026

Editorial Note: Originally published on September 27, 2024, this brief was updated on March 10, 2026 to incorporate new federal policy developments on contraceptive coverage.

Oral contraceptives are the most commonly used method of reversible contraception in the U.S. Oral contraceptive pills were first approved for prescription use by the U.S. Food and Drug Administration (FDA) in 1960. Over 70 years later, on July 13, 2023, the FDA approved Opill, the first daily oral contraceptive pill to become available over-the-counter (OTC) without a doctor’s prescription. It has been available online and in stores since March 2024 to people of all ages. The formulation in Opill was initially approved for prescription use by the FDA in 1973 (by a different manufacturer and with a different brand name). This issue brief provides an overview of OTC oral contraceptives and laws and policies related to insurance coverage. 

Safety, Efficacy, and Convenience

Oral contraceptive pills are highly effective at preventing pregnancy with “perfect use”, with a failure rate of less than 1%. However, the failure rate with “typical use,” which accounts for inconsistent or incorrect use, is 9%. Oral contraceptive pills must be taken once per day and are primarily used for pregnancy prevention, but they can also be used to address other health conditions such as menstrual pain, irregular menstruation, fibroids, endometriosis-related pain, menstrual-related migraines, and acne management. Oral contraceptives, especially progestin-only pills, are safe for most women.

Oral contraceptive pills, especially progestin-only pills, are safe for most people to use and have a very low risk of serious side effects or contraindications. Possible side effects from the pill include headache, nausea, breast tenderness, and breakthrough bleeding. Research has found that people, including those under the age of 18, are able to understand label instructions and contraindications for OTC contraception without clinician involvement.

Although it is not as far along in the FDA approval process, another pharmaceutical company, Cadence, is working toward FDA approval of an OTC version of its combined (progestin and estrogen) oral contraceptive pill, Zena. Combined oral contraceptive pills have more contraindications and small, but higher, risks of serious side effects than progestin-only pills like Opill. They are believed to be slightly more effective at preventing pregnancy than progestin-only pills and while they also must be taken every day, there is more flexibility on the precise timing.

Over-the-counter (OTC) status is an FDA designation meaning that a drug or product is available without a prescription from a health care provider. The ability to access oral contraceptives without a prescription from a clinician can save time spent on travel, at a doctor’s office, and off work. Studies suggest that OTC access to oral contraceptives could increase the use of contraception, facilitate continuity of use, and reduce the risk of unintended pregnancy.

Previous KFF research found that more than one-third (36%) of reproductive-age female respondents who use oral contraception have missed taking it on time because they were not able to get their next supply (Figure 1). The added convenience and time saved by obtaining oral contraception OTC instead of having to visit a doctor could reduce the share of women who miss taking their contraception on time.

More Than One-Third of Oral Contraceptive Users Have Missed Taking Their Birth Control Because They Weren’t Able to Get Their Next Supply

The nationally representative 2024 KFF Women’s Health Survey found that awareness of Opill is generally low, with just a quarter (26%) of women 18 to 49 saying they have heard of the new daily oral contraceptive pill (Figure 2). Compared to women ages 36 to 49 (24%), significantly larger shares of women ages 26 to 35 say they have heard of Opill. Smaller shares of Black (21%) and Hispanic (23%) women say they have heard of the new oral contraceptive compared to White women (29%).

Research suggest that OTC oral contraceptives can especially benefit populations who have historically faced barriers to accessing contraceptive care, such as young adults and adolescents, those who are uninsured, and those living in contraceptive deserts or areas with limited access to health centers offering the full range of contraceptive methods. However, smaller shares of women who are uninsured (17%) and who live in rural areas (21%) have heard of Opill compared to those with private insurance (29%) and those living in urban or suburban areas (27%).

A Quarter of Women Have Heard of Opill, the First Daily Contraceptive Pill Available Over-the-Counter

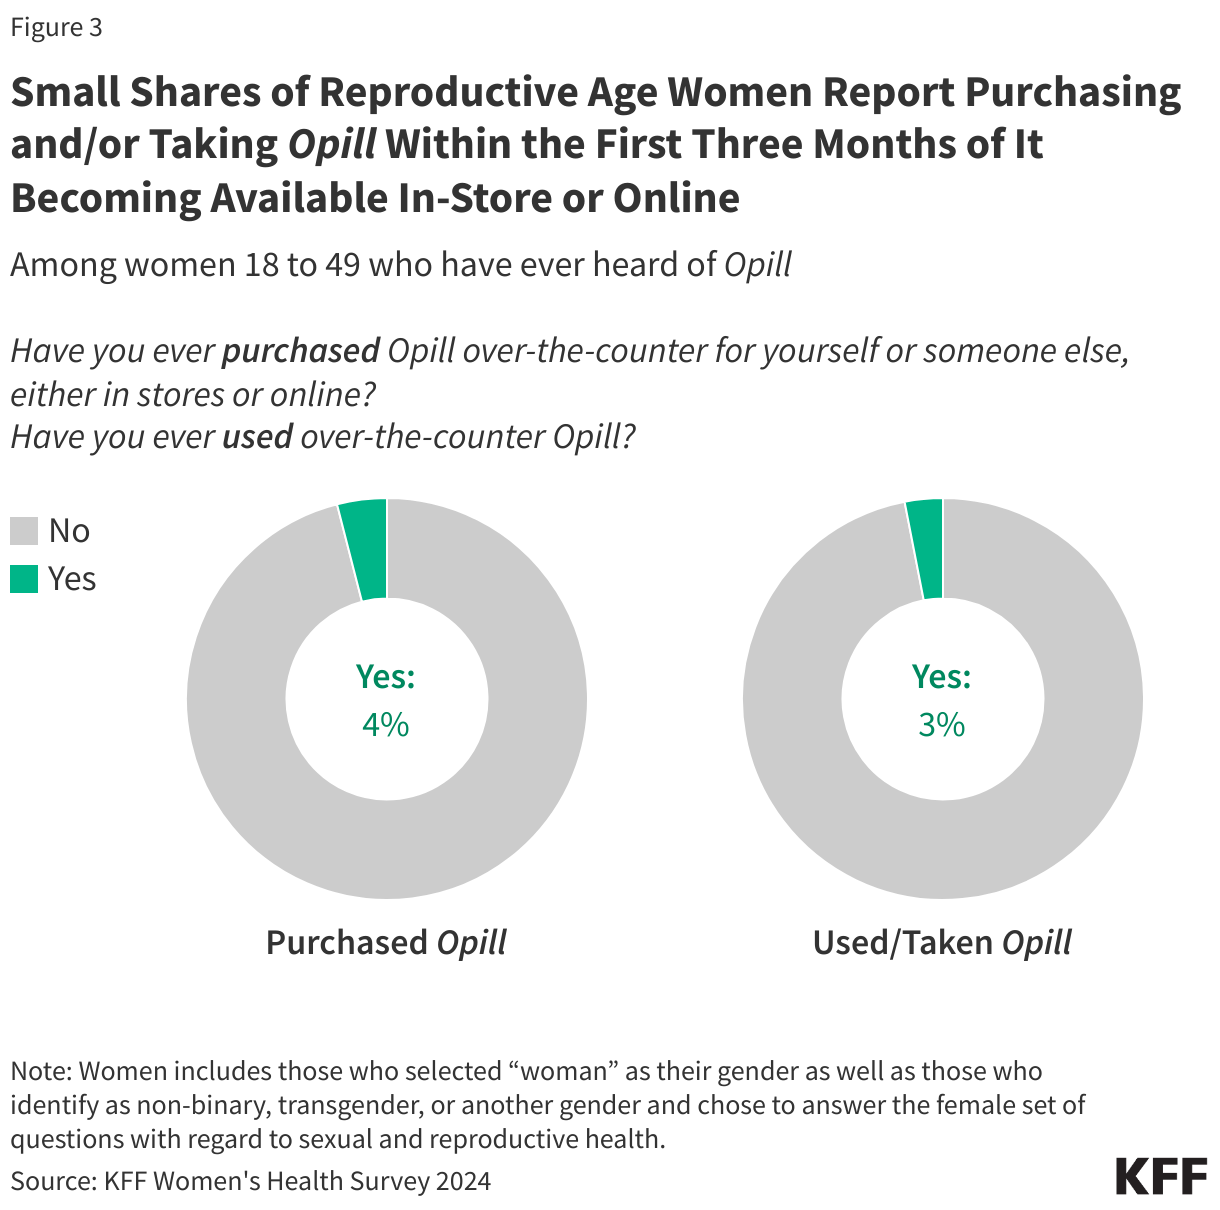
Among women 18 to 49 who have ever heard of Opill, just 4% say they have ever purchased the over-the-counter contraceptive pill for themselves or for someone else (Figure 3). An even smaller share (3%) say they have used or taken Opill since the contraceptive became available in stores and online earlier in 2024.

Small Shares of Reproductive Age Women Report Purchasing and/or Taking Opill Within the First Three Months of It Becoming Available In-Store or Online

A separate cross-sectional study from 2025 found that individuals who used an OTC oral contraceptive were more likely to be uninsured and reside in rural areas. The authors noted that many OTC oral contraceptive users previously used a less effective method or no method at all, suggesting that OTC availability could improve access to more effective birth control.

Levonorgestrel emergency contraceptive (EC) pills, known as “the morning after pill” and marketed as Plan B One-Step and other brands, are a form of backup birth control intended to be taken several days after unprotected sex or contraceptive failure. Levonorgestrel EC pills were the first hormonal contraception to have switched from prescription to OTC status, in 2006. Unlike daily oral contraceptives, emergency contraception is not intended for daily use and is FDA approved for use by women within 72 hours (3 days) after unprotected intercourse or contraceptive failure to prevent pregnancy.

Other contraceptive products that are available over the counter without a prescription include male and female condoms, spermicides, and contraceptive sponges. These contraceptive methods are less effective than oral contraception at preventing pregnancy. FDA’s approval of Opill makes it the most effective form of contraception available over the counter intended for regular use.

Federal Laws on OTC Contraceptive Coverage

Private Insurance

The Affordable Care Act (ACA) requires most private health plans (group and individual) to cover, without cost sharing, the full range of FDA-approved contraceptive methods, which includes oral contraceptive pills. The ACA tasks the Health Resources and Services Administration (HRSA) with coverage requirements for a range of preventive services for women, which now includes contraception, that must be covered by insurance. Right after the ACA was passed, HRSA tasked the Institute of Medicine (IOM) to identify gaps in preventive recommendations. This committee identified contraceptive services and supplies as one of the eight gaps in preventive health services to promote women’s health. The IOM recommended that all FDA-approved contraceptives be included as preventive services, and the HRSA coverage requirement for contraception included that they be covered “as prescribed,” which was reflected in the original guidance issued by the Obama administration in 2013.

Currently, HRSA has commissioned the Women’s Preventive Services Initiative (WPSI) as the expert body it relies on to update and expand preventive services coverage recommendations, which WPSI last updated in 2021. The current coverage requirement posted by HRSA no longer includes a prescription requirement for coverage of contraception, but the U.S. Departments of Labor, Health and Human Services, and Treasury (federal tri-agency) guidance has not been revised to drop the “as prescribed” requirement.

The prescription requirement is currently only mentioned in federal FAQs clarifying ACA coverage requirements, with the most recent one issued by the Biden administration in July 2022. The FAQ references coverage of emergency contraception and states that plans must cover OTC contraceptives when the product is prescribed. It also states that plans are “encouraged to cover OTC emergency contraceptives with no cost sharing when they are purchased without a prescription.”  In October 2024, the Biden administration proposed a new rule that would have broadened the ACA’s coverage requirements and, if finalized, would have required private insurers and states with ACA Medicaid expansion to cover OTC contraceptives without a prescription. However, the proposed regulation was withdrawn in January 2025, before the change in administration.

OTC medications and products do not require a prescription for purchase, but most people wishing to avoid cost-sharing for them need to obtain one. The prescription requirement re-introduces some of the same barriers that were intended to be reduced with OTC status such as eliminating the need to make and wait for a doctor appointment or find a pharmacy whose pharmacists are licensed and available to prescribe contraception (where permitted by state law).

Medicaid

Medicaid is the public health insurance program that covers approximately 20% of low-income children, adults, seniors, and people with disabilities. Medicaid is jointly financed by the federal government and the states. Federal statute sets broad minimum standards in exchange for federal matching funds and states have flexibility in determining other aspects of their Medicaid programs such as covered services and provider payment models.

Coverage for contraceptives is a key element in Medicaid coverage of family planning services. All states cover prescription drugs, even though it is technically an “optional” benefit category under federal law. Federal rules require state Medicaid programs that cover prescription drugs (including OTC drugs with a prescription) to cover all prescription drugs from manufacturers that have entered into a federal rebate agreement with the U.S. Secretary of Health and Human Services, though states may determine whether and how to employ utilization management controls. In order to obtain federal matching funds, a prescription is required for over-the-counter drugs and products.

Federal law also requires state Medicaid programs to cover family planning services and supplies without cost-sharing to enrollees. The federal Medicaid law does not define what services must be included and also does not explicitly cite OTC contraceptives as part of the coverage requirement, but most state Medicaid programs cover a range of contraceptive methods, and some cover OTC methods. The ACA requires states to cover at least one form of all 18 FDA-approved contraceptive methods for enrollees who qualify through the ACA’s Medicaid expansion. In general, these services are defined and determined by the states within broad federal guidelines.

With few exceptions (such as prenatal vitamins, fluoride preparations for pregnant people, and tobacco cessation products), federal law does not require states to cover OTC drugs and products in their Medicaid programs. However, state Medicaid programs can opt to cover them by submitting a state plan amendment (SPA) to CMS, the federal agency that administers Medicaid in partnership with state Medicaid agencies. For example, CMS approved SPAs  Delaware, Montana, and Florida requesting to cover select OTC drugs generally. After obtaining approval from CMS to cover OTC products generally, states can choose which OTC products their program will cover. However, even when a drug is available to purchase without a prescription, enrollees usually need a prescription to obtain coverage under Medicaid and states cannot obtain federal matching dollars unless it is prescribed. If states wish to include coverage for OTC products without a prescription, state Medicaid programs may opt to use state-only funds.

State Laws on OTC Contraceptive Coverage

State-regulated private health insurance

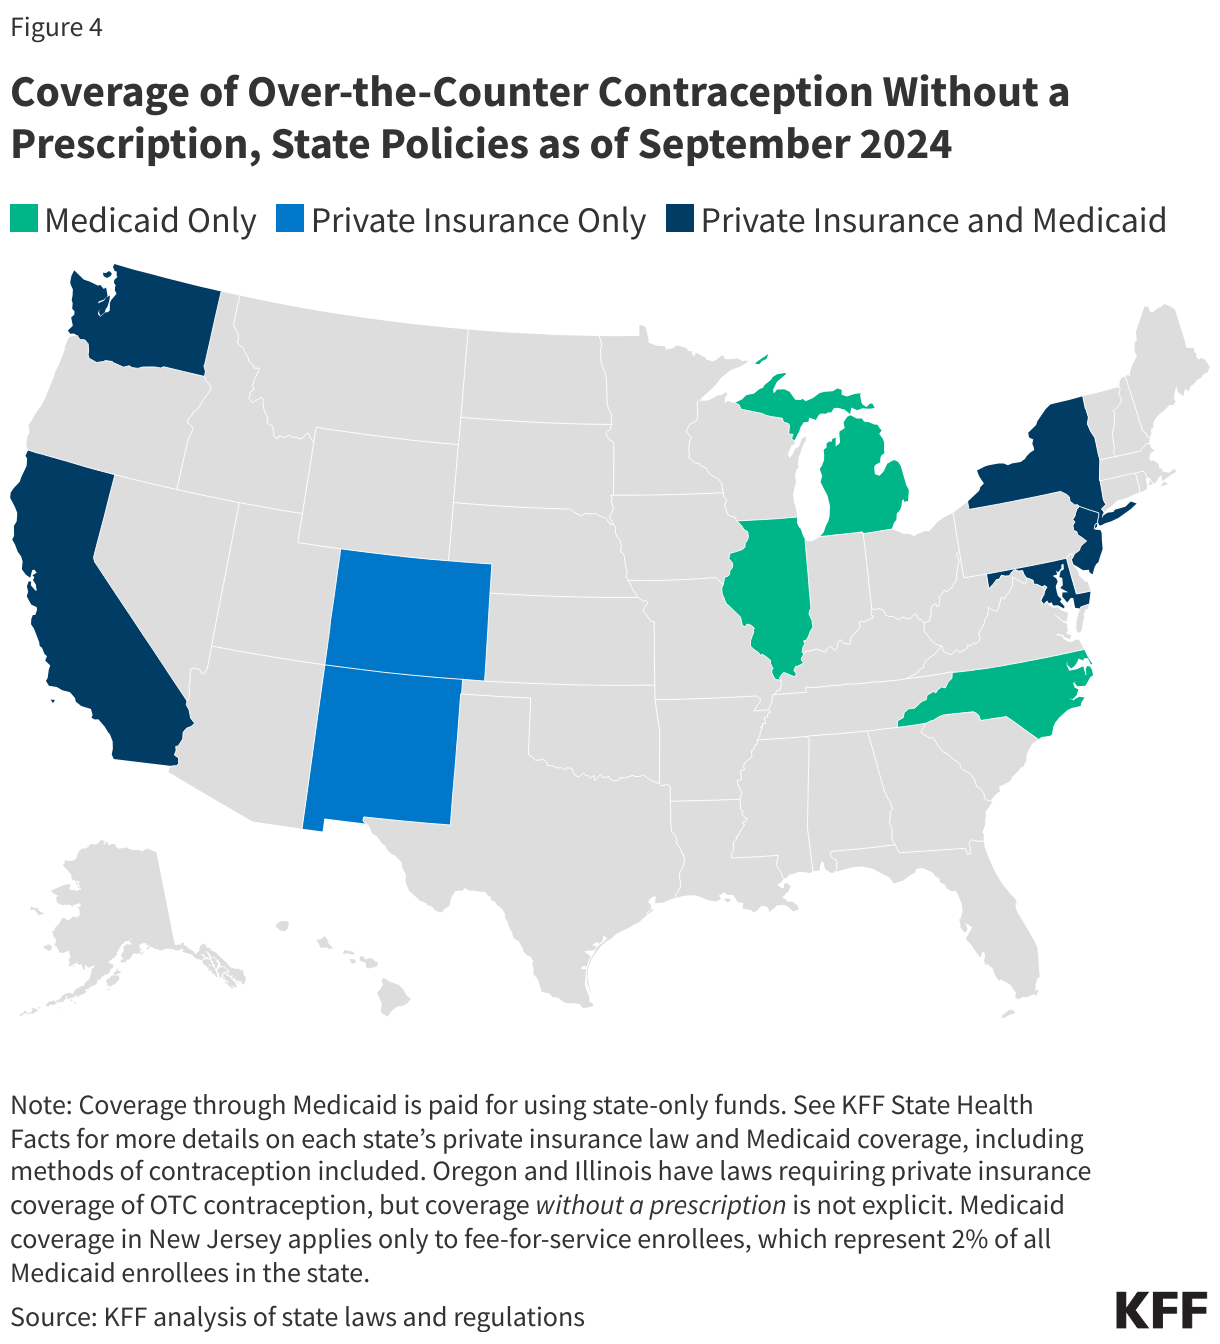
To reduce access barriers to OTC contraception while also avoiding cost sharing, nine states (CA, CO, DE, MD, ME, NJ, NM, NY, and WA) have laws or regulations requiring state-regulated private health insurance plans (individual, small group, and large group markets) to cover, without cost sharing, at least some methods of OTC contraception without a prescription (Figure 4). With the exception of New York, which applies only to emergency contraception, the language of these laws is broad enough to encompass an OTC daily oral contraceptive such as Opill without a change in policy. (See KFF State Health Facts for more details on each state’s law, including contraceptive methods covered.)

Illinois and Oregon require private health plans to cover OTC contraception; however, while the laws do not state that a prescription is required in order for it to be covered by insurance, the laws also do not explicitly stipulate that plans must cover them without a prescription. Massachusetts requires private plans to cover OTC emergency contraception with a prescription or pursuant to a standing order or protocol. A standing order allows a physician of a state health department or other state agency to authorize pharmacists to prescribe drugs or provide care under certain conditions set forth in the order.

While federal law applies to all plans, state law applies to only individual plans and fully-insured group plans. Therefore, many people who live in states that require coverage of OTC contraception without a prescription may not have this coverage if they are enrolled in a self-funded employer-sponsored health plan (67% of covered workers nationally).

Coverage of Over-the-Counter Contraception Without a Prescription, State Policies as of February 2026 (Choropleth map)

Medicaid

To increase access to contraception, eight states (CA, IL, MD, MI, NC, NJ, NY, and WA) have opted to use state-only funds to cover at least some methods of OTC contraception for their Medicaid enrollees (primarily emergency contraception) without a prescription (Figure 4). With the exception of California and North Carolina, the language of these state-level policies does not appear broad enough to encompass an OTC daily oral contraceptive pill such as Opill without a change in policy (See KFF State Health Facts for more details on each state’s policy, including contraceptive methods covered.)

Challenges to the Broad Adoption of OTC Oral Contraception

There are some limitations to the potential reach of an over-the-counter progestin-only pill (POPs). While both progestin-only pills and combined pills (COCs) are safe and effective at preventing pregnancy, POPs are believed to be slightly less effective than COCs. It is recommended that users of POPs take the pill at the same time every day, which could be a barrier for people who are not able or would forget to do this. However, there is limited evidence that adhering to this precise timeframe actually reduces the efficacy of POPs. Clinical guidelines state that users have a three-hour window to take the POPs before back-up contraception is needed, though there have been recent efforts to reevaluate these guidelines as some evidence suggests there is a larger margin of error for some POPs and people have more flexibility in when they can take their pills without affecting effectiveness.

Opill’s reach may be limited because few women who use oral contraceptive pills use POPs and instead opt to use COCs. Currently,  breastfeeding women are the primary users of POPs  because these pills are safe for this population, and they are not advised to use COCs during this time. Whether users of COCs will opt to switch to Opill for reasons such as convenience or cost is not yet known.

Additionally, retailers can choose whether and how to stock Opill. Retailers who choose to sell it will also decide which supply option (one, three, or six-month packs) to stock. As is the case with emergency contraception at many retailers who stock it, Opill could be kept in a locked case on the shelf or behind the pharmacy counter to reduce the chance of theft, which could create access barriers.

The extent to which over-the-counter oral contraception is accessible will depend, in large part, on affordability and coverage. The suggested retail price for Opill is $19.99 for one month’s supply,  $49.99 for three month’s supply, or $89.99 for a six month’s supply. KFF’s 2022 Women’s Health Survey found that 11% of women would not be willing or able to pay anything for an OTC oral contraceptive, and 39% would pay $1-$10 per month. Only 16% said they would pay more than $20 a month. Other research that asked specifically about a progestin-only pill found that adult women would be willing to pay $15 per month and teens ages 15-17 would pay $10.

Insurance coverage of OTC oral contraception without a prescription would eliminate out-of-pocket costs, but for those who prefer not to use their insurance or those who do not have insurance, the price point will matter. Furthermore, while some states require private plans and Medicaid to cover non-prescribed OTC contraception, not everyone in those states is entitled to this coverage. Absent federal guidance, guaranteed coverage of OTC oral contraception without a prescription will continue to depend on where people live and their type of health plan.

Racial Disparities in Life Expectancy

Authors: Nambi Ndugga, Latoya Hill, and Samantha Artiga
Published: Mar 6, 2026

Summary

Following the record declines in life expectancy amid the COVID-19 pandemic, life expectancy in the U.S. has rebounded but remains lower than that of comparable countries. Chronic diseases, homicide, and substance use disorders contribute to the U.S.’ lower life expectancy. While life expectancy is improving in the U.S., with 2024 estimates showing a return to pre-pandemic rates, racial and ethnic disparities persist.

This analysis examines trends in life expectancy between 2021 and 2023 by race and ethnicity as well as the drivers of life expectancy and leading causes of death by race and ethnicity. It is based on KFF analysis of National Center for Health Statistics data. While overall life expectancy data are available through 2024, the latest available data by race and ethnicity are as of 2023. Key takeaways include:

  • There was an increase in life expectancy between 2021 and 2023 across all racial and ethnic groups. American Indian and Alaska Native (AIAN) people experienced the largest increase in life expectancy of 4.5 years during this time, followed by Hispanic (3.5 years) and Black people (2.8 years).
  • Despite these increases, life expectancy was lowest for AIAN people at 70.1 years, followed by Black people, whose expectancy was 74 years as of 2023. In comparison, life expectancy was 78.4 years for White people and 81.3 years for Hispanic people. Life expectancy was highest for Asian people at 85.2 years. Data were not available for Native Hawaiian or Pacific Islander (NHPI) people.
  • The increases in life expectancy were largely driven by the decline in COVID-19 deaths, which disproportionately impacted groups of color during the pandemic. Although falling COVID-19 mortality was the primary contributor to the recent increase in life expectancy across groups, other contributors varied by race and ethnicity.

Multiple factors contribute to racial and ethnic differences in life expectancy, including differences in health insurance and access to care and social and economic factors that influence health. Some life expectancy patterns are not fully understood. Notably, Hispanic people have longer life expectancy than their White counterparts despite facing inequities typically associated with poorer health outcomes, which researchers have hypothesized may stem from better outcomes for some subgroups, particularly recent immigrants to the U.S. Measures of life expectancy for Asian people may mask underlying differences among subgroups of the population who vary across health access and social and economic factors.

Life expectancy at birth represents the average number of years a group of infants would live if they were to experience throughout life the age-specific death rates prevailing during a specified period. Life expectancy is one of the most used measures of population health, enabling comparisons in health status between countries, states, local communities, and demographic groups. Differences in life expectancy occur across a broad range of dimensions which often intersect with each other, including race, socioeconomic status, gender, geography, and other characteristics. For example, in the U.S. and all other comparable countries, men tend to have shorter life expectancy at birth than women. In 2024, life expectancy for women in the U.S. was 4.9 years higher than for men (81.4 years vs. 76.5 year, respectively), and similar gender disparities persisted within racial and ethnic groups. This analysis focuses on differences in life expectancy by race and ethnicity overall, but within racial and ethnic groups there is variation by these other factors.

Prior to COVID-19, life expectancy generally increased, with a peak in 2014 followed by small declines, with racial disparities persisting throughout. While gains in life expectancy were experienced across racial and ethnic groups, Black people have consistently had a lower life expectancy than White people, and Hispanic people have had a longer life expectancy. When life expectancy reached its peak in 2014, life expectancy for Black people was more than three years shorter than White people (75.3 vs. 78.8 years), and Hispanic people had a longer life expectancy at 82.1 years. Separate data were not reported for Asian, AIAN and NHPI people for this period. In 2018 and 2019, life expectancy remained relatively stable overall and across groups (Appendix Table 1).

Amid the COVID-19 pandemic life expectancy declined by 2.7 years and racial and ethnic disparities widened between the years 2019 and 2021 (Figure 1). Between 2019 and 2021, AIAN people experienced a decline of 6.6 years in life expectancy, the largest across racial and ethnic groups during that period, followed by Hispanic people at 4.2 years and Black people at 4.0 years. Declines were smaller for White (2.4 years) and Asian people (2.1 years). These declines widened gaps in life expectancy for AIAN and Black people compared to White people and reduced the advantage in life expectancy experienced by Hispanic people relative to White people.
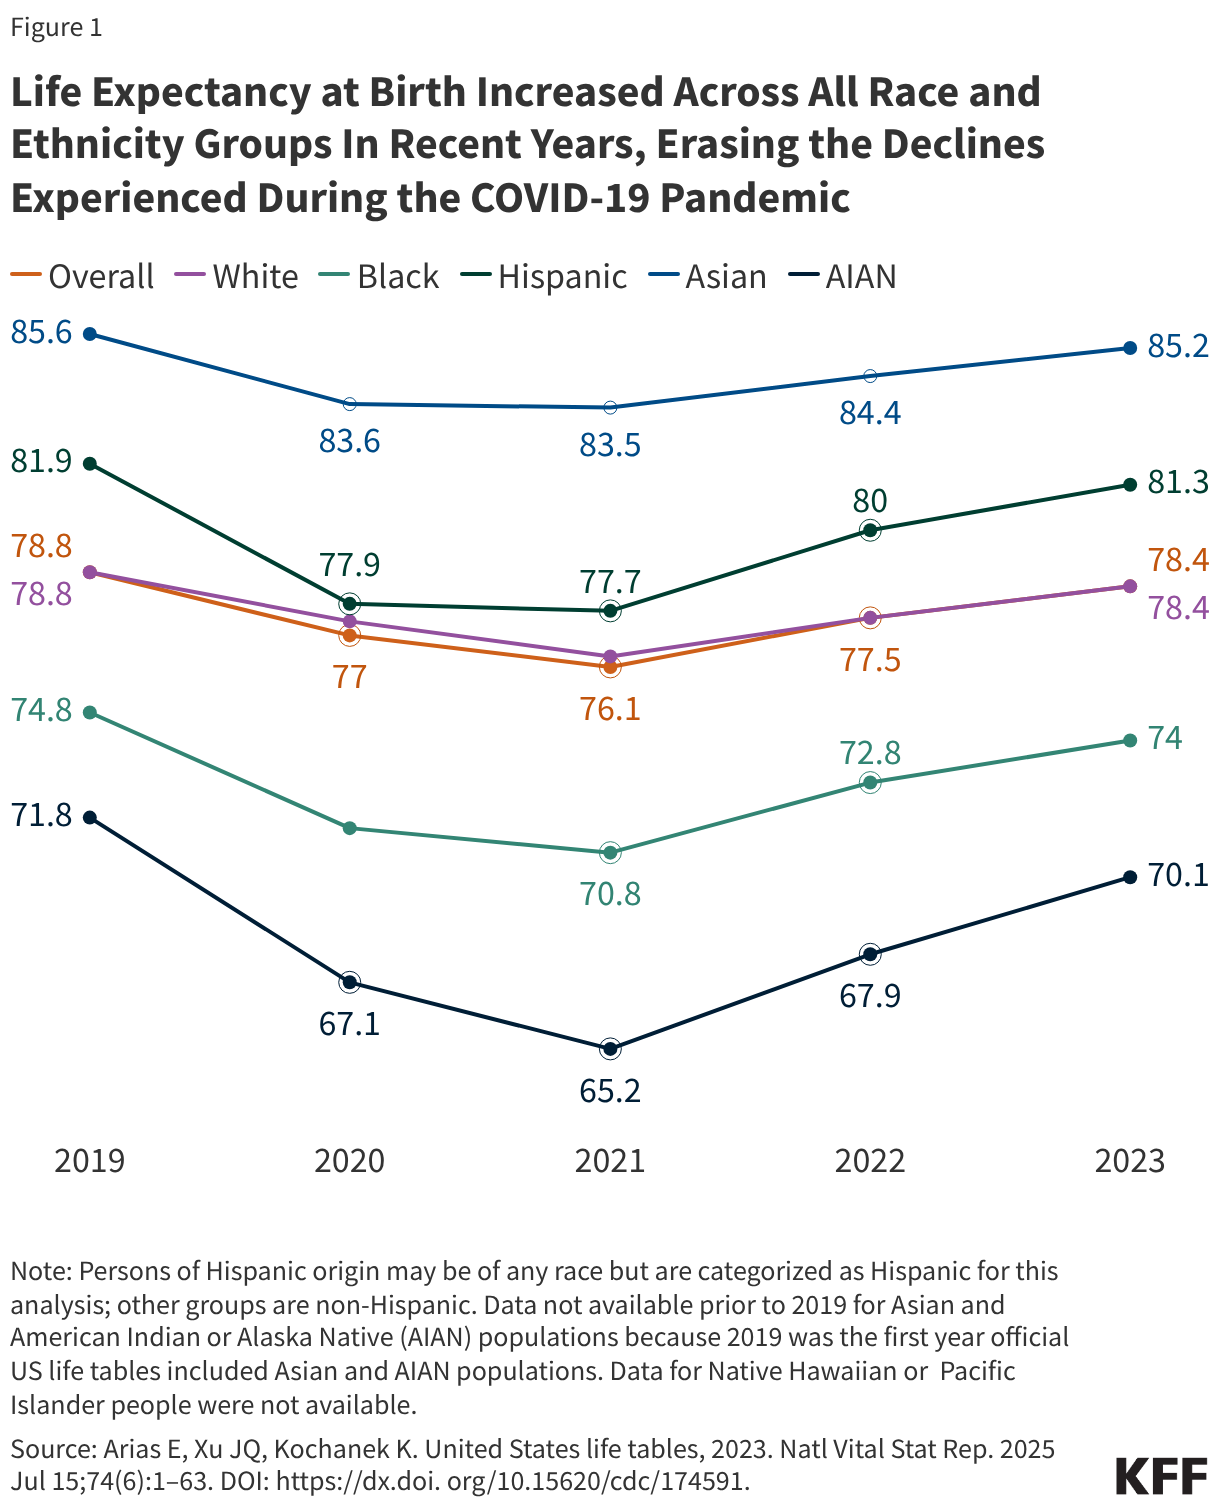
Life Expectancy at Birth Increased Across All Race and Ethnicity Groups In Recent Years, Erasing the Declines Experienced During the COVID-19 Pandemic (Line chart)

Following the COVID-19 pandemic, life expectancy increased and racial disparities narrowed. Between 2021 and 2023 there was an increase of 2.3 years in life expectancy, largely erasing the decline experienced during the pandemic. Gains in life expectancy were larger for most racial and ethnic groups between 2021 and 2022 compared to 2022 and 2023, reflecting the large drop in COVID-19 deaths in these years. Between 2021 and 2022, there were larger increases in life expectancy for AIAN (2.6 years), Hispanic (2.3 years), and Black (2 years) people compared to White (1.1 years) and Asian (0.9 years) people, narrowing the gaps in life expectancy. While the increases between 2022 and 2023 were smaller, the trends were similar with AIAN people having the largest gain (2.3 years), followed by Hispanic (1.3 years) and Black people (1.2 years), and smaller increases for White (0.9 years) and Asian (0.8 years) people. Overall life expectancy estimates for 2024 show an increase of 2.9 years (76.1 to 79.0 years) between 2021 and 2024, reversing the declines experienced during the COVID-19 pandemic. However, life expectancy data by race and ethnicity are not yet available for 2024.

Causes of Recent Life Expectancy Changes

The pandemic resulted in higher mortality rates, which drove rapid declines in life expectancy between 2019 and 2021. COVID-19 was the largest contributor to the decline in life expectancy for AIAN, Black, and White people and was the second largest contributor for Hispanic and Asian people, in 2020 and 2021. While COVID-19 was a major cause of death during the pandemic, it was the third leading cause of death in both 2020 and 2021, following heart disease and cancer. The variation in declines across racial and ethnic groups reflected underlying social and economic factors that affected communities’ exposure to the virus and subsequent access to COVID-19 vaccinations and treatment options.

The increase in life expectancy since 2021 largely reflects a decline in deaths due to COVID-19, which disproportionately affected AIAN, Black, and Hispanic people. As COVID-19 mortality fell, life expectancy rebounded among most groups, with larger increases among those that experienced the largest losses. Previous KFF analysis found that people of color accounted for 59% of excess years of life lost during the pandemic, despite making up 40% of the population. Research shows that between 2022 and 2023 falling COVID-19 deaths accounted for 56.9% of the increase in life expectancy for Hispanic people, 50.9% for Asian people, 50% for White people, 48.3% for Black people and 41.9% for Asian people. The magnitude of gains varied across groups, reflecting both the scale of each group's pandemic-era losses and the degree to which other causes of death contributed to or offset the recovery.

Beyond declines in COVID-19 deaths, decreases in other causes of death also contributed to life expectancy gains across racial and ethnic groups. AIAN people experienced the largest overall increases in life expectancy in 2023, driven not only by falling COVID-19 mortality but also declines in deaths due to chronic liver disease, heart disease, diabetes, and accidents. Hispanic people saw the second largest increase, reflecting declines in COVID-19, heart disease, cancer, diabetes, and Alzheimer disease, though increases in deaths related to perinatal conditions, suicide, and nutritional deficiencies tempered overall gains.For Black people, declines in COVID-19, heart disease, homicide, diabetes, and cancer drove improvements, partially offset by rising deaths due to suicide, birth defects, nutritional deficiencies, and certain other conditions. Among White people, reductions in COVID-19, heart disease, unintentional injuries, diabetes, and cancer contributed to gains, but increases in deaths from nutritional deficiencies, Parkinson disease, and several infectious diseases limited progress. Asian people experienced the smallest increase, with declines in COVID-19, heart disease, cancer, stroke, and Alzheimer disease offset by increases in deaths from birth defects, flu and pneumonia, septicemia, nutritional deficiencies, and homicide.

As in prior years, the leading causes of death in 2023 continued to vary by race and ethnicity, with the most significant change since 2021 being the disappearance of COVID-19 from the top causes of death (Table 1). In 2021, COVID-19 ranked among the top three leading causes of death across every racial and ethnic group. By 2023, it had fallen to eighth place among White people and dropped out of the top ten entirely for all other groups. Heart disease and cancer reemerged as the top two causes of death across nearly all groups, restoring a pre-pandemic mortality pattern. Among AIAN people, accidents and drug overdoses ranked third and liver disease fourth. Deaths by suicide were a significant contributor to deaths among AIAN people, ranking eighth in 2023. Other recent data show particularly high rates of opioid overdose deaths, alcohol use disorder related deaths and deaths by suicide among AIAN people compared to other groups. Among Black people, homicide remained the sixth leading cause of death in 2023, reflecting disparities in gun violence.
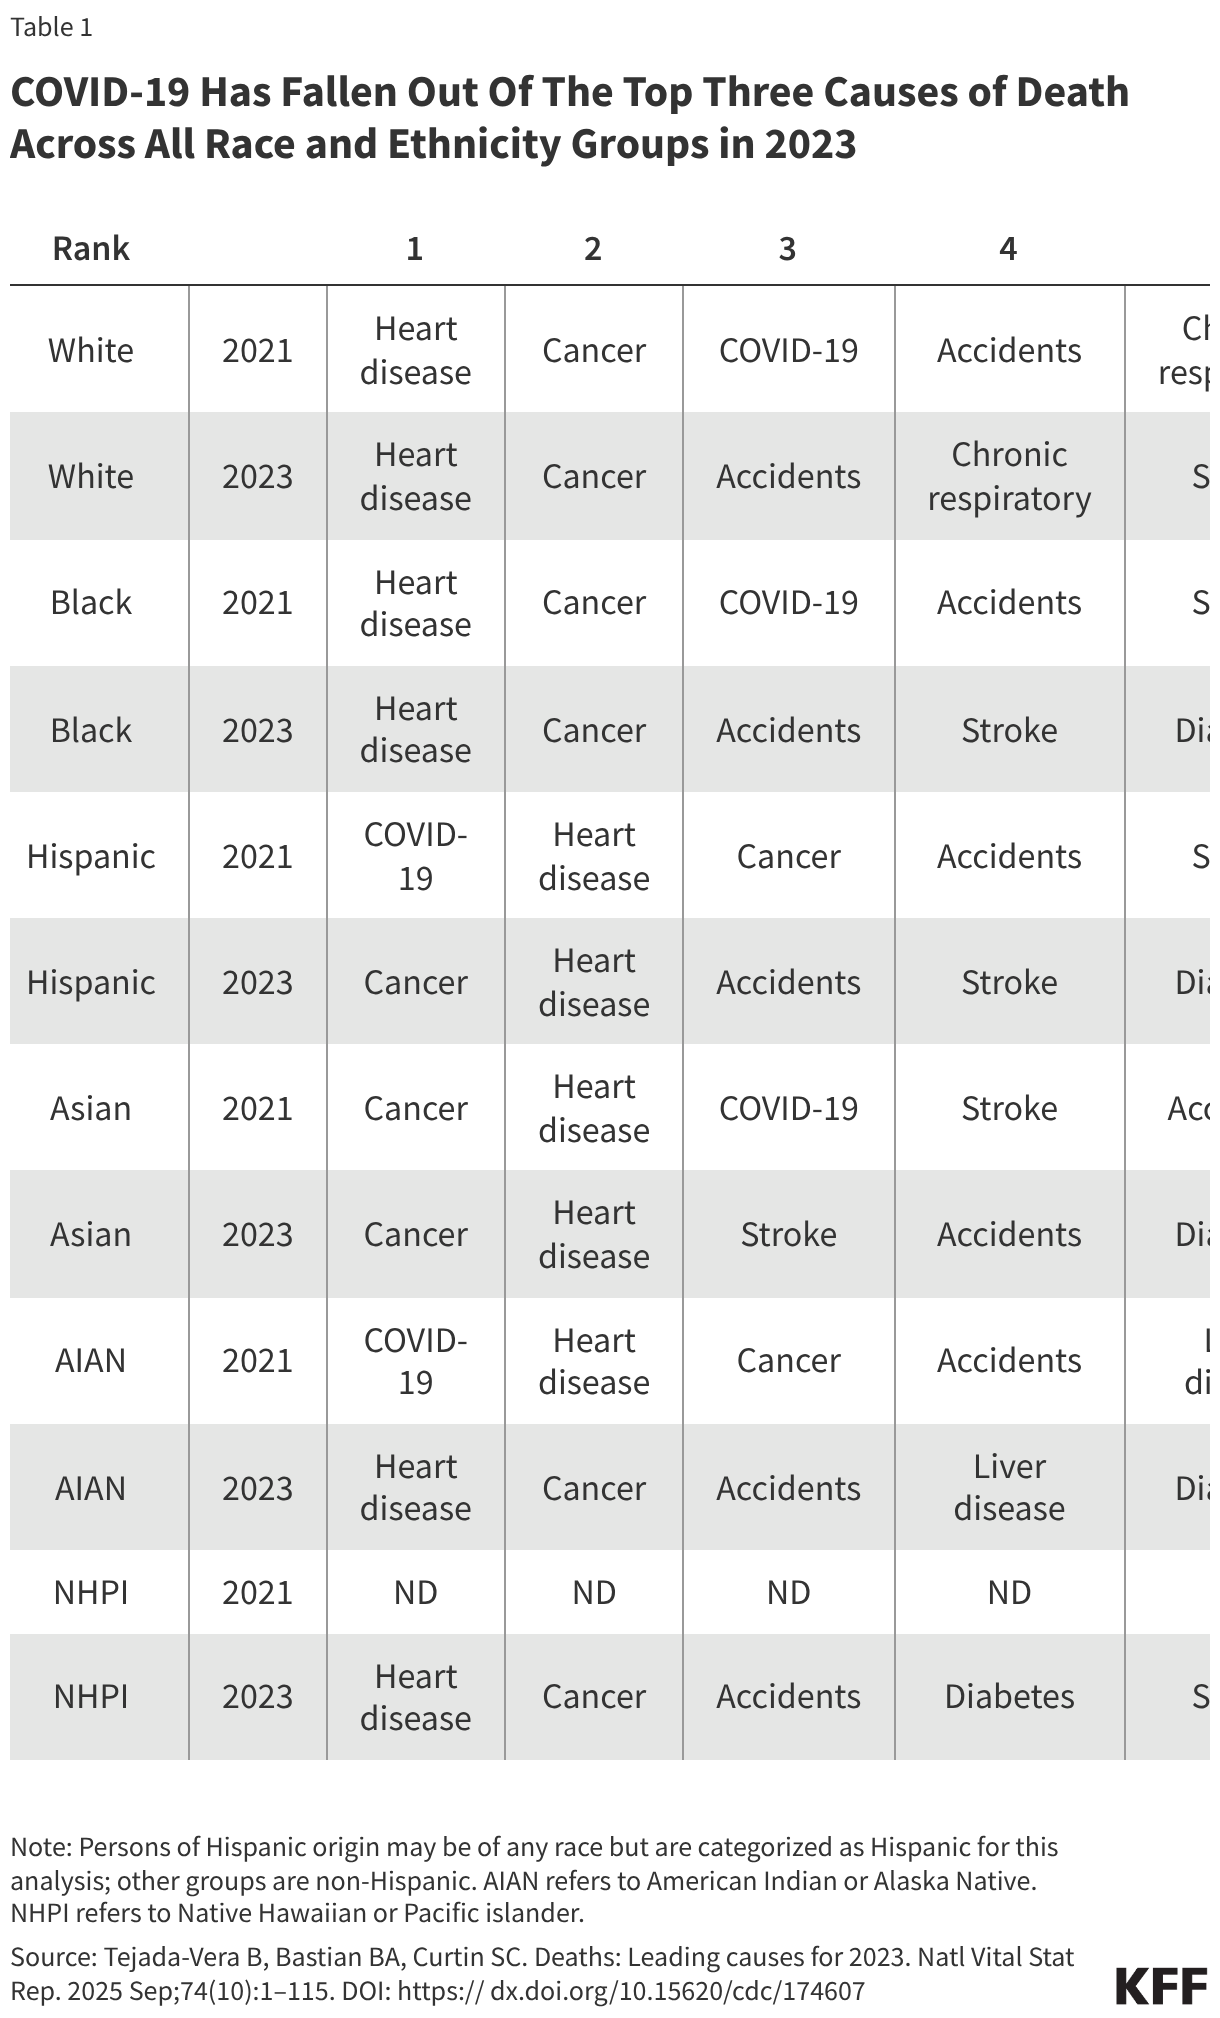
COVID-19 Has Fallen Out Of The Top Three Causes of Death Across All Race and Ethnicity Groups in 2023 (Table)

Research suggests that the factors driving disparities in life expectancy are complex and multifactorial. They include differences in health insurance coverage and access to care, social and economic factors, and health behaviors that are rooted in structural and systemic racism and discrimination. Data show that people of color are less likely to have health insurance and more likely to face barriers to accessing care, such as not having a usual source of care. Among AIAN people, chronic underfunding of the Indian Health Service further contributes to barriers to health care. Research shows that, overall, uninsured people are more likely than those with insurance to go without needed medical care due to cost and less likely to receive preventive care and services. Research further shows that uninsured people have higher mortality rates and lower survival rates than people with insurance.Hispanic, AIAN, and Black people are more likely to have lower incomes and educational attainment levels compared to White people, and studies find that people with higher incomes and more education live longer lives. Other social and economic factors may also affect life expectancy. For example, historic housing policies, including redlining, and ongoing economic inequities have resulted in residential segregation that pushed many low-income people and people of color into segregated urban neighborhoods.Research finds that living in racially segregated neighborhoods is associated with shorter life expectancy and higher mortality rates for Black people.

Some life expectancy patterns are not fully understood or observable in the data presented. Notably, Hispanic people have longer life expectancy than their White counterparts despite experiencing increased barriers to accessing health care and social and economic challenges typically associated with poorer health outcomes. Researchers have hypothesized that this finding, sometimes referred to as the Hispanic or Latino health paradox, in part, may stem from variation in outcomes among subgroups of Hispanic people by origin, nativity, and race, with better outcomes for some groups, particularly recent immigrants to the U.S. However, the findings still are not fully understood. Measures of life expectancy for Asian people as a broad group may mask underlying differences among subgroups of the population who vary across health access and social and economic factors. Research has shown variation in life expectancy among Asian subgroups, with Chinese people having the longest life expectancy and Vietnamese people having the shortest life expectancy, which may in part reflect differences in socioeconomic status. Additionally, data limitations for NHPI people prevented the ability to include them in this analysis. Efforts to expand and improve data collection for NHPI people will be important to gain a better understanding of their experiences, particularly since they suffered disproportionate impacts on mortality from COVID-19.
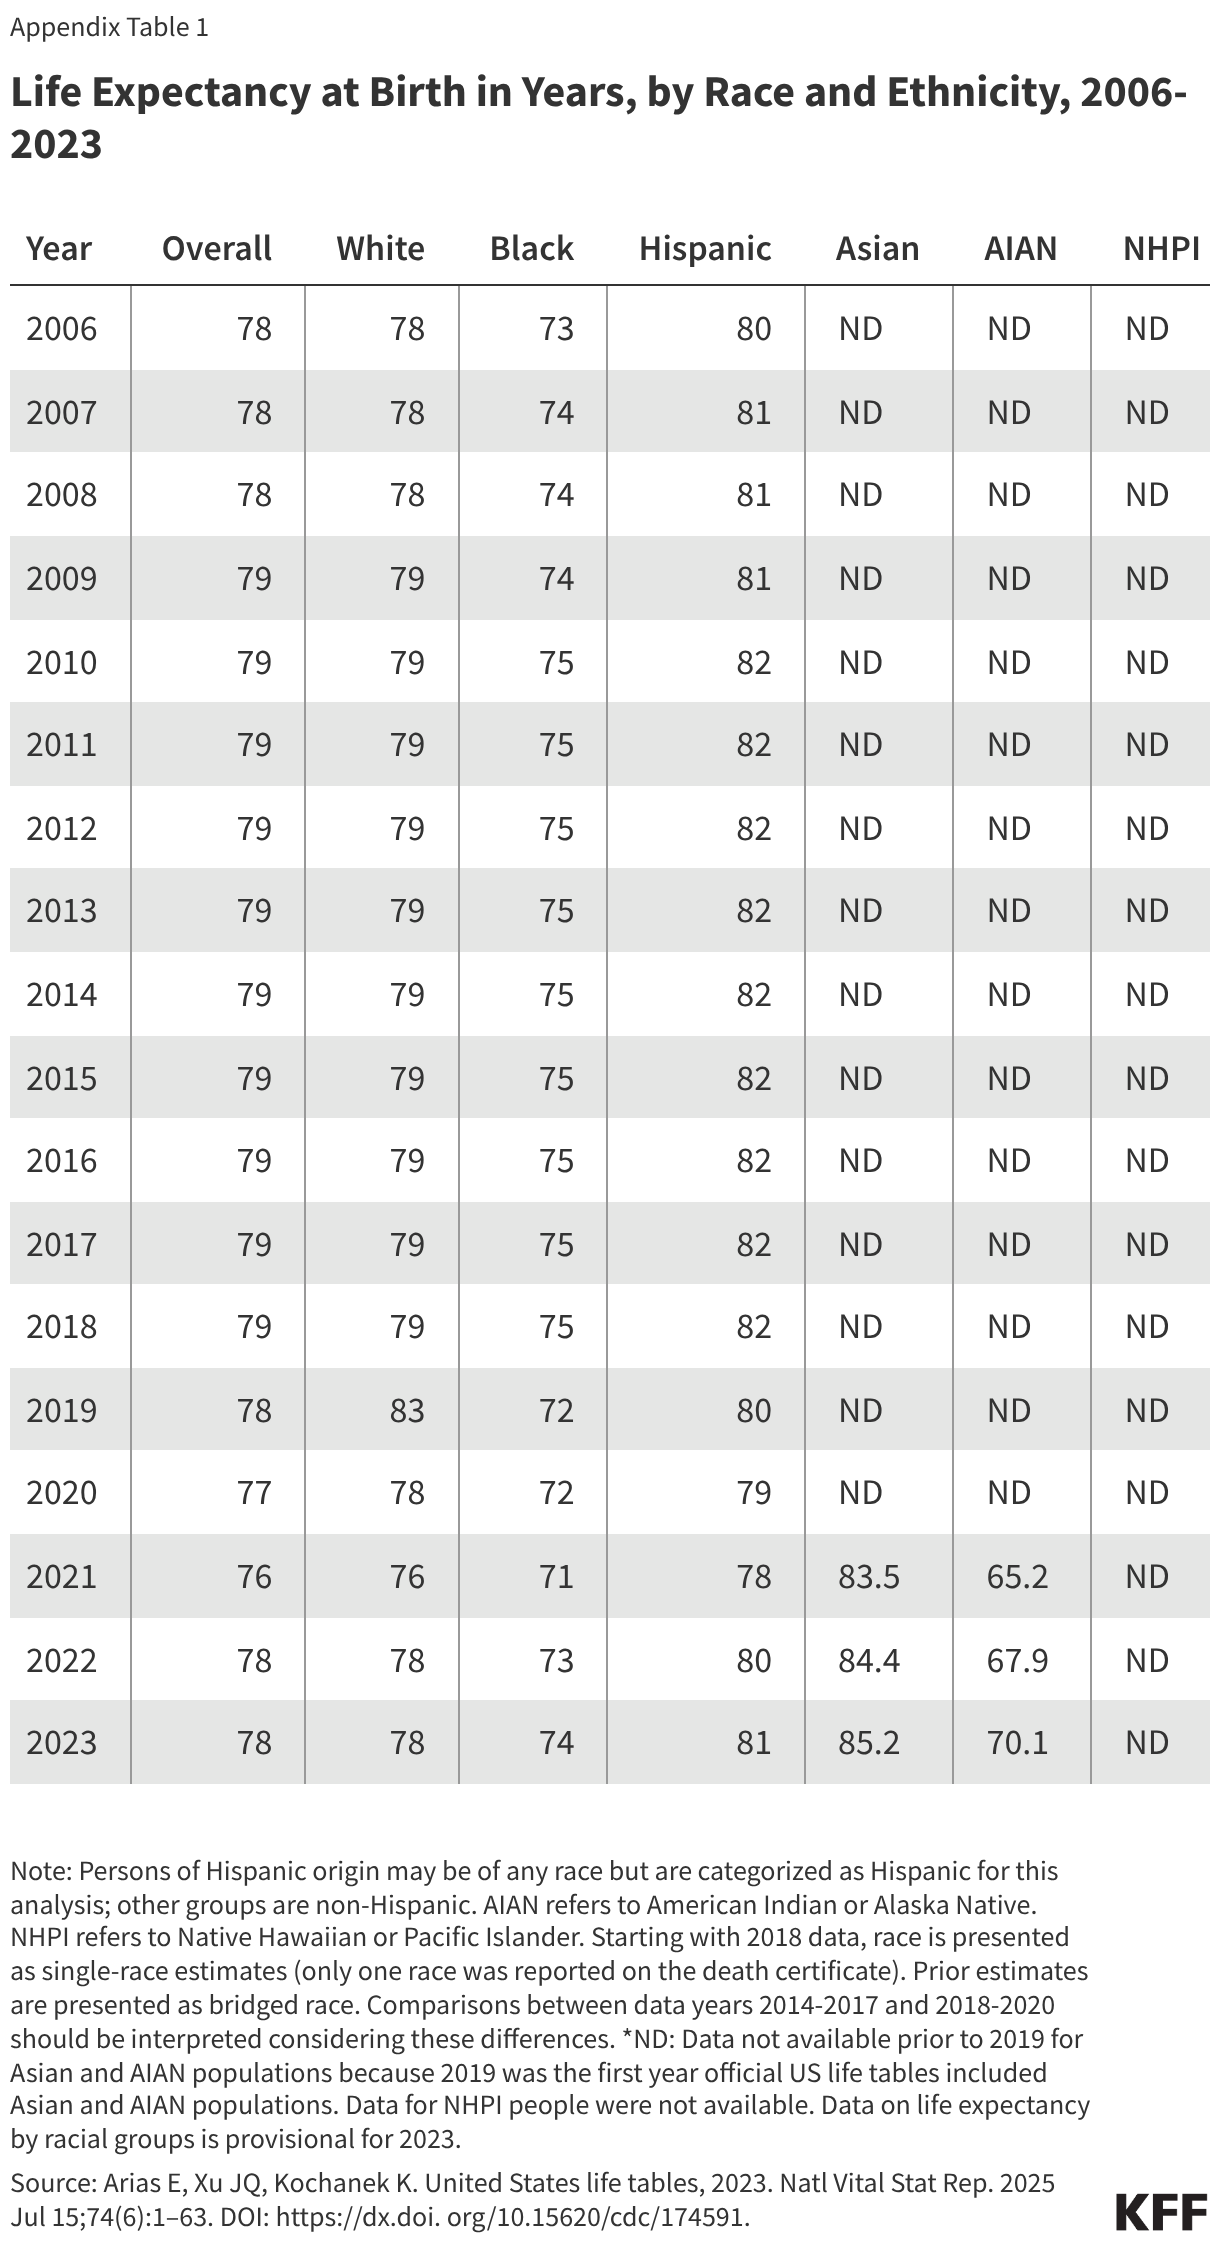
Life Expectancy at Birth in Years, by Race and Ethnicity, 2006-2023 (Table)

Medicaid Workers and Job-Based Insurance: Who Is Offered, Eligible, and Enrolled?

Published: Mar 5, 2026

Passage of the 2025 reconciliation law, also known as the “One Big, Beautiful Bill,” in July 2025 and the inclusion of new work requirements for certain Medicaid enrollees in the law focused attention on the work status of adults enrolled in the program as well as their access to job-based insurance. Most adults who will be subject to the new Medicaid work requirements are already working. These adult workers rely on Medicaid because most work in jobs that do not offer health coverage or are not eligible for the offered coverage. While employer-sponsored insurance is the main source of coverage for working-age adults in the United States, access to job-based coverage is more limited for low-wage workers, those who work in certain industries, part-time workers, and those who work at smaller firms. Many employers— small and large— report that Medicaid provides important access to health care to their employees.

New work requirements are unlikely to increase employment (as most Medicaid adults are working or face barriers to work). Given the limited offers and eligibility for job-based coverage for low-wage workers, the new requirements are also not likely to substantially reduce reliance on Medicaid as a source of coverage for those workers. However, these requirements will likely reduce Medicaid enrollment because even some enrollees who are working will be unable to verify their work status.

Using data from the 2025 Current Population Survey Annual Social and Economic Supplement (CPS ASEC), this analysis examines the availability of job-based insurance in 2024 for adult Medicaid workers ages 19 to 64 and explores the reasons why Medicaid adults who are working are not eligible for employer coverage, and if eligible, why they do not take up the offer. The analysis excludes Medicaid adults who are self-employed, are also enrolled in Medicare, receive disability-related payments from Supplemental Security Income (SSI) or Social Security Disability Insurance (SSDI) and focuses on states that have adopted the Medicaid expansion and Wisconsin, which has adopted a partial expansion. Medicaid adults enrolled through the expansion, or partial expansion in Wisconsin, will be subject to the new work requirements. Georgia is excluded from the analysis because enrollment in the Pathways to Coverage Program is too small to be captured in the data. This analysis does not attempt to identify adults who would be subject to work requirements. It covers a broader group of Medicaid enrollees, including adults with dependent children, some of whom may be exempt.

Most Medicaid adult workers work for an employer that does not offer job-based insurance or are not eligible if their employer offers coverage. For workers to enroll in job-based insurance, they need to work for an employer that offers coverage and be eligible to enroll in that coverage. Nearly two-thirds (65%) of Medicaid adult workers in expansion states and Wisconsin either work for an employer that does not offer health coverage (52%) or are not eligible for coverage that is offered by their employer (13%) (Figure 1). In contrast, about one in five (21%) adult workers who are not covered by Medicaid in the same states are not offered (16%) or eligible (5%) for coverage offered by their employer.

About a quarter (26%) of adult Medicaid workers decline coverage when they are eligible compared to 17% of adult workers not covered by Medicaid. Many adult workers who are eligible for job-based insurance do not take up the offer because the coverage is unaffordable (Appendix Table 1). For adult Medicaid workers who did not enroll in job-based coverage, Medicaid likely provides coverage that is more affordable, and in some cases, more comprehensive than the health insurance available through their employer.

About one in ten (9%) adult Medicaid workers take up coverage offered by their employer and are covered by both Medicaid and the employer plan. In these cases, Medicaid provides wrap-around coverage, covering premiums and cost sharing, as well as providing coverage for benefits not included in the employer plan.

Even when adult Medicaid workers in low-wage jobs have access to job-based insurance, the employee share of the costs can be unaffordable. Workers in firms with many lower-wage workers (where at least 35% earn $37,000 or less annually) have higher average contribution rates toward their premium for family and single coverage compared to workers at firms with fewer low-wage workers (31% vs 26% for family coverage and 19% vs 16% for single coverage). These higher contributions likely mean low-income families with job-based coverage spend a greater share of their income on health costs overall (premium contributions and out-of-pocket expenses) than those with higher incomes, which may contribute to decisions not to enroll in the offered coverage.

Most Medicaid Adults Work for an Employer That Does Not Offer Job-Based Insurance or Are Not Eligible if Their Employer Offers Coverage (Stacked column chart)

Medicaid adults who work part time are less likely to be eligible for job-based insurance than those who work full time. About one-third (32%) of adult Medicaid workers work part time, and among these part-time workers, one in five (21%) are eligible for coverage from their employer compared to 42% of those who work full time (Figure 2). Under the Affordable Care Act’s shared responsibility mandate, employers with at least 50 full-time equivalent employees are required to provide minimum essential coverage to employees, but that requirement only extends to employees who work an average of at least 30 hours per week. As a result, among firms that offer health benefits, relatively few offer benefits to part-time workers.

Medicaid Adults Who Work Part Time Are Less Likely to be Eligible For Job-Based Insurance Than Full-Time Workers (Stacked column chart)

Eligibility for job-based insurance among adult Medicaid workers varies by industry. The share of adult Medicaid workers eligible for job-based insurance varies from 56% in the mining industry to 20% in the agricultural and forestry industry (Figure 3). Medicaid adults working in educational and health services industry represent nearly a quarter (23%) of adult Medicaid workers and 41% are eligible for job-based insurance. On the other hand, about one in six (16%) adult Medicaid workers have jobs in the leisure and hospitality industry where only 22% are eligible for employer-based insurance.

Eligibility for Job-Based Insurance Among Adult Medicaid Workers Varies by Industry (Table)

Among adult Medicaid workers who are offered insurance by their employer, most are not eligible because they do not work enough hours. About one in eight (13%) adult Medicaid workers work for an employer that offers health insurance but are not eligible (Figure 1). Nearly seven in ten (69%) of these workers reported they were not eligible because they did not work enough hours per week or weeks per year to qualify (Figure 4). About one in ten (13%) Medicaid workers were not eligible because they had not worked for the employer long enough, and another 5% said they were not eligible because contract and temporary employers were not allowed in the employer’s health plan.

Among Adult Medicaid Workers Who Are Offered Insurance by Their Employer, Most Are Not Eligible Because They Do Not Work Enough Hours (Pie Chart)
Reasons for Not Taking Up Job-Based Coverage Among Adult Workers Covered By Medicaid and Those Not Covered by Medicaid (Table)

How States Verify Citizenship and Immigration Status in Medicaid

Published: Mar 4, 2026

Editorial Note

This brief was updated on March 4, 2026 to include changes related to the 2025 reconciliation law and new federal Medicaid reverification requirements.

Medicaid is the primary program providing comprehensive coverage of health and long-term care to over 81 million low-income people in the U.S. Medicaid is jointly financed by states and the federal government but administered by states within broad federal rules. In addition to meeting federal and state income and residency requirements, eligibility for coverage under Medicaid and the Children’s Health Insurance Program (CHIP) is limited to U.S. citizens and certain lawfully present immigrants. Starting October 1, 2026, the 2025 reconciliation law will further restrict lawfully present immigrant eligibility for Medicaid and CHIP. Federal Medicaid funds cannot be used to cover undocumented immigrants. Undocumented immigrants also are excluded from other federally funded health programs, including Medicare and the Affordable Care Act (ACA) Marketplaces.

On February 19, 2025, the Trump administration issued an executive order to “end taxpayer subsidization of open borders”, which includes language calling for enhanced verification systems to ensure taxpayer-funded benefits exclude unauthorized immigrants and requires federal agencies to identify sources of federal funding for undocumented immigrants. Current federal rules require states to verify an applicant’s eligible immigration status through the Department of Homeland Security (DHS) as part of the process for determining Medicaid eligibility. On August 19, 2025, the Centers for Medicaid and Medicare Services (CMS) announced a new initiative to require states to reverify whether certain individuals enrolled in Medicaid are citizens or have a satisfactory immigration status. This reverification process may increase administrative burdens for states and lead to coverage losses among eligible individuals due to administrative barriers. This brief describes federal citizenship and immigration status eligibility and eligibility verification requirements for Medicaid and the new reverification requirements.

What are Medicaid eligibility requirements for immigrants?

Federal rules limit Medicaid and Children’s Health Insurance Program (CHIP) eligibility to U.S. citizens and certain lawfully present immigrants; undocumented immigrants are not eligible for federally funded coverage. In general, in addition to meeting other eligibility requirements, lawfully present immigrants must have a “qualified non-citizen” status to be eligible for Medicaid or CHIP (Table 1), and many, including most lawful permanent residents or “green card” holders, must wait five years after obtaining qualified status before they may enroll. These immigrants may enroll in Marketplace coverage and receive subsidies during this five-year waiting period. Some immigrants with qualified status, such as asylees and refugees, do not have to wait five years to enroll in Medicaid and CHIP coverage. Some immigrants, such as those with temporary protected status, are lawfully present but do not have a qualified status and are not eligible for Medicaid and CHIP coverage even after a five-year wait. The Trump administration reversed Biden administration actions that had expanded ACA Marketplace coverage to Deferred Action for Childhood Arrivals (DACA) recipients, once again making them ineligible to purchase ACA Marketplace coverage effective August 25, 2025. States have the option to cover lawfully residing children and pregnant people in Medicaid or CHIP without the five-year waiting period otherwise known as the Immigrant Children’s Health Improvement Act (ICHIA) option. States can also provide prenatal care and pregnancy-related benefits to targeted low-income children beginning at conception through the CHIP From-Conception-to-End-of-Pregnancy (FCEP) option regardless of their parent’s citizenship or immigration status. Some states provide fully state-funded coverage to fill gaps in coverage for immigrants, including lawfully present immigrants and undocumented immigrants.

The 2025 reconciliation law will further restrict lawfully present immigrant eligibility for Medicaid and CHIP. Starting October 1, 2026, the 2025 reconciliation law will restrict immigrant Medicaid and CHIP eligibility to lawful permanent residents (LPRs) (i.e., “green card” holders), Cuban and Haitian entrants, people residing in the U.S. as citizens of the Freely Associated (COFA) nations of the Marshall Islands, Micronesia, and Palau, and lawfully residing children and pregnant immigrants in states that cover them under the Medicaid or CHIP option (Table 1). States also will still have the option to extend prenatal and pregnancy-related benefits to targeted low-income children from conception through the end of pregnancy through the FCEP option. These restrictions will eliminate eligibility for many other groups of lawfully present immigrants, including refugees and asylees without a green card, among others.

Eligible Immigration Statuses for Medicaid and CHIP (Table)

Emergency Medicaid reimburses hospitals for emergency care provided to individuals ineligible for Medicaid due to their immigration status. Emergency Medicaid spending reimburses hospitals for emergency care they are obligated to provide to individuals who meet other Medicaid eligibility requirements (such as income) but do not have an eligible immigration status, including undocumented immigrants and lawfully present immigrants who remain ineligible for Medicaid or CHIP. Emergency services include those requiring immediate attention to prevent death, serious harm or disability, although states have some discretion to determine reimbursable services. Spending on Emergency Medicaid accounts for less than 1% of total Medicaid expenditures. Without Emergency Medicaid, the costs of emergency care would be shifted to hospitals that are required to treat individuals in emergency situations or fully to states. Starting October 1, 2026, in states that have expanded Medicaid under the ACA, the 2025 reconciliation law will limit federal matching payments for Emergency Medicaid for individuals who would otherwise be eligible for expansion coverage except for their immigration status to the state’s regular federal Medicaid match rate (which ranges from 50% to 77%) as opposed to the expansion match rate (which is 90% in all states).

How do states verify citizenship and immigration status to determine Medicaid eligibility?

States must verify citizenship and immigration status with the Social Security Administration (SSA) and DHS to determine eligibility for Medicaid coverage at the initial application. Applicants who are U.S. citizens must provide documentation of citizenship, or states must verify the applicant’s Social Security number with the SSA. Applicants who are not U.S. citizens must provide documentation showing that they have a qualified immigration status eligible for Medicaid coverage (Figure 1). States verify immigration status through the DHS Systematic Alien Verification for Entitlements (SAVE) system, which can provide automatic real-time verification. If the system cannot provide real-time verification, the state must request an additional review and may request additional documentation of eligible immigration status from the applicant. Applicants cannot self-attest to having an eligible immigration status without documentation for the state, with the exception of qualified immigrants exempt from the five-year wait due to a military connection. Current federal rules prohibit states from requiring applicants to disclose the immigration status of non-applicants, such as household members, which is not relevant to eligibility determination, and under statute, the SAVE system cannot be used for non-criminal immigration enforcement.

States are required to provide Medicaid benefits to applicants during a “reasonable opportunity period” of 90 days while their immigration status is being verified, if they otherwise meet all eligibility criteria. The reasonable opportunity period is allowed when the SAVE system cannot verify immigration status in real time and the state needs to conduct additional review and collect additional documentation to verify the qualified immigration status. This period gives applicants the opportunity to correct information in SAVE or submit additional documentation in support of their application. States may extend the period if they need more time to complete verification or if applicants are attempting to correct issues with documentation. States are entitled to receive federal matching funds for expenditures for Medicaid services provided to individuals during the reasonable opportunity period, regardless of whether eligibility is ultimately verified. If states determine an applicant ineligible for Medicaid coverage due to their immigration status at any point during the reasonable opportunity period, they must terminate eligibility within 30 days. This may also occur if applicants do not provide additional requested documentation or correct any discrepancies in the application. Applicants have the right to dispute the state’s decision in a fair hearing process, but states are not required to provide Medicaid benefits during this time.

In some cases, states need to reverify immigration status as part of Medicaid annual redetermination of eligibility processes. States do not need to reverify immigration status for most enrollees during the annual renewal if that status is unlikely to change (e.g., the enrollee is a lawful permanent resident). However, immigrant children and pregnant people who have been lawfully residing in the U.S. for less than five years receiving coverage through the ICHIA option must have their immigration status re-verified at renewal. If, at any point during the coverage period, the state receives information about a change in an enrollee’s immigration status that might affect ongoing eligibility, the state is required to act on that change in circumstance to review eligibility and request additional documentation from the enrollee if needed. The 2025 reconciliation law will require states to conduct eligibility redeterminations at least every 6 months for Medicaid expansion adults for renewals scheduled on or after December 31, 2026.

On August 19, 2025, CMS announced a new initiative to require states to reverify whether certain individuals enrolled in Medicaid are citizens or have a satisfactory immigration status. CMS will use Transformed Medicaid Statistical Information System (T-MSIS) enrollment data to attempt to verify enrollee citizenship and immigration status in the SAVE system and send states a sample of Medicaid enrollees whose immigration status it could not verify. States are required to reverify the status of those individuals in accordance with current federal rules, including the requirement to provide a reasonable opportunity period, and disenroll individuals who do not verify a satisfactory immigration status.

These new reverification requirements may increase administrative burdens for states and may lead to coverage lapses among eligible individuals if they are unable to complete reverification-related requests from states. Under the new requirements, states will need to reverify eligible immigration status for individuals CMS identifies in the sample shared with states, which can include immigrants as well as citizens. For several reasons, the CMS process for identifying individuals in the sample may include individuals who do not need reverification, which will increase the administrative burden on states. For example, the sample may include people in the reasonable opportunity period who do not require immediate verification or those receiving Emergency Medicaid services only who do not need a qualified immigration status. In addition, the T-MSIS data used by CMS is at least 2-3 months behind that of state enrollment data, so CMS may flag enrollees that states have since verified or already removed from Medicaid. The CMS sample may also include citizens because the SAVE system may not be able to verify citizenship in certain cases if that information is not available in the databases that SAVE has access to, such as for naturalized citizens whose citizenship information may not be up-to-date with the SSA. This could result in states reverifying citizenship status for citizens even though citizenship is not typically reverified. Some individuals may lose coverage during the reverification process even if they are still eligible if they have trouble completing the process, for example, if they miss notices or face challenges submitting required documentation.

CMS will require states to share reports on eligibility redeterminations for individuals whose citizenship or satisfactory immigration status CMS was unable to verify through its data match. CMS will require each state to report back on reverifications using a standardized template on the procedures used, the outcomes of the states’ independent verification efforts, and resulting redeterminations. CMS may publish monthly, de-identified counts of individuals for whom federal verification was unsuccessful and may issue disallowances or deferrals of federal matching funds when states claim federal matching funds for services or administrative Medicaid expenditures associated with individuals for whom they could not verify a satisfactory immigration status. The new reporting requirements will increase administrative burdens for states that are already working to meet implementation requirements tied to the 2025 reconciliation law.

A Look at the Intersection of SNAP and Medicaid as States Implement Medicaid Work Requirements

Published: Mar 4, 2026

On July 4, President Trump signed the 2025 reconciliation law that makes significant changes to the Medicaid program, including new requirements for states to implement work requirements. Starting January 1, 2027, states must condition Medicaid eligibility on meeting work requirements for individuals enrolled through the Affordable Care Act (ACA) Medicaid expansion pathway and through certain state waivers. To ease the burden on individuals, the law directs states to use available information “where possible” to verify compliance with Medicaid work activities or exemption status, without requiring additional documentation from individuals.

The Supplemental Nutrition Assistance Program (SNAP), the federal aid program addressing food insecurity among low-income households, is an important source of data that can be used to identify individuals who are in compliance with or exempt from the Medicaid work requirements. Both Medicaid and SNAP target low-income households, and many individuals receive benefits through both programs; overall, most people who receive SNAP benefits are covered by Medicaid. As a result, some states have integrated eligibility systems or otherwise share data between the two programs. In addition, SNAP has long-standing work requirements for certain “able-bodied” adults without dependents, so coordination among agencies can streamline the collection of information to verify compliance with requirements in both programs. The reconciliation law introduced changes for the population subject to work requirements in SNAP that align them more closely with the new Medicaid work requirements, but differences remain between the programs.

New Medicaid work requirements and changes to SNAP work requirements are expected to impact enrollment in both programs. The Congressional Budget Office (CBO) estimates that Medicaid work requirements will increase the number of uninsured by 5.3 million over the next ten years, and that changes in who will need to meet work requirements will reduce participation in SNAP by roughly 2.4 million people in an average month over the 2025-2034 period. The changes to SNAP work requirements to align with Medicaid mean there could be overlap in the populations projected to lose SNAP and Medicaid benefits. This brief describes the intersection between Medicaid and SNAP and discusses how information from SNAP may be leveraged by states when implementing the new Medicaid work requirements.

What are Medicaid and SNAP Work Requirements?

Beginning January 1, 2027, states must require expansion adults and enrollees in partial expansion waiver programs (Georgia and Wisconsin) to complete 80 hours of work or community service activities per month or meet exemption criteria to enroll in Medicaid and maintain coverage. At a minimum, states will be required to verify individuals’ work or exemption status when individuals apply for coverage and at eligibility renewal. The law specifies mandatory exemptions, including being in a household receiving SNAP and not exempt from SNAP work requirements. Other exemptions include parents and caretakers with children ages 13 and under, individuals who are “medically frail,” and individuals who are pregnant or postpartum, among others (Table 1). When a state is unable to verify compliance with the requirements or that an individual meets exemption criteria through data matching, it must issue a “notice of noncompliance” and deny the application or disenroll the individual from Medicaid coverage if the individual is unable to show compliance within 30 days.

SNAP has its own work requirements and exemptions, but these do not fully align with the new Medicaid work requirements and exemptions. While most adults on SNAP must meet general work requirements, individuals who are considered “able-bodied adults without dependents” (ABAWDs) must work or participate in a work program for at least 80 hours per month or participate for an assigned number of hours in workfare to receive SNAP benefits for more than three months in a 36-month period (Table 1). The reconciliation law made changes that went into effect at the end of 2025 affecting the ABAWD population subject to this 80 hour per month work requirement, including newly subjecting adults ages 55 to 64 and parents with children ages 14 and older to these requirements, as well as removing previous exemptions for veterans, people experiencing homelessness, and young adults who aged out of foster care and who are under age 24. The law also added a new exemption for American Indian and Alaska Native People and changed the criteria for optional hardship exceptions for areas facing high unemployment. These changes make the SNAP requirements more consistent with Medicaid work requirements, although differences remain. For example, unlike SNAP, Medicaid work requirements include exemptions for individuals recently released from incarceration, as well as optional short-term hardship exceptions states can adopt for individuals with inpatient or nursing facility admissions, residents of counties with a disaster declaration, and those who have traveled outside their community for medical care (Table 1).

Medicaid and SNAP Work Requirements (Table)

What do we know about the intersection between Medicaid and SNAP?

About one in five Medicaid-covered adults who will likely be subject to the new work requirements also receive SNAP benefits (Figure 1). Similar eligibility requirements, particularly in Medicaid expansion states, account for this overlap in enrollment. In the 41 states (including DC) that have expanded their Medicaid programs, the income eligibility limit for adults is 138% of the federal poverty level (FPL), which is $22,024 for an individual in 2026 or $1,835 per month. The income eligibility limit for SNAP is 130% FPL gross monthly income ($1,696 for an individual in 2026) and 100% FPL net monthly income reflecting certain deductions ($1,305 for an individual in 2026); though definitions of income and household composition rules differ somewhat between SNAP and Medicaid. This estimate of the share of adults likely subject to Medicaid work requirements who are enrolled in both programs is likely an undercount as it excludes Medicaid adults with dependent children ages 14 and older. While nearly all SNAP participants are also enrolled in Medicaid, because SNAP participation is much lower than total Medicaid enrollment, the share of Medicaid enrollees who also receive SNAP is lower. This analysis focuses on adults who would likely qualify for an exemption from Medicaid work requirements due to being in a household receiving SNAP and not exempt from SNAP work requirements. When looking at the broader population of all Medicaid adults ages 19-64, the share receiving SNAP benefits rises to one in three individuals.

One in Five Adults Likely Subject to Medicaid Work Requirements Receive SNAP (Donut Chart)

In part because of the overlap in eligibility between the two programs, many states use information from SNAP to assist with determining Medicaid eligibility. Most Medicaid programs are already facilitating coordination of enrollment processes and systems between Medicaid and SNAP. For example, 29 states affected by the new Medicaid work requirements allow individuals to apply for Medicaid and SNAP through a single online application and 24 states affected by the new Medicaid work requirements make eligibility determinations for Medicaid and SNAP through a single shared system. In addition, among states that will be subject to Medicaid work requirements, 15 enroll or renew individuals in Medicaid using SNAP income determinations, and 33 states use information from SNAP to identify and act on potential changes in eligibility between renewals, including 10 states and DC that do both, as of January 2025 (Figure 2).

Many states Use Information From SNAP to Assist with Determining Medicaid Eligibility, as of January 2025 (Choropleth map)

How can states use data from SNAP to implement Medicaid work requirements?

States can use information from SNAP to identify individuals who may be exempt from Medicaid work requirements and those who are meeting the requirements. States are required to use available data from reliable sources to “data match” the work or exemption status of individuals to lessen the administrative burden on both enrollees and Medicaid staff. Although CMS has not released formal guidance, it is anticipated that states will be required to access SNAP and TANF data for the purpose of determining compliance with work requirements. Successful automation to verify compliance with Medicaid work activities or exemption status can lower the risk of eligible people not being able to enroll in Medicaid or losing their coverage due to not submitting proof of work hours or exemption status. States can use information already collected by SNAP to identify individuals in a household receiving SNAP who are not exempt from SNAP work requirements, and who are, therefore, exempt from the Medicaid requirements. SNAP data can also be used to identify individuals who qualify for exemptions because they are medically frail, are participating in a drug or alcohol addiction program, or are American Indians or Alaska Natives. States can also use income information from SNAP to verify compliance with Medicaid work requirements. While some of this information on work and exemption status is likely available for current Medicaid enrollees, SNAP can be a source of data for applicants for whom Medicaid agencies do not have this information.

When Arkansas implemented work requirements in 2018, the state used SNAP data to verify exemptions and compliance with work hours. Of the 116,000 individuals subject to work requirements in February 2019, Arkansas was able to determine that 87% of enrollees were meeting or exempt from the work requirements through data matching (Figure 3). Most individuals whose status was verified using available data fell into four categories: those who were already working at least 80 hours per month (45%), those meeting or exempt from SNAP employment and training requirements (14%), those with a dependent child in the household (12%), and those identified as medically frail (9%). Most enrollees who were not data matched ultimately did not report any work activities in that month. Arkansas did not have integrated eligibility systems, but implemented a daily file exchange between its SNAP and Medicaid systems to update exemption and compliance information across programs without manual intervention. Although Arkansas’ work requirements differ from the new federal requirements in key ways, the experience shows how states can use SNAP data when implementing the new Medicaid work requirements. 

In Arkansas, 14% of Those Subject to Work Requirements Were Automatically Exempted Due to Their SNAP Status (Pie Chart)

Data sharing between Medicaid and SNAP will be easier in states that have integrated eligibility systems; however, these states may also face unique issues in addition to the challenges all states will likely face when making necessary system changes for both programs. Of the many systems changes needed, states have previously reported prioritizing enhancing capabilities to collect and match data from multiple agencies and external sources to reduce the burden on applicants and enrollees for documenting their work or exemption status. However, states may face different challenges based on their current Medicaid eligibility system integration with SNAP. States that do not currently link to SNAP will need to establish an interface to share data between agencies. Some states may face difficulty establishing this linkage and may require more time to put it into place. States with integrated Medicaid and SNAP eligibility systems needed to prioritize completing work requirement changes for SNAP that went into effect at the end of 2025, which may have delayed the initiation of work on the Medicaid changes. Any delays in preparing for Medicaid work requirements could potentially increase costs. In addition, as states implement complex SNAP and Medicaid eligibility and enrollment policy changes, they will also need to prepare for changes to the payment error rate measurement (PERM) program at the same time, requiring states to make decisions on how to apply scarce state resources and mitigate budgetary consequences. Beginning in 2028, the reconciliation law requires states to pay a portion of SNAP benefit costs, depending on the state’s payment error rate, and starting October 1, 2029, HHS will be required reduce federal Medicaid financial participation to states that exceed a three percent PERM eligibility error rate threshold.

Medicaid Financing: The Basics

Published: Mar 4, 2026

Medicaid represents nearly $1 out of every $5 spent on health care in the U.S. and is the major source of financing for states to provide health coverage and long-term care for low-income residents. Medicaid is administered by states within broad federal rules and jointly funded by states and the federal government through a federal matching program with no cap. States are facing substantial Medicaid financing changes and historic reductions in federal funding following the passage of the 2025 reconciliation law, though the timing of the changes and the impacts vary by state. In addition, administrative actions related to financing and more aggressive oversight of potential fraud by health care providers, including withholding federal Medicaid operating funds, contribute to fiscal uncertainty for states. Amid federal policy changes, states are also experiencing a more tenuous fiscal climate due to slowing revenue growth and increasing spending demands. Medicaid is often central to state budget decisions as it is simultaneously a significant spending item as well as the largest source of federal revenues for states. This issue brief examines key questions about Medicaid financing and explores the impact of recent policy changes.

How does Medicaid financing work?

Medicaid financing is shared by states and the federal government with a guarantee to states for federal matching payments with no pre-set limit. The percentage of costs paid by the federal government (known as the federal medical assistance percentage or “FMAP”) varies across states, for specific services and types of enrollees, and depending on whether the costs are for medical care or program administration. Congress has enacted legislation to temporarily increase federal matching payments during economic downturns and, most recently, during the COVID-19 pandemic, because Medicaid is a counter-cyclical program. During economic downturns, more people become eligible and enroll, but states typically face declines in revenues that make it difficult to finance the state share of funding for the program.

The FMAP for services used by people eligible through traditional Medicaid, which includes individuals who are eligible as children, low-income parents, because of disability, or because of age (65+), is determined by a formula set in statute. The formula is designed so that the federal government provides a match rate of at least 50% and provides a higher match rate for states with lower average per capita income. The resulting FMAP varies by state and ranges from 50% (the FMAP “floor”) in ten states (California, Colorado, Connecticut, Maryland, Massachusetts, New Hampshire, New Jersey, New York, Washington, and Wyoming) to 77% in Mississippi for federal fiscal year (FFY) 2027 (Figure 1).

States With Lower Per Capita Incomes Have a Higher Federal Matching Rate for Medicaid (Choropleth map)

There are special match rates for the Affordable Care Act (ACA) expansion group, administration, and other services. While the traditional FMAP applies to the vast majority of Medicaid spending, there are a few exceptions that provide higher match rates for specific services or populations, such as family planning and most notably people covered under the ACA Medicaid expansion. States that have implemented the expansion receive 90% FMAP for adults covered through the ACA Medicaid expansion. Administrative costs incurred by states are usually matched by the federal government at a 50% rate, but some functions such as eligibility and enrollment systems receive higher match rates. Medicaid administrative costs are about 4% of total Medicaid spending.

Unlike in the 50 states and D.C., annual federal funding for Medicaid in the U.S. territories is subject to a statutory cap and fixed matching rate. Once a territory exhausts its capped federal funds, it no longer receives federal financial support for its Medicaid program during that fiscal year. Over time, Congress has provided increases in federal funds for the territories broadly and in response to specific emergency events. Various pieces of legislation during the pandemic significantly increased the allotments for each of the territories and also raised the FMAP rates from the statutory level of 55% to 76% for Puerto Rico and 83% for the other territories. The 2023 Consolidated Appropriations Act extended the 76% FMAP for Puerto Rico through FFY 2027 and made the 83% match rate for other territories permanent.

To participate in Medicaid and receive federal matching dollars, states must meet core federal requirements. States must provide certain mandatory benefits (e.g., hospital, physician, and nursing home services) to core populations (e.g., low-income pregnant women, children, people with disabilities, and people ages 65 and older) without waiting lists or enrollment caps. States may also receive federal matching funds to cover “optional” services (e.g., adult dental care and home care, also known as home- and community-based services) or “optional” groups (e.g. people with income above the limits established for core populations). States also have discretion to determine how to purchase covered services (e.g., through fee-for-service or capitated managed care arrangements) and to establish provider payment methods and rates.

Both the federal government and states are responsible for promoting program integrity. Program integrity broadly refers to the proper management and function of the Medicaid program to ensure it is providing quality and efficient care while using funds–taxpayer dollars–appropriately, with minimal waste. Program integrity efforts, historically, have worked to prevent and detect fraud, waste, and abuse; to increase program transparency and accountability; and to work on corrective action plans and recover improperly used funds. Improper payments, which are often cited when discussing program integrity, are not a measure of fraud but payments that do not meet Centers for Medicare and Medicaid Services (CMS) program requirements. CMS’s Medicaid Payment Error Rate Measurement (“PERM”) program estimated the overall Medicaid improper payment rate was about 6% in 2025. Most improper payments (77% in 2025) are due to insufficient information (or missing administrative steps), not necessarily due to payments for ineligible enrollees, providers, or services (i.e. since they may have been payable if the missing information had been on the claim and/or the state had complied with requirements).

How much does Medicaid cost and how are funds spent?

Overall, Medicaid spending totaled $919 billion in FFY 2024 with the federal government paying nearly two-thirds (65% or $594 billion) and states paying over one-third (35% or $325 billion) (Figure 2). The overall share of federal spending on Medicaid depends on states’ per capita income (lower income states receive a higher match) and whether they adopted the ACA expansion (which has a 90% match).

The Federal Government Paid for Nearly Two-Thirds of Total Medicaid Spending in FFY 2024 (Donut Chart)

Capitated payments to Medicaid managed care organizations (MCOs) accounted for half of Medicaid spending in FFY 2024 (Figure 3). Managed care and health plans accounted for the largest share (53%) of Medicaid spending, with capitated payments to comprehensive MCOs accounting for 50% of Medicaid spending in FFY 2024 and other Medicaid managed care (e.g., primary care case management (PCCM) arrangements or payments to specialty plans) accounting for another 3%. Smaller shares of total Medicaid spending in FFY 2024 were for fee-for-service acute care (22%), fee-for-service long-term care (20%), Medicaid spending for Medicare premiums on behalf of enrollees who also have Medicare (3%), and disproportionate share hospital (DSH) payments (2%).

Payments to Comprehensive MCOs Account for Half of Total National Medicaid Spending (Pie Chart)

Enrollees eligible based on disability or age (65+) comprise about one in five of all Medicaid enrollees but account for over half of total spending due to higher per person costs (Figure 4). Children account for 33% of enrollees but only 15% of spending. Adult enrollees (those made eligible under the ACA Medicaid expansion, as well as low-income parents) account for 45% of all enrollees and 34% of spending. The disproportionate spending on certain eligibility groups stems from variation in spending per enrollee across the eligibility groups, reflecting differences in health care needs and utilization. Spending per enrollee for individuals eligible based on age (65+) and disability, the two groups with the highest per enrollee costs, is approximately six times higher than spending per enrollee for children, who had the lowest spending of any eligibility group. Those eligible on the basis of age or disability tend to have higher rates of chronic conditions, more complex health care needs and are more likely to utilize long-term care than other enrollees, contributing to higher spending.

People Eligible for Medicaid Based on Disability or Age (65+) Accounted for 1 in 5 Enrollees but Over Half of All Spending in 2023 (Stacked column chart)

Total spending per full-benefit enrollee ranged from a low of $4,780 in Alabama to $12,295 in D.C. in 2023 (Figure 5). Variation in spending across the states reflects considerable flexibility for states to design and administer their own programs – including what benefits are covered and how much providers are paid — and variation in the cost of living and the health and population characteristics of state residents. Within each state, there is also substantial variation in the average costs for each eligibility group and within each eligibility group, per enrollee costs may vary significantly. Overall, Medicaid spending has experienced slower cumulative growth since 2008 compared to private insurance on a per-enrollee basis.

Medicaid Spending Per Full-Benefit Enrollee Varies Across States (Choropleth map)

Medicaid spending includes payments to providers, particularly hospitals, that include base rates as well as supplemental payments. Supplemental payments generally add on to “base” payments from fee-for-service Medicaid or from Medicaid managed care organizations, both of which don’t always cover the costs of providing services. There are various types of supplemental payments (see Box 1), and their use varies by state.

Box 1: Types of Medicaid Supplemental Payments

“Disproportionate share hospital” (DSH) payments ($15 billion in FFY 2024) pay hospitals that serve a large number of Medicaid and low-income uninsured patients to offset uncompensated care costs. Federal DSH spending is capped for each state and facility but within those limits, states have considerable discretion in determining the amount of DSH payments to each DSH hospital. The ACA called for a reduction in federal DSH allotments starting in FFY 2014 based on the assumption of reduced rates of uninsurance, but the cuts have been delayed several times and have yet to go into effect. DSH payments are intended to supplement Medicaid payment rates and to help defray the costs of care provided to people without health insurance.

States may make other non-DSH supplemental payments to providers ($39 billion in FFY 20241). Upper payment limits (UPLs) are the most common, and permit states to make up the difference between Medicaid fee-for-service payments and what Medicare would pay for comparable services. As such, the maximum payment rate for UPLs is what Medicare would pay in most cases. Other types of supplemental payments include payments for graduate medical education and those authorized under various demonstration programs. Most supplemental payments are made to hospitals, but some go to mental health facilities, nursing facilities, intermediate care facilities, physicians and other practitioners. For physician and other practitioners, UPLs are set at average commercial rates, which tend to be much higher than Medicare rates.

Subject to CMS approval, states may implement “state directed payments” that require managed care plans to make certain types of payments to health care providers (estimated to be well over $100 billion each year). State directed payments are generally aimed at bolstering provider payment rates to increase access to or quality of care. Prior to passage of the 2025 reconciliation law, the total payment made through state directed payments and base MCO payments was capped at average commercial rates for hospital services, nursing facility services, and professional services at academic medical centers.

How does Medicaid relate to federal and state budgets?

Social Security, Medicare, and Medicaid are the three main entitlement programs and accounted for 41% of all federal outlays in FFY 2024 (Figure 6). Of these three programs, Medicaid is smallest in terms of federal outlays, though it covers a larger number of people than Medicare or Social Security. Overall, federal spending on domestic and global health programs and services accounted for more than one-fourth of net federal outlays in FFY 2024, including spending on Medicare (12%), Medicaid and CHIP (8%), and other health spending (6%). (The numbers in Figure 6 come from the FFY 2025 budget request. The FFY 2026 budget request did not include full data on prior years’ spending, and the FFY 2027 budget request has not been posted as of the writing of this issue brief.)

Medicaid and CHIP Accounted for 8% of Net Federal Outlays in FFY 2024 (Donut Chart)

Medicaid is often central to state fiscal decisions as it is simultaneously a significant spending item as well as the largest source of federal revenues for states due to the federal matching structure. According to data from the National Association of State Budget Officers (NASBO), in state fiscal year (SFY) 2024, Medicaid accounted for 30% of total state spending for all items in the budget (Figure 7). Medicaid accounted for only 16% of expenditures from state funds (including state general funds and other state funds), second to K-12 education (24%). On the other hand, Medicaid accounted for 57% of all expenditures from federal funds. States have an incentive to control Medicaid spending because they pay a share of Medicaid costs, though states must reduce total Medicaid spending by more than one dollar to achieve a dollar in savings due to the federal matching structure. At the same time, research shows that federal matching dollars from Medicaid spending have positive effects for state economies. A number of studies show that states that have adopted the ACA Medicaid expansion have realized budget savings, revenue gains, overall economic growth as well as observed positive effects on the finances of hospitals and other health care providers.

Medicaid is the Largest Single Source of Federal Funds for States (Stacked column chart)

States can use a variety of methods to pay for the state share of Medicaid spending. States have flexibility in determining how to finance the state (or non-federal) share of Medicaid payments, within certain limits. In addition to state general funds appropriated directly to the Medicaid program, most states also rely on funding from health care providers and local governments generated through provider taxes and donations, intergovernmental transfers (IGTs), and certified public expenditures (CPEs). KFF’s 2025 Medicaid budget survey found that general funds accounted for a median of 70% of the non-federal share in SFY 2026 enacted budgets, while provider taxes accounted for 18% and funds from local governments or other sources accounted for 6%, though there was considerable variation across states.

All states (except Alaska) have at least one provider tax in place and many states have more than three (Figure 8). Medicaid provider taxes are defined as those for which at least 85% of the tax burden falls on health care items or services or entities that provide or pay for health care items or services. Provider taxes fall on a wide range of provider types but are most common for institutional providers including hospitals (47 states), nursing facilities (45 states), and intermediate care facilities for people with intellectual or developmental disabilities (33 states). States use provider tax revenues to fund Medicaid “base” rates as well as supplemental payments (including state directed payments); to finance eligibility expansions (including the ACA Medicaid expansion); or to more generally support the Medicaid program. Smaller sources of state share funding include IGTs, CPEs, and provider donations (see Box 2).

All States but Alaska Use Provider Taxes To Help Finance the State Share of Medicaid Spending (Choropleth map)

Box 2: State Share Funding Sources Beyond Provider Taxes

Intergovernmental transfers (IGTs) are transfers of public funds between governmental entities (such as county government or state university hospital transferring funding to the state Medicaid agency). Similar to provider taxes, IGTs may be used to finance payments for providers but also finance overall Medicaid spending.

Provider donations are voluntary contributions from health care providers or related entities to the state or local government, which are only permissible if they are “bona fide” and not related to the payments the provider receives from Medicaid. (Provider donations of up to $5,000 per year for an individual provider and up to $50,000 per year for health care organizations are presumed to be bona fide.) Similar to provider taxes and IGTs, provider donations may be used to finance various types of Medicaid spending.

Certified public expenditures (CPEs) are certifications by a governmental entity (such as a county hospital or schools) that authorized funds were spent on Medicaid expenses. Unlike other types of Medicaid financing, CPE funds are not transferred from a governmental entity to the state for use as a non-federal funding source. Instead, the government entity that provides the services certifies that it has expended the dollars on Medicaid-covered services. CMS provides states with the federal share of the total amount paid by the government entity and encourages (but does not require) states to reimburse the provider for the federal share of costs

What factors affect Medicaid spending and what is the impact of recent policy changes?

Medicaid spending is driven by multiple factors, including the number and mix of enrollees, their use of health care and long-term care, and the prices of Medicaid services. High enrollment growth rates, tied first to the Great Recession, then ACA implementation, and later the pandemic-era continuous enrollment provision, were the primary drivers of total Medicaid spending growth over the last two decades (Figure 9). However, by SFY 2026, the pandemic-era federal support and policies had ended, and states were projecting flat enrollment growth but increasing total Medicaid spending growth due to several cost pressures including provider and managed care rate increases, greater enrollee health care needs, and increasing costs for long-term care, pharmacy benefits, and behavioral health services.

Line graph of percent change in Medicaid enrollment and total spending shows Medicaid enrollment is expected to flatten, growing by 0.2%, as total spending grows by 7.9% in FY 2026.

Medicaid spending is also affected by federal policy changes like those included in the 2025 reconciliation law, which made historic reductions in federal Medicaid spending. The 2025 reconciliation law, signed by President Trump on July 4, 2025, will have a significant impact on Medicaid spending and enrollment trends. Overall, the Medicaid provisions in the new law are expected to reduce federal Medicaid spending by $911 billion (or by 14%) over a decade and increase the number of uninsured people by 7.5 million, though the impacts vary by state.

Changes to Medicaid financing in the 2025 reconciliation law, in particular, are expected to reduce federal Medicaid spending by about $400 billion over a decade. Those changes include:

  • Establishing new restrictions on states’ ability to generate Medicaid provider tax revenue, including prohibiting all states from establishing new provider taxes or from increasing existing taxes; reducing existing provider taxes for states that have adopted the ACA Medicaid expansion; and changing the requirements for states to receive waivers that implement various provider taxes.
  • Revising the payment limit for state directed payments.
  • Imposing a financial penalty for states with eligibility-related improper payment error rates greater than 3%.
  • Eliminating the temporary 5% increase in a state’s traditional FMAP for two years to incentivize states to adopt the Medicaid expansion.

Beyond the changes to Medicaid financing, states will be working to implement other major changes to Medicaid, most notably work requirements for adults eligible for Medicaid through the ACA expansion.

Other federal Medicaid financing changes beyond the 2025 reconciliation law will also have implications for Medicaid spending. These include the following.

  • CMS has an enhanced focus on addressing fraud, waste, and abuse in Medicaid that differs from prior practices by: increasing the use of deferrals (which require states to prove expenditures are allowable before CMS will pay for the federal share of spending), potentially withholding federal funding when future fraud is expected as was done recently in Minnesota (rather than the historic process of identifying fraud, working with a state on a corrective action, and then retroactively denying payment for disallowed expenditures), and publishing provider-level spending data to spur analysis of potential fraud, waste, and abuse by private individuals and organizations.
  • There will be additional regulations coming to implement requirements in the 2025 reconciliation. For example, a proposed rule is under review at the Office of Management and Budget to implement new requirements governing provider taxes.
  • CMS has indicated interest in potentially changing requirements governing how states finance the state share of Medicaid, including a recent request for information about ways CMS can “improve the prevention, identification, and resolution of fraud, waste, and abuse related to non-federal share financing sources, including intergovernmental transfers.”
  • Puerto Rico’s FMAP will revert to 55% from 76% after FFY 2027 without further legislative action.

As states respond to federal Medicaid cuts and shifting state fiscal conditions, changes to benefits, provider payment rates, and eligibility could further limit Medicaid spending. Amid federal funding cuts and policy changes, states are experiencing a more tenuous fiscal climate due to slowing revenue growth and increasing spending demands. The challenging fiscal climate across many states and the magnitude of federal Medicaid cuts will make it difficult for states to absorb or offset the reductions, and states may seek to restrict Medicaid provider reimbursement rates, benefits, or eligibility in response to reduce state Medicaid spending. Even though many provisions in the reconciliation law do not take effect immediately, a few states have already implemented Medicaid spending cuts for SFY 2026 or are proposing cuts for SFY 2027.

  1. This includes non-DSH other supplemental payments to inpatient and outpatient hospitals as well as other providers. Total based on FFY 2024 data downloaded from CMS (Form 64) for the following service categories: Clinic Services - Sup. Payments, Critical Access Hospitals Inpatient – Sup. Payments, Critical Access Hospitals Outpatient – Sup. Payments, Inpatient Hospital - Sup. Payments, Inpatient Hospital – GME Sup. Payments, Intermediate Care Facility - Individuals with Intellectual Disabilities (ICF/IID): Supplemental Payments, Non-Emergency Medical Transportation – Sup. Payments, Nursing Facility Services - Sup. Payments, Other Practitioners Services - Sup. Payments, Outpatient Hospital Services - Sup. Payments, and Physician & Surgical Services - Sup. Payments. Total may not match other estimates of non-DSH supplemental payments due to differences in included provider types and/or types of payments. ↩︎