Women’s Experiences with Contraception: Use, Coverage, and Preferences
Findings from the 2026 KFF Women's Health Survey
Findings
Contraceptive care is an important component of overall health care for many people, and most women use contraception at some point in their lifetime. The importance of contraceptive access has only grown as abortion has been heavily restricted in many states. Despite its importance in the lives of women and its widespread use and long-term safety record, social media has enabled the proliferation of false and misleading information about contraception. At the same time, access to contraception has been affected by the one-year federal Medicaid funding ban on Planned Parenthood and pauses on federal spending on Title X, the federal family planning program. There has also been increased signaling that the Trump administration is prioritizing fertility services and crisis pregnancy centers over contraceptive providers, including a focus on coverage for fertility drugs, a shift in Title X federal family planning funding support to a training center focused on natural family planning and infertility services, and efforts to direct women to crisis pregnancy centers through a new federal website.
This brief provides a close examination of women’s experiences with contraception, insurance coverage, contraceptive preferences, and interactions with the health care system in 2026. The findings are based on the KFF Women’s Health Survey, a nationally representative survey of 4,688 women and 1,148 men ages 18 to 64 fielded between March 11, 2026 and April 14, 2026. This brief focuses on a national sample of 3,538 reproductive age (18 to 49) women.
Key Takeaways
Contraceptive Use
- Three in four (75%) women of reproductive age (18 to 49 years) say they used some form of contraception in the past 12 months.
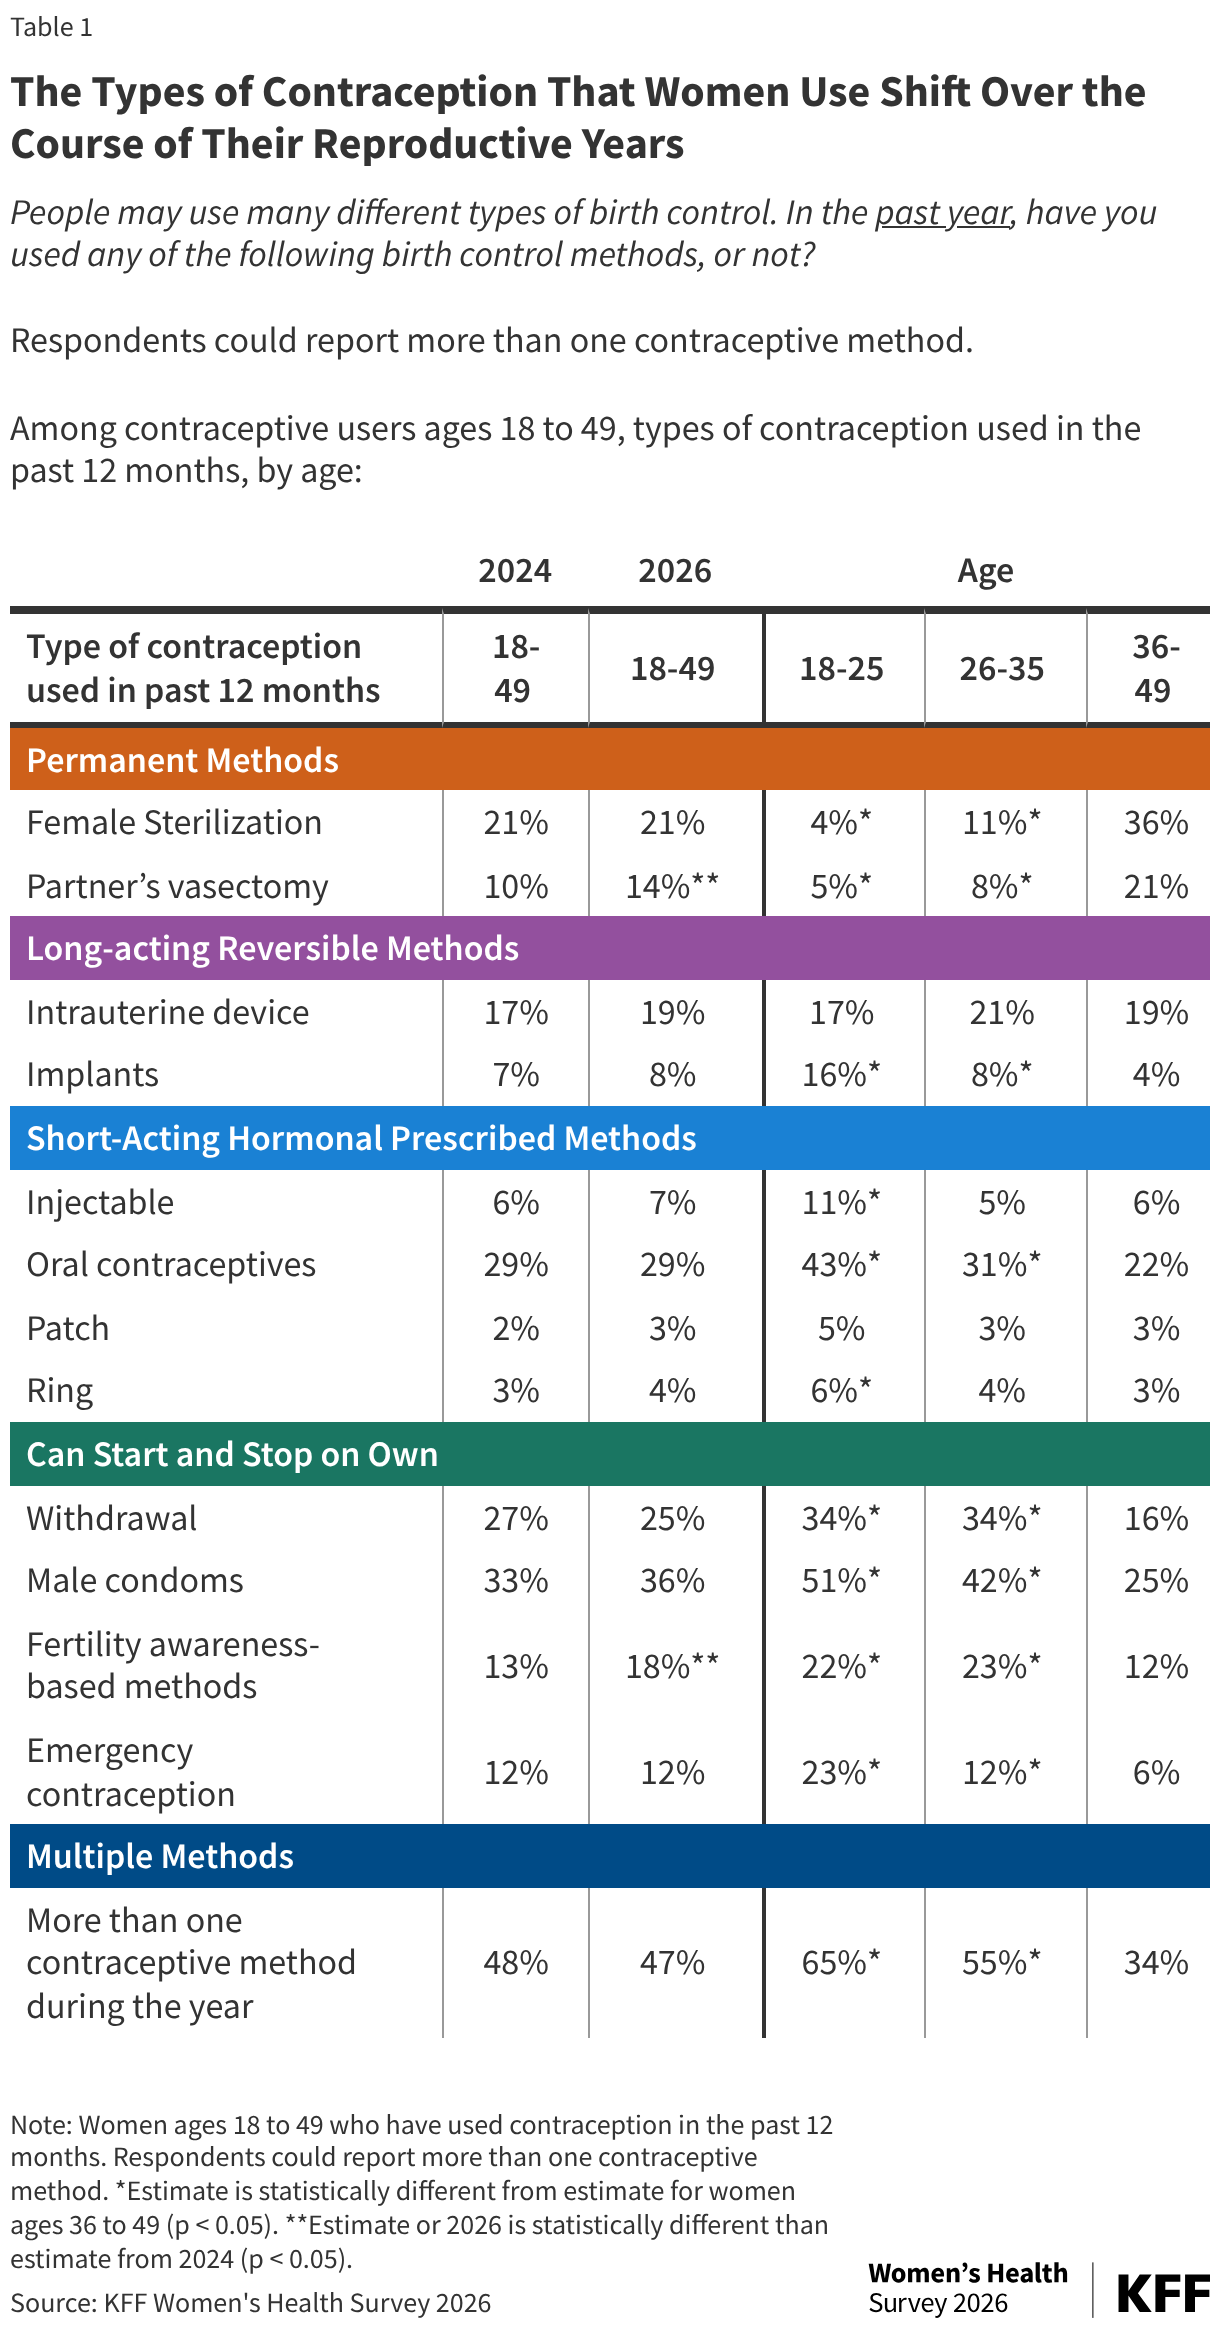
- More than a third (36%) of contraceptive users ages 18-49 say they used male condoms, which is the most commonly reported method. Nearly one in three (29%) relied on contraceptive pills and one in four (27%) used a long-acting reversible contraceptive (LARC), such as an intrauterine device (IUD) (19%) or contraceptive implant in the past year (8%). One in four (25%) reports using withdrawal in the past year. Nearly half (47%) of contraceptive users report using more than one kind of contraceptive method in the past 12 months.
- Over the past two years there has been an increase in the share of contraceptive users relying on fertility awareness-based methods (13% in 2024 to 18% in 2026) to avoid pregnancy. The share of contraceptive users relying on a partner’s vasectomy has also risen from 10% in 2024 to 14% in 2026.
- While the majority of contraceptive users say they do so to prevent pregnancy (80%), nearly one in five (19%) use it solely for another reason, such as managing a medical condition or preventing a sexually transmitted infection. Nearly one third (31%) of contraceptive users say they either take it exclusively to manage a condition or other reason or use it to preventive pregnancy and manage a condition.
- Most (80%) contraceptive users say their last birth control care visit was at a private doctor’s office, but four in ten (41%) uninsured contraceptive users say they went to a clinic for their contraceptive care.
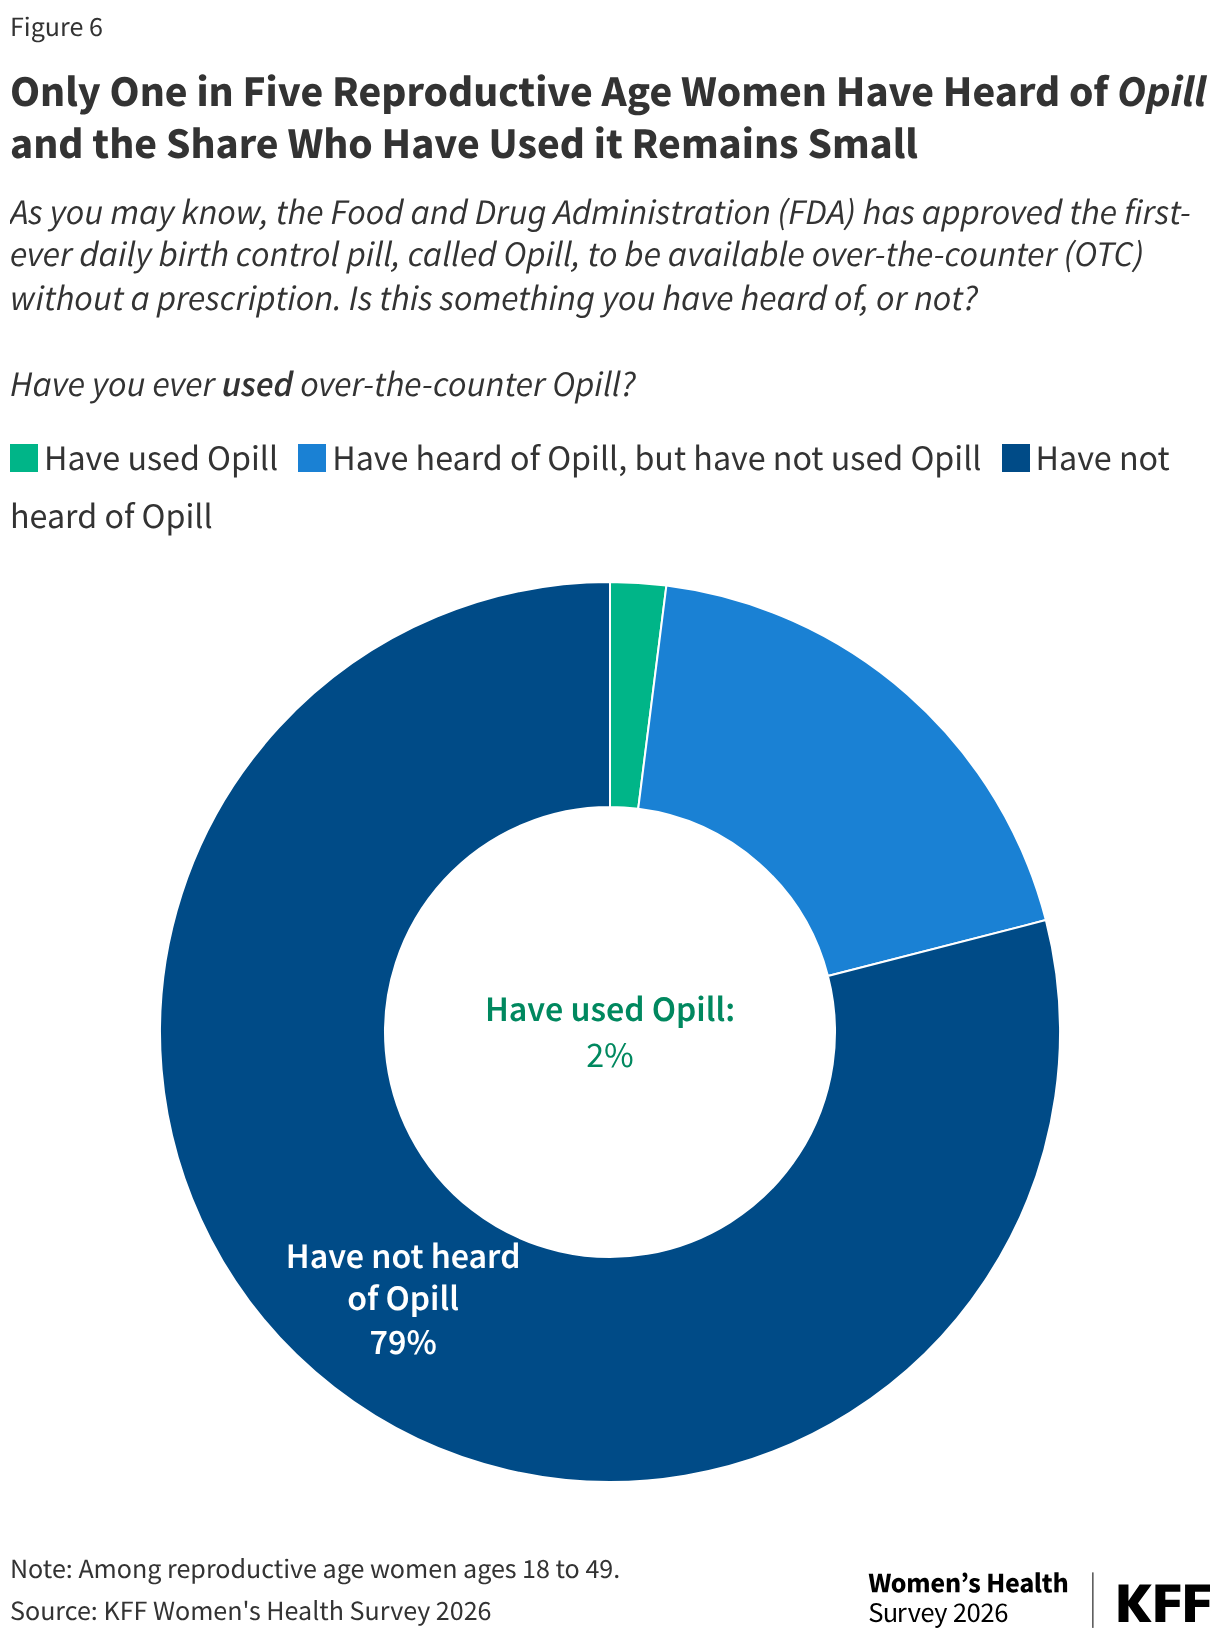
- Opill, the first FDA-approved, over-the-counter daily oral contraceptive pill has been available since March 2024, but only one in five (21%) reproductive age women say they have heard of it and just 2% of reproductive age women have used it.
Insurance Coverage
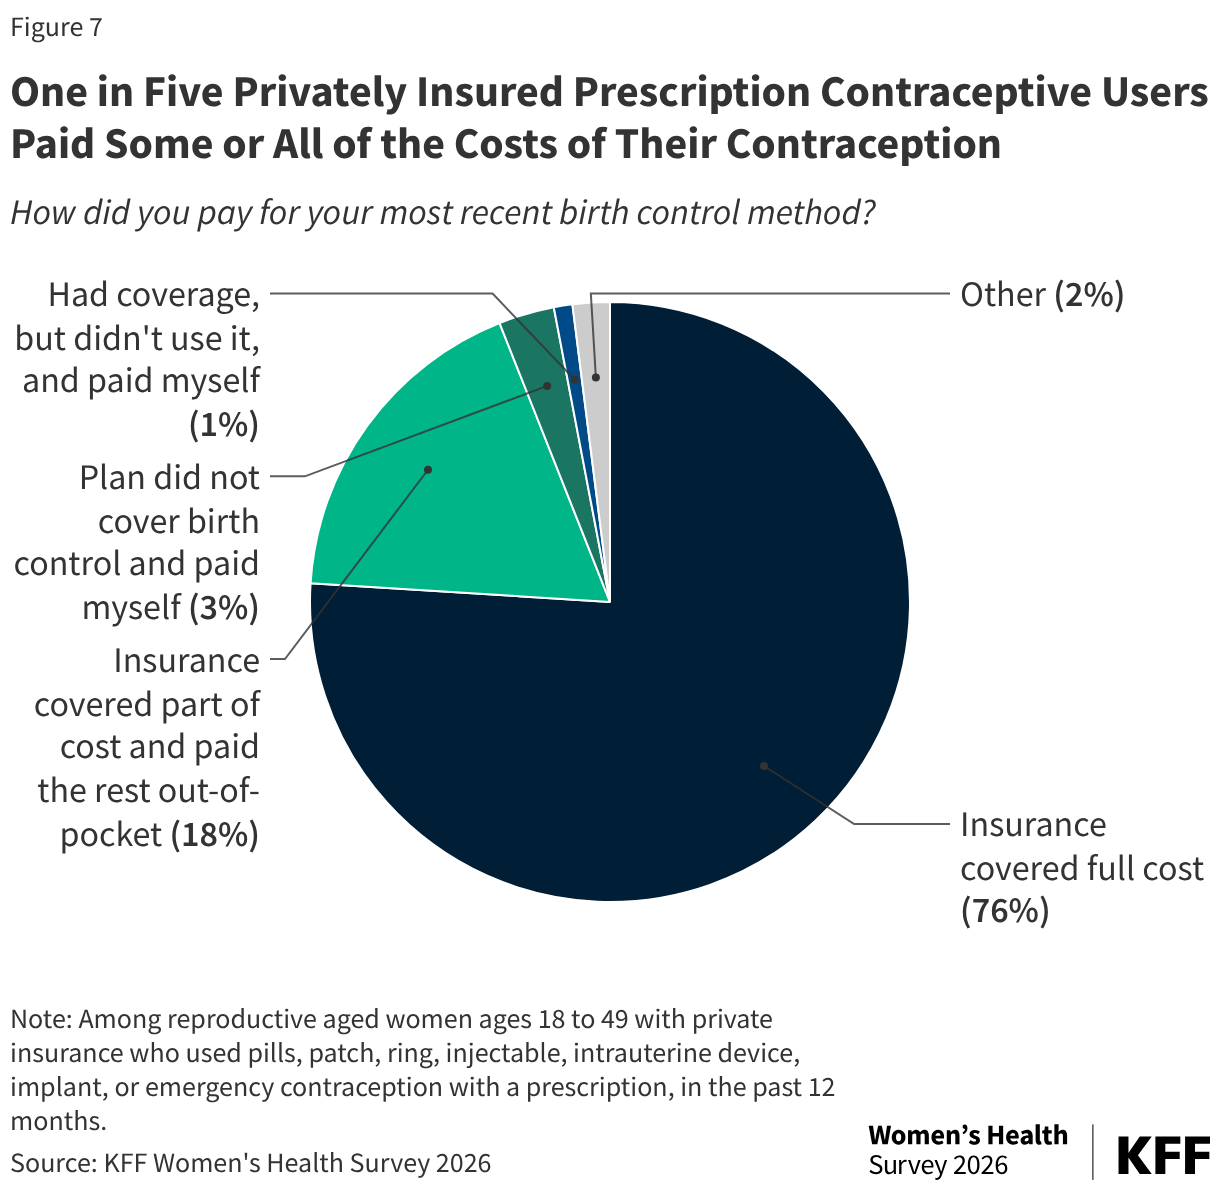
- Insurance paid the full cost of contraception for the majority (76%) of contraceptive users with private insurance (which is generally required by federal law). However, one in five (21%) report that they paid some or all of the costs out-of-pocket because their plan did not cover the full cost or did not cover birth control at all.
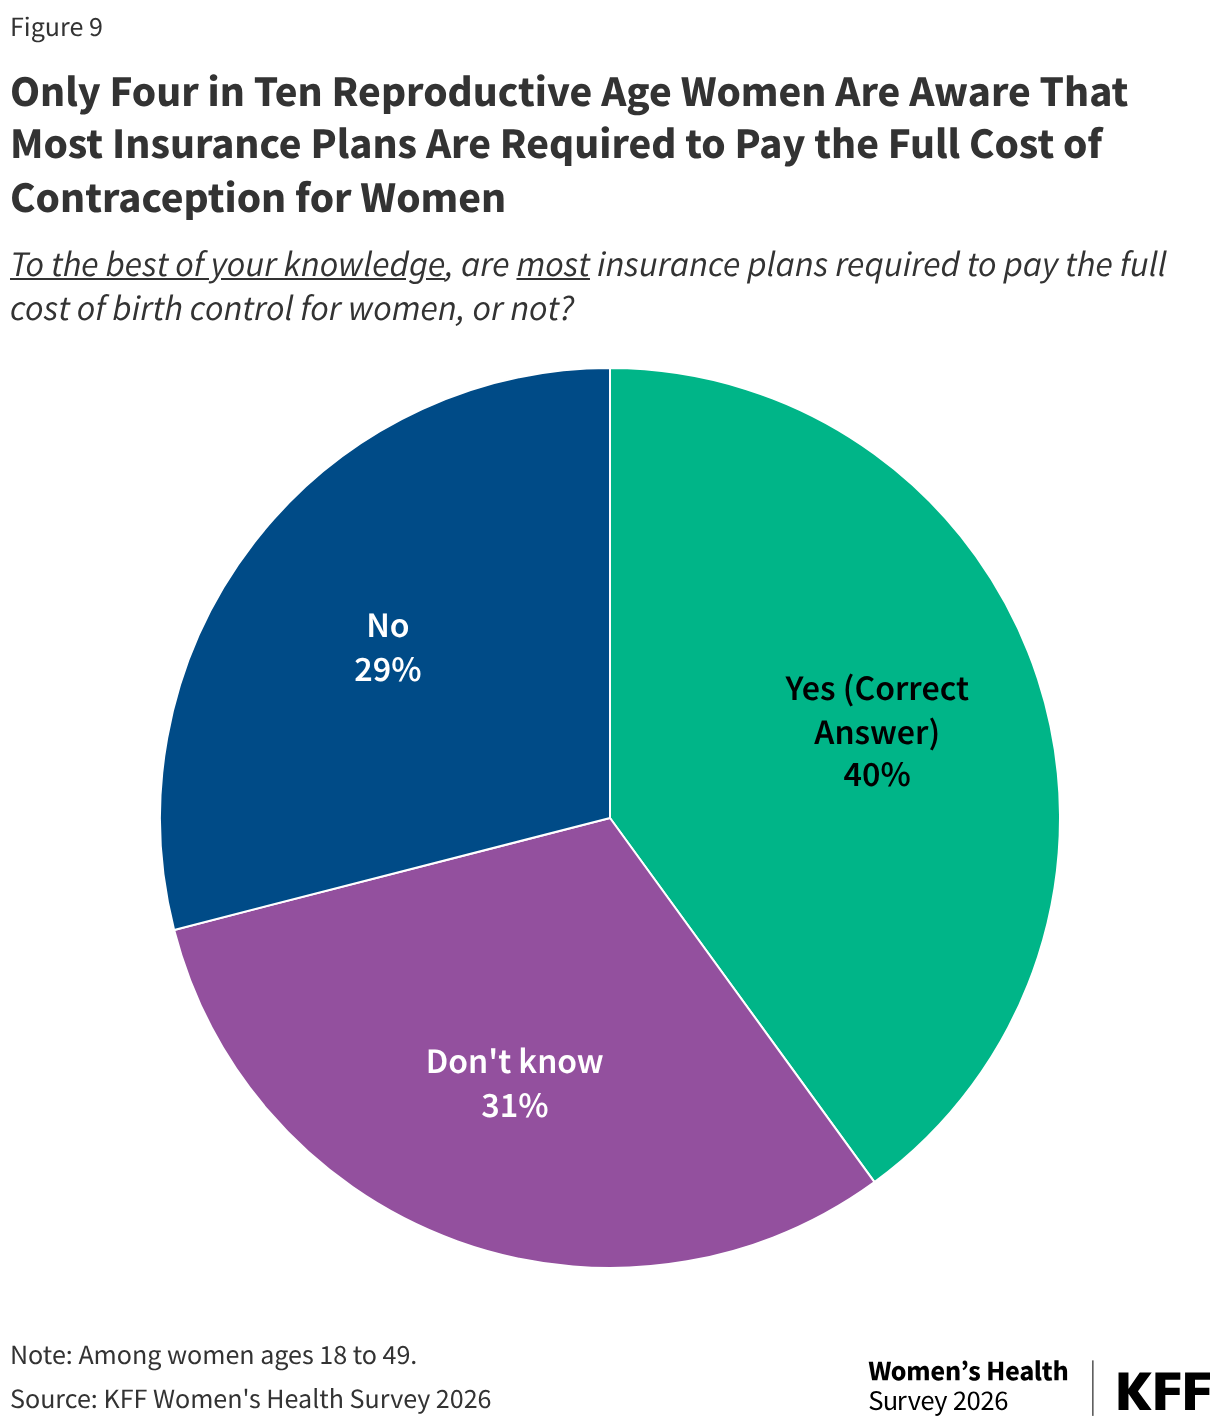
- Only four in ten (40%) reproductive age women are aware that most insurance plans are required to pay the full cost of contraception for women. The majority of reproductive age women either think there is no coverage requirement or don’t know about it.
Access and Quality
- Nearly one in five (18%) uninsured women and 7% of all reproductive age women say they have had to stop using a contraceptive method in the past 12 months because they could not afford it.
- Fewer than half (44%) of contraceptive users give their most recent contraceptive counseling an excellent rating on multiple dimensions. A higher share of women who went to a doctor’s office rate their contraceptive counseling as excellent (47%) compared to those who got their birth control at a clinic (32%).
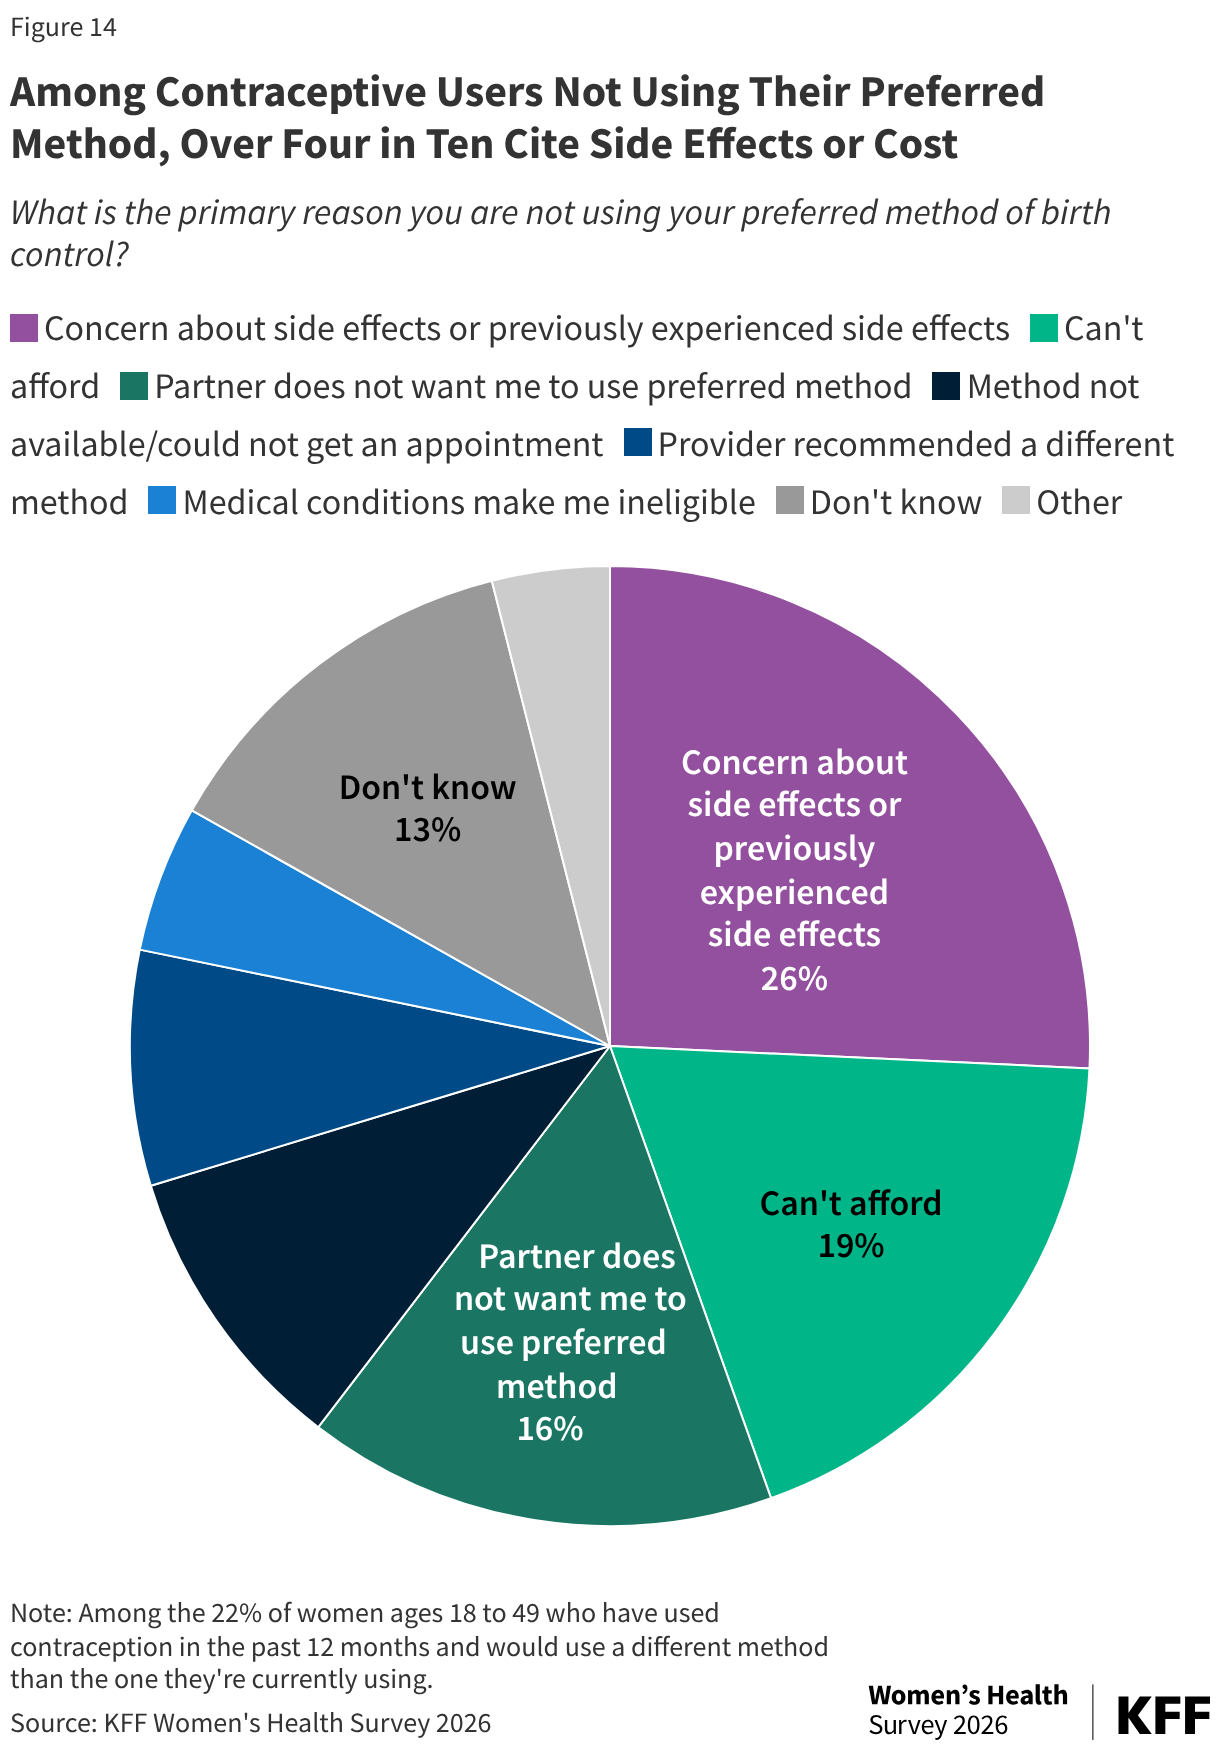
- Just over one in five (22%) contraceptive users say they would prefer to be using a different method than the one they are currently using. Side effects (26%) and affordability (19%) are the top cited reasons for not using their preferred method. Of those who are not using their preferred method, one in four (26%) would prefer that their partner get a vasectomy.
Contraceptive Use
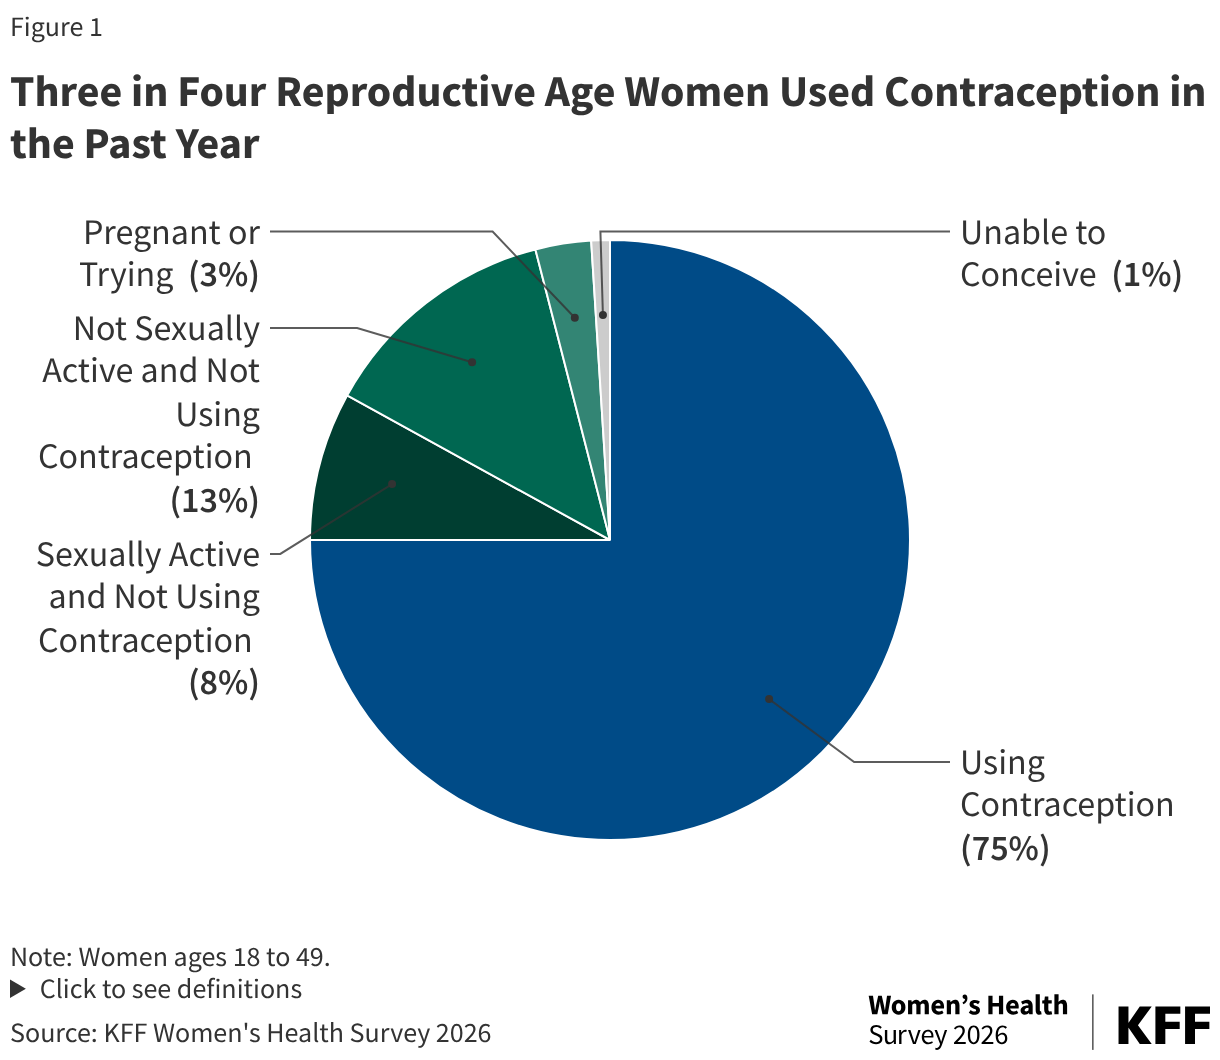
Three in four (75%) women ages 18 to 49 say they used some form of contraception in the past 12 months (Figure 1). Methods could include female sterilization, relying on a partner’s vasectomy, pills, patch, ring, injectables, intrauterine device, contraceptive implant, male condoms, emergency contraception, fertility awareness-based methods, or withdrawal. Of those not using contraception, over one in ten (13%) reproductive age women say they were not sexually active, 3% were pregnant or trying to conceive, 1% were unable to conceive, and 8% did not use contraception in the past 12 months and were sexually active, able to conceive, and not pregnant or trying to conceive.
Nearly half (47%) of contraceptive users report using more than one kind of contraceptive method in the past 12 months. The contraceptive method used shifts with age (Table 1). Among women using contraception, one in three (35%) rely on a permanent contraceptive method, such as female sterilization (21%) or a partner’s vasectomy (14%). The share of women who report relying on permanent methods to avoid pregnancy increases to over half (57%) of women ages 36 to 49 who currently report using contraception. The share relying on a partner’s vasectomy (14%) has increased since the survey was last fielded in 2024 (10%) and has risen in all age groups. One in four (27%) contraceptive users used a long-acting reversible contraceptive (LARC), such as an intrauterine device (IUD) or contraceptive implant in the past year, with highest shares of women ages 26 to 35 using IUDs and larger shares of women ages 18 to 25 using contraceptive implants. Four in ten contraceptive users (43%) used a short-acting hormonal prescription method in the past 12 months, with oral contraceptive pills accounting for the largest share among all age groups.
The most commonly reported contraceptive method is male condoms, which do not require a prescription and can easily be purchased over the counter. More than a third (36%) of contraceptive users 18-49 say they used condoms. One in four (25%) reports using withdrawal in the past year. The share of contraceptive users relying on fertility awareness-based methods (FABMs), which track a woman’s fertile days during her menstrual cycle, has increased since the survey was last fielded (18% in 2026 vs. 13% in 2024) with the largest increase among women ages 26 to 35 (23% vs. 13%) (2024 data not shown). Large shares of contraceptive users who report using condoms (80%) and FABMs (88%) also report using other methods within the year (data not shown).
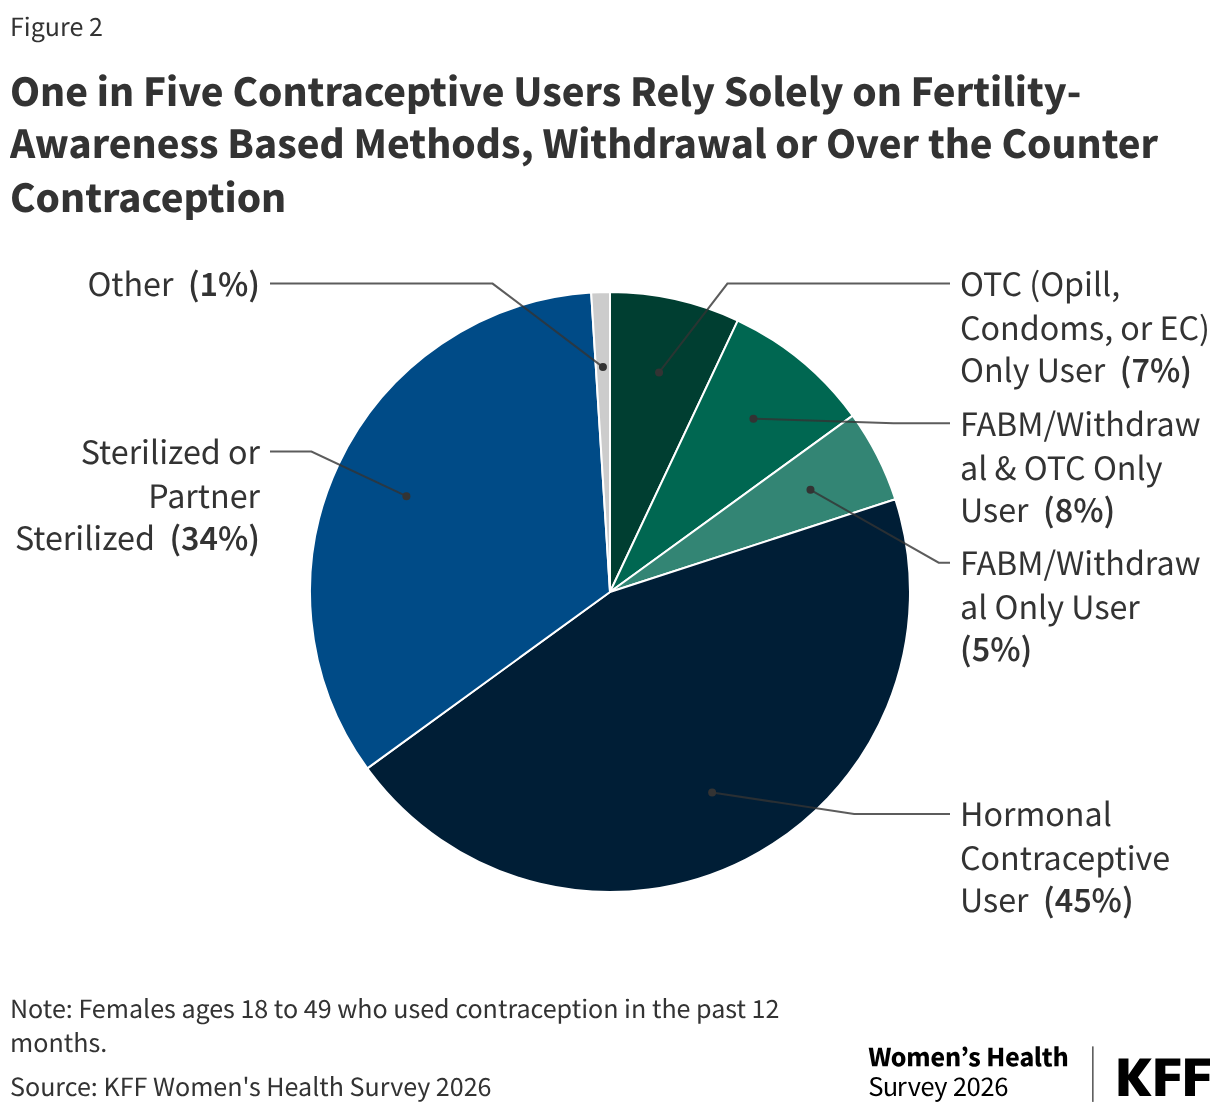
Most contraceptive users use methods that require some provider involvement, such as prescription hormonal methods (45%) or sterilization (34%); however, one in five (20%) contraceptive users rely solely on methods they can access without a provider. Only 4% of reproductive age contraceptive users report only using fertility-awareness based methods or withdrawal and another 8% report using exclusively non-prescription methods including fertility-awareness based methods, withdrawal, and over-the-counter methods like condoms, OTC emergency contraceptive pills, or Opill, the first over-the-counter oral contraceptive pill. Another 7% report only using the over-the-counter methods including condoms, Opill or emergency contraceptive pills (Figure 2).
Emergency contraceptive (EC) pills are a form of backup birth control that can be used up to several days after unprotected intercourse or contraceptive failure and still prevent a pregnancy. There are two different types of EC pills available in the US: ulipristal acetate pills, a prescription product, and progestin-based pills available over the counter without a prescription.
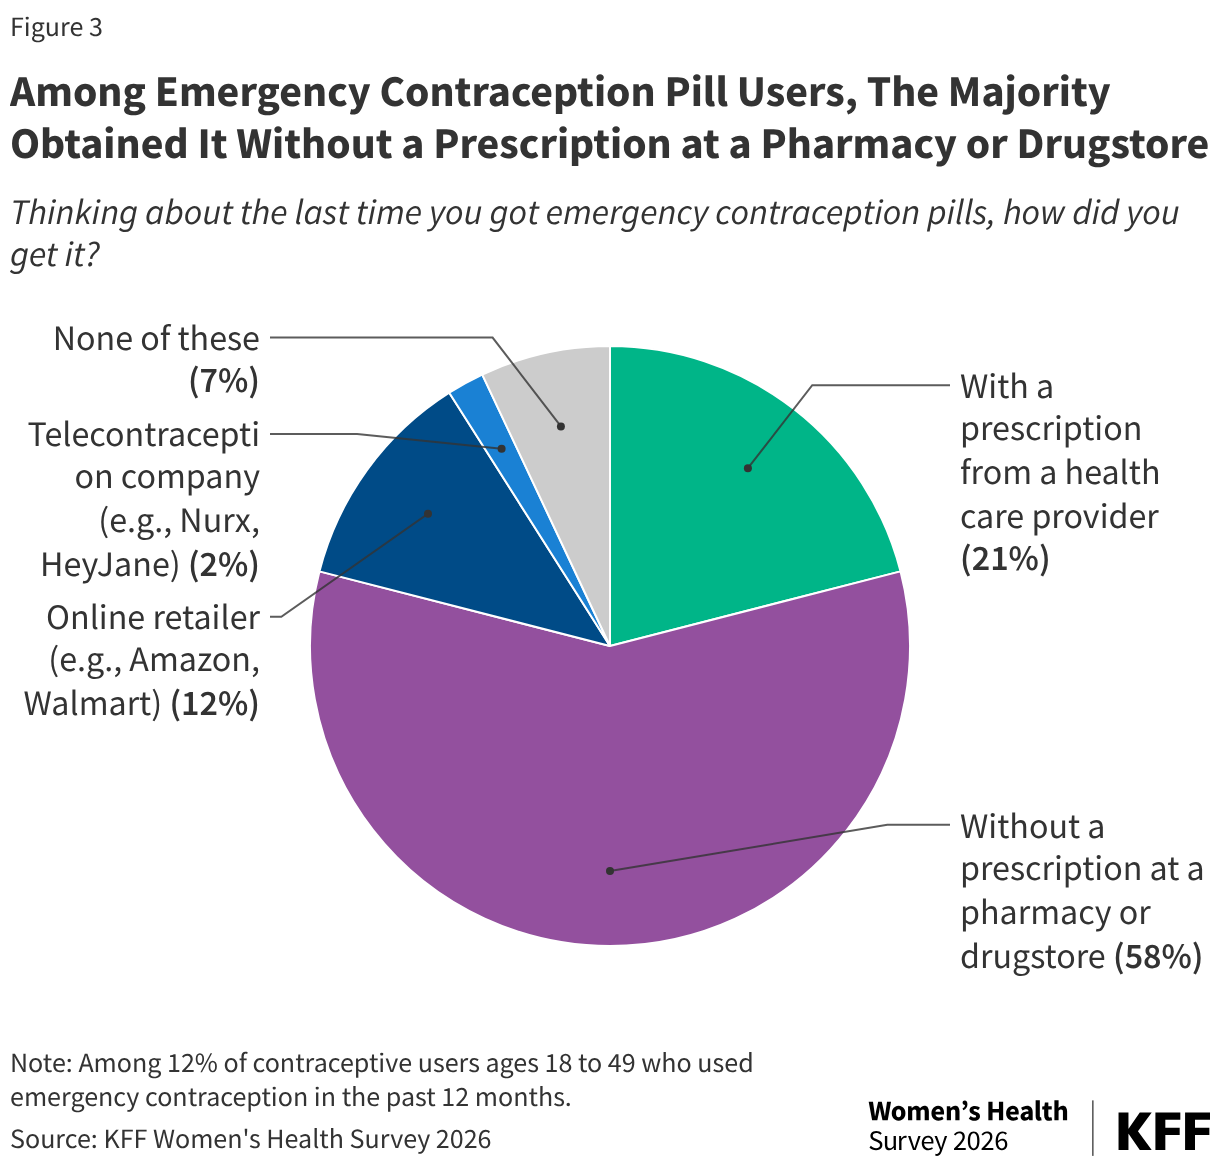
Just over one in ten (12%) reproductive age women who used contraception in the past 12 months say they have taken EC pills. Among these EC pill users, the majority (58%) say they purchased it without a prescription at a pharmacy or drugstore. Another 12% say they purchased it online. Two in ten (21%) EC pill users say they got it with a prescription from a clinician (Figure 3).
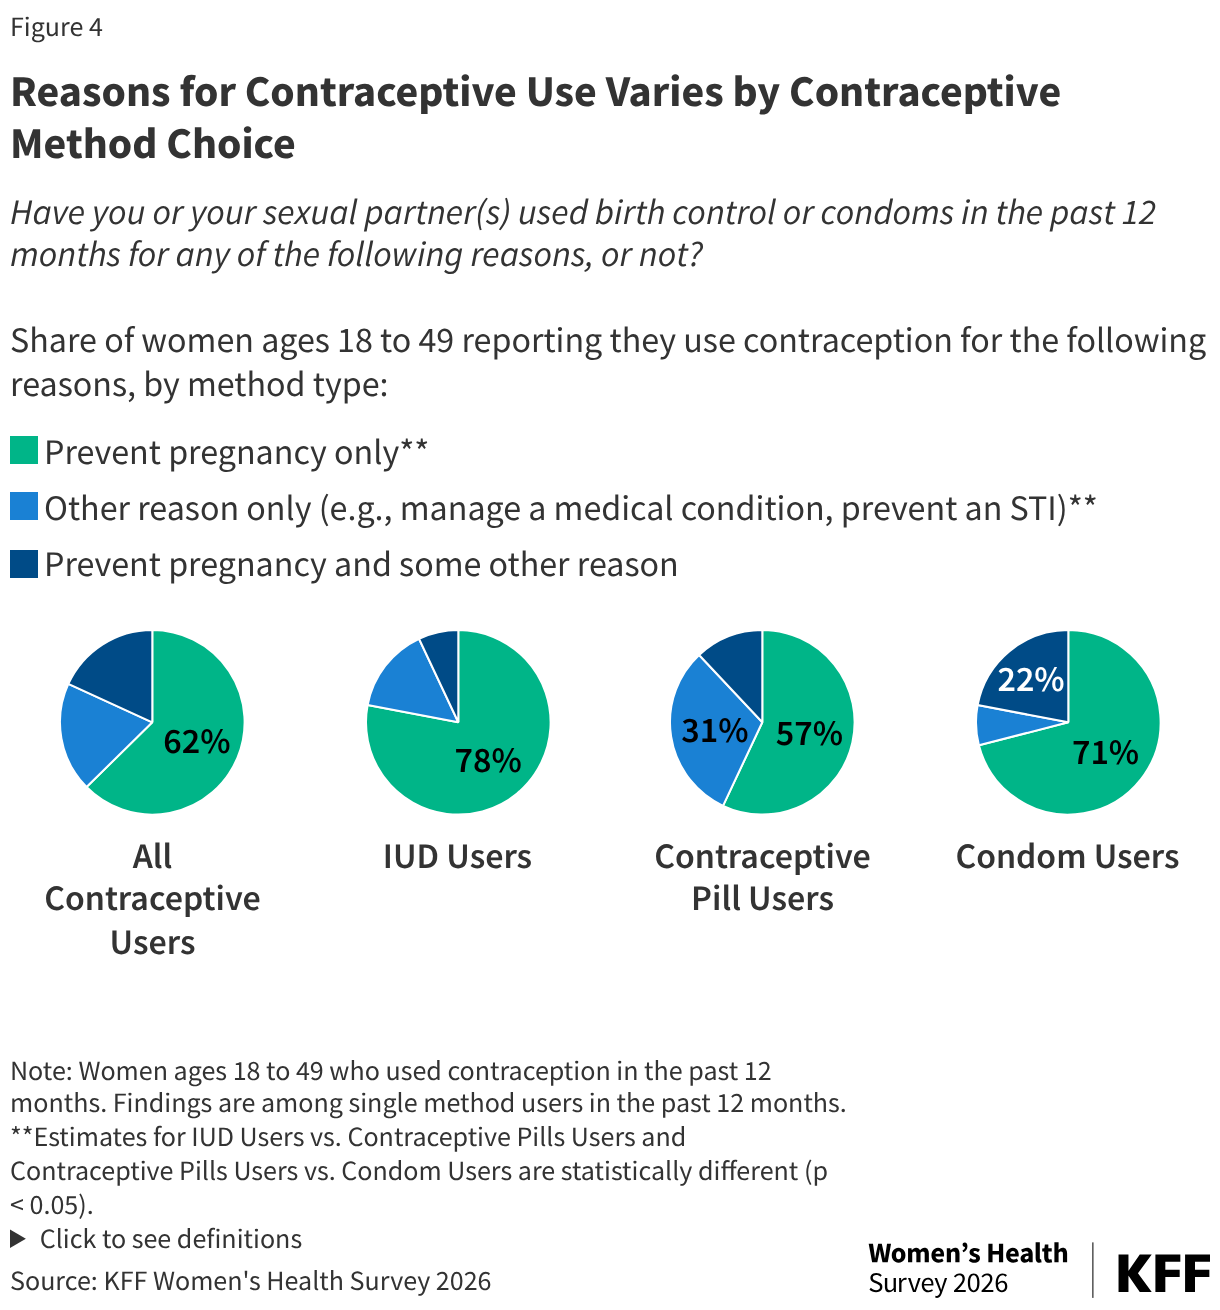
Eight in ten (80%) women who used contraception in the past 12 months say they did so to prevent pregnancy, while almost one in five (19%) used it to solely for another reason outside of preventing pregnancy, such as to manage a medical condition or prevent a sexually transmitted infection in the case of condoms (Figure 4). The share of women using contraception exclusively for a reason outside of preventing pregnancy accounted for nearly one in three women (31%) who relied solely on oral contraceptive pills. Contraceptive pills are often used to manage menstrual irregularities, treat acne, alleviate menstrual migraines, and manage symptoms of conditions like endometriosis, fibroids, and Polyendocrine Metabolic Ovarian Syndrome (PMOS).
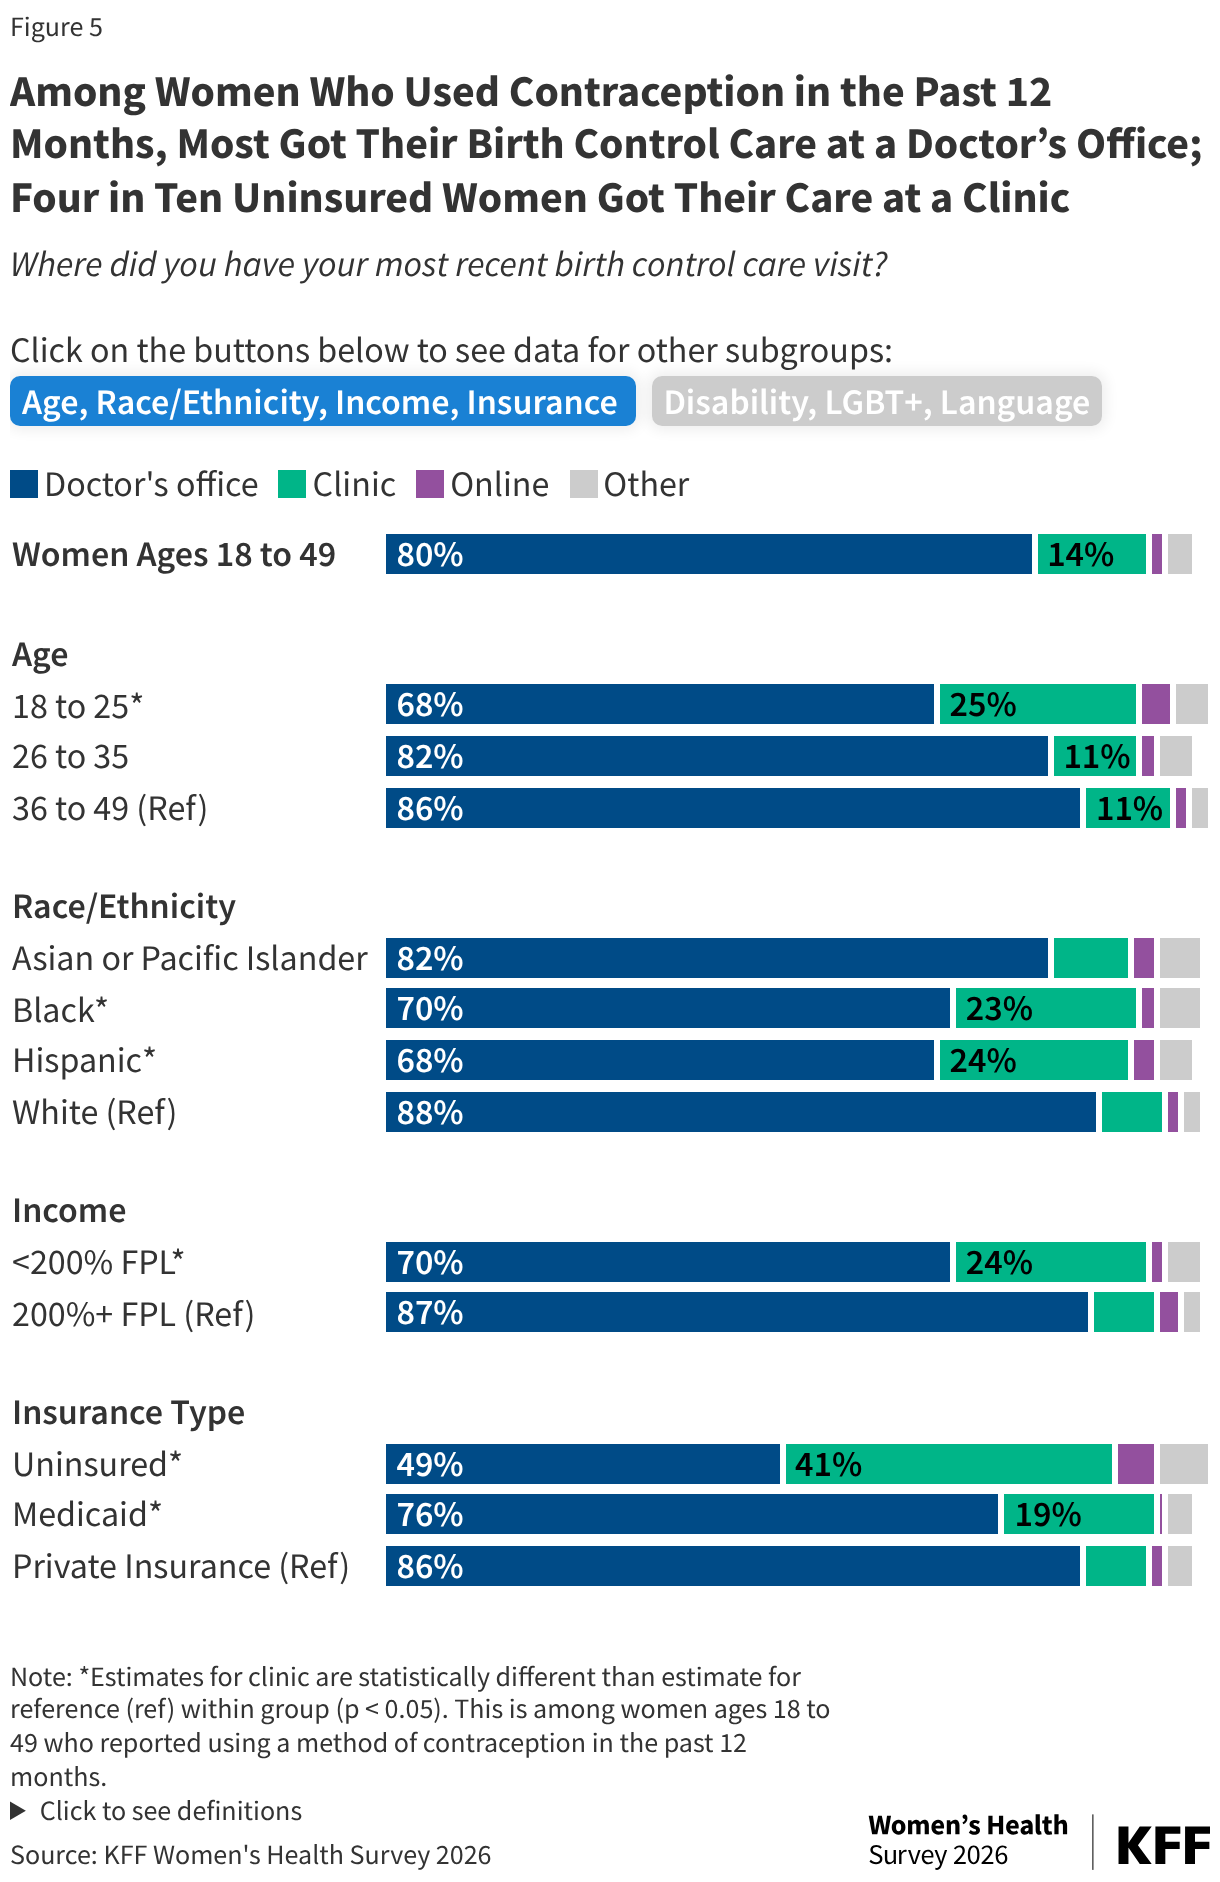
Most contraceptive users go to private doctors’ offices for their birth control, but almost one in four women with low incomes, or who are Black or Hispanic rely on publicly funded clinics. Eight in ten (80%) women of reproductive age went to a private doctor’s office for their last birth control visit (Figure 5) while one in seven (14%) had their most recent contraceptive visit at a clinic like Planned Parenthood or Health Centers. Clinics play a larger role for younger women, those without health insurance, and those with lower incomes.
Since March 2024, Opill, the first daily OTC oral contraceptive pill in the United States has been available for purchase online and in stores without a prescription. Awareness of this relatively new product, however, is low and only a small fraction of reproductive age women have used Opill. About one in five of all reproductive age women (21%) have heard of Opill and 2% have used it (Figure 6). There is a slight but statistically significant decline in awareness from 2024, when 26% of women had heard of it. This may be in part because the product was brand new in 2024 and there was a concerted marketing campaign to raise awareness.
More younger women ages 18 to 35 have heard of Opill compared to those ages 36 to 49 (data not shown). Research suggests that OTC oral contraceptives can especially benefit populations who have historically faced barriers to accessing contraceptive care, such as young adults and adolescents, those who are uninsured, and those living in areas with limited access to health centers offering the full range of contraceptive methods. However, smaller shares of women who are uninsured (16%) have heard of Opill compared to those with private insurance (23%) (data not shown).
Insurance Coverage
The Affordable Care Act (ACA) requires private insurance plans to cover out-of-pocket costs for contraceptive services and prescribed supplies for most individuals with private insurance who use an in-network provider. Small shares of women may incur out-of-pocket costs for contraceptive services if they are enrolled in a grandfathered health plan that does not adhere to the contraceptive coverage requirements, work for an employer that has religious or moral objections to covering contraception, or go to an out-of-network provider.
The majority (76%) of privately insured women who used a prescription method say their insurance covered the full cost of their most recent prescription birth control method. However, among privately insured women whose last contraceptive was a prescription method, 21% say they paid out-of-pocket for some or all of the costs of their contraception because their plan either did not cover the full cost or did not cover birth control at all (Figure 7).
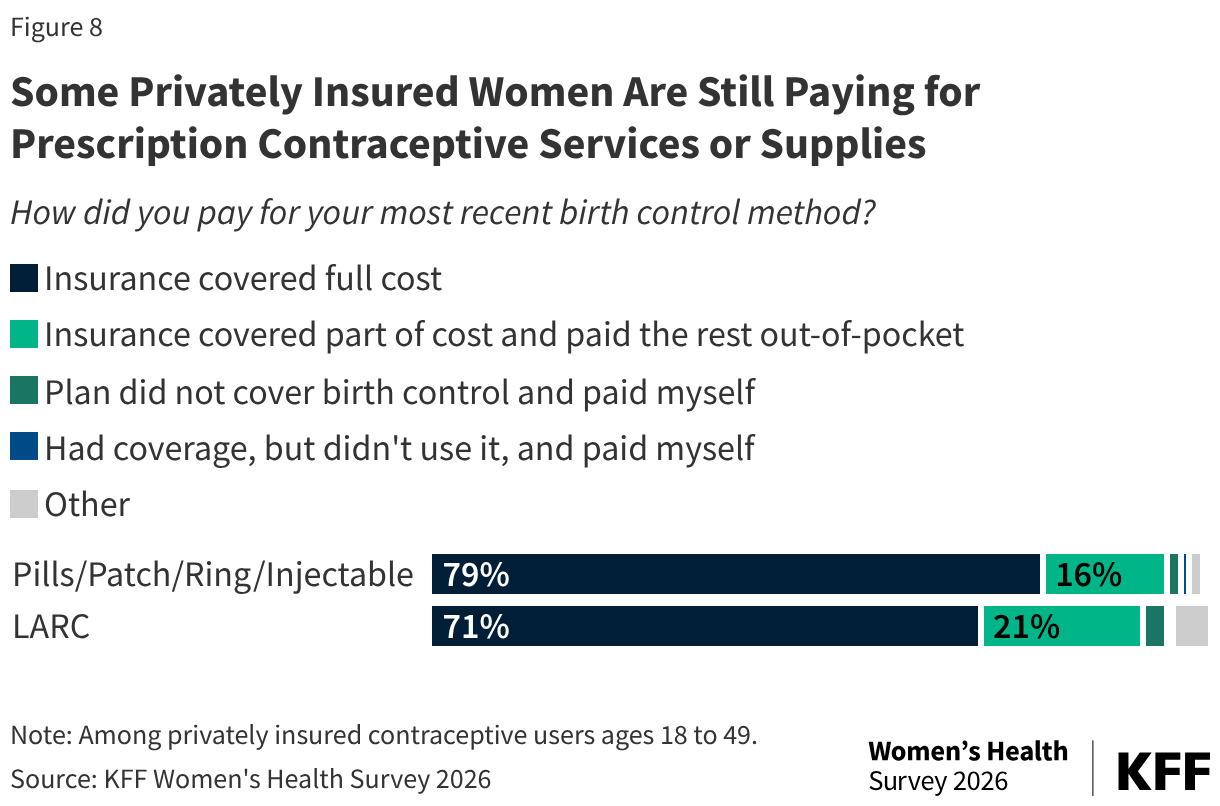
There have been several reports of people continuing to experience out-of-pocket charges for their contraception when using insurance, particularly for IUDs and implants. About one in four (24%) women who last used an IUD or implant say they had some out-of-pocket costs with their method as did nearly one in five (18%) women who last used pill, patch, ring, or injectable contraception (Figure 8). Prior KFF research has found that some women with private insurance who face out of pocket costs despite the contraceptive coverage requirement get charged for ancillary services such as pregnancy tests, even though these services should be covered in full during a contraceptive visit. Some people may also face copayments if they obtain contraception during a visit for management of another medical condition that is not categorized as preventive and can therefore be charged cost-sharing for that visit.
Awareness of the requirements that contraceptive services and supplies should be covered by insurance plans free of cost-sharing is low and appears to be decreasing. The federal contraceptive coverage requirement has been in place for more than a dozen years. Yet, in 2026, four in ten (40%) reproductive age women knew that most insurance plans are required to pay the full cost of contraception for women, a slight, but statistically significant decrease from 43% in 2024 (Figure 9). One in three (31%) women don’t know if plans are required to cover contraception for women in full and another three in ten (29%) are unaware that plans are required to cover contraception for women. This lack of awareness could be in part because some women are still facing out of pocket costs for their contraception.
Nearly half of men (46%) are unsure whether vasectomies are covered without cost-sharing when there is no federal requirement (data not shown). Four in ten (40%) men correctly responded that most insurance plans are not required to pay the full cost of vasectomies (data not shown). There are nine states that require state-regulated private health insurance plans to cover vasectomies at no cost to the patient, but the majority of people in employer-based private insurance plans do not have a state-regulated plan.
Access and Quality
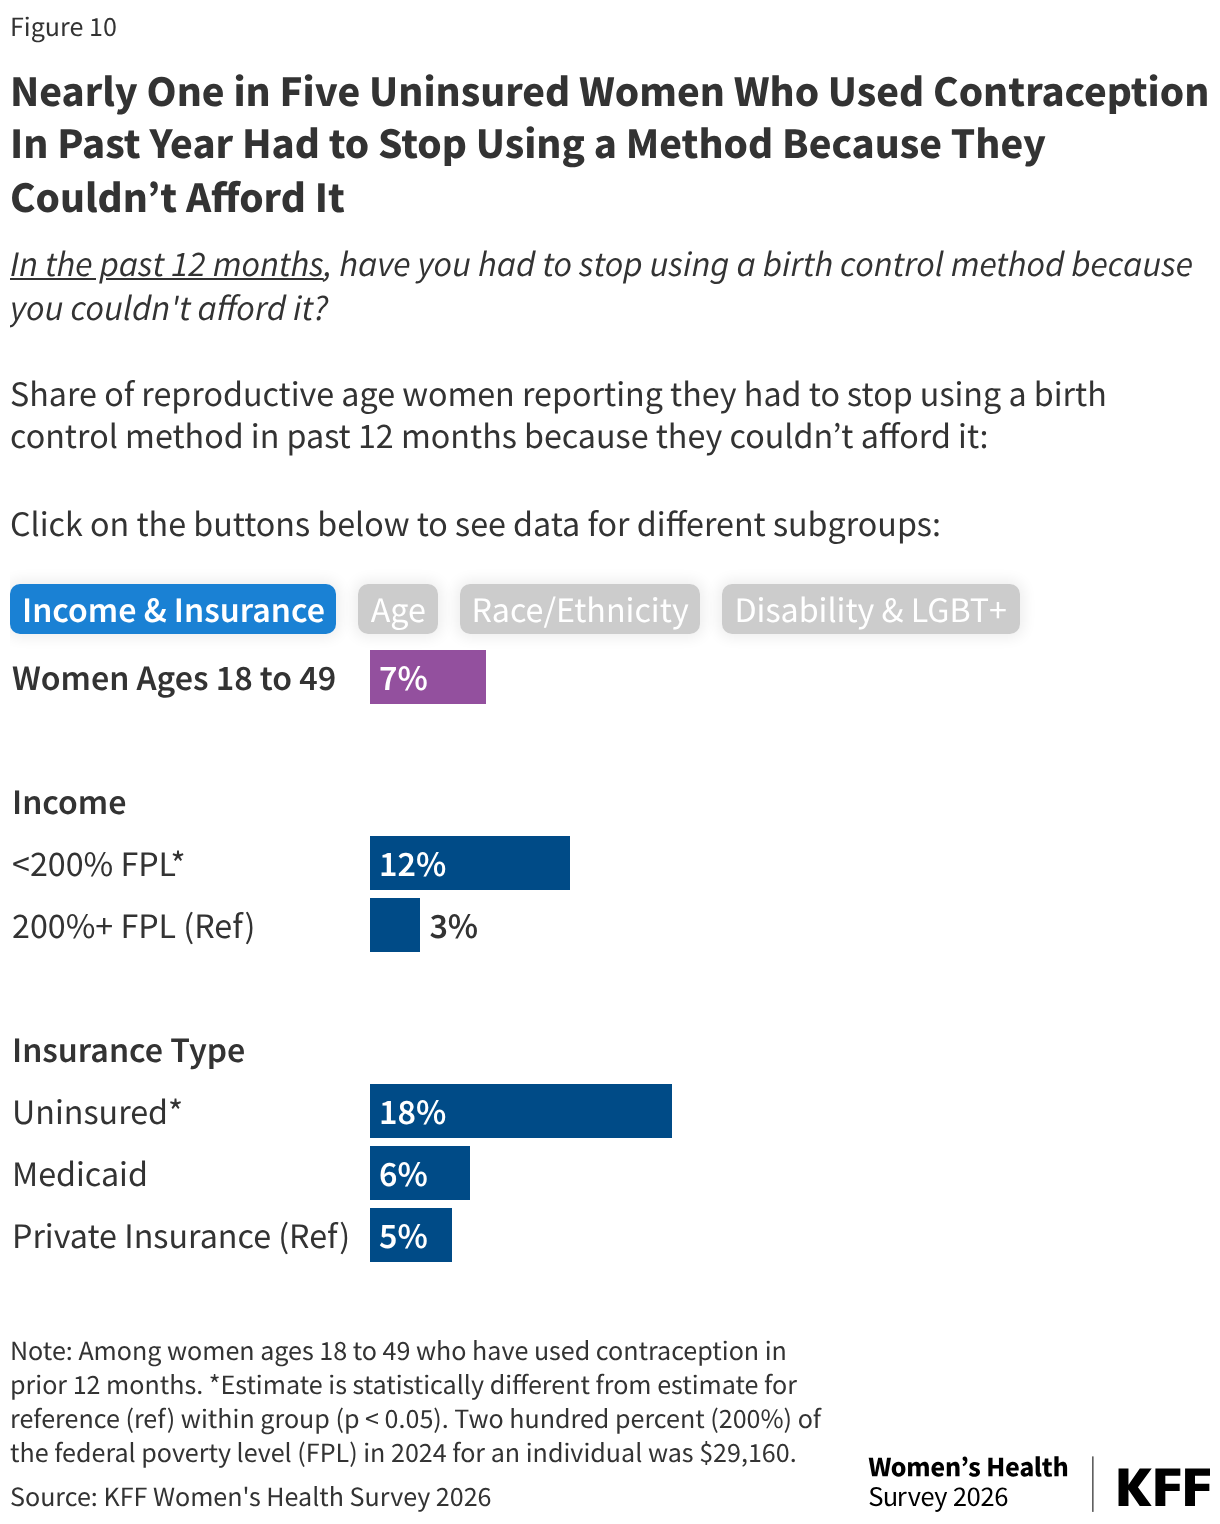
Despite having better contraceptive coverage and more affordable methods, cost is still a barrier for some women. Among contraceptive users, 7% of reproductive age women including 18% of those who are uninsured, say they have had to stop using a contraceptive method because they could not afford it (Figure 10). Over one in ten (12%) women with low incomes also report having to discontinue a method due to costs. Higher shares of young women ages 18 to 25 (10%) compared to women ages 36 to 49 (4%) and Black (10%) and Hispanic (12%) women compared to White women (4%) have also had to stop using a contraceptive method because of cost.
Over the past several years there has been an increased focus on the quality of contraceptive counseling so that women can make informed decisions about their contraceptive choices. However, among contraceptive users with a contraceptive visit in the past year, less than half rate their most recent contraceptive counseling as excellent on a validated health care quality measure. This four question rating tool, the Person-Centered Contraceptive Counseling (PCCC) measure, asks patients to rate their clinician as excellent, very good, good, fair, or poor on how they: 1) respected them as a person, 2) let them say what mattered to them about their birth control method, 3) took their preferences about their birth control seriously, and 4) gave them enough information to make the best decision about their birth control method. The measure reports the share of patients who rate their clinician as “excellent” on all four dimensions. The PCCC has been endorsed by major health care quality improvement organizations and is in use in several family planning clinics across the country.
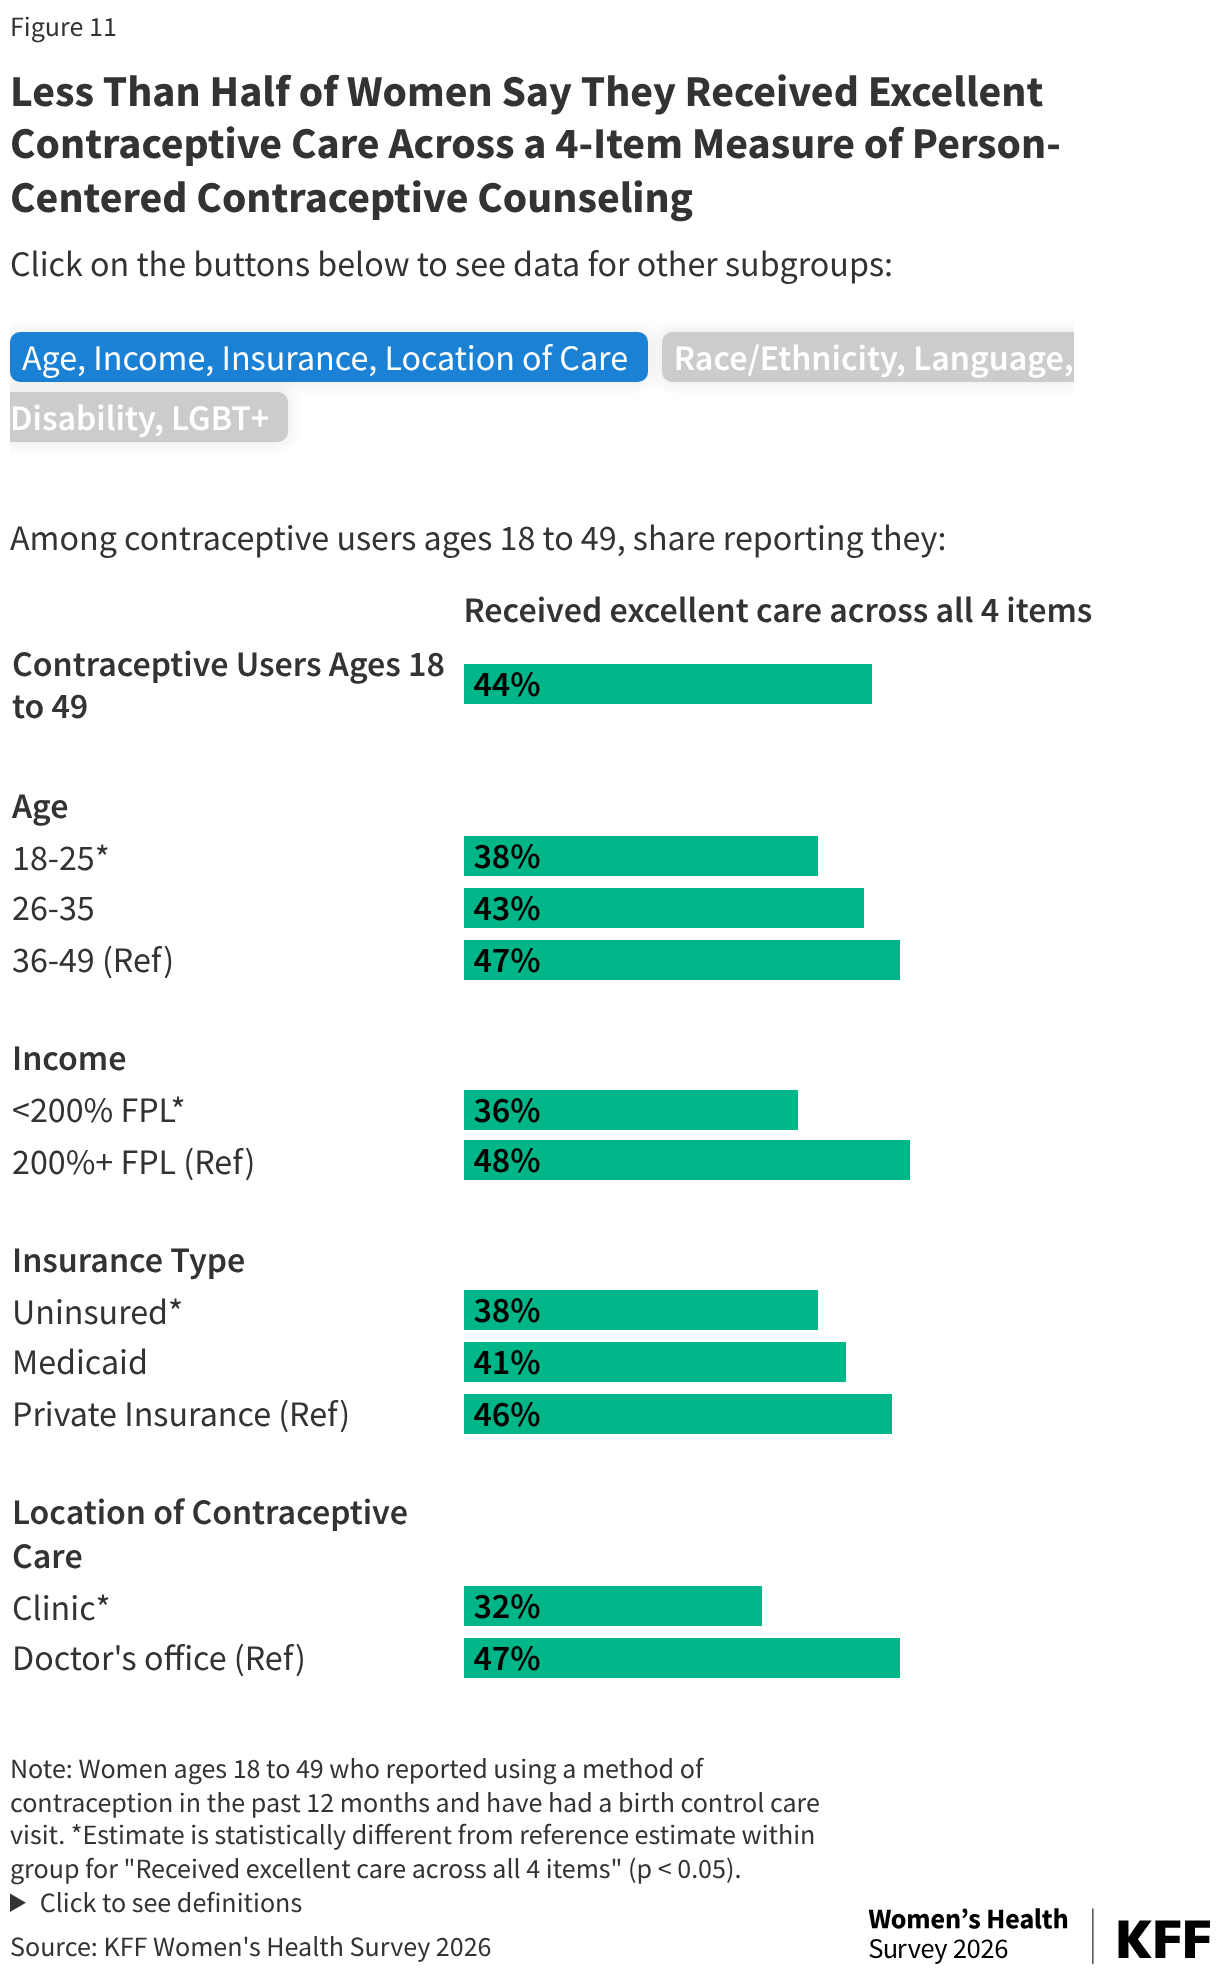
Based on this widely recognized quality measure, 44% of contraceptive users overall rated their clinician with the top rating– “excellent” across all four dimensions (Figure 11). Women who are younger (38%), with lower incomes (36%), are Hispanic (36%), or speak Spanish (26%) as their primary language are less likely to give their providers an excellent rating. A smaller share of women who are uninsured (38%) or had their last contraceptive visit at a clinic (32%) also gave their providers excellent ratings compared to those with private insurance coverage or those who went to a doctor’s office for their contraceptive care.
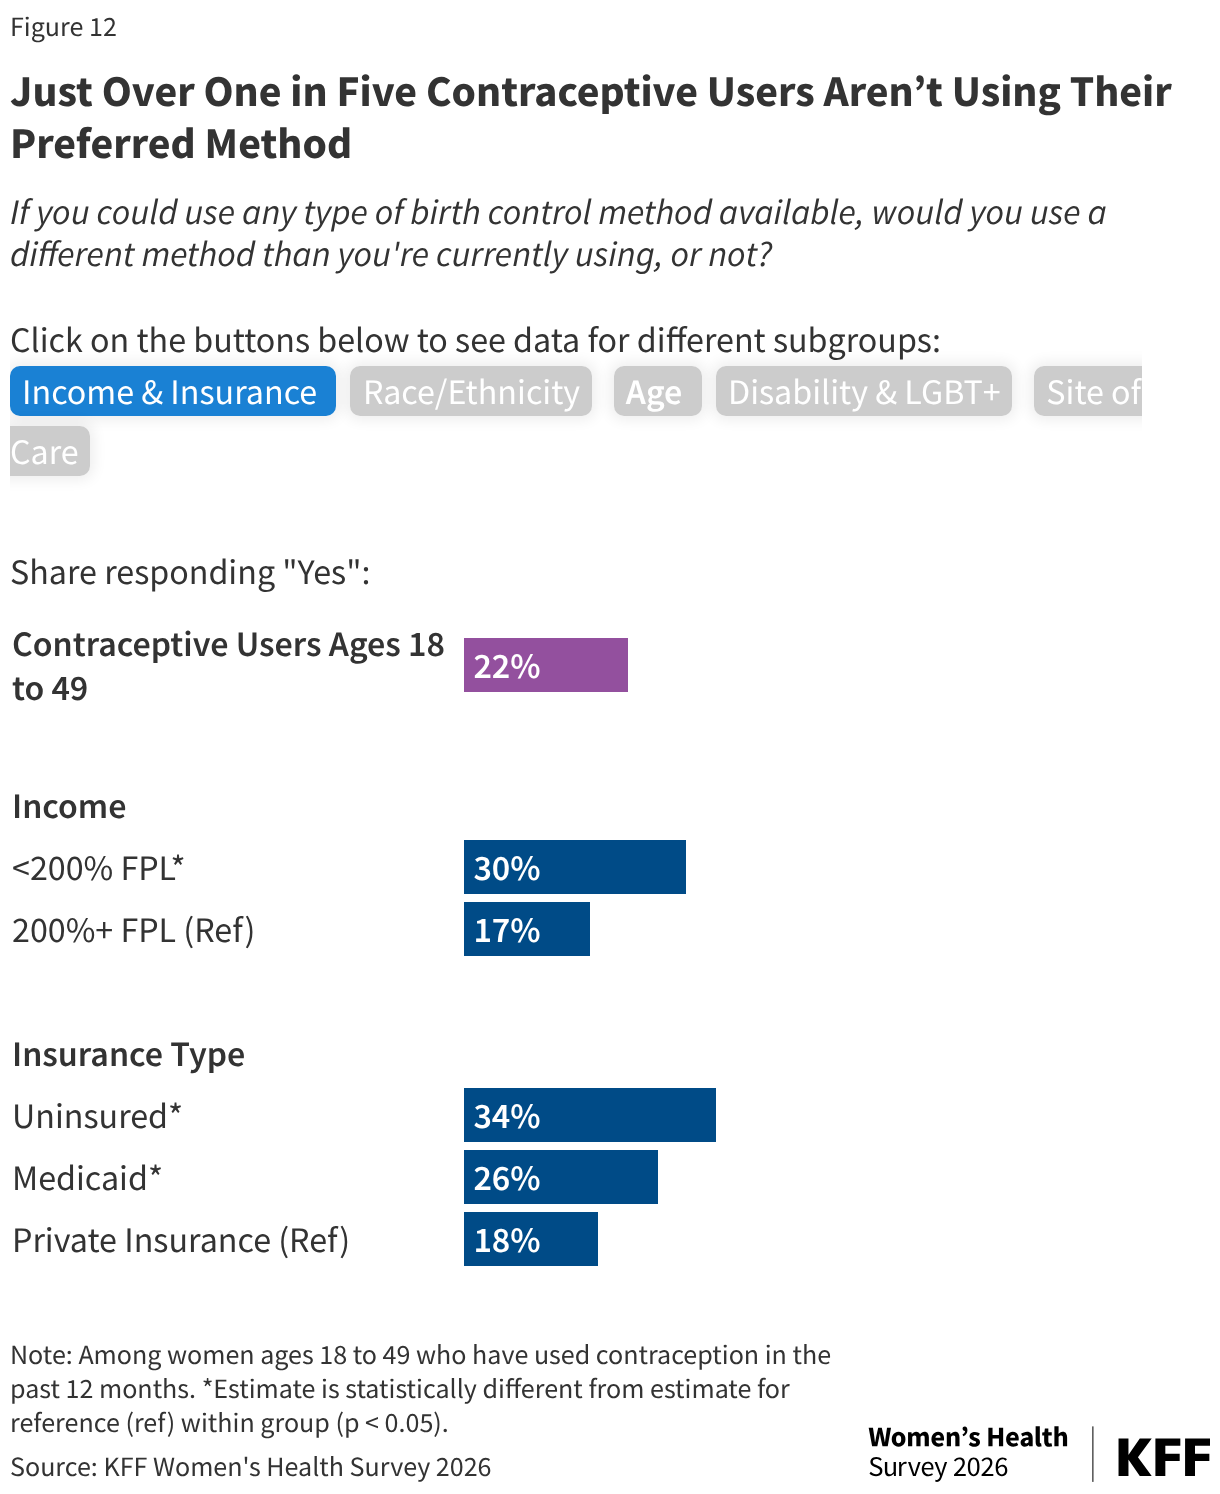
Just over one in five (22%) reproductive age women who use contraception say that they would prefer to use a different contraceptive than the one they are currently using (Figure 12). Nearly one third (30%) of women with low incomes say they would prefer to be using a different method compared to women with higher incomes (17%). This was the case for a sizable minority of uninsured women (34%) and women with Medicaid coverage (26%). Among women with disabilities, the share that say they would prefer to use another contraceptive method is nearly double the rate of women without disabilities (38% vs. 20%). A higher share of women who said the last contraceptive method they used was contraceptive pills (23%), condoms (24%), or withdrawal (26%) say they would prefer to be using a different method compared to 14% women who last used an IUD or a fertility awareness-based method (data not shown).
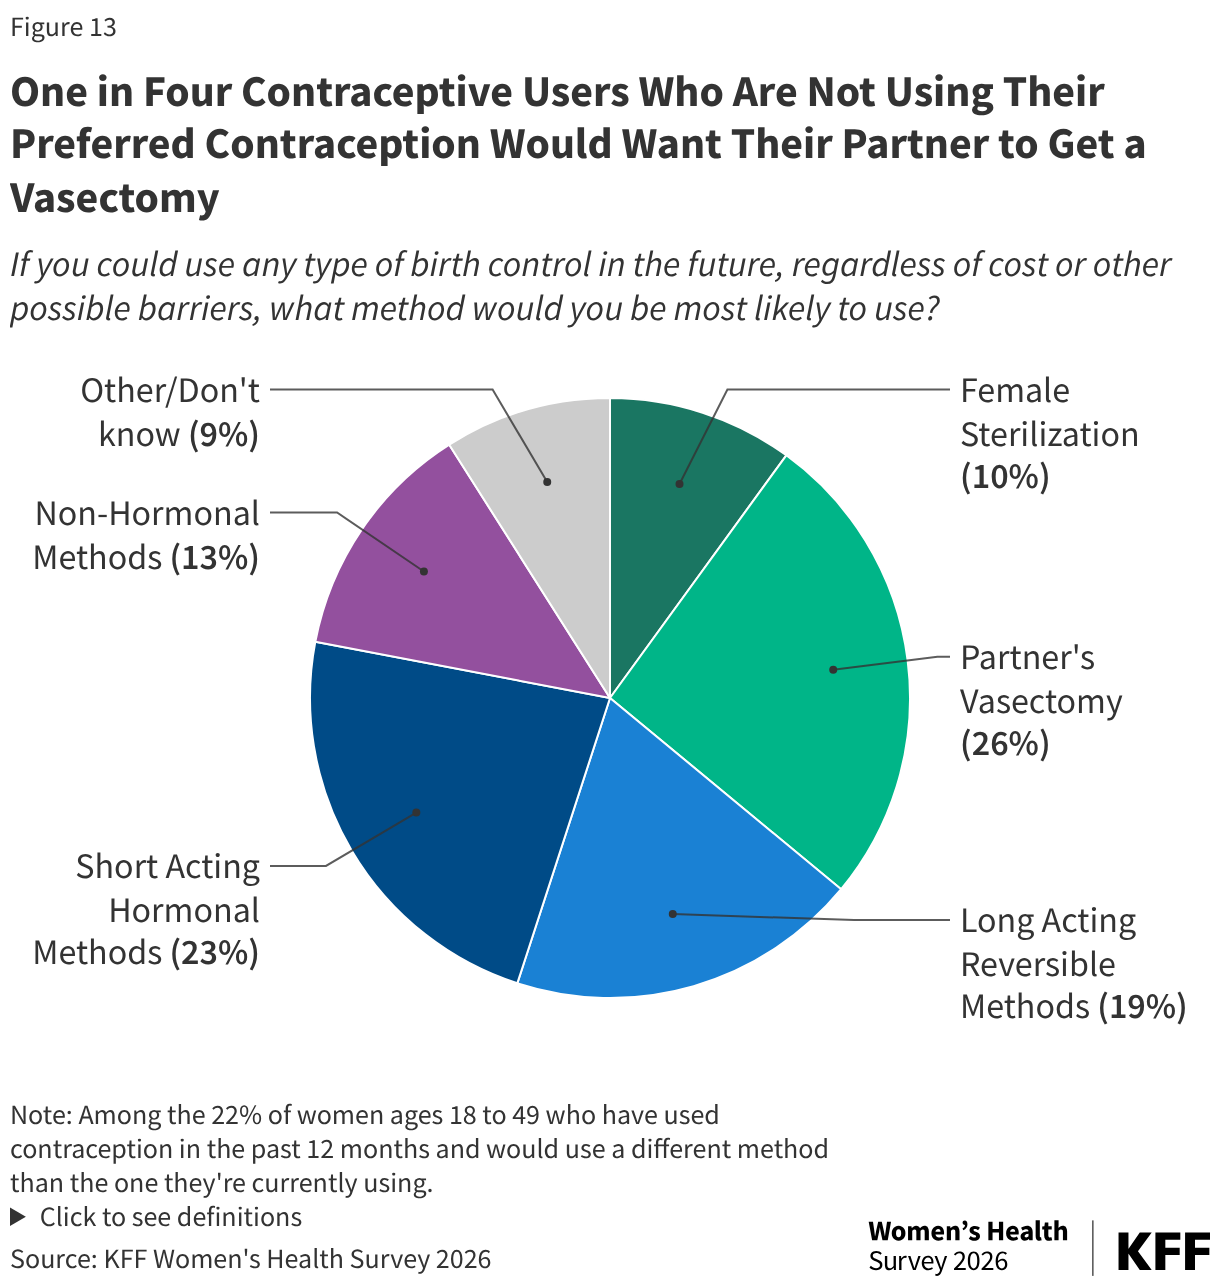
Among those who would prefer to be using a different method, about a quarter (26%) would like their partner to get a vasectomy and (23%) would prefer to use short-acting hormonal methods such as oral contraceptives (Figure 13). Nearly one in five (19%) say they would prefer to use a LARC (IUD or implant). One in ten (10%) say they would like to have a sterilization procedure themselves and 13% would prefer to use a non-hormonal method.
Side effects and affordability are the leading reasons cited as to why contraceptive users are not using their preferred method. One in four (26%) contraceptive users who are not using their preferred method say the primary reason is concern about side effects or previously experienced side effects (Figure 14). Another one in five (19%) say they can’t afford their preferred method.
Among women who would prefer to be using a hormonal method, including pills, patch, ring, injectable, IUDs, or implants, 35% say they are not using it because of concern about side effects compared to 9% of those who would prefer sterilization and one in five (21%) say they can’t afford their preferred method (data not shown). Nearly four in ten (38%) women who prefer a permanent method cite their partner’s objection compared to only 3% of women who prefer a hormonal method and 23% say affordability is the reason (data not shown).
Methodology
The 2026 KFF Women’s Health Survey was designed and analyzed by women’s health researchers at KFF. The survey was conducted from March 11 – April 14, 2026, online and by telephone among a nationally representative sample of 5,854 adults ages 18 to 64, including 3,538 women ages 18 to 49. Women include anyone who selected woman as their gender. Sampling, data collection, weighting, tabulation, and IRB approval by the University of Southern Maine’s Collaborative Institutional Review Board were managed by SSRS of Glenn Mills, Pennsylvania in collaboration with women’s health researchers at KFF.
Throughout the reports of findings, we refer to “women.” This includes respondents who said their gender is “woman,” and includes those who selected “woman” in addition to another gender, such as “transgender,” or “non-binary,” or another gender. We followed this approach to try to include as many people as possible but recognize that some people who need and seek abortion and other reproductive health care services may not be represented in the findings or identify as women. Some questions about sexual and reproductive health were only asked among those with a specific sex assigned at birth (i.e. male or female).
The national sample was drawn from two nationally representative probability-based panels: the SSRS Opinion Panel and the Ipsos Knowledge-Panel. The SSRS Opinion Panel is a nationally representative probability-based panel where panel members are recruited randomly in one of two ways: (a) Through invitations mailed to respondents randomly sampled from an Address-Based Sample (ABS) provided by Marketing Systems Groups (MSG) through the U.S. Postal Service’s Computerized Delivery Sequence (CDS); (b) from a dual-frame random digit dial (RDD) sample provided by MSG. For the online panel component, invitations were sent to panel members by email followed by up to five reminder emails. 5,660 panel members completed the survey online and panel members who do not use the internet were reached by phone (n=194). Another 514 respondents were reached online through the Ipsos Knowledge Panel to help reach adequate sample sizes among subgroups of interest, specifically women ages 18 to 49. This panel is recruited using ABS, based on a stratified sample from the CDS. The questionnaire was translated into Spanish, so respondents were able to complete the survey in English or Spanish.
The national sample was weighted by splitting the sample into three groups: [1] Women 18-49, [2] Women 50-64, and [3] Men 18-64 and each group was separately weighted to match known population parameters (see table below for weighting variables and sources). Weights within the three groups were then trimmed at the 4th and 96th percentiles, to ensure that individual respondents do not have too much influence on survey-derived estimates. After the weights were trimmed, the samples were combined, and the weights adjusted, so that the groups were represented in their proper proportions for a final combined, gender by age-adjusted weight.
| Dimensions | Source |
| Age | Current Population Survey 2025 |
| Education | |
| Age by Education | |
| Age by Gender | |
| Census Region | |
| Race/Ethnicity by Nativity | |
| Home Tenure | |
| Civic Engagement | 2023 CPS Volunteering and Civic Life Supplement |
| Internet Frequency | Pew Research Center’s National Public Opinion Reference Survey (NPORS 2025) |
| Population Density | Claritas Pop-Facts Premier 2026 |
| Voter Registration | CPS 2024 Voting and Registration Supplement |
The margins of sampling error for the national sample of women ages 18 to 64 and reproductive age women ages 18 to 49 are plus or minus 2 percentage points. Numbers of respondents and margins of sampling error for key subgroups are shown in the table below. For results based on other subgroups, the margin of sampling error may be higher. Sampling error is only one of many potential sources of error and there may be other unmeasured error in this survey.
| Group | N (unweighted) | M.O.S.E. |
| National Women Ages 18-49 | 3,538 | ± 2 percentage points |
| Women 18 to 49 who have used contraception in the past 12 months | 2,546 | ± 2 percentage points |
| White, non-Hispanic | 1,547 | ± 3 percentage points |
| Black, non-Hispanic | 624 | ± 5 percentage points |
| Hispanic | 946 | ± 4 percentage points |
| Asian or Pacific Islander | 307 | ± 7 percentage points |
| <100% FPL | 566 | ± 5 percentage points |
| 100-200% FPL | 742 | ± 4 percentage points |
| 200%+ FPL | 1,958 | ± 3 percentage points |
| Rural | 415 | ± 6 percentage points |
| Urban/Suburban | 3,117 | ± 2 percentage points |
| Democrat/Democrat leaning | 1,765 | ± 3 percentage points |
| Independent | 497 | ± 5 percentage points |
| Republican/Republican leaning | 900 | ± 4 percentage points |
| Pro-life | 1,024 | ± 4 percentage points |
| Pro-choice | 2,487 | ± 2 percentage points |
General Notes:
The sample primarily includes English-speaking Asian adults and, therefore, may not be representative of the overall Asian adult population. Despite this limitation, it is important to report the views of Asian adults on the topics in this study. As always, Asian adults’ responses are incorporated into the general population figures throughout this report.
Income is based on 2023 ASPE income levels. Two hundred percent (200%) of the federal poverty level (FPL) in 2023 for an individual was $29,160.