Enrollment in Medicare Advantage, the private plan alternative to traditional Medicare, has increased steadily over time. The growth in enrollment has been accompanied by an increase in the number of Medicare Advantage plans, with the average beneficiary having the option to choose among 42 plans in 2025, including 34 with prescription drug coverage. Most Medicare Advantage insurers use provider networks, along with other tools, such as prior authorization, to help manage utilization and lower costs. While these practices may contribute to insurers’ ability to offer extra benefits and reduce cost sharing, they may also impose barriers to care by restricting choice of physicians, hospitals, and other providers, introducing additional complexity in comparing and choosing plans, and creating potential for disruption in care arrangements for patients when their hospitals and physicians are no longer in-network.
Despite the wide range of Medicare coverage options available, there are limited decision-support tools for beneficiaries wishing to compare Medicare Advantage provider networks to each other and to traditional Medicare. While Medicare beneficiaries say that physician availability is an important factor in selecting their coverage, it can be challenging to assess which physicians are in-network across all available plans. In 2025, as with prior years, the Medicare Plan Finder did not include Medicare Advantage provider network information. Beneficiaries have been directed to each plan’s website to obtain information about the provider network, and typically, the network directories are not available in a uniform, easy-to-compare format. Further compounding the problem, these directories are often inaccurate. As of October 2025, in advance of the 2026 plan year, CMS will post provider directory information on the Plan Finder using information aggregated by a third party, and beginning in 2027, Medicare Advantage insurers will be required to submit provider information directly to CMS for publication online.
To understand how much provider networks vary across Medicare Advantage plans, this brief examines the share of physicians available to Medicare Advantage enrollees as a share of physicians available to traditional Medicare beneficiaries, by county, plan characteristics, and physician specialties, using 2022 Medicare Advantage provider directories. (See Methods.) The analysis finds wide variation in network breadth across plans and compared to traditional Medicare The size of a Medicare Advantage plan’s network does not necessarily indicate whether it includes enough physicians with the right expertise who are available when patients need care, or whether those physicians are accepting new patients, though smaller networks increase the chances that enrollees pay more for going out of network or experience some disruption in their care arrangements.
Key Findings:
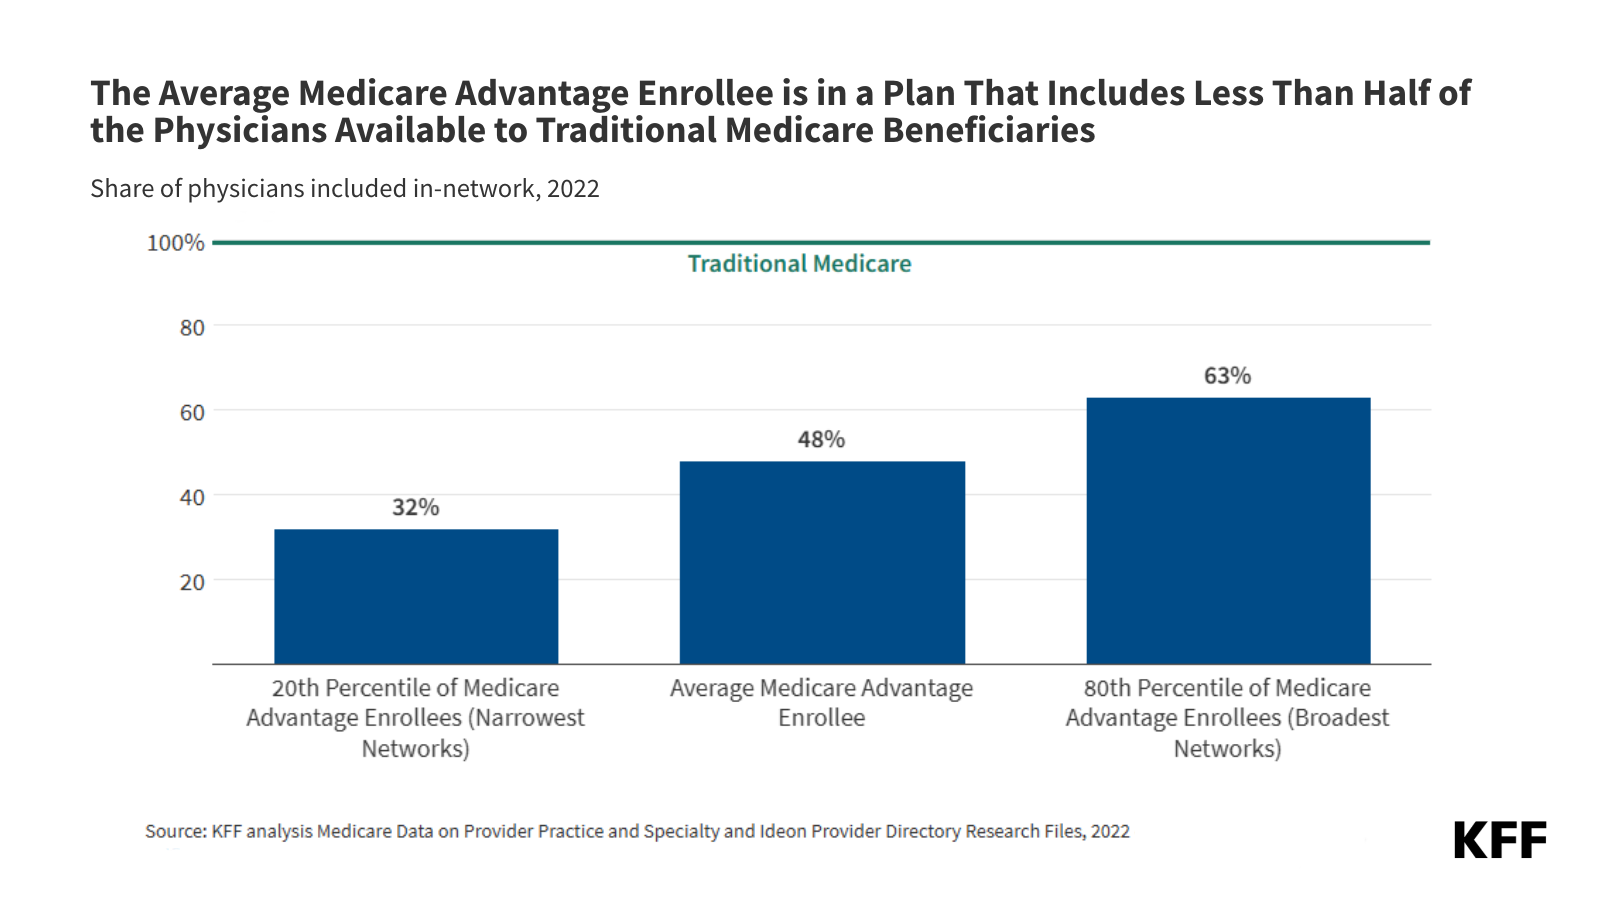
- Medicare Advantage enrollees were in a plan that included just under half (48%) of all physicians available to traditional Medicare beneficiaries in their area in 2022, on average. Narrower networks limit which doctors, specialists, and other health care providers are available to Medicare Advantage enrollees, unless they are willing and able to pay more to go out-of-network. Narrower networks can also be disruptive for patients who need to switch doctors or hospitals to stay within the network for their care.
- For the one-fifth of Medicare Advantage enrollees in plans with the narrowest network, two out of three physicians available to beneficiaries in traditional Medicare in their area were out-of-network.
- Conversely, for the one-fifth of Medicare Advantage enrollees in plans with the broadest networks, fewer than one-third of physicians available to traditional Medicare beneficiaries were out of their plan’s network.
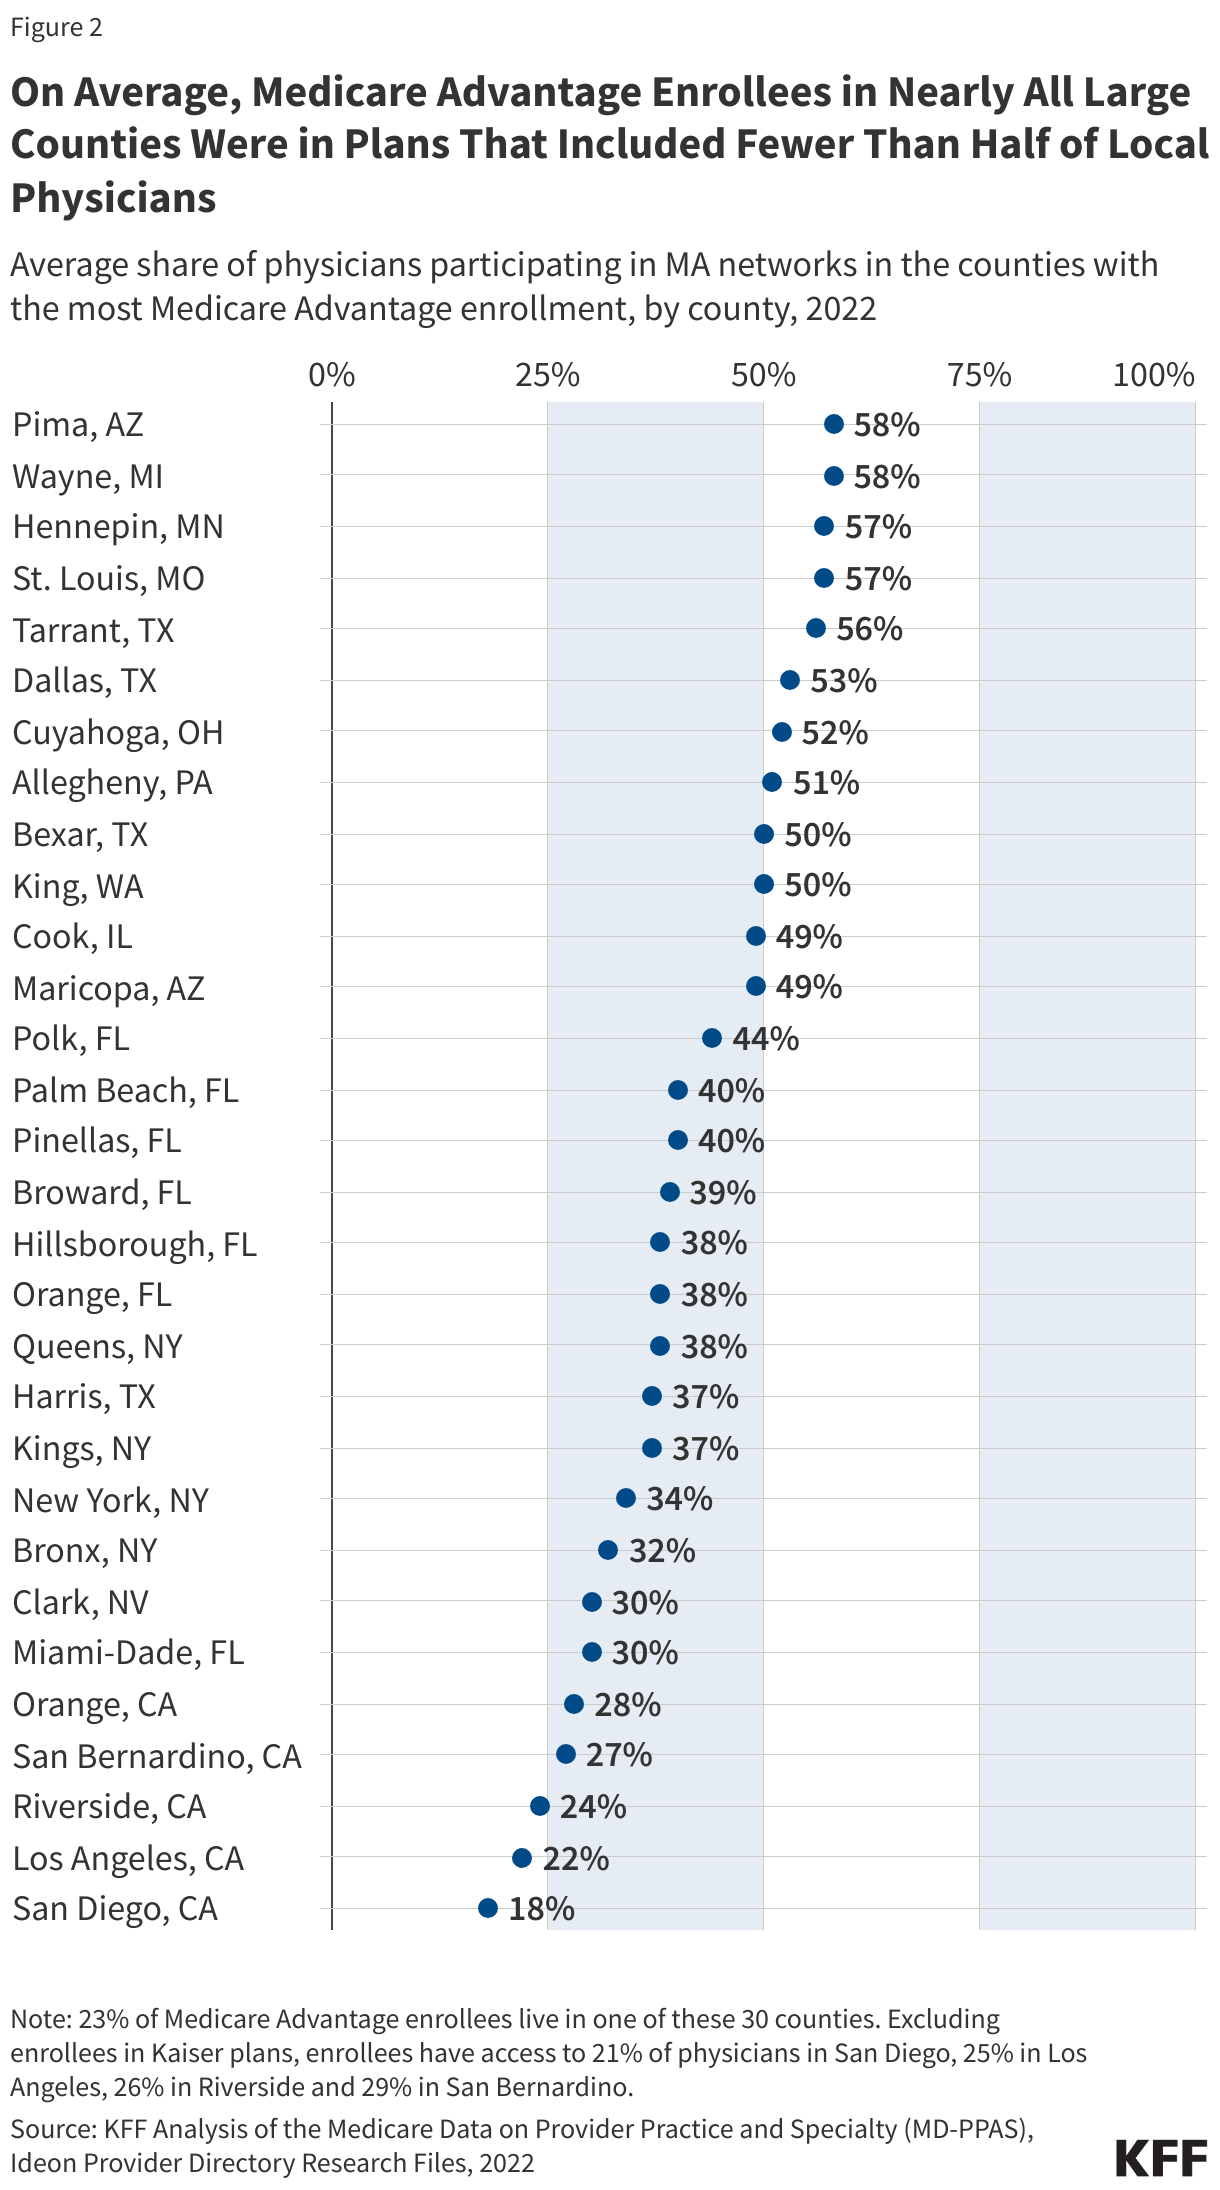
- The breadth of Medicare Advantage networks varied widely across counties. Among the 30 counties with the largest Medicare Advantage enrollment, the share of physicians available to Medicare Advantage enrollees as a share of physicians available to traditional Medicare beneficiaries ranged from an average of 18% in San Diego, CA to an average of 58% in Pima, AZ (Tucson). This variation across geographic areas means that some Medicare Advantage enrollees have more choice among health care providers than others.
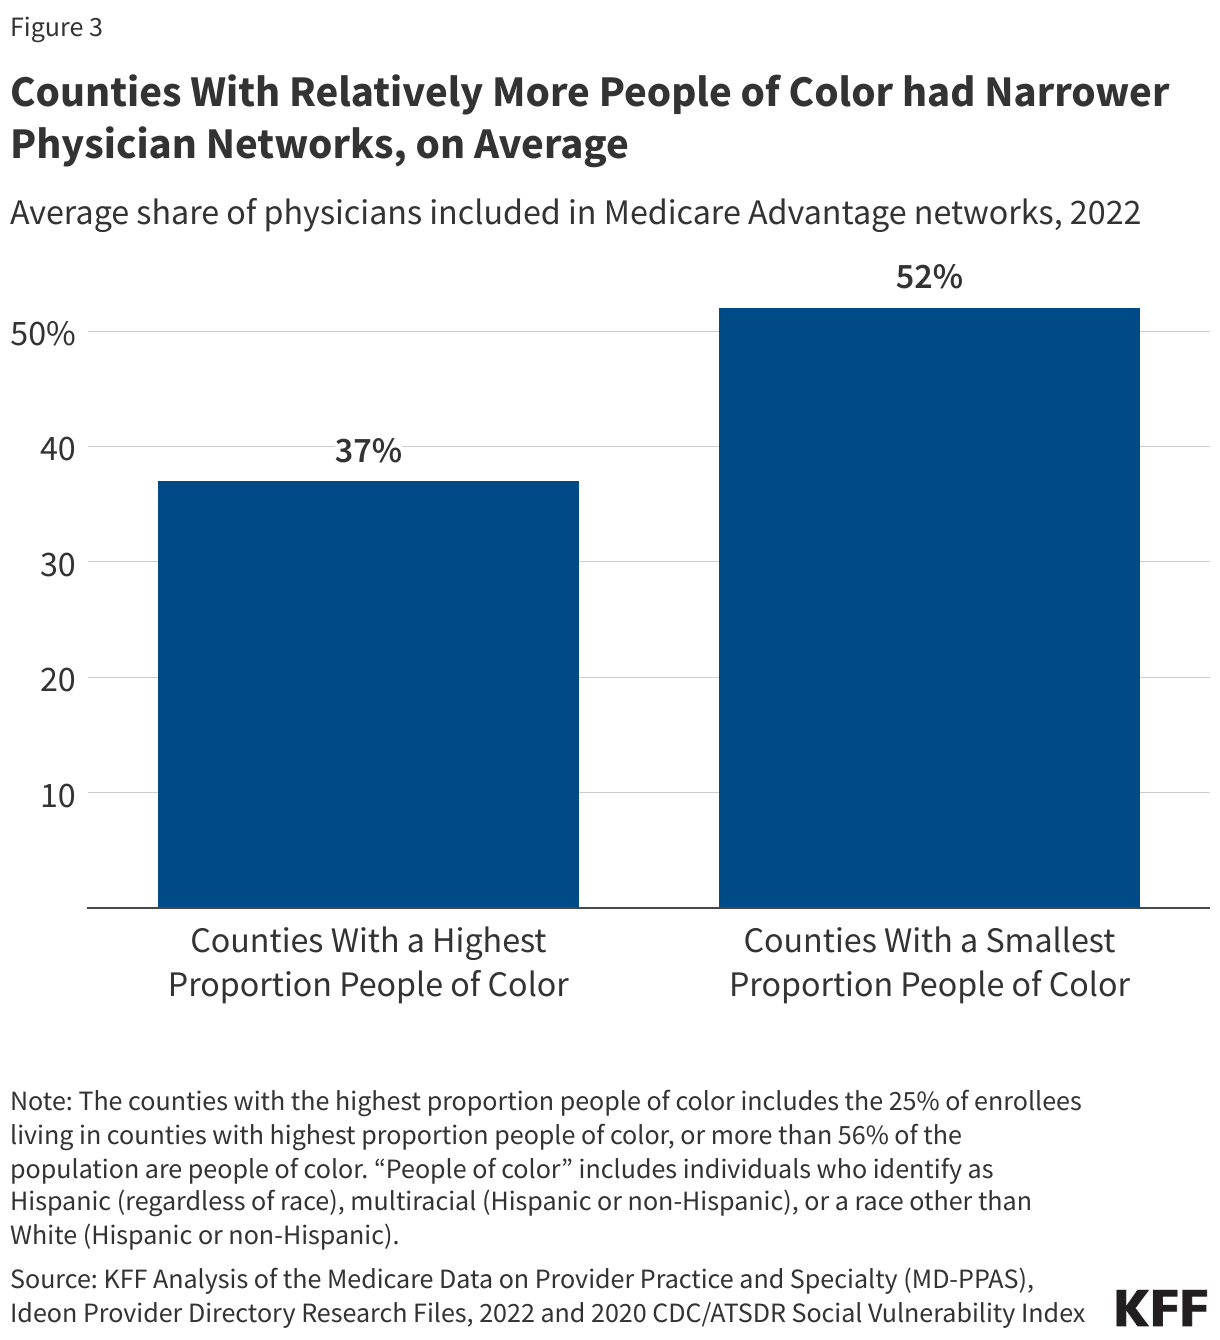
- In counties where larger shares of the population were people of color, a smaller share of physicians available to traditional Medicare beneficiaries were in-network, on average, than in other counties (37% vs 52%).
- Even within the same county, physician networks often varied widely across plans. One third (32%) of all Medicare beneficiaries lived in a county where at least one plan had less than one-quarter of physicians available to traditional Medicare beneficiaries and at least one plan included at least two-thirds of physicians available to traditional Medicare beneficiaries, though these variations are difficult for beneficiaries to decipher and not obvious when potential enrollees are comparing their Medicare coverage options.
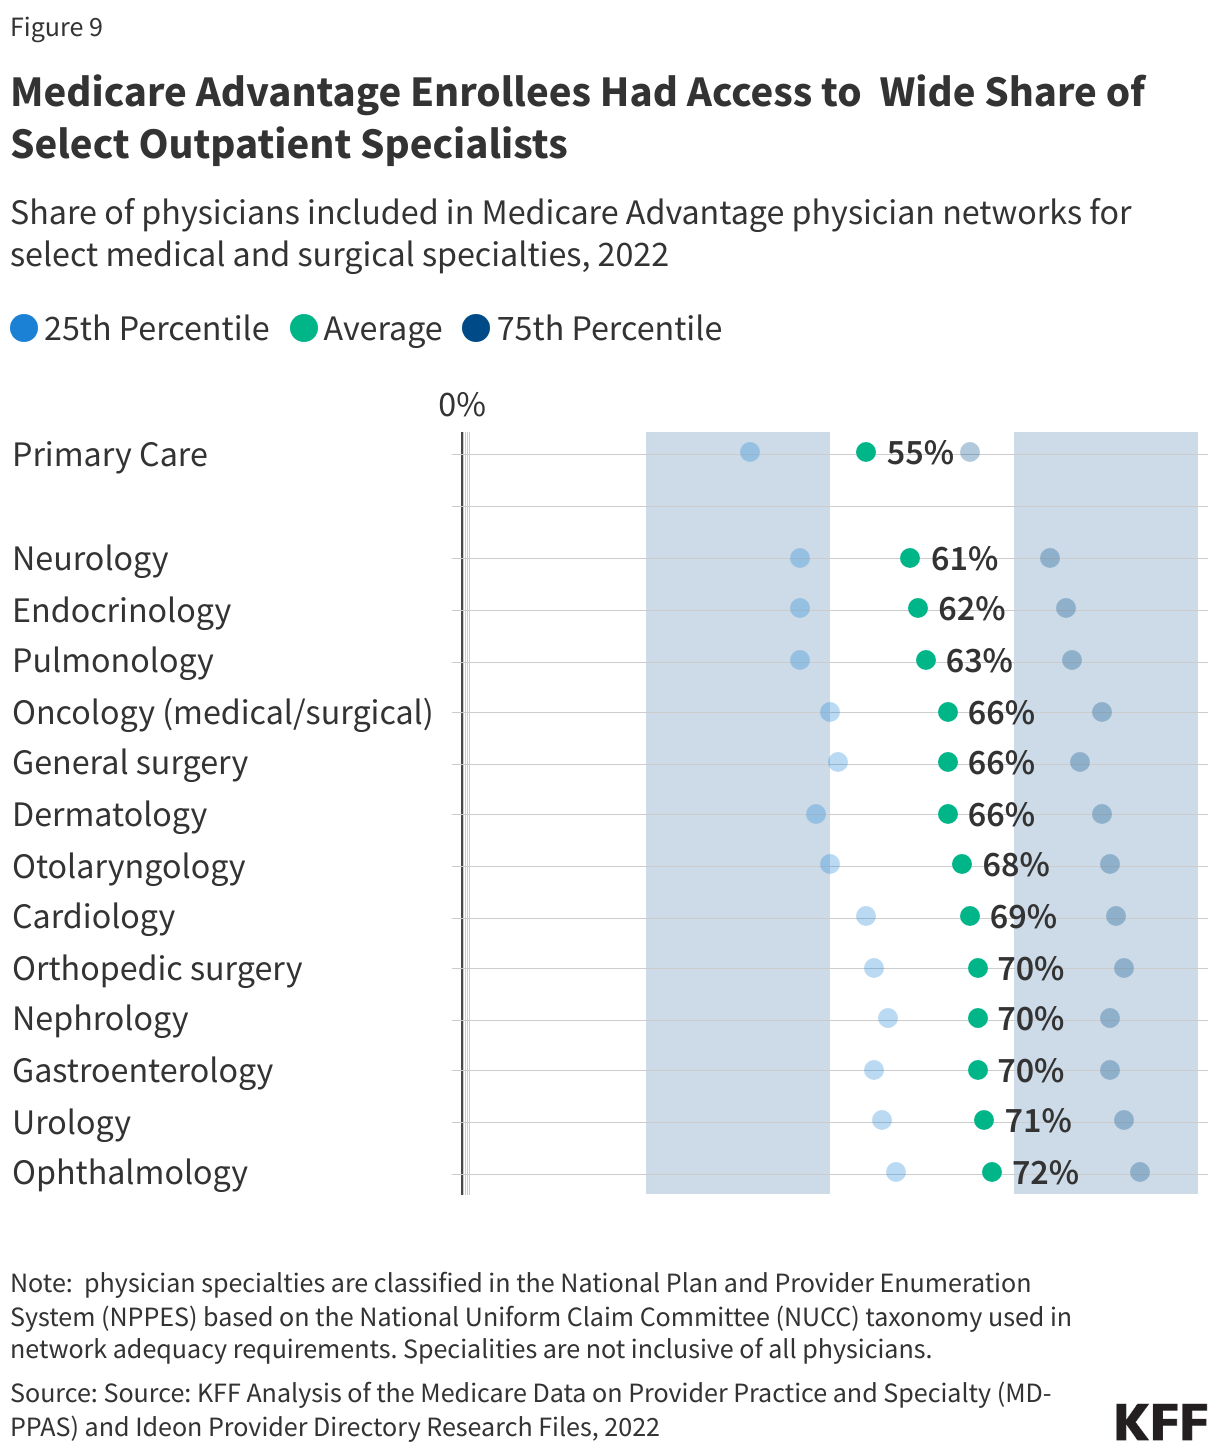
- The share of physicians available to Medicare Advantage enrollees varied by specialty. Generally, larger shares of outpatient medical and surgical specialists were in plan networks than primary care physicians, with as many as 72% of ophthalmologists available to traditional Medicare beneficiaries in plan networks compared to only 55% of primary care physicians, on average.
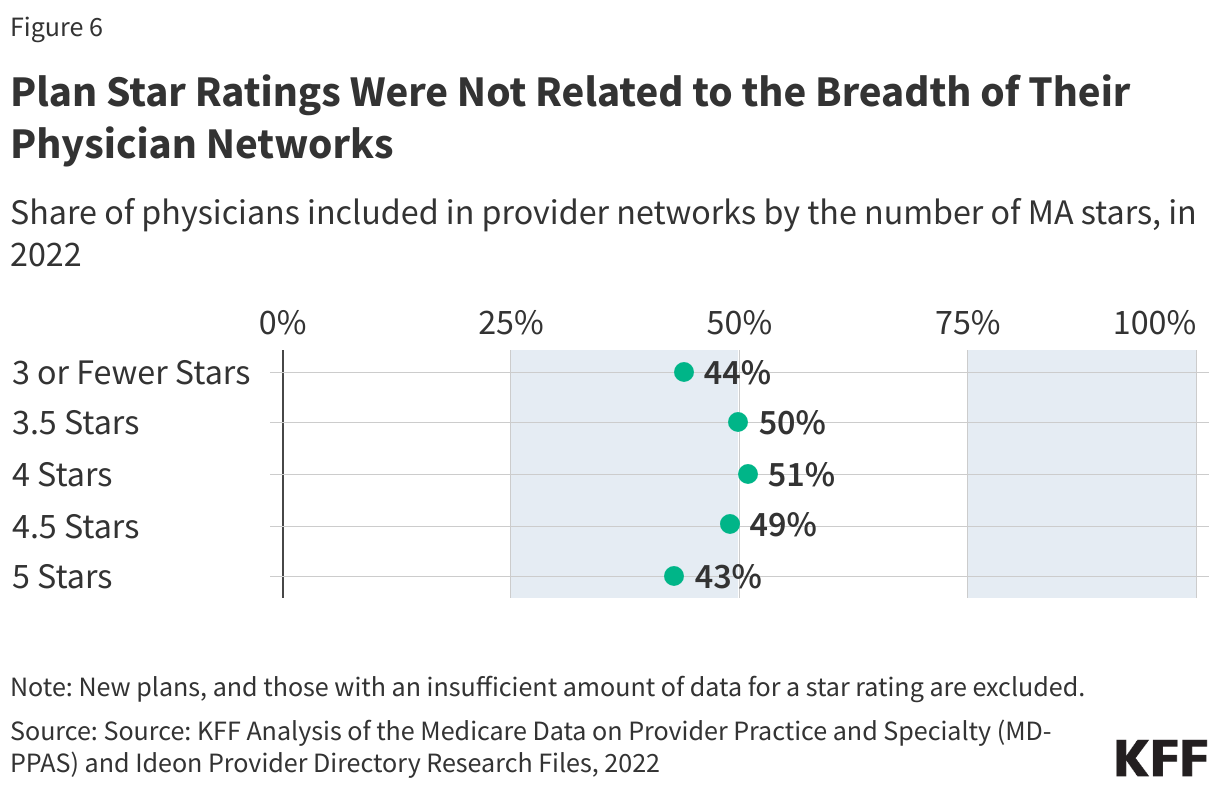
- Medicare Advantage plan quality star ratings were not correlated with the breadth of the physician network. Though star ratings were intended to help beneficiaries choose a plan that best meets their needs, they do not convey the information needed for potential enrollees who prioritize the breadth of the provider network.
Medicare Advantage Enrollees had Access to About Half of the Physicians Available to Traditional Medicare Beneficiaries.
Traditional Medicare beneficiaries may see any physician who participates in Medicare, as long as the physician is taking new patients. According to a separate KFF analysis, just 1% of non-pediatric physicians have formally opted out of the Medicare program nationwide, and the vast majority of office-based physicians accept new Medicare patients. In contrast, enrollees in Medicare Advantage must see providers who participate in their plan’s network or potentially pay higher cost-sharing. On average, Medicare Advantage enrollees were in a plan that included about half (48%) of physicians available to traditional Medicare beneficiaries in their area in 2022 (Figure 1).
Some physicians are substantially less likely to participate in a Medicare Advantage network, such as hospital-based emergency medicine doctors and anesthesiologists. When these providers deliver certain services, such as care in an emergency room or anesthesia during surgery at an in-network facility, patients will not be liable for additional costs because the doctor is out-of-network. If hospital-based physicians are excluded from the analysis, the share of physicians available to traditional Medicare beneficiaries who participate in Medicare Advantage networks increases to 62%, on average. This analysis considers all individual-level physicians who billed traditional Medicare, including hospital-based physicians. Based on available data is not possible to identify which physicians, under what circumstances, would not lead to higher costs for patients if the physician were out-of-network.
Many Medicare Advantage enrollees were in plans with narrower networks that included substantially fewer physicians. One in five Medicare Advantage enrollees were in plans with 32% or fewer of the physicians serving traditional Medicare beneficiaries. This means that for these Medicare Advantage enrollees, more than two out of three physicians available to traditional Medicare beneficiaries were out-of-network. At the same time, many Medicare Advantage enrollees were in plans with broader networks, with one in five Medicare Advantage enrollees in plans that included at least 63% of the physicians available to traditional Medicare (Figure 1).
The share of physicians included in Medicare Advantage plan networks varied widely across counties.
Medicare Advantage plans are offered at the county level. Like other characteristics of the Medicare Advantage market, such as plan availability, the average breadth of Medicare Advantage plan networks varied widely across counties, ranging from an average of just 15% of physicians available to traditional Medicare beneficiaries in Charles County, MD (outside Washington, D.C.) to 88% of physicians available to traditional Medicare beneficiaries in Redwood, MN (in southern Minnesota).
Among the 30 counties with the largest Medicare Advantage enrollment, the share of physicians included in plan networks ranged from an average of 18% in San Diego, CA, to an average of 58% in Pima, AZ (Tucson).
Just 30 counties are home to more than 20% of all Medicare Advantage enrollees. In these counties, the share of physicians available to traditional Medicare beneficiaries included in plan networks ranged from an average of 18% in San Diego, CA to 58% in Pima, AZ (Tucson). At least half of physicians were in-network in just 10 of these 30 counties. Conversely, in 20 of these 30 counties, fewer than half of all physicians available to traditional Medicare beneficiaries were in-network for Medicare Advantage enrollees, on average (Figure 2).
Counties with relatively larger populations of people of color had smaller Medicare Advantage networks, on average
Medicare Advantage enrolls Black, Hispanic, and Asian and Pacific Islander Medicare beneficiaries at higher rates than White Medicare beneficiaries. Across dozens of measures examined in the literature, people of color, particularly Black Medicare Advantage enrollees, often fare worse than White Medicare Advantage enrollees.
Plans in counties with a disproportionate share of residents who are people of color tended to have narrower networks. More specifically, Medicare Advantage enrollees living in counties with the largest share of people of color had access to just 37% of the physicians available to traditional Medicare beneficiaries, on average, compared with 52% in counties where people of color made up a smaller share of the population (Figure 3).
The differential access to physicians persists when looking only within metropolitan counties (36% vs. 51%), which have narrower networks on average (see below) and often larger populations of people of color.
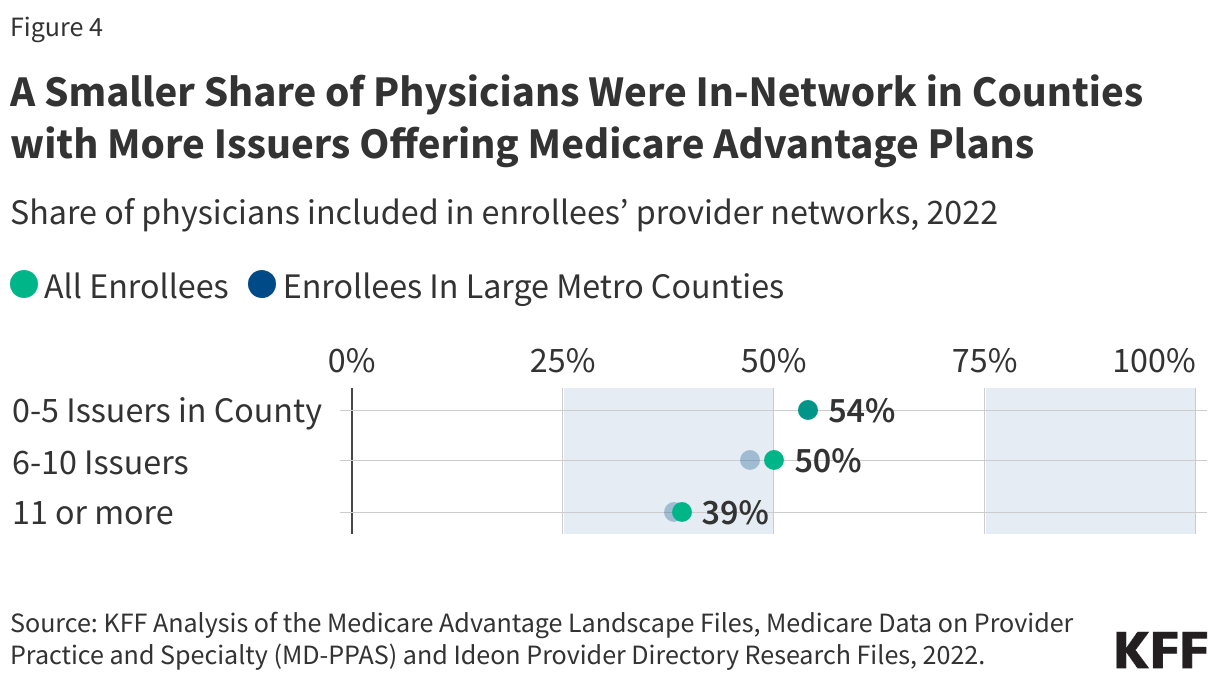
Counties with a larger number of insurers had smaller physician networks, on average.
In 2022, the average Medicare beneficiary could choose from plans offered by nine firms, and one-quarter of beneficiaries had access to plans from 11 or more firms. On average, Medicare Advantage enrollees in counties where more firms offered plans were in plans with smaller networks. Specifically, Medicare Advantage enrollees in counties with 11 or more firms were in plans that included less than 4 in 10 (39%) physicians available to traditional Medicare beneficiaries in the area, compared to 54% among Medicare Advantage enrollees in counties with five or fewer firms (Figure 4). The share of physicians who were in-network on average was similar when examining all Medicare Advantage enrollees and just those in large counties.
In rural counties, more than half (53%) of physicians available to traditional Medicare beneficiaries were in-network, on average, slightly more than the national average.
A larger share of Medicare beneficiaries living in rural areas get their Medicare coverage through traditional Medicare rather than Medicare Advantage, though enrollment in Medicare Advantage has grown substantially in rural areas in recent years. On average, Medicare Advantage enrollees in rural areas have a slightly larger share of physicians available to traditional Medicare beneficiaries in the network than those in metropolitan areas, 53% compared with 47%. A substantially smaller share of physicians practice in rural areas than in metropolitan areas, so broader networks in rural areas may not translate into better access to physicians.
The size of physician networks varied widely within most counties.
Most Medicare beneficiaries can choose from dozens of Medicare Advantage plans offered in their county. The plans vary across many dimensions, such as premiums, cost sharing, out-of-pocket limits, prescription drug coverage, use of prior authorization, and the availability and generosity of benefits for non-Medicare covered services. Additionally, the breadth of physician networks varies widely.
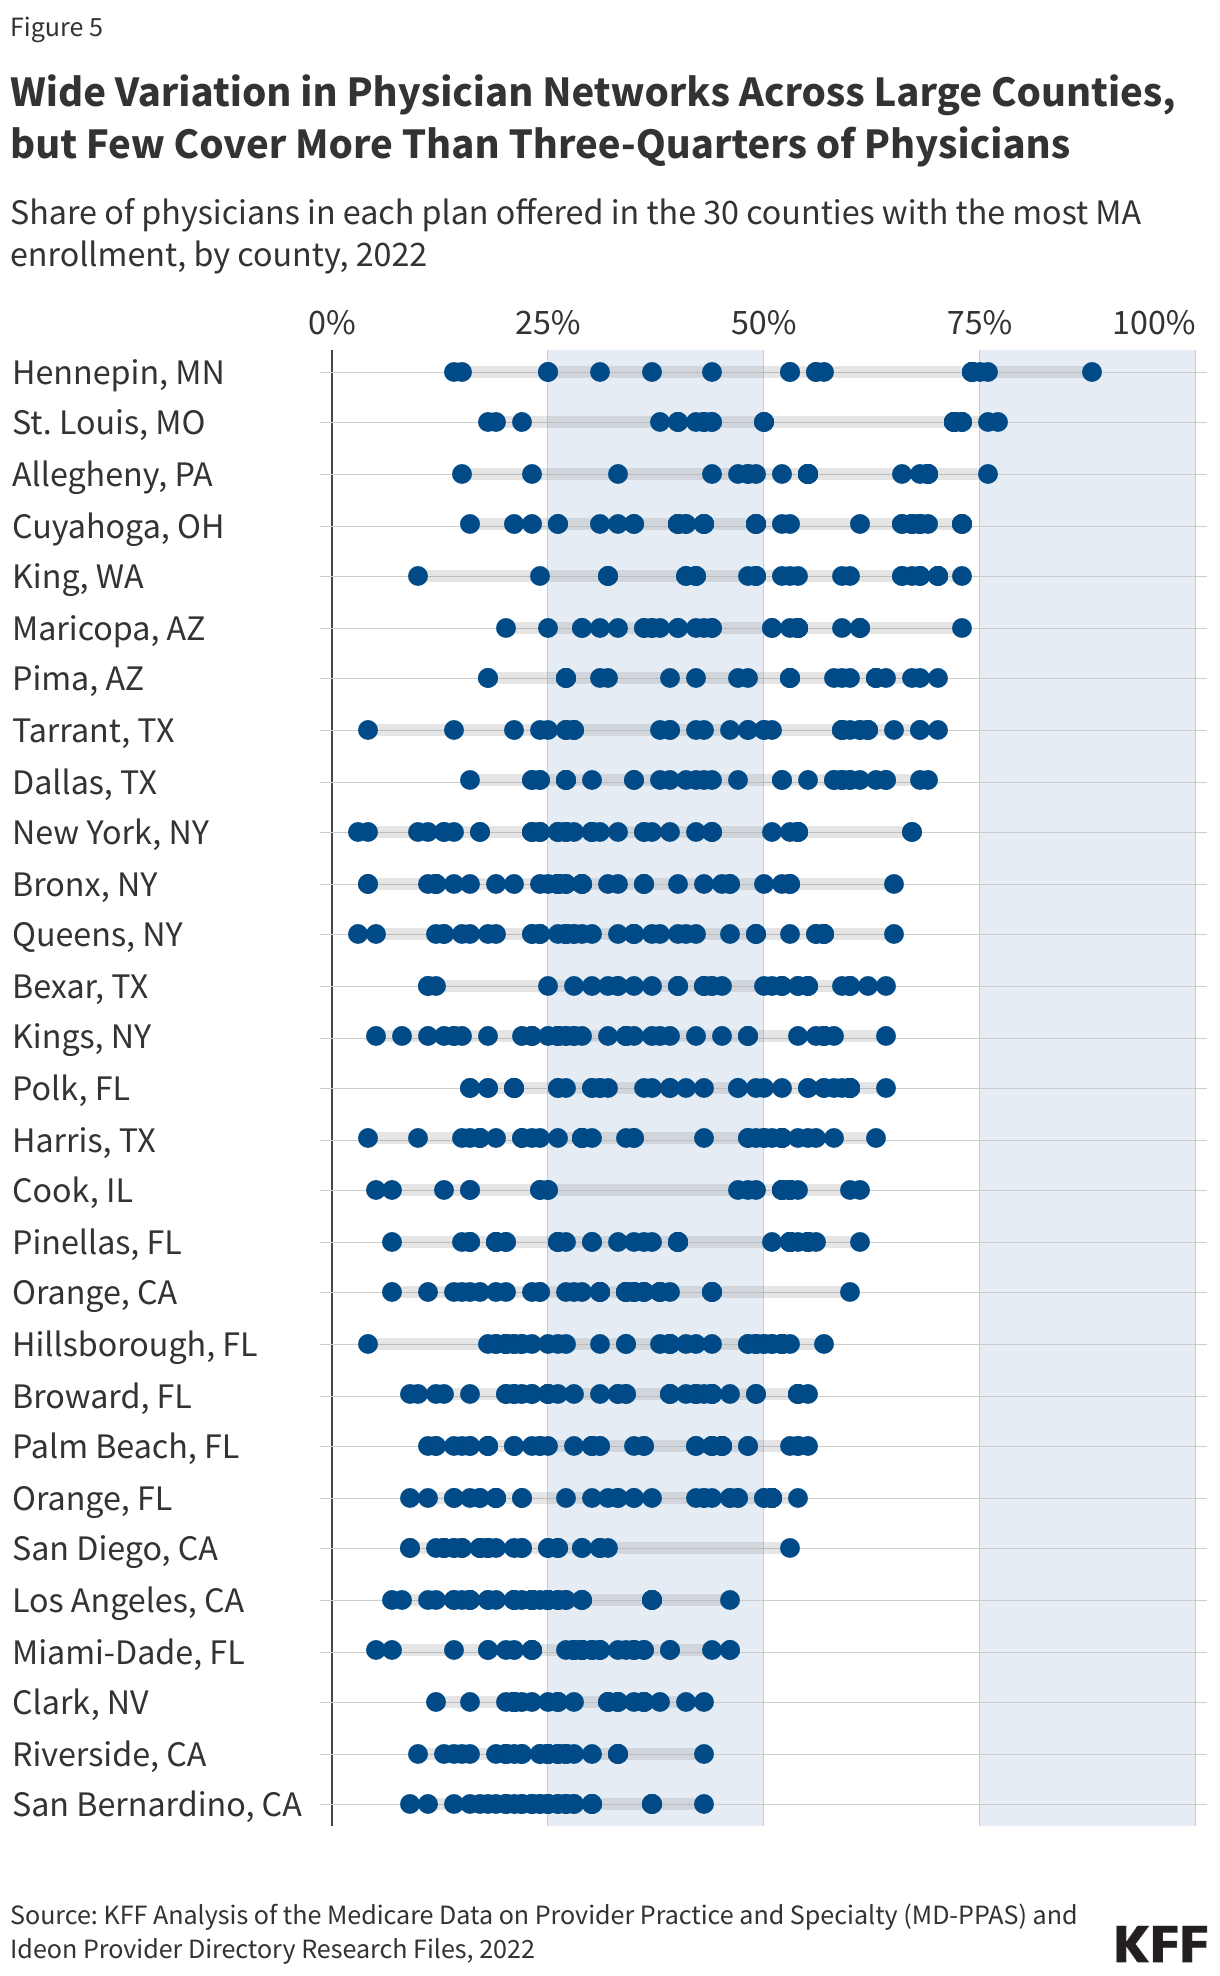
Nearly two-thirds of Medicare Advantage enrollees lived in a county with at least one plan that had fewer than 25% of physicians available to traditional Medicare beneficiaries in-network and, conversely, at least one plan with nearly two-thirds (64%) of the physicians available to traditional Medicare beneficiaries in-network. Such a large variation in the breadth of physician networks means that plan choice has substantial implications for which doctors someone can see without incurring additional cost-sharing.
Figure 5 shows the share of physicians available to traditional Medicare beneficiaries who are in network for plans offered in the 30 counties with the largest Medicare Advantage enrollment (which represents 23% of all Medicare Advantage enrollment). For example, in Hennepin County, MN (which includes Minneapolis), the share of physicians available to traditional Medicare beneficiaries who were in network ranged from 14% to 88%. In Clark County, NV (which includes Las Vegas) the difference across plans was smaller, but still substantial, ranging from 12% to 43%.
Some doctors did not participate in any Medicare Advantage plan network. On average, approximately 1 in 7 (14%) physicians who submitted Medicare claims were not included in any Medicare Advantage plan network. A large share of the doctors who do not participate in any Medicare Advantage network are hospital-based physicians, such as emergency medicine doctors and anesthesiologists (21% and 19% of all physicians who are not in any Medicare Advantage network, respectively). While obtaining care from a non-network provider generally results in higher costs for patients, that is not always the case. Specifically, emergency care is covered regardless of the provider’s network status. Additionally, patients are protected against out-of-network charges for certain services provided during a hospital stay or procedure that occurs in a hospital setting, when specific conditions are met, such as when the facility or primary provider (e.g., a surgeon) is in network. Otherwise, beneficiaries who see other types of physicians who are not in any Medicare Advantage plan network would either pay more to maintain continuity of care or need to find a new doctor.
There were differences in the size of Medicare Advantage networks across some Medicare Advantage plan characteristics, but not others.
Medicare Advantage plans with high-quality star ratings did not have larger physician networks.
One of the pieces of information that Medicare beneficiaries have when selecting a plan is the quality star rating. Medicare Advantage plans are rated on a scale of 1-to-5 stars, which reflect performance on a large set of indicators, including customer service, consumer satisfaction, the share of enrollees who receive vaccines and screenings, and management of certain conditions, among others. Both plan availability and enrollment are skewed towards plans with higher stars, with more than 80% of enrollees in this analysis in a plan with at least 4 stars in 2022.
On average, enrollees in plans with 4.5 or 5 stars had a network that included 49% and 43% of physicians available to traditional Medicare beneficiaries, respectively, compared to 51% for plans with 4 stars and 50% for plans with 3.5 stars (Figure 6). While star ratings do not incorporate any measures of network breadth, they are one of the more salient measures available to potential enrollees.
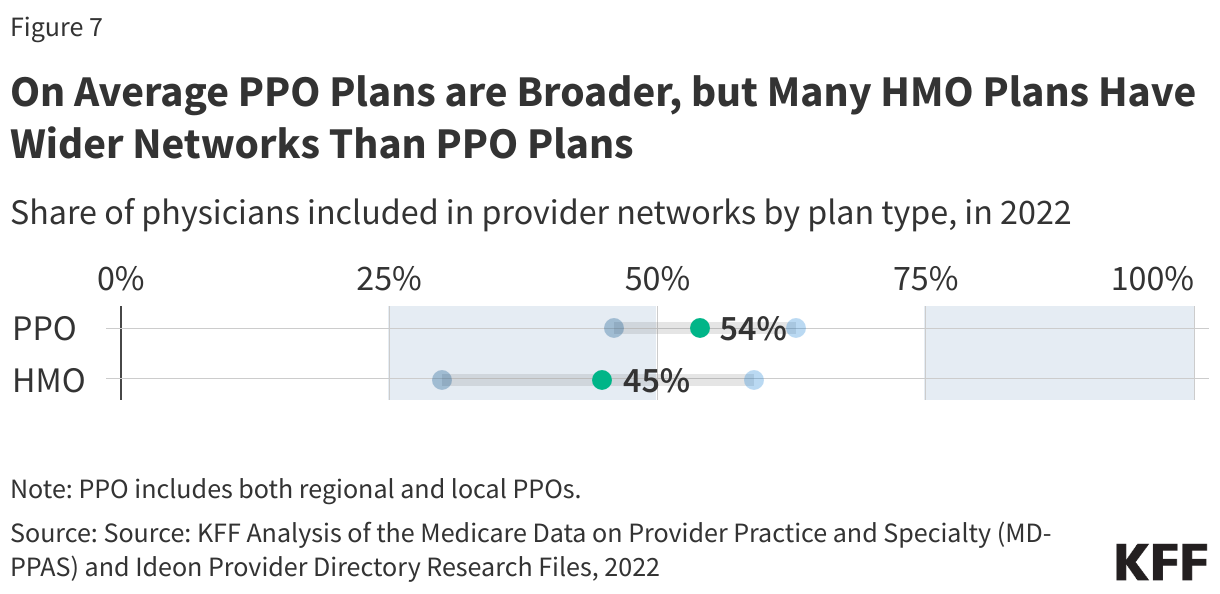
PPOs had broader physician networks, on average, than HMOs.
In recent years, preferred provider organization (PPO) plans have comprised a growing share of the available Medicare Advantage plans. For example, between 2017 and 2025, the share of plans that were local PPOs increased from 24% to 43%. In 2025, more than half of Medicare Advantage enrollees were in HMOs. While PPOs and health maintenance organizations (HMOs) both use provider networks, PPOs have some out-of-network coverage, while typically HMOs do not, except in the case of emergencies. In 2022, just over half (54%) of physicians available to traditional Medicare beneficiaries were in-network in PPO plans, on average, compared with 45% in HMO plans. However, the size of the networks varied, particularly for HMOs, and many included more physicians than the average PPO plan (Figure 7).
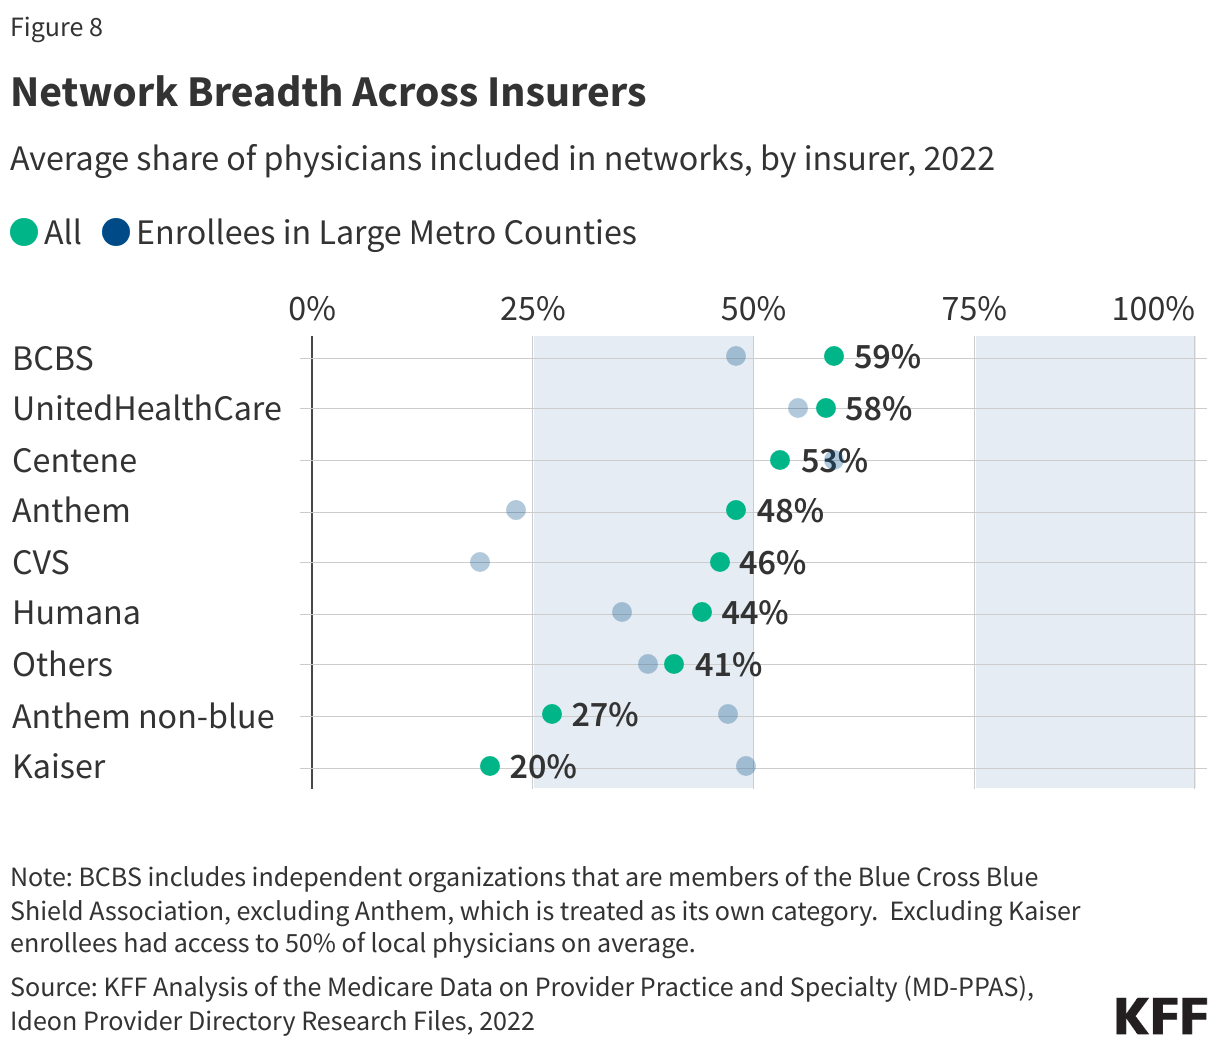
On average, Medicare Advantage plans offered by BlueCross Blue Shield affiliates, UnitedHealthcare, and Centene included at least half of the physicians available to traditional Medicare beneficiaries.
The average share of in-network physicians varied across Medicare Advantage insurers. Enrollees covered by UnitedHealthcare and Blue Cross Blue Shield affiliated organizations included 58% and 59% of the physicians available to beneficiaries in traditional Medicare, respectively. Conversely, enrollees in Humana and CVS covered less than half (44% and 46% respectively), on average (Figure 8).
At the same time, there is considerable variation across plans offered by the same insurer. For example, among enrollees in Humana Medicare Advantage plans, 6% percent had 25% or fewer physicians available to traditional Medicare beneficiaries in-network, and 34% had at least half of physicians available to traditional Medicare beneficiaries in-network (data not shown).
In many cases, a single insurer may offer multiple networks in the same area. For example, in Maricopa, AZ (Phoenix), UnitedHealthcare offered 12 plans with 12 different networks, ranging from 37% to 61% of physicians available to traditional Medicare beneficiaries. In Broward, FL (Fort Lauderdale) Humana offered 19 plans with three networks, ranging from 26% to 44% of physicians (data not shown).
The share of physicians included in Medicare Advantage networks ranged across specialties
CMS has network adequacy rules that require Medicare Advantage plans to contract with a certain number of primary care physicians, as well as physicians with specific specialties. Many of the specialties that are included in the network adequacy regulation participate at a higher rate on average than physicians without specific requirements. Nearly three-in-ten physicians who submitted a Part B claim for a traditional Medicare beneficiary were hospital-based physicians. These physicians were less likely to be included in Medicare Advantage directories (21%). Hospital-based physicians may have less incentive to participate in Medicare Advantage networks because the services they most frequently provide are likely to be covered regardless of network status. For example, emergency medicine doctors were among the most common types of doctors to not participate in a Medicare Advantage network. When a person receives emergency services, coverage of those services is not subject to network restrictions, so it would not matter that the physician providing the service is not in network.
Generally, Medicare Advantage plans included a larger share of outpatient medical and surgical specialists subject to network adequacy rules than primary care providers, with access ranging from 61% for neurology to 72% for ophthalmology on average (Figure 9). The specific specialties and distance requirements established by these rules are listed in the Appendix. These physician categories do not represent all physicians or specialists an enrollee may need, but highlight some of the key capabilities that older Americans often require.
An ongoing challenge in assessing network breadth is the lack of up-to-date, reliable data. As detailed in the Methods, this analysis has several limitations: it includes only individual physicians listed in plan directories who submitted at least one Part B claim during the year. “Phantom” providers those in the directory but not actually accepting the plan in the place and specialty listed, can overstate network size, while participating providers missing from directories can make networks appear narrower than they are.
This work was supported in part by Arnold Ventures. KFF maintains full editorial control over all of its policy analysis, polling, and journalism activities.
Karen Pollitz, a retired Senior Fellow at KFF contributed to this analysis.
Methods
This analysis mirrored the methods used in How Narrow or Broad Are ACA Marketplace Physician Networks? A longer description of trimming, assigning providers to addresses and specialties, as well as other data sources, is available here.
In total, 4,200 individual HMO/PPO MA plans from 2022 are included, covering a total of 20.3 million Medicare Advantage enrollees. This analysis excludes enrollees in employer- or union-sponsored group plans as well as Medical Savings Account (MSA) and Private Fee-For-Service plans (PFFS). 11% of enrollees were dropped from the analysis either because data were not available or based on the trimming rules described in the linked methods.
An issuer may use the same provider network for several plans, either in different markets or within the same service area. In some areas, insurers may use multiple networks across the plans they offer. Plans vary in important respects other than the provider network, including which services are covered and the structure of cost-sharing. In total, Medicare Advantage plans used 981 networks in 2022.
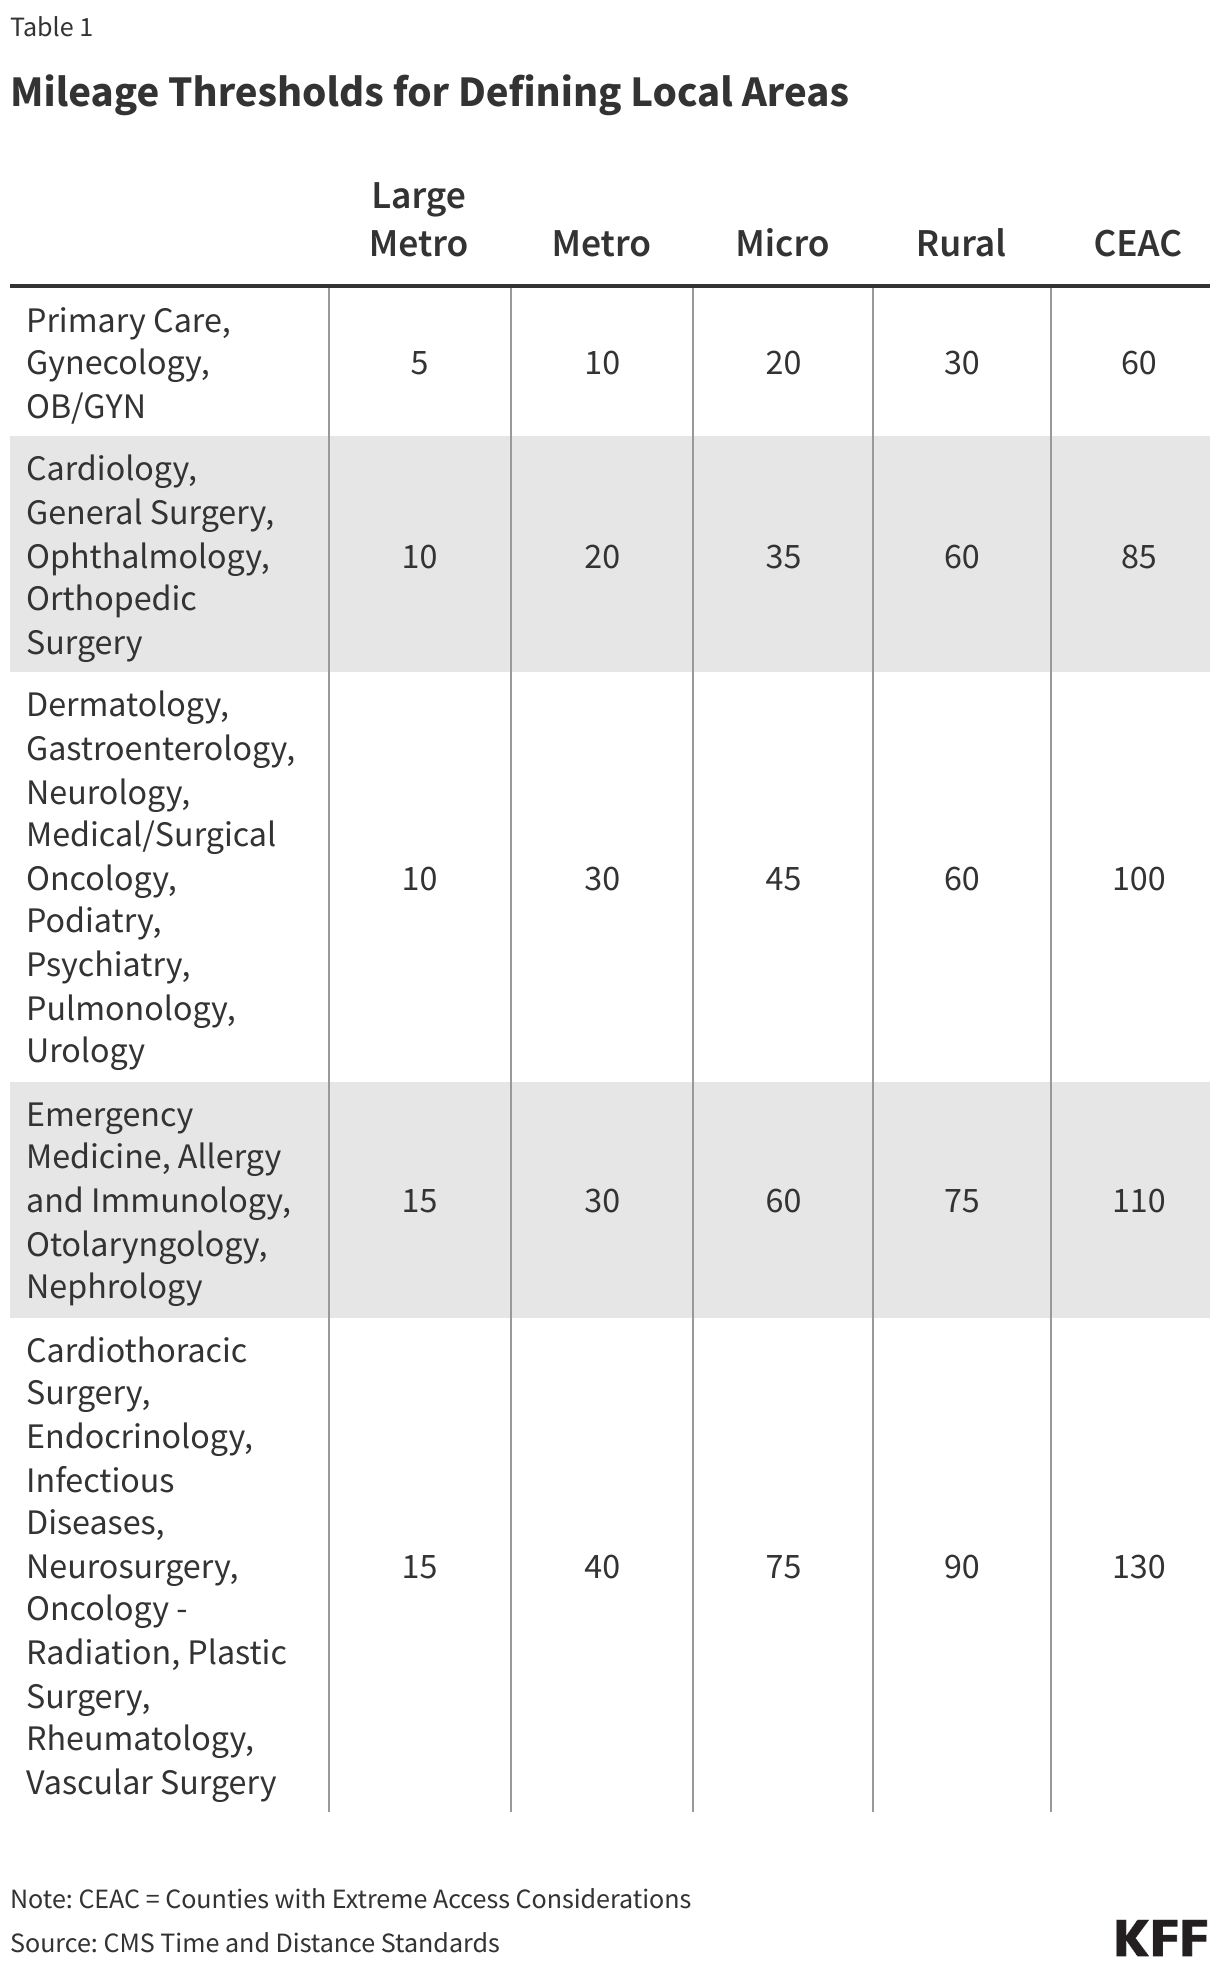
This brief considers the share of available physicians around an enrollee’s home who are listed in their plan’s network directory. Information on plan provider directories was collected by Ideon and made publicly available with support from the Robert Wood Johnson Foundation. Available physicians are those who practice within the county or are within the distance standards specified in the Medicare Advantage network adequacy standards. Thus, a wider radius is used for enrollees living in more rural counties or for specialist physicians. For example, in a large metro county, PCPs are included if they are within the county or within 5 miles of its population-weighted center, compared to 30 miles from the county center in rural areas. A specialist, such as a cardiologist, is included in large metro counties if they are within the county or 10 miles of its center and within 60 miles of a rural county.
Private health plan network directories often include significant numbers of “phantom” physicians who are not actually in-network, sometimes because they have retired or are otherwise no longer providing care. To estimate the total number of physicians who are in active practice, we relied on MD-PPAS, a federal database of physicians who submitted at least one Medicare Part-B claim in 2022. This data set is based on claims and therefore identifies individual-level physicians who saw at least one Medicare patient in the year. Medicare Part B is the largest payer of physician services and disabled Americans. Virtually all non-pediatric physicians participate in the program, with about 1% formally opting out together. MedPac, reports that the share of clinicians who accept Medicare is comparable to the share that accept private insurance. In total, 680,000 physicians, including 181,000 PCPs were included in MD-PPAS in 2022. MD-PPAS categorizes physicians into five different specialists based on the services they submitted claims for; these are primary-care (26% of physicians), medical specialists (19%), surgical specialists (16%), OBGYN (5%), hospital-based specialists (29%), and psychiatrists (4%).
This brief calculates a physician participation rate, or the share of MD-PPAS physicians who were listed in each MA directory. While this method ensures that physicians who are not working at all, are not included in the analysis, networks may still include “phantom” providers who are actively practicing but who are inaccurately listed as participating in the plan. Further, this analysis does not consider whether the physician is currently seeing patients or for which services they are in-network. Conversely, only physicians enumerated in the directory are included. As explained in the linked methods, physicians associated with group practices, physicians working outside of their primary addresses, and others may be excluded.
Information on plan type, star ratings, plan enrollmen,t and plan characteristics was collected from CMS in a method described here and here. Information of the demographic characteristics of enrollees was collected from the Master Beneficiary Summary File (MBSF), 2022. Information on county characteristics was obtained from the 2020 CDC/ATSDR Social Vulnerability Index. Data on physician supply in counties was obtained from the Area Resource File (ARF) 2022.
Appendix
Medicare Advantage plans are generally required to include a minimum number of providers across various specialties and facility categories. Within Medicare Advantage network adequacy standards, plans may still include a tiny fraction of the providers working in or near the county. These regulations act as a floor and grant plans considerable latitude. This brief considers the share of available physicians around an enrollee’s home who are listed in their plan’s network directory. Available physicians are those who practice within the county or are within the distance standards specified in the Medicare Advantage network adequacy standards (Table 1).
In total, CMS designates 78 “Large Metro” counties based on their population and population density, and 720 “Metro” counties. For example, Large Metro areas are classified as counties with at least a million people and a population density of at least 1,000 people per square mile, or counties with between 500,000 to 999,999 people and a population density of at least 1,500 people per square mile, or counties with a population density of at least 5,000 people. The county classifications follow the definitions used in the Medicare Advantage network adequacy rules (Table 3-1). Most Medicare Advantage enrollees live in one of these urban county-designations, including 29% in “Large Metro” counties and 53% in “Metro” counties.