What Are the Primary Medicaid Eligibility Pathways for Dual-Eligible Individuals?

Authors: Alice Burns, Maria T. Peña, Maiss Mohamed, Meredith Freed, and Molly O’Malley Watts
Published: Oct 22, 2024

In 2021, 1 in 5 Medicare beneficiaries or 13.1 million people, known as “dual-eligible individuals,” had both Medicare and Medicaid coverage. Eligibility for Medicare, which is the primary source of coverage for dual-eligible individuals, is based on their age or disability status. For most dual-eligible individuals, there are two pathways to Medicaid eligibility: one is through Medicaid eligibility pathways for seniors and people with disabilities and the other is through the Medicare Savings Programs. These eligibility pathways confer different benefits. The Medicaid eligibility pathways provide coverage of Medicaid benefits that are not otherwise covered by Medicare including long-term services and supports (LTSS), vision, and dental care. The Medicare Savings Programs cover Medicare premiums and often, cost sharing, but not Medicaid benefits. Medicare beneficiaries who are only eligible for Medicaid through the Medicare Savings Programs are “partial-benefit” dual-eligible individuals because they only receive coverage of Medicare premiums and often, cost sharing. To be a “full-benefit” dual-eligible individual, Medicare beneficiaries must be enrolled in Medicaid through a Medicaid eligibility pathway beyond the Medicare Savings Programs. (Most full-benefit dual-eligible individuals are eligible for both.)

Federal statutes require states to enroll people who receive Supplemental Security Income (SSI) in Medicaid and to enroll eligible Medicare beneficiaries in the Medicare Savings Programs. Beyond these two “mandatory” eligibility pathways, there are optional Medicaid eligibility pathways that states may choose to offer for people who have disabilities or are ages 65 and older, including options to expand coverage beyond what is required under federal law to low-income seniors and people with disabilities; coverage for “medically needy” individuals who qualify for Medicaid after deducting incurred medical expenses from their income; and coverage for people who need LTSS.

States are currently implementing new rules designed to streamline the enrollment and renewal systems for the Medicare Savings Programs and for Medicaid. The rules are intended to help eligible individuals obtain and maintain Medicaid coverage by reducing administrative burdens on applicants and enrollees. As the new requirements start to take effect, this brief examines current Medicaid eligibility policies and enrollment patterns using data from KFF’s 2024 50-state survey of states’ eligibility and enrollment policies for seniors and people with disabilities, and 2021 Medicare and Medicaid claims data from the Centers for Medicare and Medicaid Services (CMS).

Key Takeaways

  • Most of the 13.1 million dual-eligible individuals are enrolled in Medicaid through mandatory eligibility pathways: 4.6 million through SSI and 4.1 million through the Medicare Savings Programs. The remaining 4.5 million are enrolled through optional pathways (Figure 1).
  • Among the 9.7 million dual-eligible individuals with full Medicaid, nearly half (47%) are eligible through the only mandatory pathway to full Medicaid, which is SSI.
  • Although it is only offered by 28 states, the next most common pathway for full Medicaid is an optional pathway that provides coverage for seniors and people with disabilities who have income below the federal poverty level, covering 14% of full-benefit dual-eligible individuals. Other optional pathways are offered by more states but only a small percentage of dual-eligible individuals enroll in each of those pathways (Figure 2).
  • Virtually all (92%) dual-eligible individuals with partial Medicaid (3.1 million) are eligible through the Medicare Savings Programs. Federal law defines minimum income and resource limits for each of the Medicare Savings Programs, but in 2024, 18 states reported having income and/or asset levels above the federally required limits for the Medicare Savings Programs. Those states are home to 1.1 million or a third (33%) of dual-eligible individuals with partial Medicaid.
  • As new federal requirements for enrolling people in the Medicare Savings Programs take effect, most states report being in compliance with the requirements by October 2024.
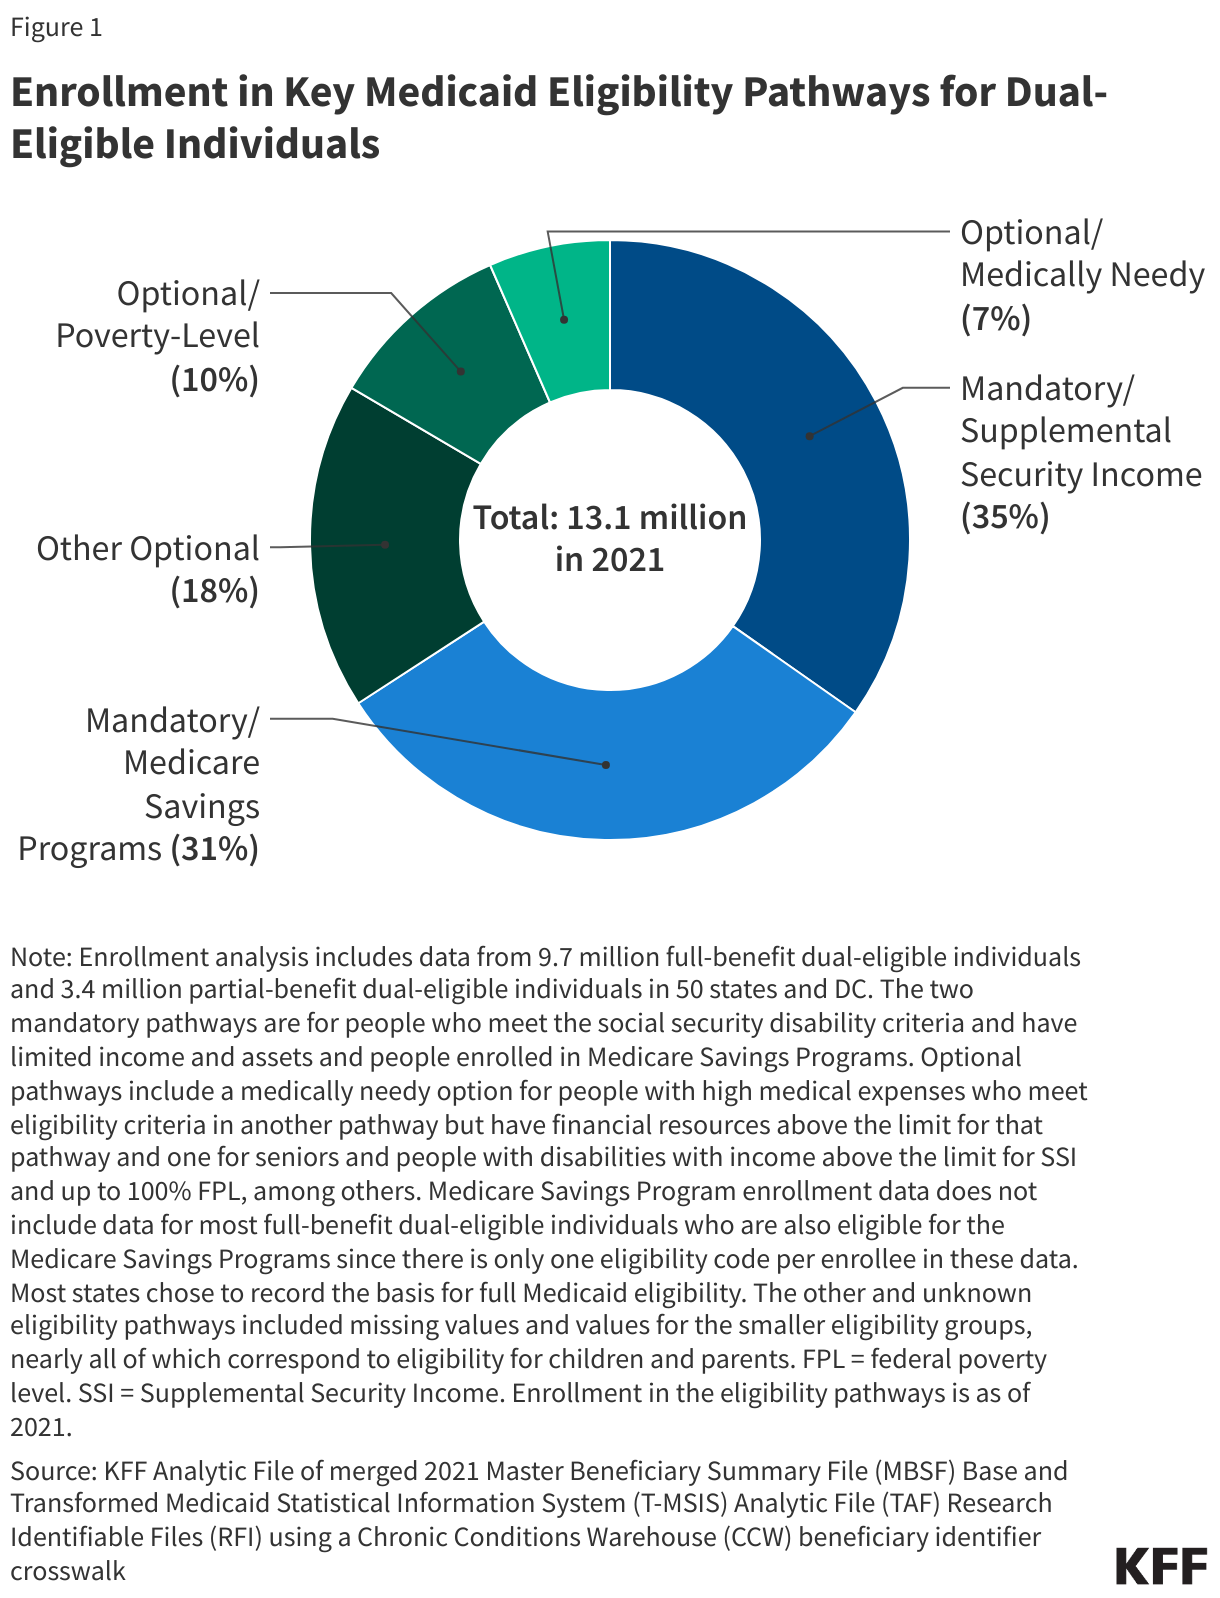
Enrollment in Key Medicaid Eligibility Pathways for Dual-Eligible IndividualsE

KFF’s Survey of Medicaid Financial Eligibility & Enrollment Policies for Seniors & People with Disabilities, was conducted by KFF and Watts Health Policy Consulting, and describes states’ eligibility and enrollment policies for seniors and people with disabilities as of June 2024. Overall, 49 states and the District of Columbia (hereafter referred to as a state) responded to the survey, though response rates to specific questions varied (Florida was the only state that did not respond). Responses were supplemented with publicly available information and data from KFF’s 2022 survey when available.

The analysis also uses merged beneficiary-level Medicare and Medicaid data from 2021—the most recent full release of Medicaid data—to analyze how many dual-eligible beneficiaries enter Medicaid through each of the eligibility pathways. The enrollment analysis includes 13.1 million dual-eligible individuals in 2021 (see Methods).

How do full-benefit dual-eligible individuals become eligible for Medicaid?

Medicaid Eligibility Pathways for Seniors and People with Disabilities

To qualify for full Medicaid benefits, dual-eligible individuals must meet Medicaid eligibility criteria, typically through eligibility pathways specific to people ages 65 and older (seniors) and people with disabilities (see Appendix). The Medicaid pathways in which eligibility is based on old age or disability are known as “non-MAGI” pathways because they do not use the Modified Adjusted Gross Income (MAGI) financial methodology that applies to children, pregnant individuals, parents, and other non-elderly adults with low incomes. (Medicare beneficiaries who are eligible because of a disability may enroll in Medicaid through all MAGI pathways other than the pathway for adults eligible through the Affordable Care Act, but more often qualify through disability-related pathways. Medicare beneficiaries who are ages 65 and older are generally not eligible for Medicaid through the MAGI pathways.)

In addition to considering income, non-MAGI Medicaid applicants must meet other eligibility requirements that make the application more onerous than is the case for MAGI applicants. Non-MAGI applicants must meet eligibility requirements related to their age or disability status and unless living in a state that has eliminated asset limits, most applicants must demonstrate that they have limited savings and other financial resources (e.g., assets). Medicaid enrollees who use LTSS must also meet requirements related to their functional needs which are generally measured by their ability to perform activities of daily living such as eating and bathing. Beyond SSI (the only mandatory pathway), the main optional non-MAGI pathways to full Medicaid eligibility include state options to expand coverage to low-income seniors and people with disabilities, “medically needy individuals” who qualify for Medicaid by deducting incurred medical expenses from their income, and coverage for people who use LTSS. Each group has different rules about income and assets, making eligibility determinations complex.

Most full-benefit dual-eligible individuals are also eligible for the Medicare Savings Programs, but eligibility for the Medicare Savings Programs does not provide access to full Medicaid. To be a full-benefit dual-eligible individual, people enrolled in the Medicare Savings Programs must also meet the eligibility criteria for one of the other Medicaid eligibility pathways, in which case, they would be eligible for Medicaid through two mechanisms: whichever Medicaid pathway confers eligibility for full Medicaid and the Medicare Savings Programs (which cover Medicare premiums and often, cost sharing).

Mandatory eligibility through SSI

In 2021, 4.6 million full-benefit dual-eligible individuals were enrolled in Medicaid through the only pathway that states are required to cover, SSI (Figure 2). Those enrollees comprised 47% of all full-benefit dual-eligible individuals. To be eligible for SSI, beneficiaries must have low incomes, limited assets, and either be older than 64 or have a qualifying disability. Although there is a standard federal maximum benefit, some states supplement the federal benefit with additional payments. In those states, the SSI benefit levels—and applicable income limits for SSI recipients—are higher.

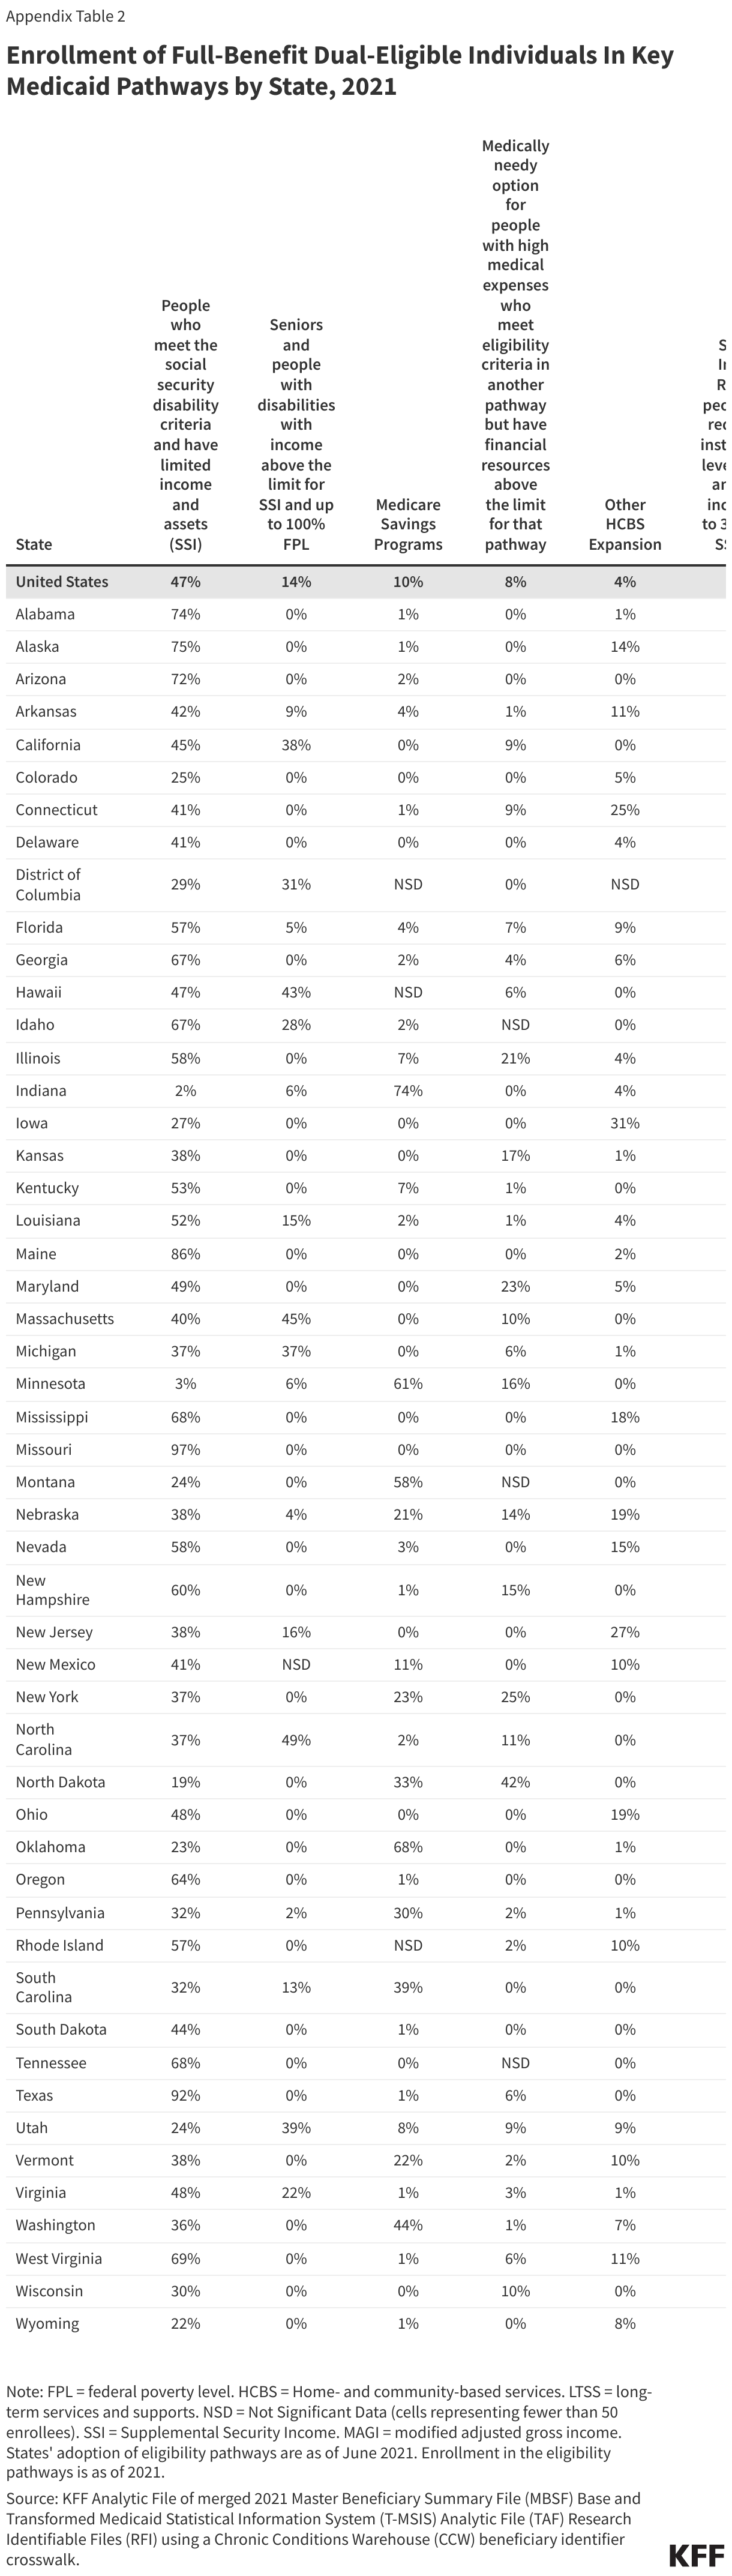
The proportion of full-benefit dual-eligible individuals enrolled in Medicaid through SSI varied across states—from less than 30% in nine states to over 85% in Maine, Texas, and Missouri (Appendix Table 2). Such variation reflects differences in the SSI income limit and the extent to which the states offer coverage through optional Medicaid eligibility pathways in addition to the mandatory SSI pathway, among other factors such as disability rates, demographic characteristics, eligibility determinations, and data quality/availability.
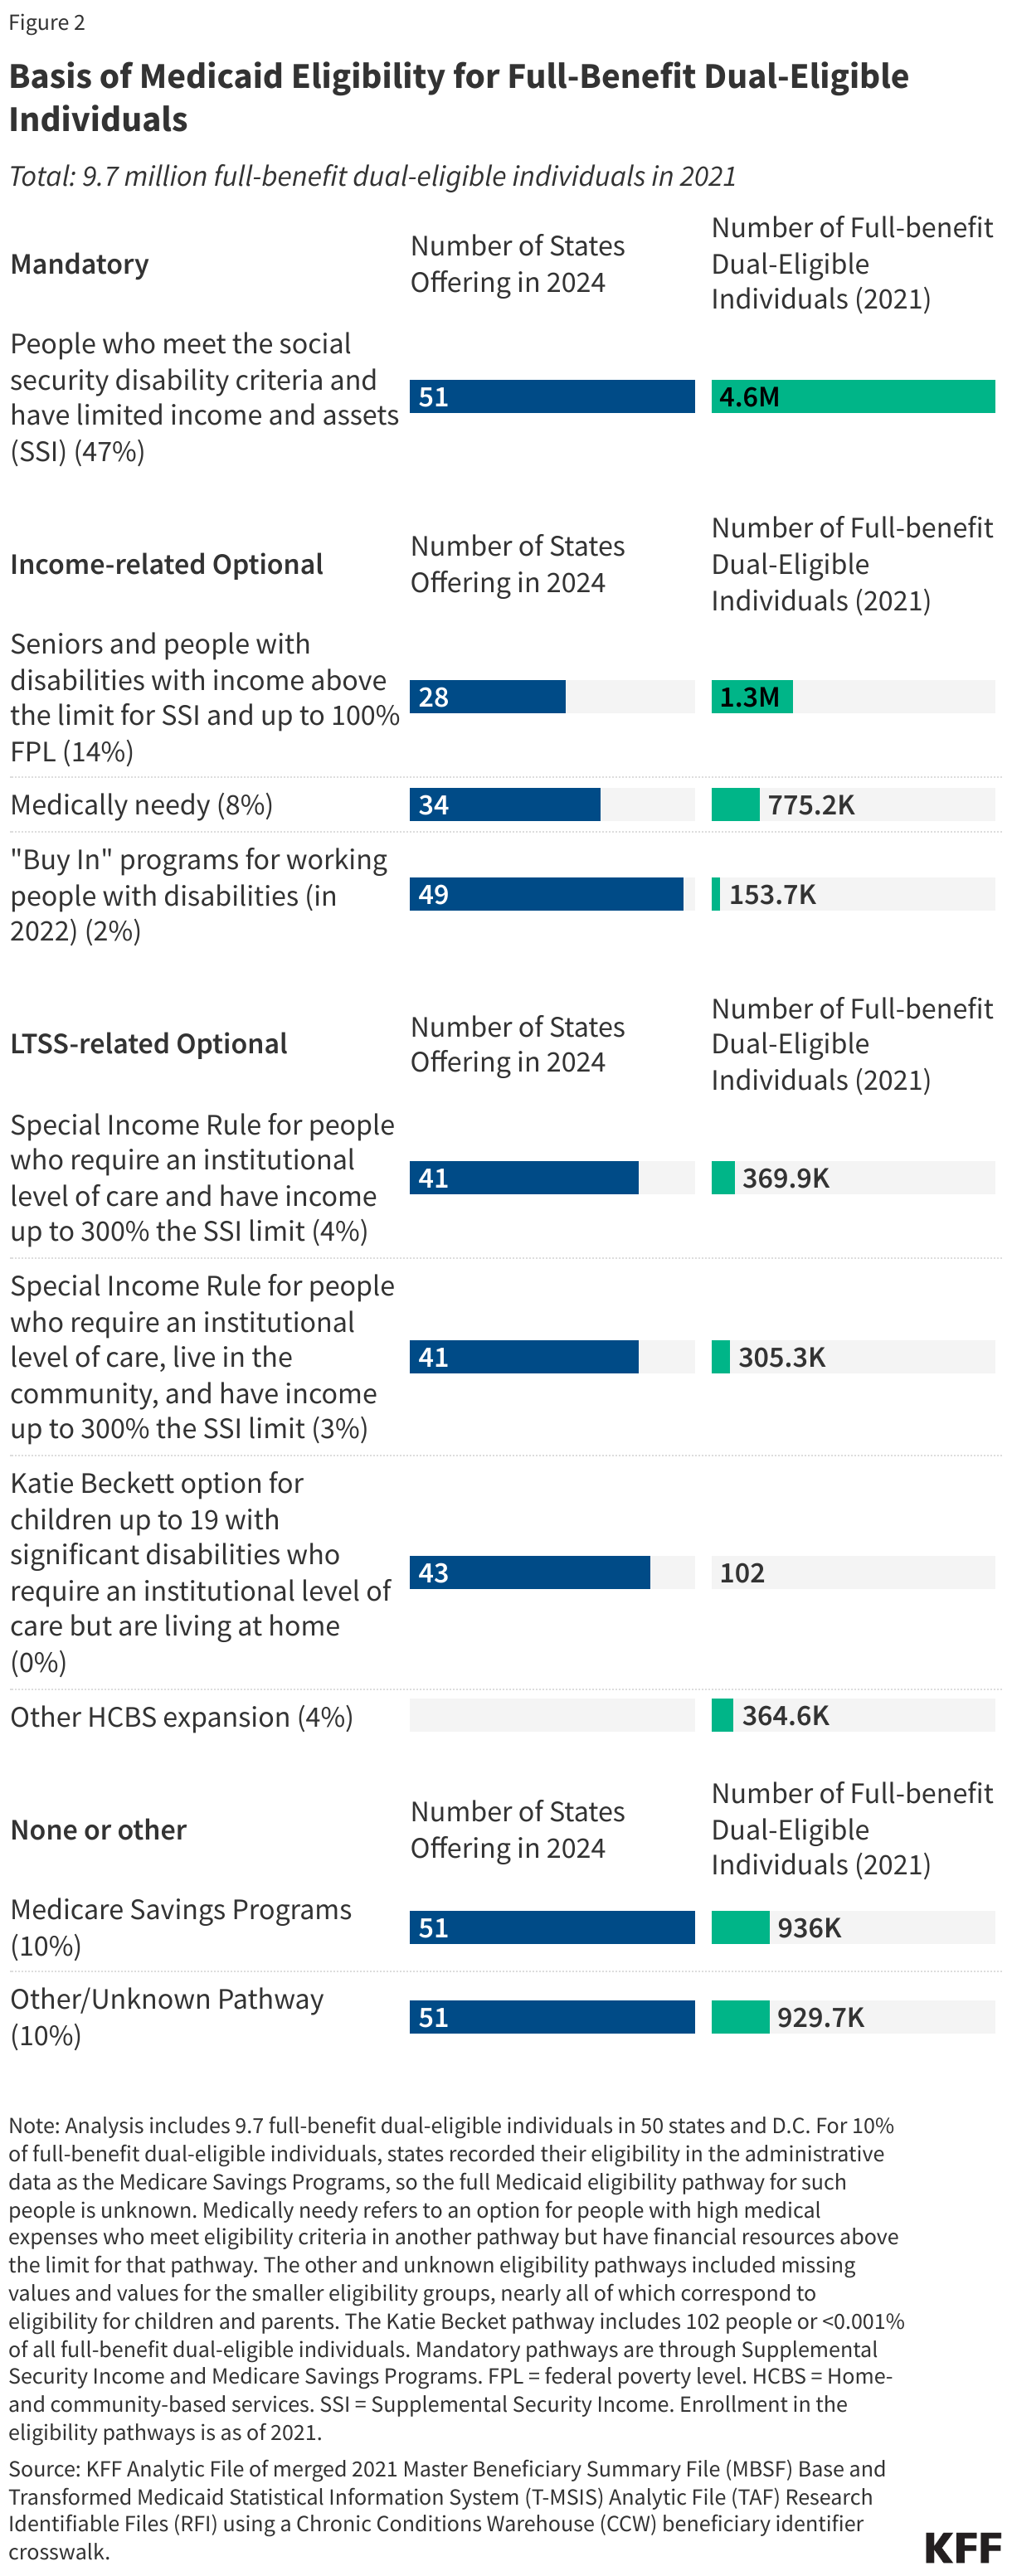
Basis of Medicaid Eligibility for Full-Benefit Dual-Eligible Individuals

A total of 2.2 million full-benefit dual eligible individuals are eligible for Medicaid through optional eligibility pathways for low-income seniors and people with disabilities. Some of the more prominent options include: “buy in” programs for working people with disabilities (available in 49 states), medically needy coverage (available in 34 states), and coverage for seniors and people with disabilities with incomes above the SSI eligibility thresholds (available in 28 states). The KFF survey did not include the buy in programs in 2024, so states’ policies come from the 2022 KFF survey.

The optional eligibility pathway that was offered by the fewest states enrolled the largest number of full-benefit dual-eligible individuals: low-income seniors and people with disabilities, which covered 14% of full-benefit dual-eligible individuals (1.3 million people). The pathway for low-income seniors and people with disabilities is the simplest pathway administratively because it only requires information about people’s income and in most cases, assets. Most other non-MAGI eligibility pathways also require information about people’s health status, functional status, or spending on health care. The share of full-benefit dual-eligible individuals eligible through the state option to expand coverage to low-income seniors and people with disabilities was 14% nationally and ranged from less than 1% in 33 states to over 40% in Hawaii, Massachusetts, and North Carolina (Appendix Table 2).

More than 775,000 or 8% of full-benefit dual-eligible individuals were enrolled in medically needy coverage in 2021 (Figure 2). This pathway is one of the most complex administratively because people are eligible if their income exceeds the limit of another pathway, but only if they "spend down" to the medically needy limit by deducting health care expenses from their income. The after-health care spending income limits tend to be low—below 50% of the federal poverty level in more than half of the states offering such coverage. There were only four states (Illinois, Maryland, New York, and North Dakota) in which more than 20% of full- benefit dual-eligible individuals were enrolled through medically needy pathways.

The Medicaid buy in program refers to multiple Medicaid eligibility pathways that serve workers with disabilities who are earning income and for whom states may charge premiums as a condition of Medicaid eligibility, which combined enrolled only 2% of full-benefit dual-eligible individuals in 2021 (almost 154,000 people). Under the buy ins, states cover people with disabilities who are working, even if their income or assets exceed the limit for other eligibility pathways. This option enables people with disabilities to retain Medicaid’s coverage of medical care and LTSS as their income increases. Medicaid can fill in coverage gaps for working people with disabilities because private health insurance typically does not cover all the services and supports that they need to live independently and work. Iowa was the only state in which at least 20% of full-benefit dual-eligible individuals were enrolled through a buy in.

In 2024, 1.0 million people were eligible through several widely adopted Medicaid eligibility pathways specific to people using LTSS who require an institutional level of care (Figure 2, Appendix Table 1). The two primary eligibility pathways for people using LTSS include Katie Beckett coverage for children who have significant disabilities requiring an institutional level of care but living at home (43 states) and the special income rule, which covers other people requiring an institutional level of care with incomes up to 300% of the SSI benefit rate ($2,829 in 2024). Overall, 42 states offer coverage through a special income rule, with 41 states offering the option to people in institutions and 41 states offering the option to people living at home. Less is known about states’ other home- and community-based services (HCBS) expansions, which include state-specific demonstration programs and people who are eligible for Medicaid through the Program of All-Inclusive Care for the Elderly. (KFF’s eligibility surveys excluded other HCBS expansions.) LTSS-related pathways are administratively complex because applicants must demonstrate their need for an institutional level of care. As a result, people who may be eligible for Medicaid through LTSS-related pathways and through other pathways are more likely to be enrolled through those other pathways.

Although these optional Medicaid eligibility pathways related to LTSS are adopted by most states, they collectively enrolled only 11% of full-benefit dual-eligible individuals (1 million) in 2021 (Figure 2). Low enrollment in Katie Beckett reflects the fact that there are few dual-eligible individuals under the age of 19. For the other three LTSS-related pathways, dual-eligible individuals comprise three quarters of all Medicaid enrollees (see Appendix). Across the states, the percentage of dual-eligible individuals enrolled in Medicaid through each of the LTSS-related pathways varies, with some states having over 20% of dual-eligible individuals enrolled in other HCBS expansions or a special income rule program (Appendix Table 2).

Other or Unknown Medicaid eligibility pathways

Roughly 1.9 million full-benefit dual-eligible individuals were eligible for Medicaid through other or unknown Medicaid eligibility pathways, including 0.9 million individuals who were in states that recorded their eligibility in the administrative data as the Medicare Savings Programs. In the Medicaid administrative data, enrollees receive only one eligibility code each month; therefore among the full-benefit dual-eligible individuals in the Medicaid Savings Programs it is unknown how those full-benefit dual-eligible individuals became eligible for full Medicaid. The remaining 0.9 million full-benefit dual-eligible individuals were in an “other” or “unknown” Medicaid eligibility group. Those pathways included missing values and values for the smaller eligibility groups, nearly all of which correspond to eligibility for children and parents. (Totals do not add up to 1.9 million due to rounding.) 

How do partial-benefit dual-eligible individuals become eligible for Medicaid?

The Medicare Savings Programs

Dual-eligible individuals with partial Medicaid benefits do not receive coverage of the full range of Medicaid benefits, such as long-term services and supports, but do receive payments of Medicare premiums and, in most cases, cost sharing through the Medicare Savings Programs. Medicare beneficiaries are responsible for payment of Medicare premiums, deductibles, and other cost sharing requirements unless they have supplemental coverage, a Medicare Advantage plan that covers some of the cost sharing, or have incomes and assets low enough to qualify for the Medicare Savings Programs (under which state Medicaid programs provide assistance with Medicare Part A and Part B premiums and/or cost sharing) and the Part D Low-Income Subsidy (LIS) (which helps with Medicare Part D drug plan premiums and cost sharing).

Under the Medicare Savings Programs, state Medicaid programs pay for premiums and/or cost sharing for Medicare beneficiaries who have monthly incomes up to 135% FPL under federal guidelines ($1,715 for individuals and $2,320 for couples in 2024) and assets up to 300% of the limit for Supplemental Security Income ($9,430 for individuals and $14,130 for couples in 2024; unlike SSI, asset limits for the Medicare Savings Programs are adjusted for inflation and increase each year). There are four eligibility categories within the Medicare Savings Programs (box 1), which confer different benefits based on different eligibility criteria. States must cover people who meet the federal eligibility requirements for the Medicare Savings Programs but may elect to increase income or asset eligibility limits beyond federal levels.

Box 1: The Medicare Savings Programs

There are four Medicare Savings Programs that help Medicare beneficiaries get help from Medicaid to pay their Medicare premiums and in many cases, cost sharing.

• The Qualified Medicare Beneficiary (QMB) program pays for Part A and B premiums, deductibles, coinsurance, and copayments. Medicare beneficiaries are eligible for the QMB program if their monthly income is below the FPL ($1,275 for individuals and $1,724 for couples in 2024) and if their assets are below the resource limit ($9,430 for individuals and $14,130 for couples in 2024).

• The Specified Low-Income Medicare Beneficiary (SLMB) program pays for Part B premiums only. Medicare beneficiaries are eligible for the SLMB program if their monthly income is below 120% of the FPL ($1,526 for individuals and $2,064 for couples in 2024) and if their assets are below the resource limit ($9,430 for individuals and $14,130 for couples in 2024).

• The Qualifying Individual (QI) program pays for Part B premiums only. Medicare beneficiaries are eligible for the QI program if their monthly income is below 135% of the FPL ($1,715 for individuals and $2,320 for couples in 2024) and if their assets are below the resource limit ($9,430 for individuals and $14,130 for couples in 2024).

• The Qualified Disabled and Working Individual (QDWI) program pays for Part A premiums only. Medicare beneficiaries are eligible for the QDWI program if they have a disability and lost their premium-free Medicare Part A because they returned to work. Their monthly income must be below 200% of the FPL ($5,105 for individuals and $6,899 for couples in 2024) and if their assets are below the resource limit ($4,000 for individuals and $6,000 for couples in 2024).

(Resource limits do not include $1,500 for burial expenses.)

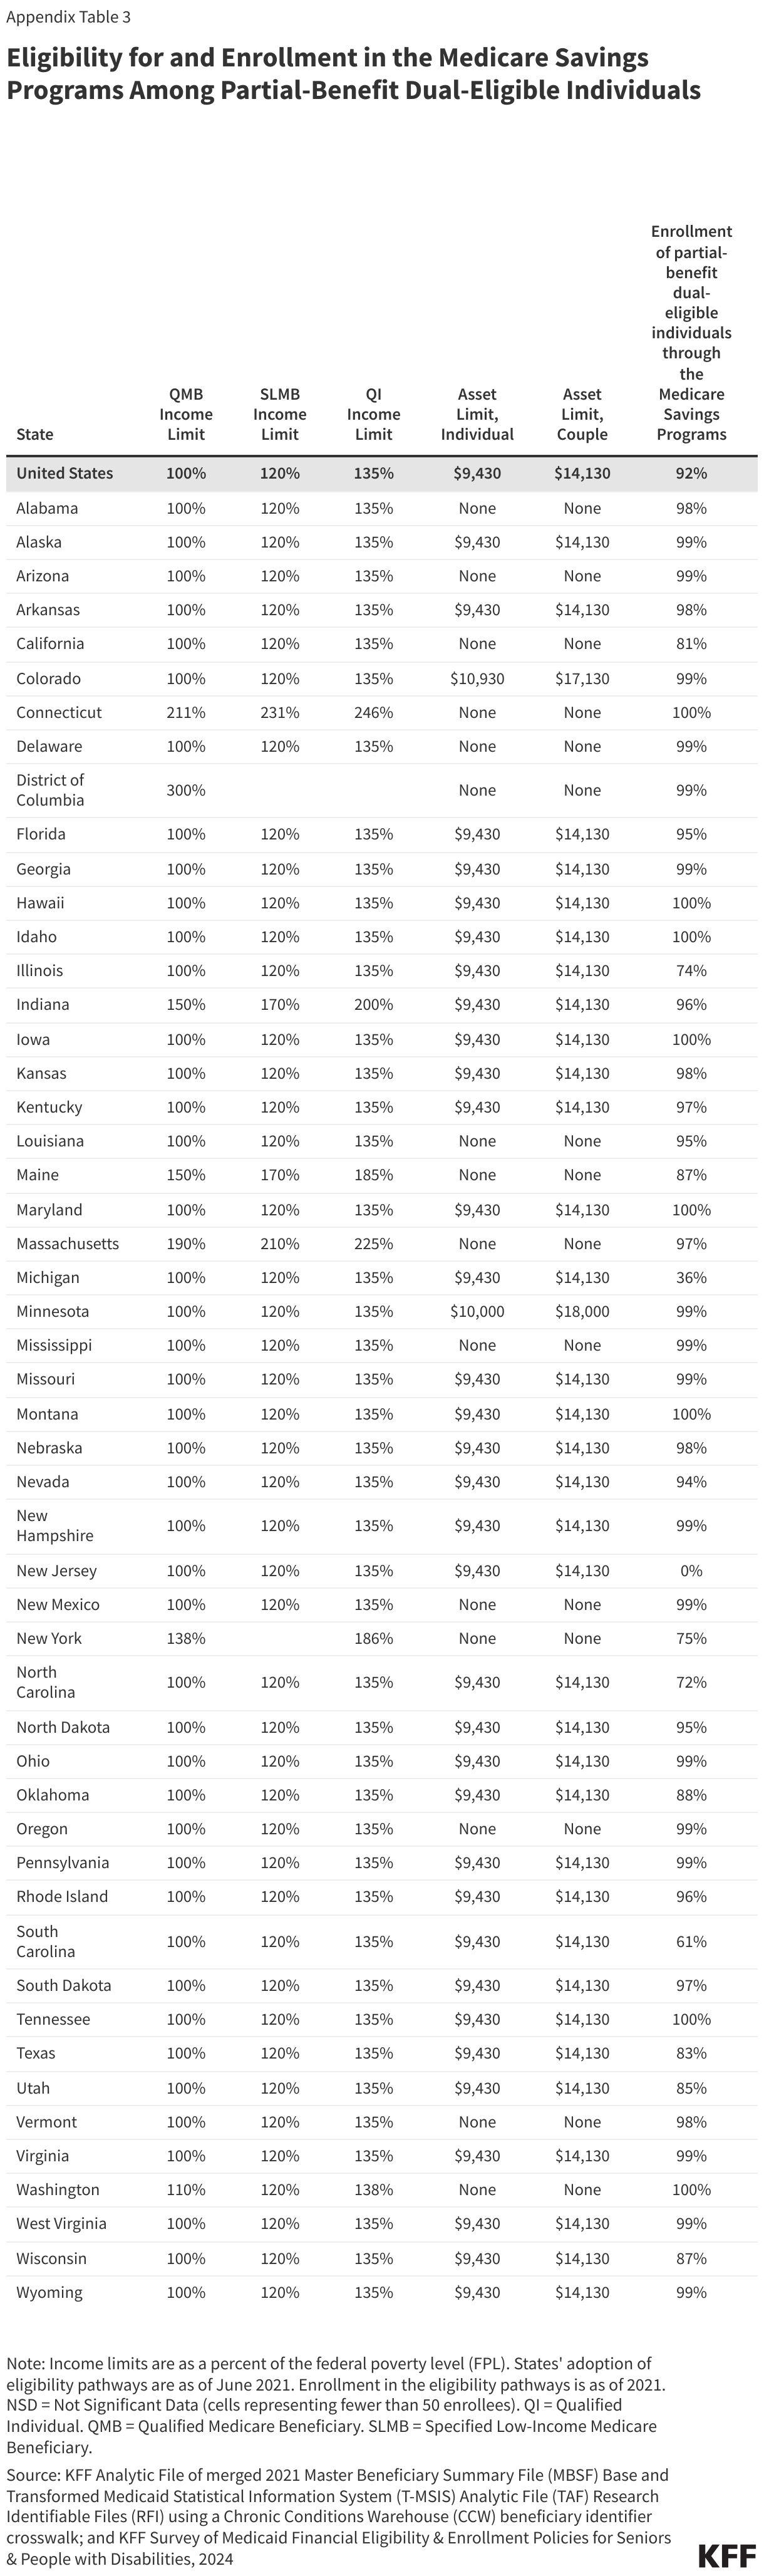
In 2021, 92% of partial-benefit dual-eligible individuals were primarily eligible for Medicaid through the Medicare Savings Programs (Figure 3, Appendix Table 3). Among the 3.4 million people eligible for partial Medicaid benefits, more than nine in ten were eligible through the Medicare Savings Programs (3.1 million people). In all but six states, more than 80% of partial-benefit dual-eligible individuals were eligible through the Medicare Savings Programs. Among the remaining 8%, the largest eligibility category was through medically needy coverage (2% of partial benefit individuals, fewer than 0.1 million people). Dual-eligible individuals may have partial Medicaid benefits through medically needy programs because states may elect to only cover a subset of Medicaid benefits through their medically needy programs. The remaining 6% of partial-benefit dual-eligible individuals were eligible through other partial-benefit pathways such as those for family planning services, individuals needing treatment for breast or cervical cancer, and other eligibility pathways that may have occurred at some other point in the year.
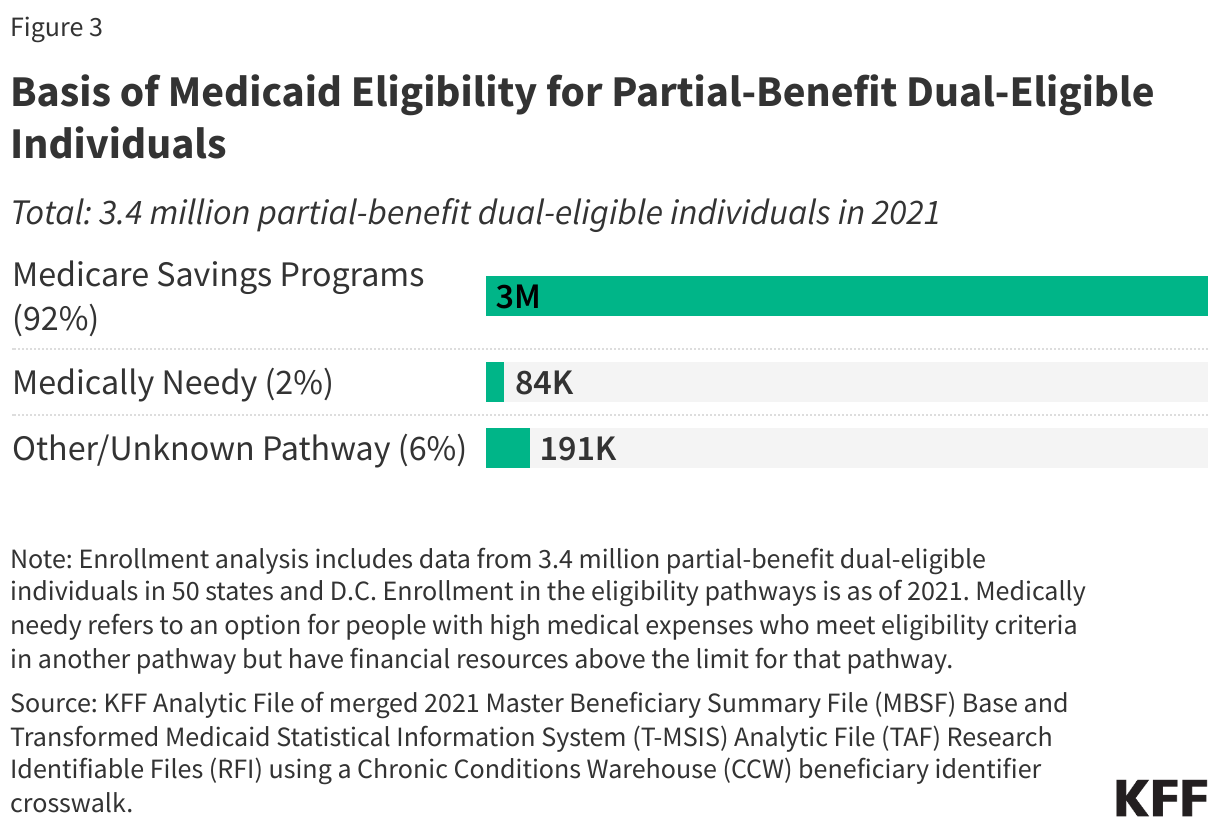
Basis of Medicaid Eligibility for Partial-Benefit Dual-Eligible Individuals

Changes in eligibility and enrollment for the Medicare Savings Programs

In 2024, 18 states reported having income and/or asset levels above federally required levels for the Medicare Savings Programs. (Figure 4, Appendix Table 3). Overall, 33 states use the federal eligibility criteria, and the remaining 18 states—home to 1.1 million or a third (33%) of partial-benefit dual-eligible individuals—have more generous eligibility limits on income, assets or both:

  • 3 states have either income or asset levels higher than the federally required levels (Colorado, Indiana, and Minnesota)
  • 9 states use the federal income levels but have no asset test (Alabama, Arizona, California, Delaware, Louisiana, Mississippi, New Mexico, Oregon, and Vermont)
  • 6 states have income levels higher than federally required and no asset test (Connecticut, District of Columbia, Maine, Massachusetts, New York, and Washington).

Many of the higher income and asset eligibility policies were new in 2024. Of the 7 states with higher income levels, 3 states reported raising the income eligibility criteria in 2024: Indiana increased the income limit for the Qualified Individuals program to 200% FPL, Massachusetts raised the income limits for all of the programs, and Washington increased the income limit for Qualified Medicare Beneficiary Program. (The remaining 4 states had higher income limits in earlier years but did not increase them in 2024.) Among the two states with asset limits higher than federally required levels, Colorado reported that change for the first time in 2024, but Minnesota had higher asset limits in earlier years. Among the 15 states with no limit on assets, that policy was new to California, Maine, and Massachusetts in 2024.
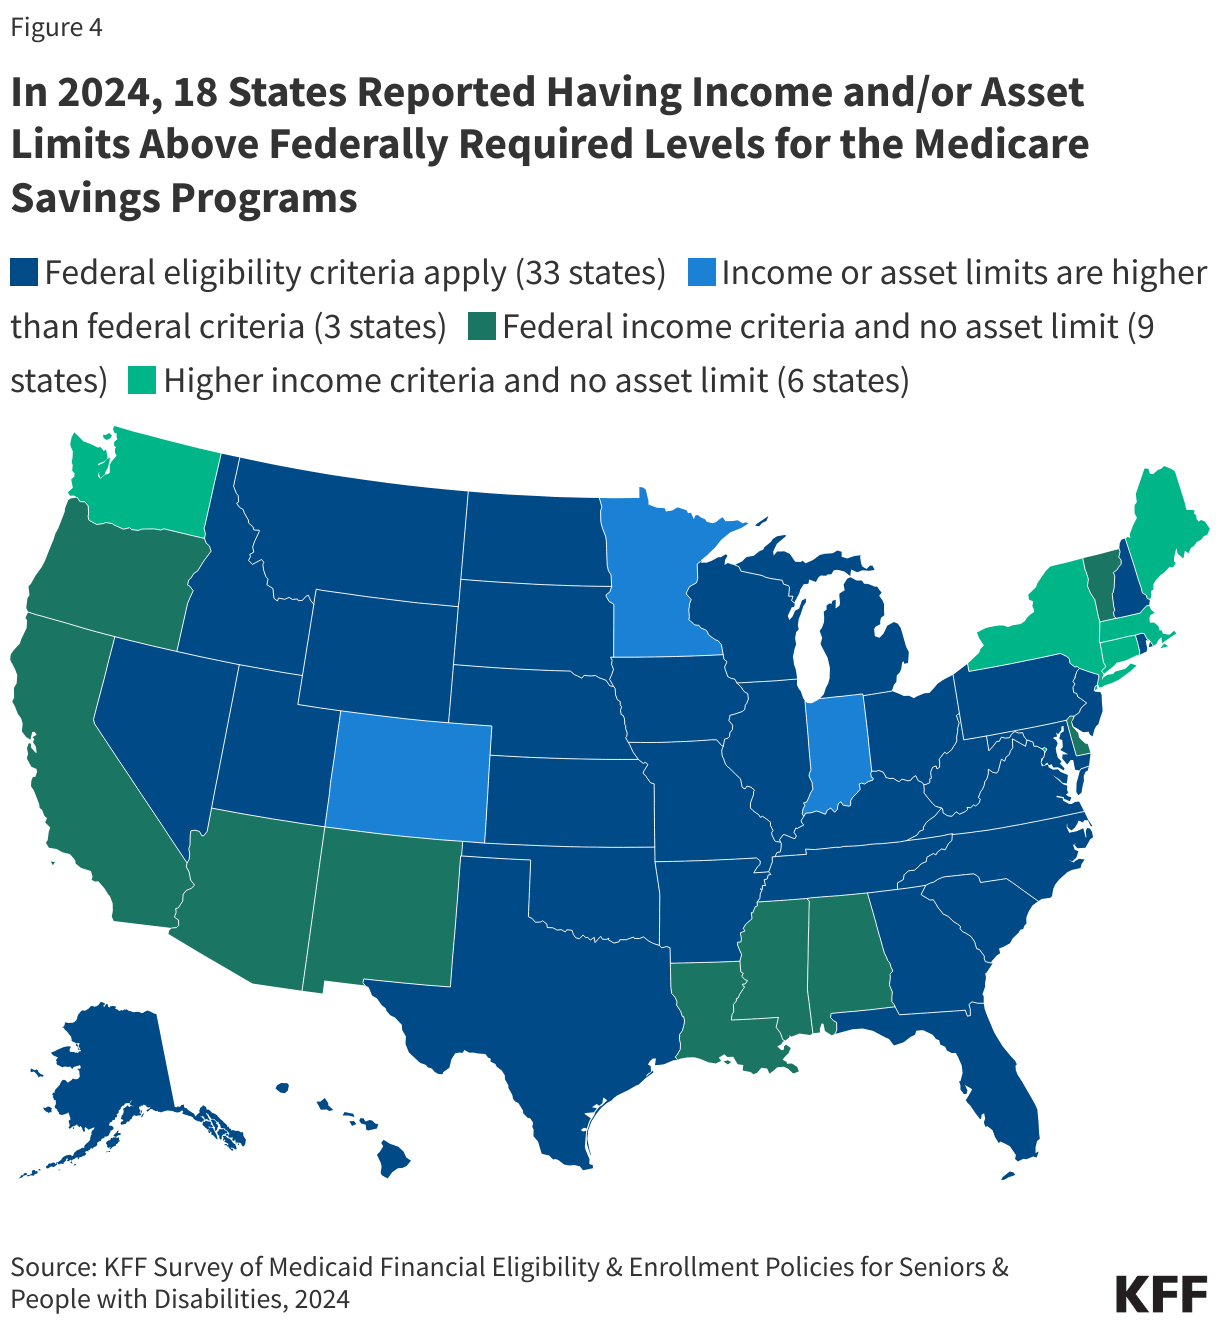
In 2024, 18 States Reported Having Income and/or Asset Limits Above Federally Required Levels for the Medicare Savings Programs

Some of the 2024 eligibility changes may be responses to a 2023 final rule on eligibility and enrollment in the Medicare Savings Programs. CMS expects the final rule to increase enrollment in the Medicare Savings Programs by nearly 1 million. New enrollments include people who enroll in the Medicare Savings Programs because of the rule, and gains in months of coverage among people who would have enrolled anyway but now face fewer administrative barriers, resulting in either gaining Medicaid earlier or experiencing less churn in and out of the program. Prior KFF research found that many low-income Medicare beneficiaries are not enrolled in the Medicare Savings Programs. The rule reduces barriers to coverage by improving alignment between the Medicare Savings Programs and applications for Medicare’s Part D Low-Income Subsidy, requiring states to automatically enroll Medicare beneficiaries with SSI into the Medicare Savings Programs, and making it easier for applicants to document their financial resources when applying for Medicaid.

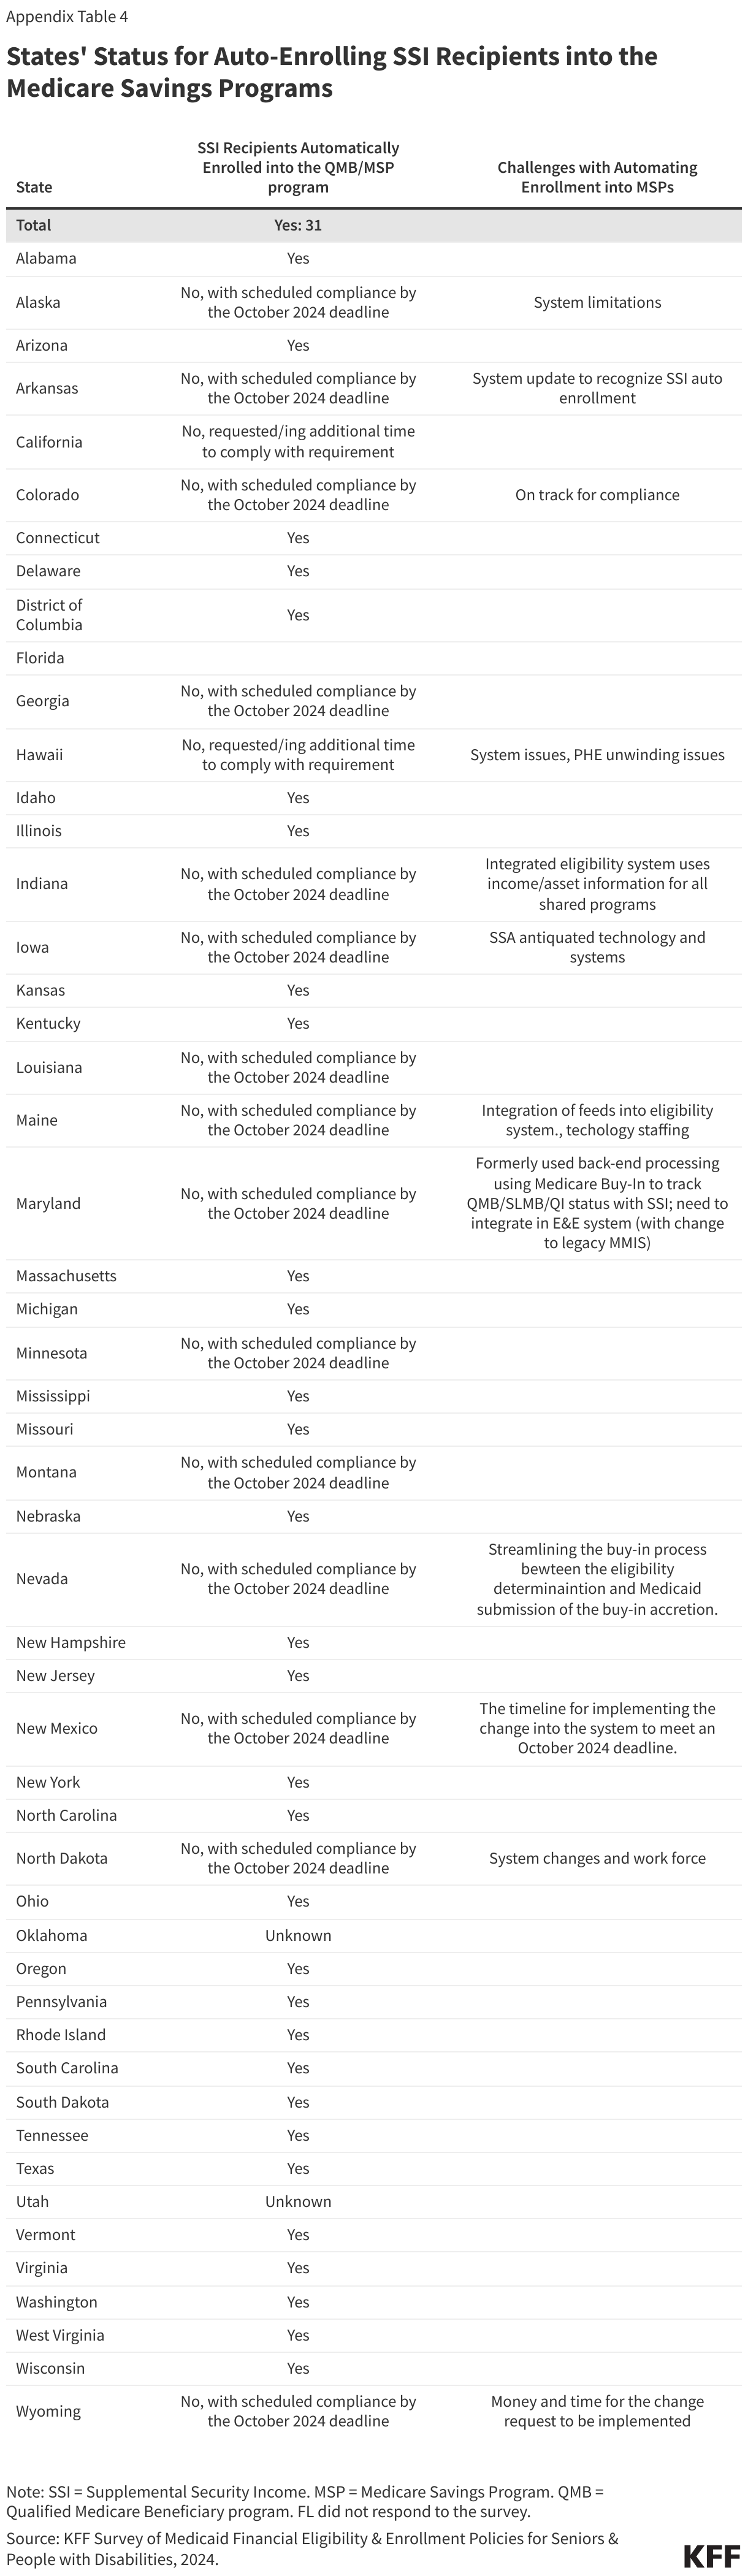
In 2024, 31 states reported that they already automatically enroll Medicare beneficiaries who receive SSI into the Medicare Savings Programs, one of the key requirements of the new rule (Appendix Table 4). Of the remaining states, 15 reported plans to do so by October 2024, while 4 states reported needing additional time to comply. Among states not already in compliance, the most common reasons cited were related to modernizing or updating existing systems to implement the change.

Methods

Medicaid Financial Eligibility and Enrollment Policies Data: KFF’s 50-state survey and from administrative records from the Centers for Medicare and Medicaid Services (CMS). KFF’s Survey of Medicaid Financial Eligibility & Enrollment Policies for Seniors & People with Disabilities was conducted in March 2024 by KFF and Watts Health Policy Consulting.

Enrollment Data: Data are from a KFF analytic file that merged the Centers for Medicare & Medicaid Services Chronic Conditions Data Warehouse 2021 research-identifiable Master Beneficiary Summary File (MBSF) Base and the 2021 Transformed Medicaid Statistical Information System (T-MSIS) Analytic Files (TAF) Research Identifiable Files (RIF) file using a Chronic Conditions Warehouse (CCW) beneficiary identifier crosswalk.

State inclusion criteria: Estimates include enrollees living in the 50 states and DC, excluding residents in the territories.

Dual-eligible individual inclusion criteria: Dual-eligible individuals were included if (1) they were in both the MBSF and T-MSIS files using the CCW crosswalk, and (2) Dual-eligible individuals are assigned full-benefit status and partial benefit status using an “ever” approach and a hierarchy by giving priority to the full-benefit status. Individuals were a full-benefit dual-eligible individual in 2021 using the Medicare monthly DUAL_STUS_CD with values of 02,04,08 or the Medicaid monthly code DUAL_ELGBL_CD with values of 02,04,08 or the monthly code RSTRCTD_BNFTS_CD_03 values of 1,A,D,4,5,7.If not a full-benefit dual-eligible and the individual had  DUAL_STUS_CD with values of 01,03,05,06 or the Medicaid monthly code DUAL_ELGBL_CD with values of 01,03,05,06 or the monthly code RSTRCTD_BNFTS_CD_03 values of 2,3,C,6,E,F they were assigned partial-benefit status.

Assignment to Medicaid eligibility categories. Dual-eligible individuals were assigned to each eligibility category by using the ELGBLTY_GRP_CD_LTST in 2021.

Eligibility groups for full-benefit dual-eligible individuals:

  • Supplemental social security income (SSI) with values of 11-22, 37, 38, 40, 41
  • Seniors and People with Disabilities up to 100% FPL (SPD) with values of 46.
  • Medically needy with values of 53-56, 59, 60.
  • HCBS Expansion with values of 39, 43, 51.
  • Special Income Rule to Extend LTSS Eligibility up to 300% SSI (Institutional) with a value of 42.
  • Special Income Rule to Extend LTSS Eligibility up to 300% SSI (HCBS) with a value of 52.
  • Disability work programs with values of 47, 48, 49.
  • Katie Beckett with values of 45, 50.
  • All other ELGBLTY_GRP_CD values were categorized as Other/Unknown.

Eligibility groups for partial-benefit dual-eligible individuals:

  • Medicare Savings Program (MSP) with values of 23-26.
  • Medically needy with values of 53-56, 59, 60.
  • All other ELGBLTY_GRP_CD values were categorized as Other/Unknown.

Other and unknown eligibility groups. Among all dual-eligible individuals, 8% had “other” or “unknown” in the eligibility group variable. Those pathways included missing values and values for the smaller eligibility groups, nearly all of which correspond to eligibility for children and parents. Medicare beneficiaries may be eligible for Medicaid through those pathways, but in practice few are because to qualify for Medicare people must either be ages 65 and older or have disabilities that qualify them for Social Security Disability Insurance. There were a small number of dual-eligible individuals who were recorded has having coverage through the Affordable Care Act (ACA) Medicaid expansion, but people are not eligible for ACA coverage if they are enrolled in Medicare. The classification of dual-eligible individuals as having ACA coverage in the data may be partially due to the continuous enrollment provision, which could have carried over an eligibility status from before the person qualified for Medicare.

One limitation to the analysis is that a significant minority (10%) of full-benefit dual-eligible individuals have the Medicare Savings Programs identified as their eligibility code in the Medicaid administrative data. Most full-benefit dual-eligible individuals are eligible for the Medicare Savings Programs, but that eligibility only qualifies them to receive Medicaid coverage of Medicare premiums and often, cost sharing. To receive full Medicaid benefits, they must also be eligible through one of the Medicaid eligibility pathways, but that pathway is unknown if the state recorded “Medicare Savings Programs” as their eligibility code in the administrative data. Related, this analysis does not include estimates of the total number of people enrolled in the Medicare Savings Programs—only the number of dual-eligible individuals for whom the Medicare Savings Programs are the only basis for their Medicaid eligibility.

This work was supported in part by Arnold Ventures. KFF maintains full editorial control over all of its policy analysis, polling, and journalism activities.

Key Pathways to Full Medicaid for Dual-Eligible Individuals

To qualify for full Medicaid benefits, Medicare beneficiaries must meet the eligibility criteria for one of the Medicaid eligibility pathways. Among the eligibility pathways that are most common for dual-eligible individuals, some pathways enroll mostly people without Medicare while dual-eligible individuals comprise most enrollees in other pathways.

Supplemental Security Income: States generally must provide Medicaid to people who receive SSI, except in the 8 Section “209(b)” states for which eligibility is not directly tied to SSI. The 209(b) states (Connecticut, Hawaii, Illinois, Minnesota, Missouri, New Hampshire, North Dakota, and Virginia) use financial or functional eligibility criteria that are more restrictive than the federal SSI rules, but no more restrictive than the rules the state had in place in 1972 when SSI was established. In 2021, the 4.6 million dual-eligible individuals enrolled through SSI represented almost half of the 9.6 million total Medicaid enrollees eligible through this pathway.

Poverty Related Coverage: States may choose to offer coverage to seniors and people with disabilities who have low incomes. In 2021, the 1.3 million dual-eligible individuals enrolled through this pathway comprised two thirds of the 1.9 Medicaid enrollees who were enrolled through pathways for low-income seniors and people with disabilities.

Medically Needy Coverage: States may use medically needy pathways to extend coverage to people who would be eligible through another pathway but have income or assets that exceed the limit for that pathway. People may qualify through a medically needy pathway if their income is higher than permitted under a different pathway but lower than the medically needy limit, or if they “spend down” to the medically needy limit by deducting health care expenses from their income. For people who spend down to eligibility, states select a budget period between one and six months during which the individual must incur enough expenses to decrease their income below the limit. In 2021, there were 0.9 million dual-eligible individuals, 23% of all Medicaid enrollees eligible through medically needy pathways.

Buy In Programs: Medicaid buy in programs allow people with disabilities to retain Medicaid coverage when their income increases above eligibility levels on account of their own employment. In 2022, the median income limit for the buy in was 250% FPL and the median asset limit was $10,000 for an individual. Although fewer than 0.2 million full-benefit dual-eligible individuals enrolled in the buy in programs in 2021, dual-eligible individuals comprised nearly 80% of all people participating in such programs that year.

Long-Term Services and Supports: States have many options to cover people who use LTSS through Medicaid. Dual-eligible individuals comprise 83% of Medicaid enrollees that are enrolled through the pathways using a special income rule for people who require an institutional level of care and other expansions specifically for people using home- and community-based services (1 million out of 1.2 million). The one LTSS-related pathway that enrolls few duals is the Katie Beckett option, which covers children up to age 19 who require an institutional level of care but are living at home. Nearly 50,000 children were enrolled in 2021, roughly 100 of whom were dual-eligible individuals.

Appendix Tables
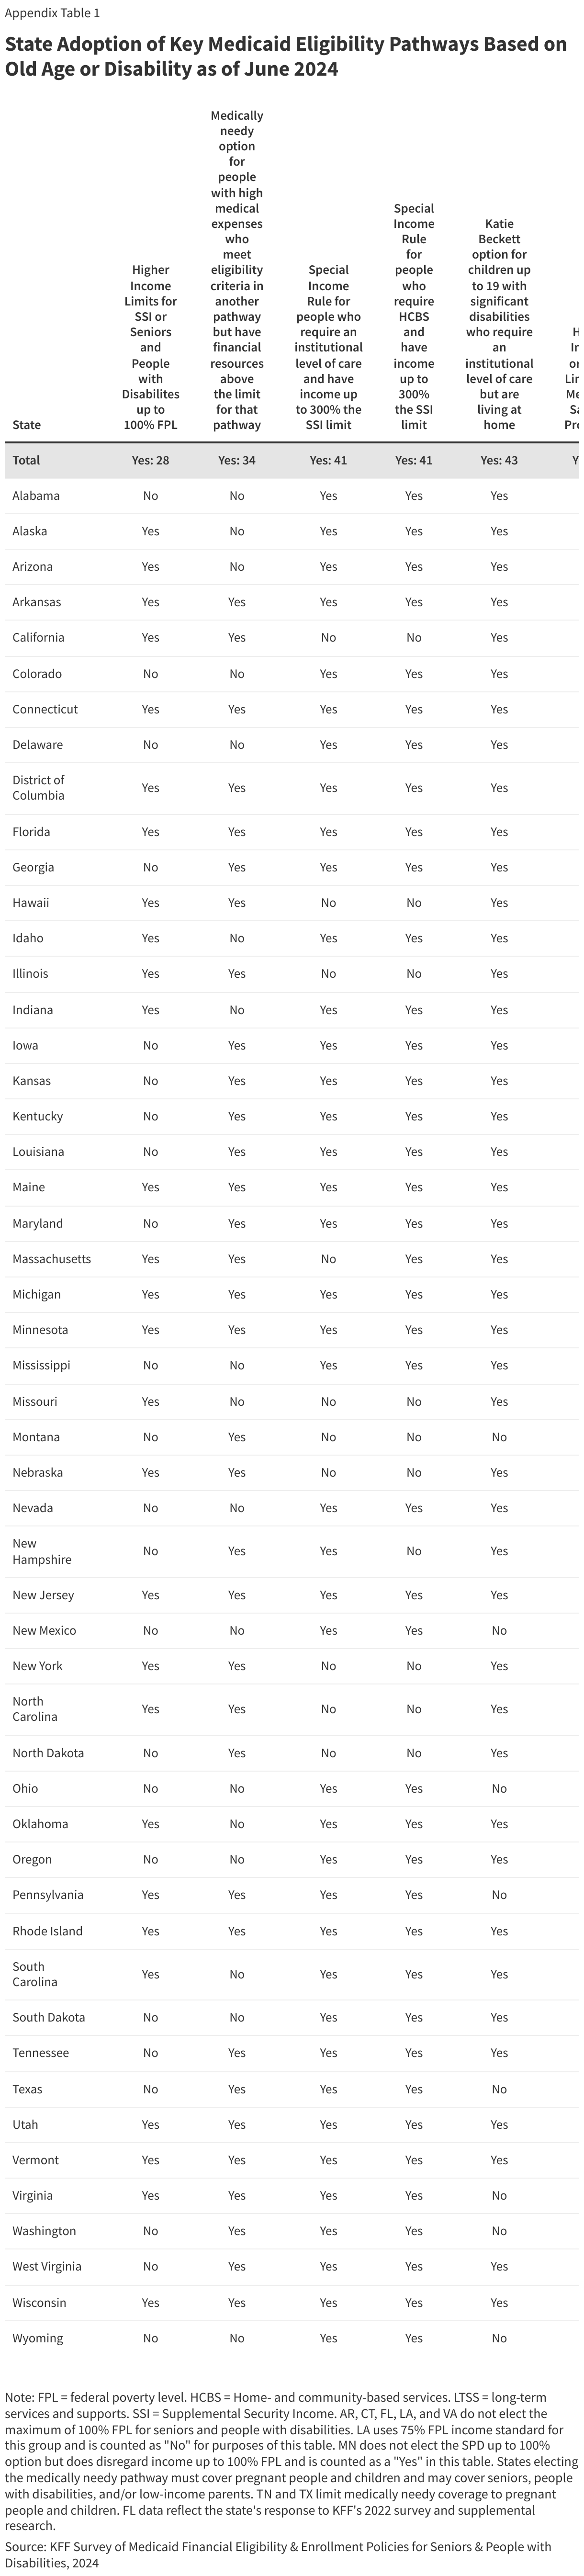
State Adoption of Key Medicaid Eligibility Pathways Based on Old Age or Disability as of June 2024

Enrollment of Full-Benefit Dual-Eligible Individuals In Key Medicaid Pathways by State, 2021

Eligibility for and Enrollment in the Medicare Savings Programs Among Partial-Benefit Dual-Eligible Individuals

States' Status for Auto-Enrolling SSI Recipients into the Medicare Savings Programs

Dependent Coverage for Young Adults in Employer-Sponsored Health Plans

Authors: Matthew Rae, Gary Claxton, and Anthony Damico
Published: Oct 21, 2024

Most employers that offer health insurance include the option for enrollees to cover a spouse or other qualified dependents. Dependent coverage plays a key role in providing health insurance for individuals who either do not have access to their own employer-sponsored plan or find the plan they are offered unaffordable. This data note examines how dependent coverage changes with age, using data from the Current Population Survey (CPS) Annual Social and Economic Supplements for 2024.

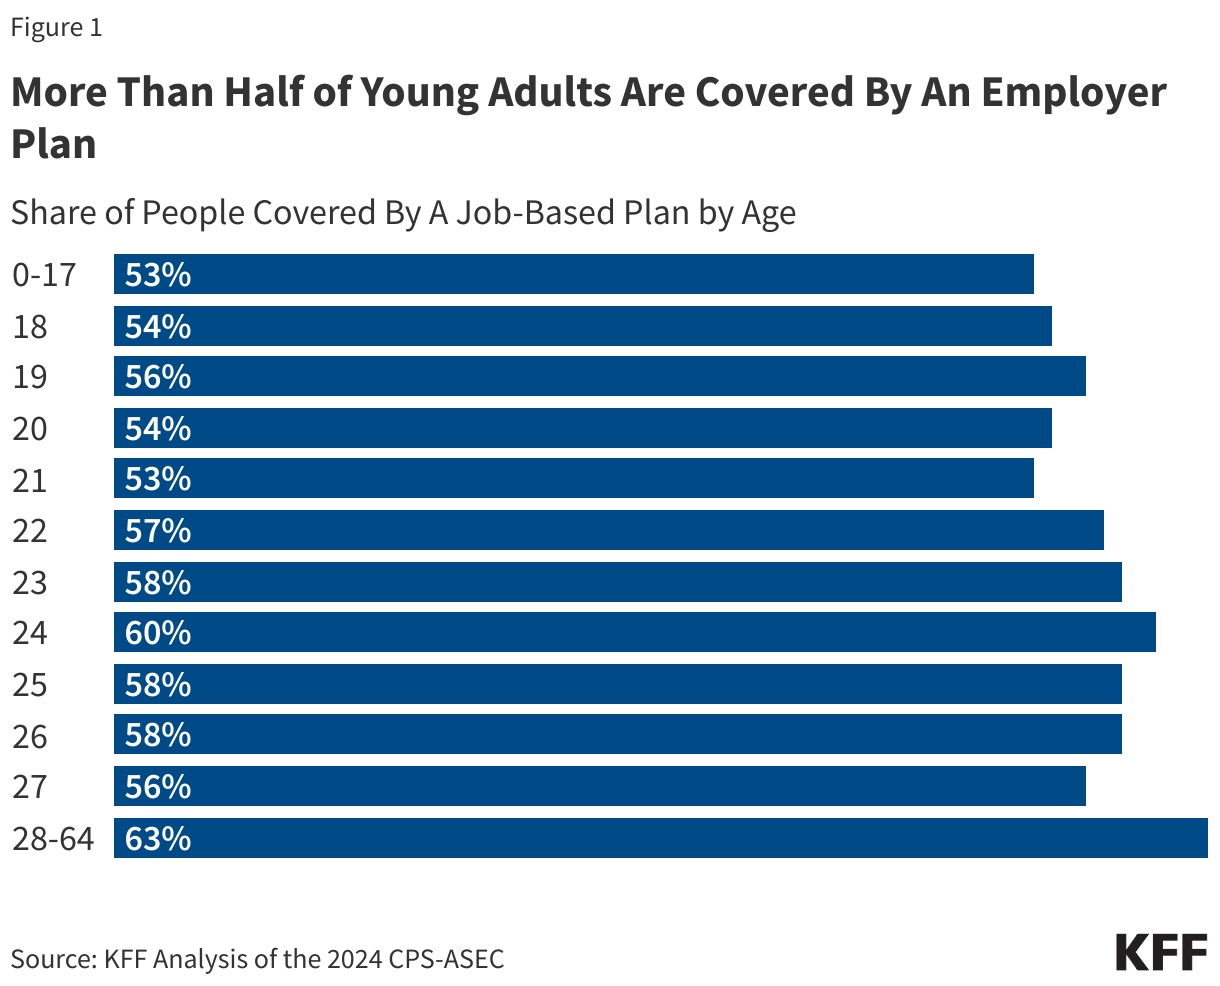
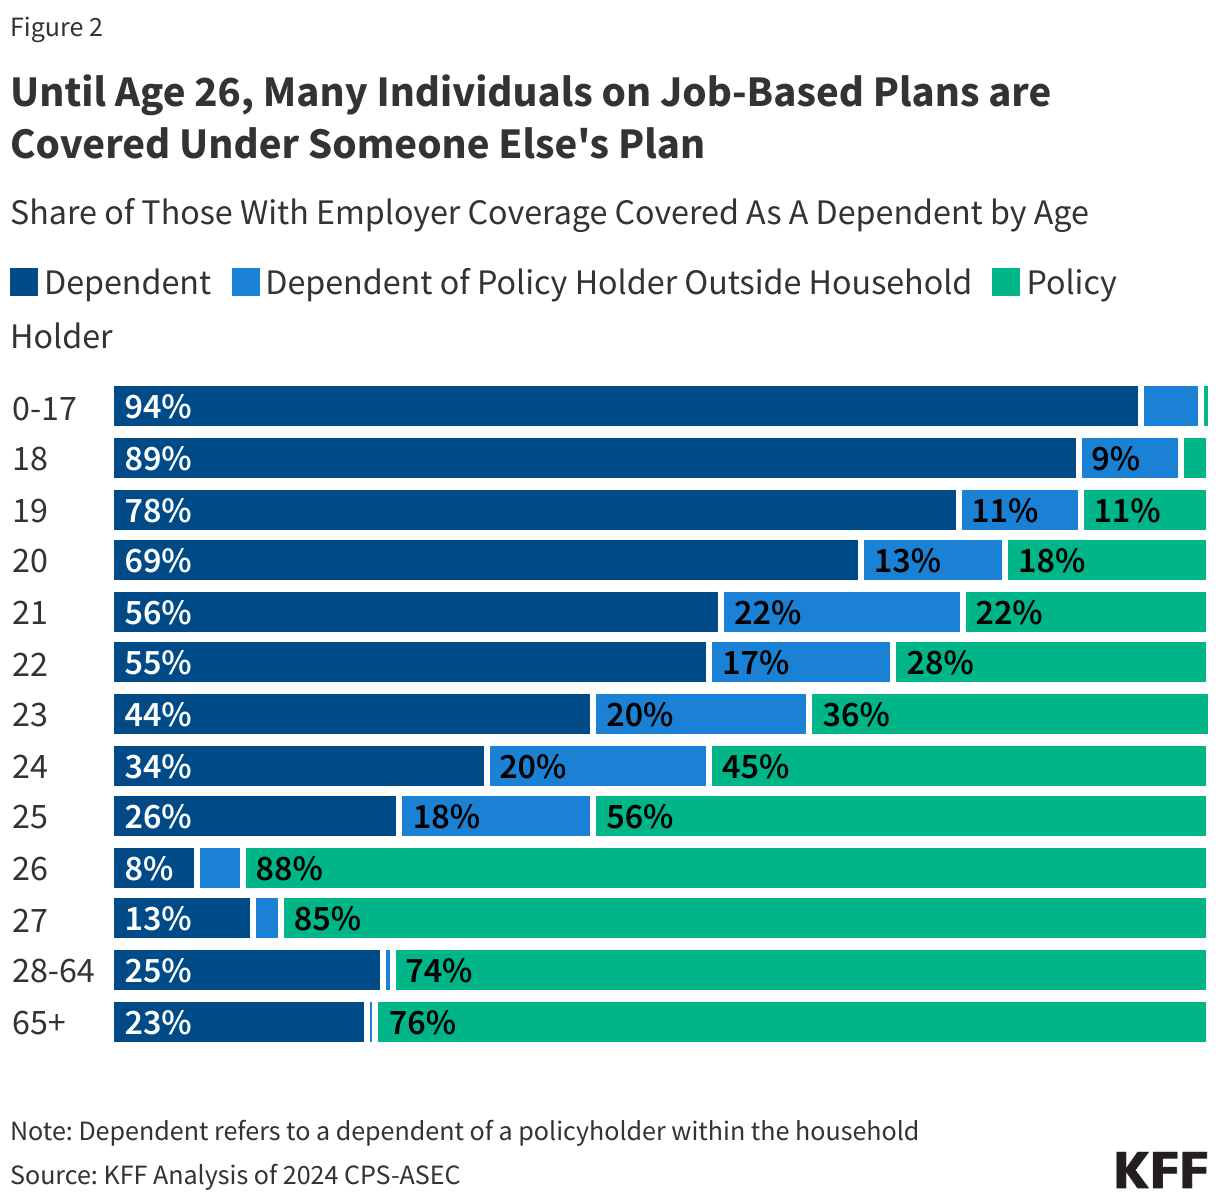
Overall, just under half of individuals with job-based health coverage are enrolled as a dependent on a family member’s plan (47%). The likelihood of enrolling as a dependent decreases with age. Nearly all children (ages 0-17) with employer-sponsored coverage are enrolled as dependents, usually on a parent’s plan. Young adults, particularly those ages 18-25, are more likely to be covered as dependents than adults overall (72% vs. 32%). The Affordable Care Act (ACA) requires most employer plans allow young adults to remain on a parent’s plan until age 26. Before the ACA, employers typically limited dependent eligibility for young adults to an age less than 26 and often imposed additional eligibility requirements. This provision of the ACA, maintains considerable popularity, and has been credited with reducing the uninsured rate among young adults. In 2024, 56% or 19.3 million young adults aged 18-25 were covered on an employer-sponsored plan (Figure 1).

As young adults age, a greater share of those with employer coverage transitions from dependent coverage to being policyholders. For instance, while a majority of 18 and 19-year-olds with employer-sponsored coverage are still covered as dependents, the proportion decreases among those aged 24 and 25 (93% vs. 50%) (Figure 2).

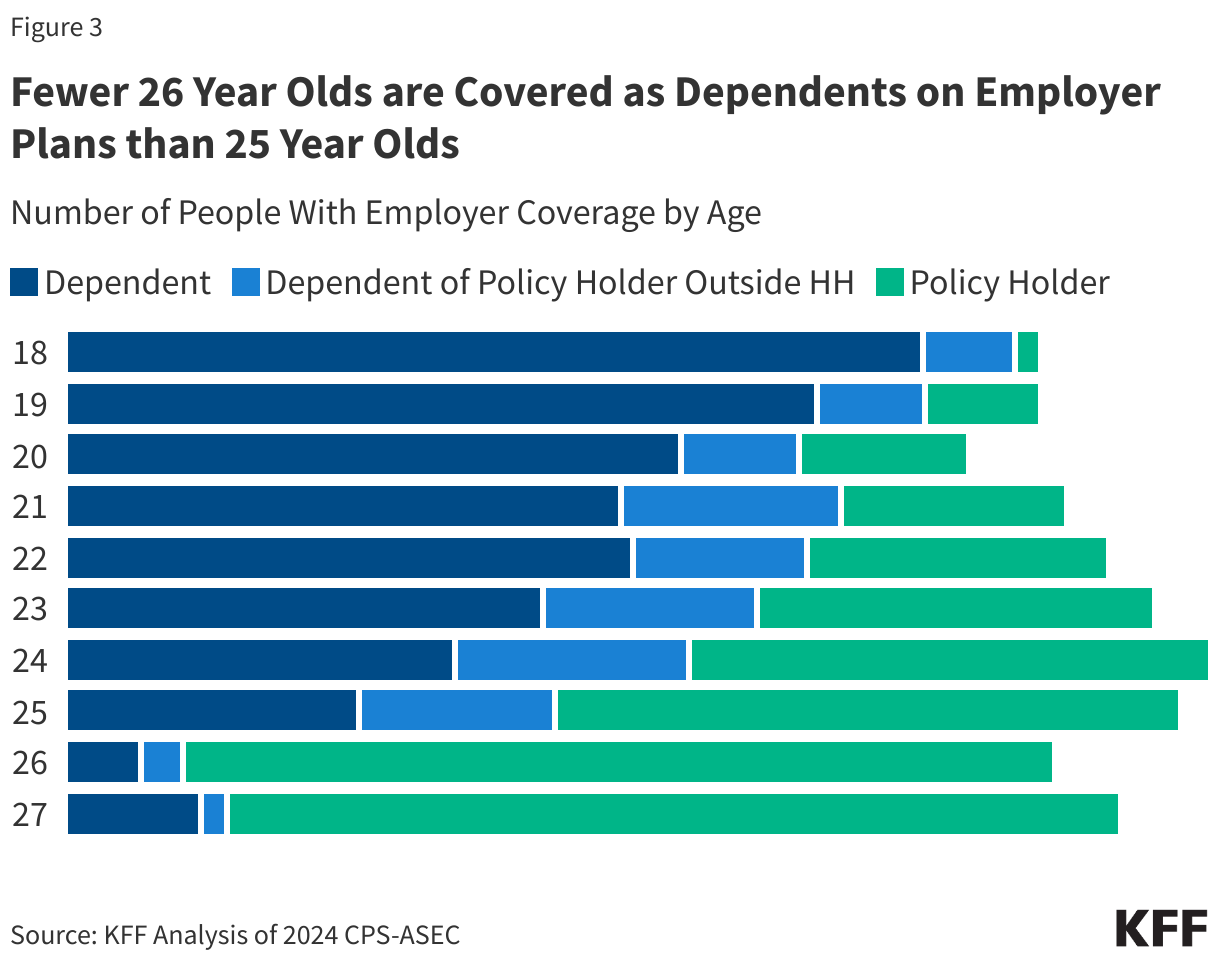
The CPS asks about individuals’ health coverage and their relationships within the households. The survey does not capture details on how someone enrolled in a plan sponsored by someone outside the household is related to the policy holder. For example, it is not possible to ascertain who sponsors coverage for a young adult living away from home. In many cases, those covered as dependents on an employer plan sponsored by someone outside of the household may be a parent. In total, 17% of young adults with employer sponsored coverage are covered as dependents on a plan sponsored by someone outside the household and 55% are covered by someone in the household. Among young adults enrolled as dependents on a plan sponsored by someone within the household, 93% are covered by a parent, 4% are covered by a spouse and 3% by partner or other family member. These percentages change significantly once an individual reaches age 26, when the share of those covered on dependent employer coverage by a spouse increases substantially compared to those aged 25 (81% vs. 16%). In total, 1.2 million 25-year-olds are covered as dependents on employer plans, compared to 300,000 26-year-olds (Figure 3). The increasing share of 26-year-olds covered as policy holders may reflect a variety of factors, including a general trend of more young adults having job-based offers as they become established in the workforce, and more age 26-years-olds electing to enroll in their own employer plan when they are no longer eligible to enroll as a dependent on a parent’s plan.

More Than Half of Young Adults Are Covered By An Employer Plan
Until Age 26, Most Individuals on Job-Based Plans are Covered Under Someone Else's Plan
Fewer 26 Year Olds are Covered as Dependents on Employer Plans than 25 Year Olds
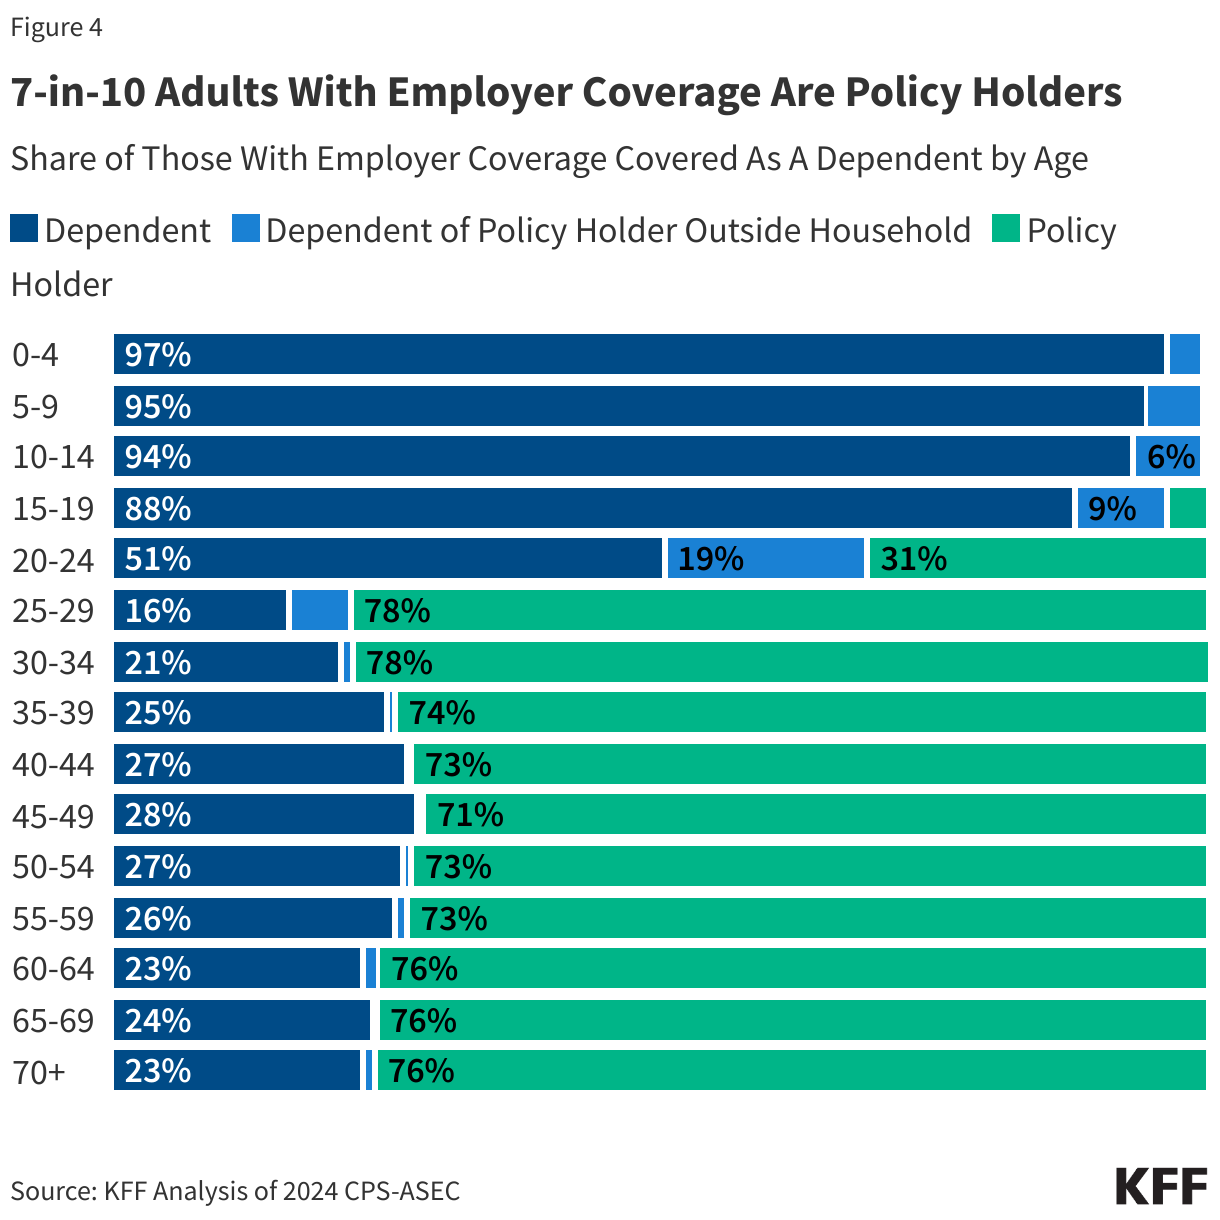
7-in-10 Adults With Employer Coverage Are Policy Holders

Access to Fertility Care: Findings from the 2024 KFF Women’s Health Survey

Published: Oct 21, 2024

Key Takeaways

  • One in eight (13%) reproductive age women say they or their partner have ever needed fertility services to help them become pregnant or prevent a miscarriage. Similar shares of women across party lines report needing fertility care at some point.
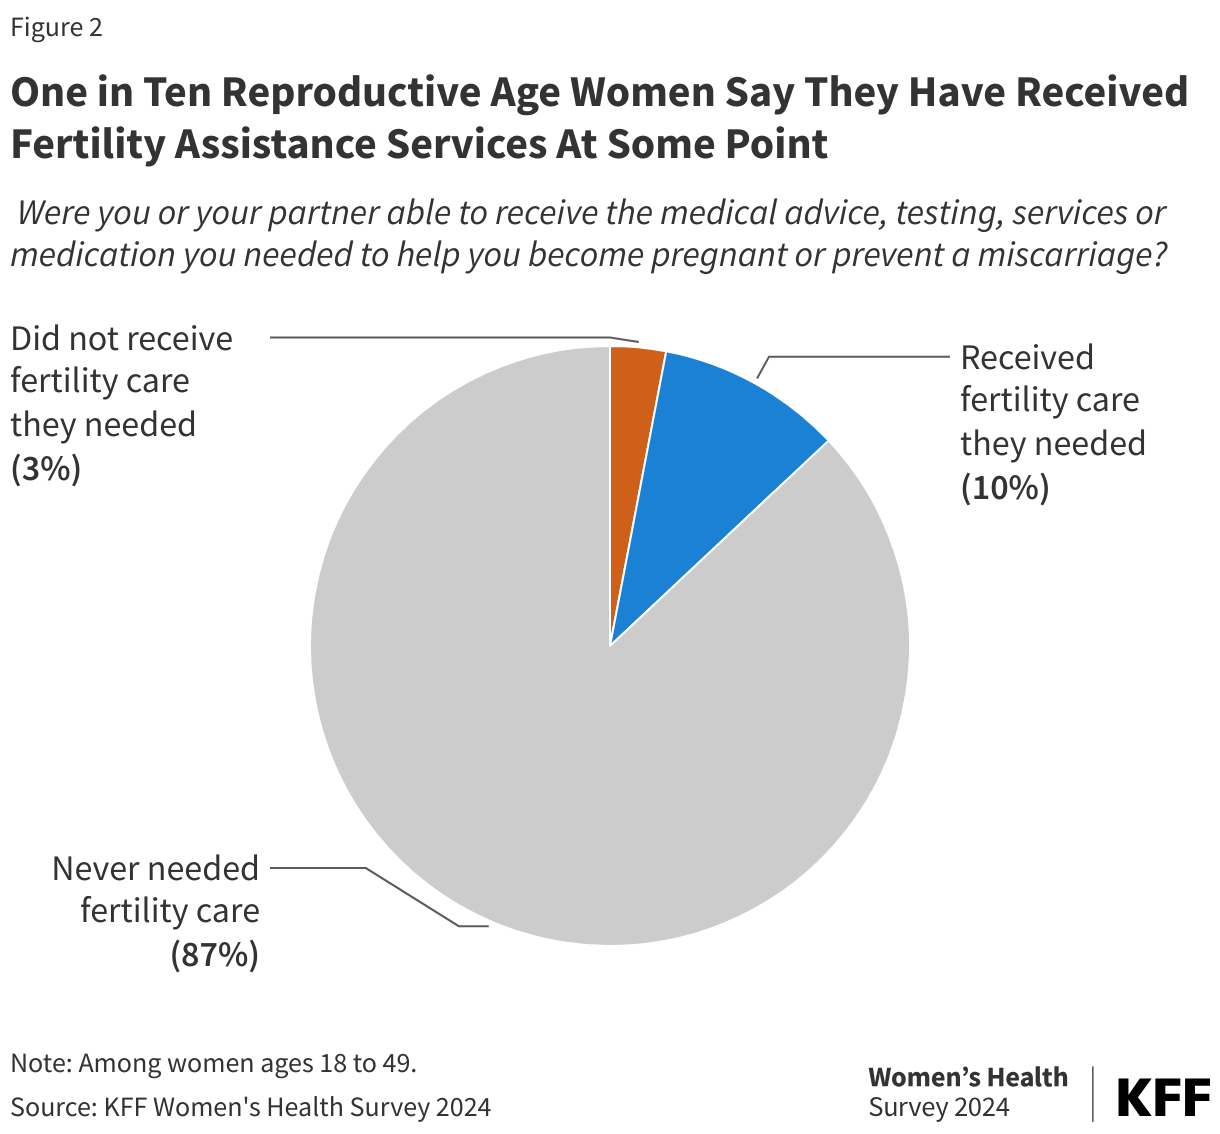
  • However, a smaller share say they have actually received services. One in ten women ages 18 to 49 say they or their partner have received fertility assistance, but 3% of women say they were unable to get the fertility care they needed. Most reproductive age women (87%) say they have never needed fertility services.
  • Cost is the leading reason why women say they could not obtain the fertility care they need. Higher shares of women with low incomes report cost as the main barrier compared to those with higher incomes.
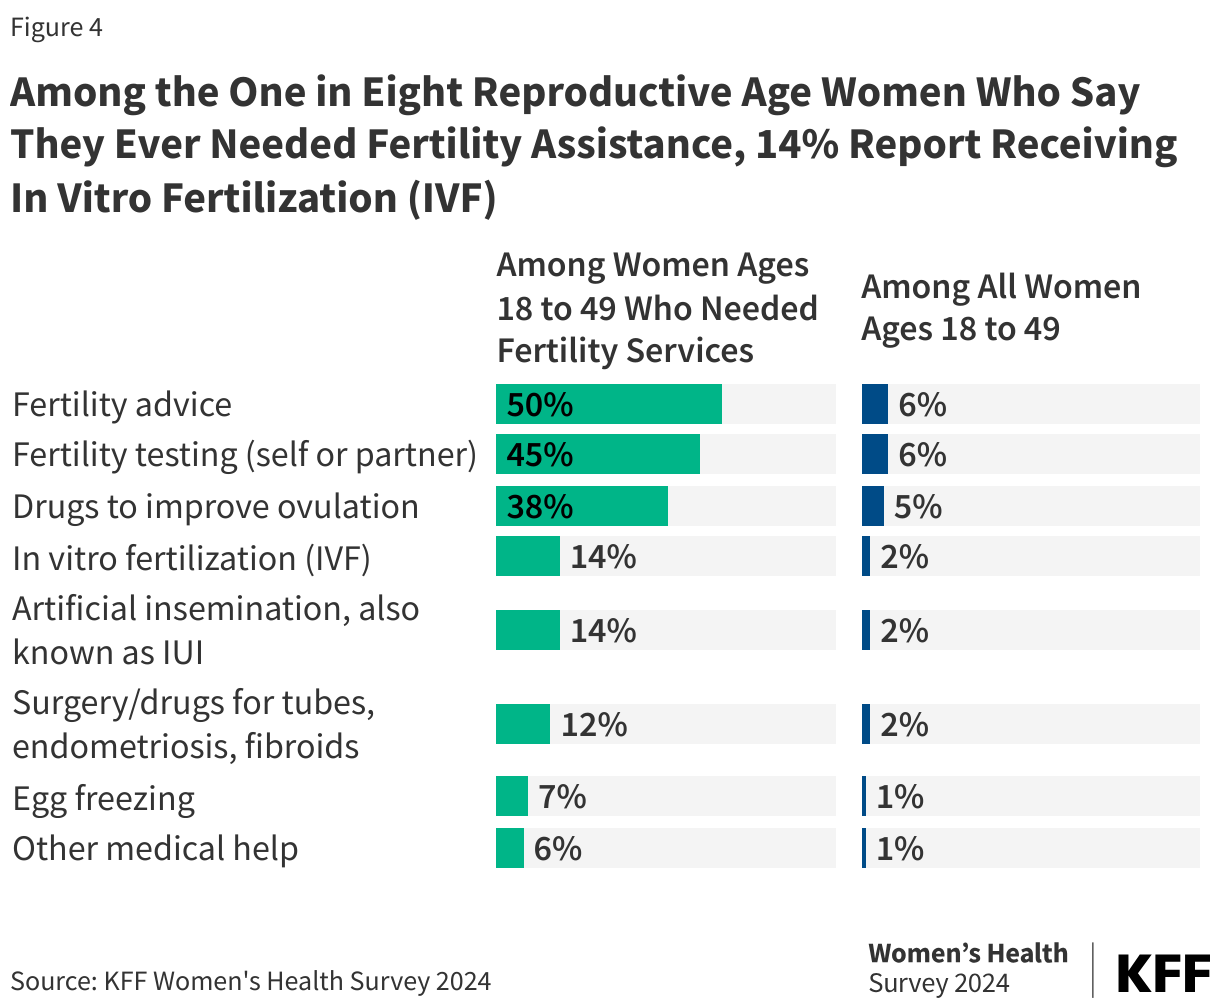
  • The fertility services that reproductive age women most commonly use are fertility advice, fertility testing, and medications to improve ovulation. Among women who say they or their partner ever needed fertility care, 14% report they received in-vitro fertilization (IVF), and 14% report they received artificial insemination (IUI), which translates to 2% of all reproductive age women who report ever receiving either service.
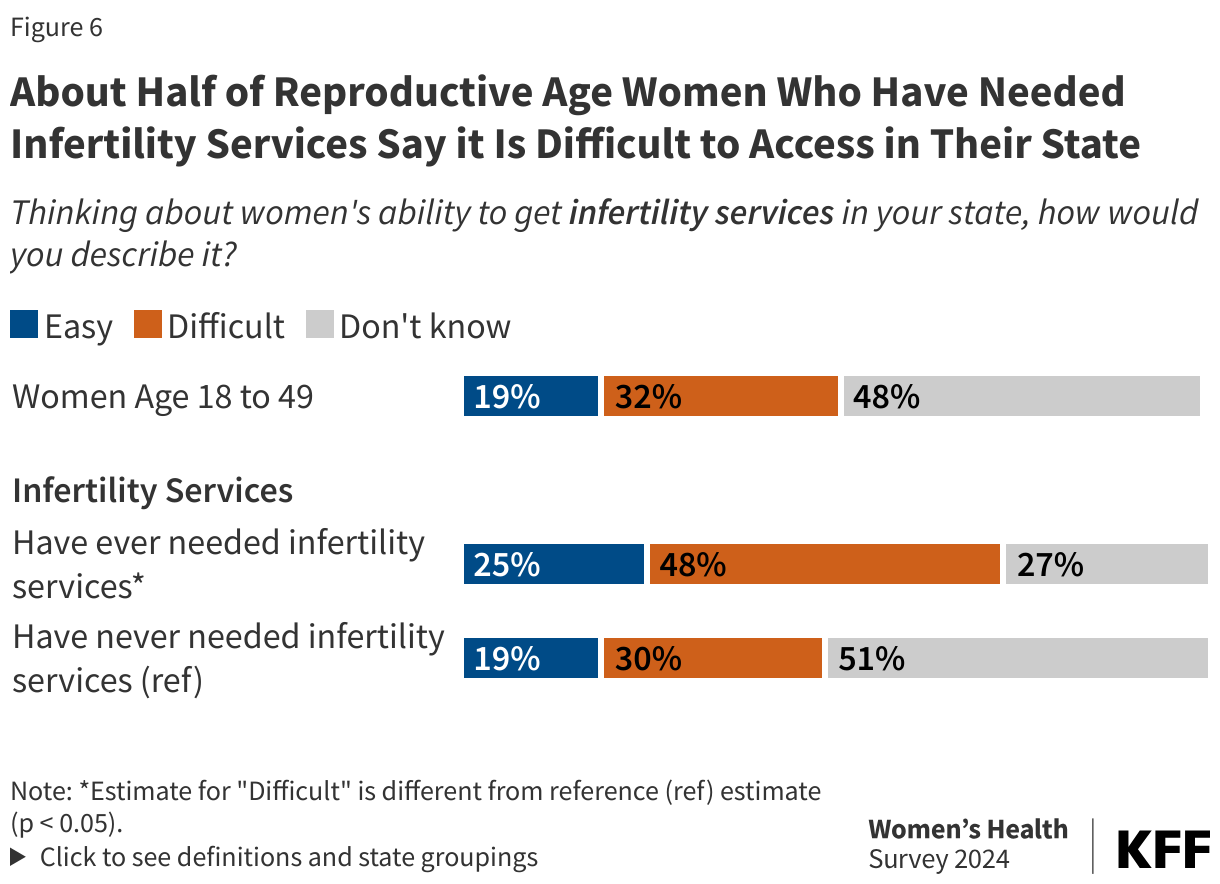
  • One-third (32%) of reproductive age women say it is difficult to access infertility services in their state. Nearly half of women who have ever needed infertility services (48%) say it is difficult to get care in their state, compared to 30% of those who have never needed infertility services.

Fertility care, particularly in vitro fertilization (IVF), came into the spotlight earlier this year when the Alabama Supreme Court issued a ruling declaring that embryos created during the IVF process are “unborn children.” The decision sparked widespread outrage and attention over the role of fetal personhood policies in limiting care for a range of reproductive health care services beyond abortion, including some contraceptives and fertility assistance. IVF has also become an issue on the presidential campaign trail.

The 2024 KFF Women’s Health Survey provides new data on access to fertility care, including women’s opinions about access in their state, cost barriers, and the range of fertility services that women use. The survey was conducted from May 13 – June 18, 2024, online and by telephone among a nationally representative sample of 6,246 adults ages 18 to 64, including 3,901 women ages 18 to 49. This paper presents data among women ages 18 to 49.

Need for Fertility Care and Cost Barriers

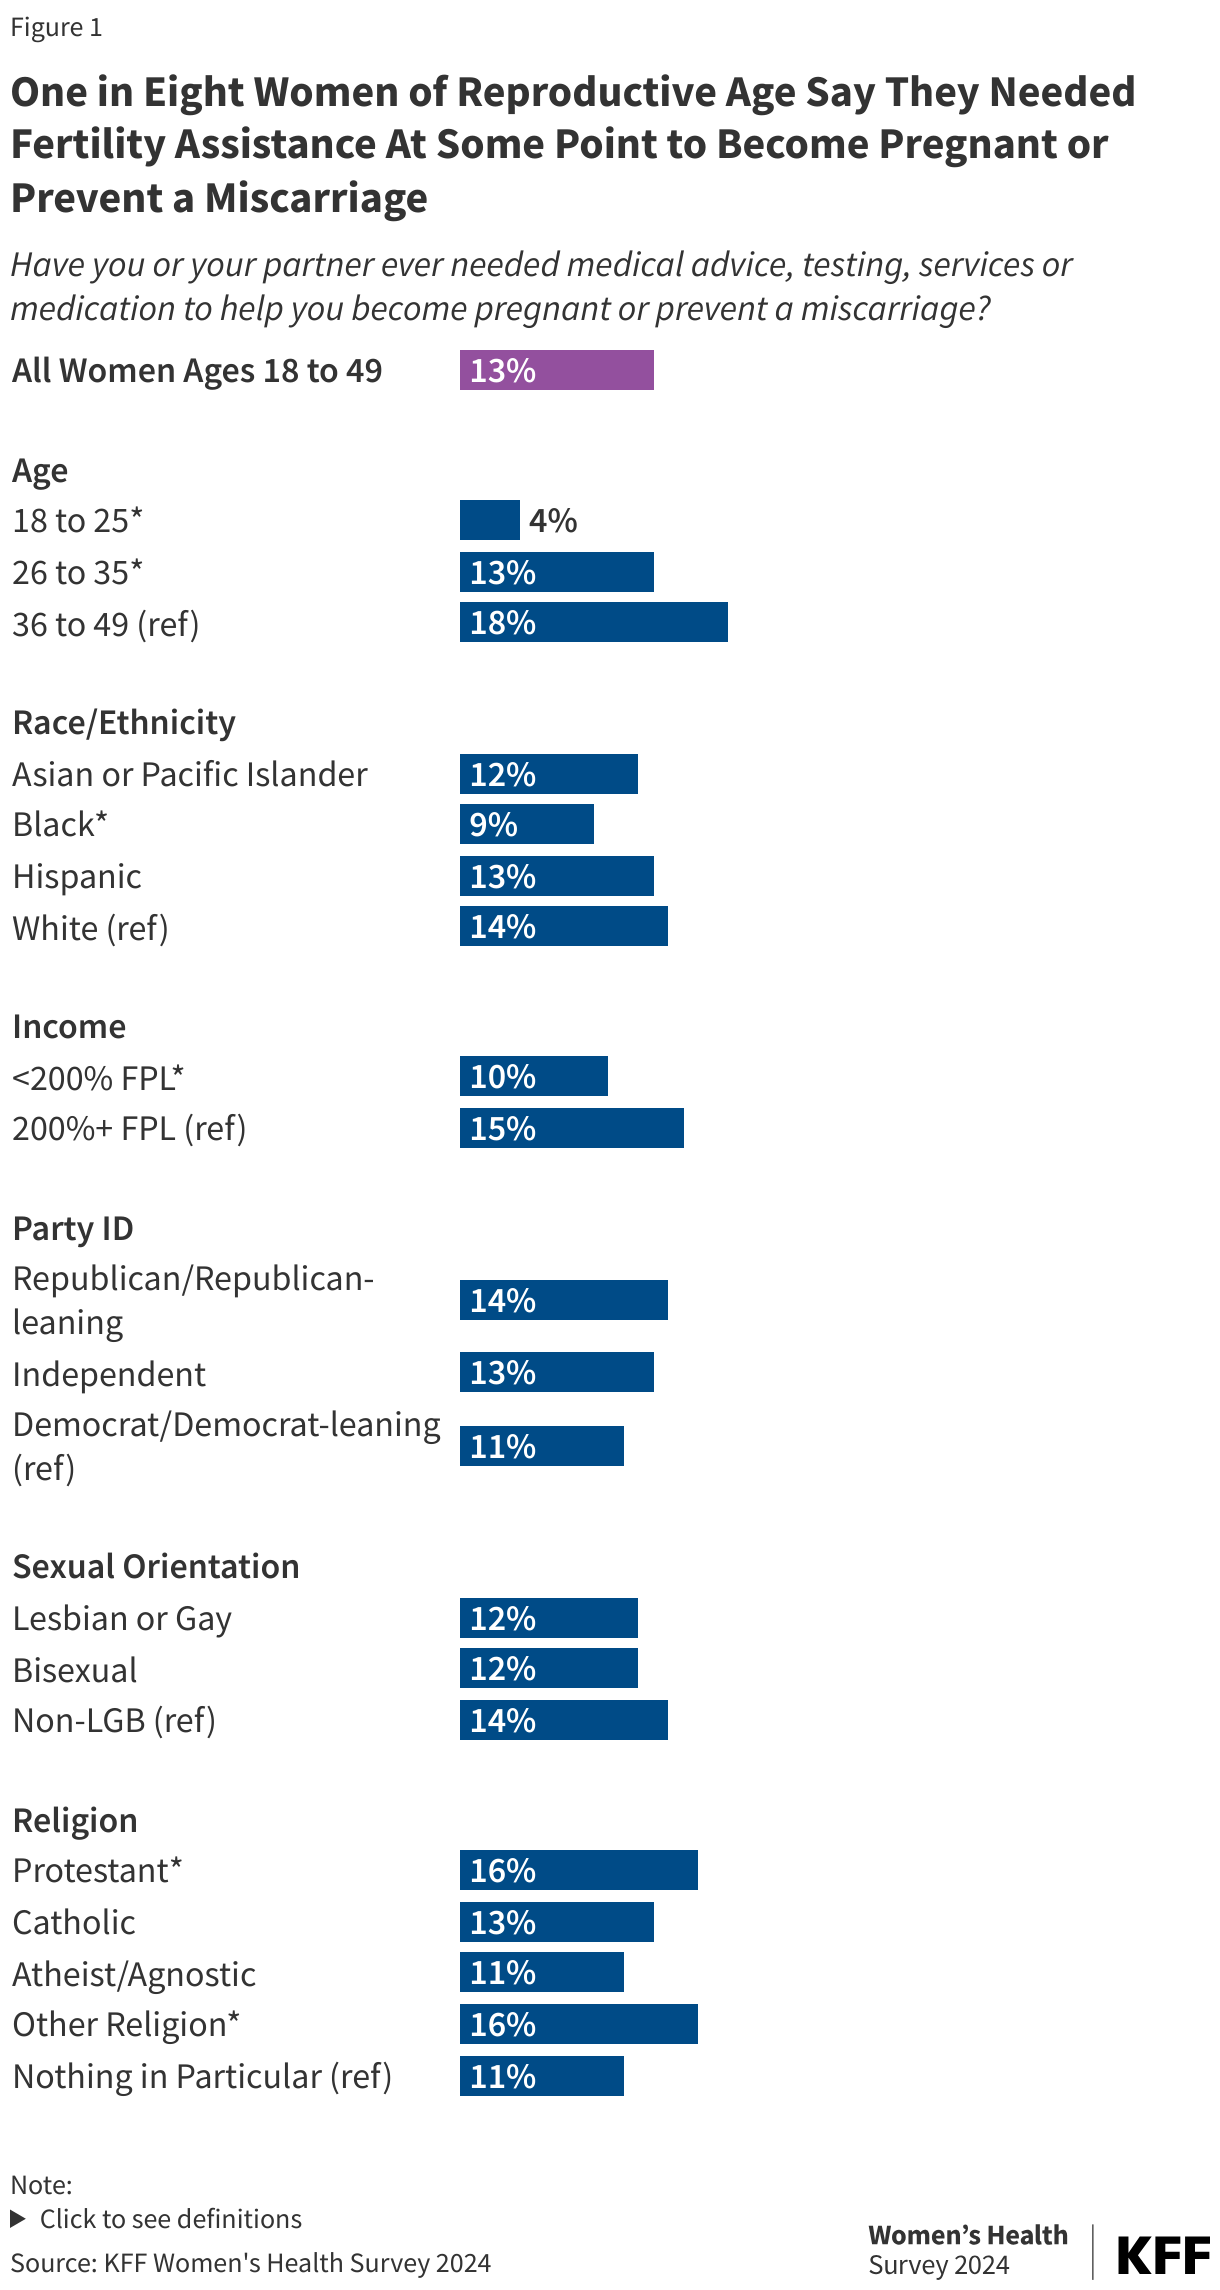
One in eight (13%) women ages 18 to 49 say they or their partner needed fertility assistance services at some point. Nationally, 13% of reproductive age women report needing fertility services to become pregnant or prevent a miscarriage at some time in their lives (Figure 1). Higher shares of women ages 36 to 49 (18%) report ever needing fertility services at some point, compared to 4% of women ages 18 to 25 and 13% of those ages 26 to 35.

The need for fertility care is similar across most other demographic groups, except slightly lower among Black women (9%) compared to their White counterparts (14%). Similarly, 10% of women with lower incomes report needing fertility services, slightly less than women with higher incomes (15%). The survey finds that similar shares of women across party lines report needing fertility care at some point. Similar shares of lesbian/gay women (12%), bisexual women (12%), and non-LGB women (14%) report needing fertility services at some point to become pregnant or prevent a miscarriage. Compared to women who do not follow any religion in particular (11%), higher shares of those who identify as Protestants (16%) or some other religion (16%) report ever needing fertility assistance.

One in Eight Women of Reproductive Age Say They Needed Fertility Assistance At Some Point to Become Pregnant or Prevent a Miscarriage

Among all reproductive age women, one in ten say they or their partner have received fertility services at some point. One in ten women have received fertility services, while 3% say they needed services but were not able to obtain it (Figure 2). While a relatively small share of women say they could not obtain fertility services, they may not be able to grow their families as desired because they could not get the care they needed. Most reproductive age women (87%) say they have never needed fertility services. This may include women who have not yet tried to become pregnant as well as women who do not want to have children.

One in Ten Reproductive Age Women Say They Have Received Fertility Assistance Services At Some Point

The leading reason why women say they didn’t get needed fertility services is cost. This is more commonly reported among women with low incomes.

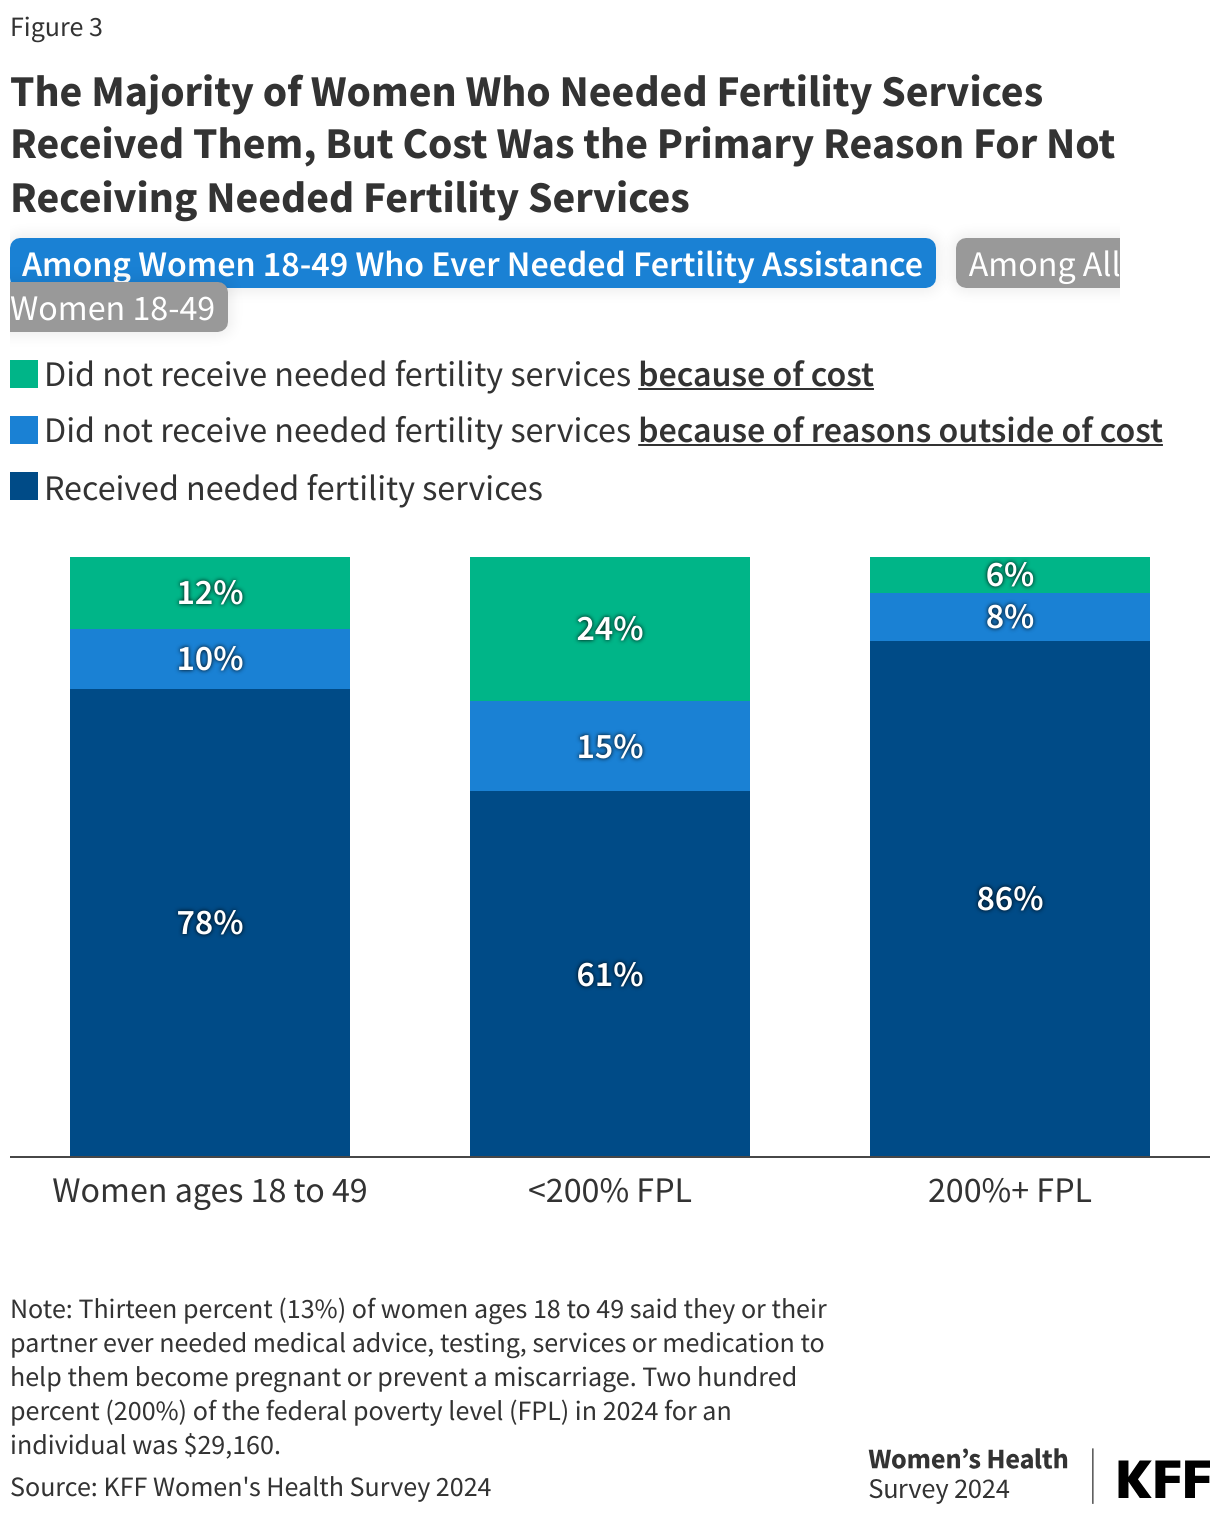
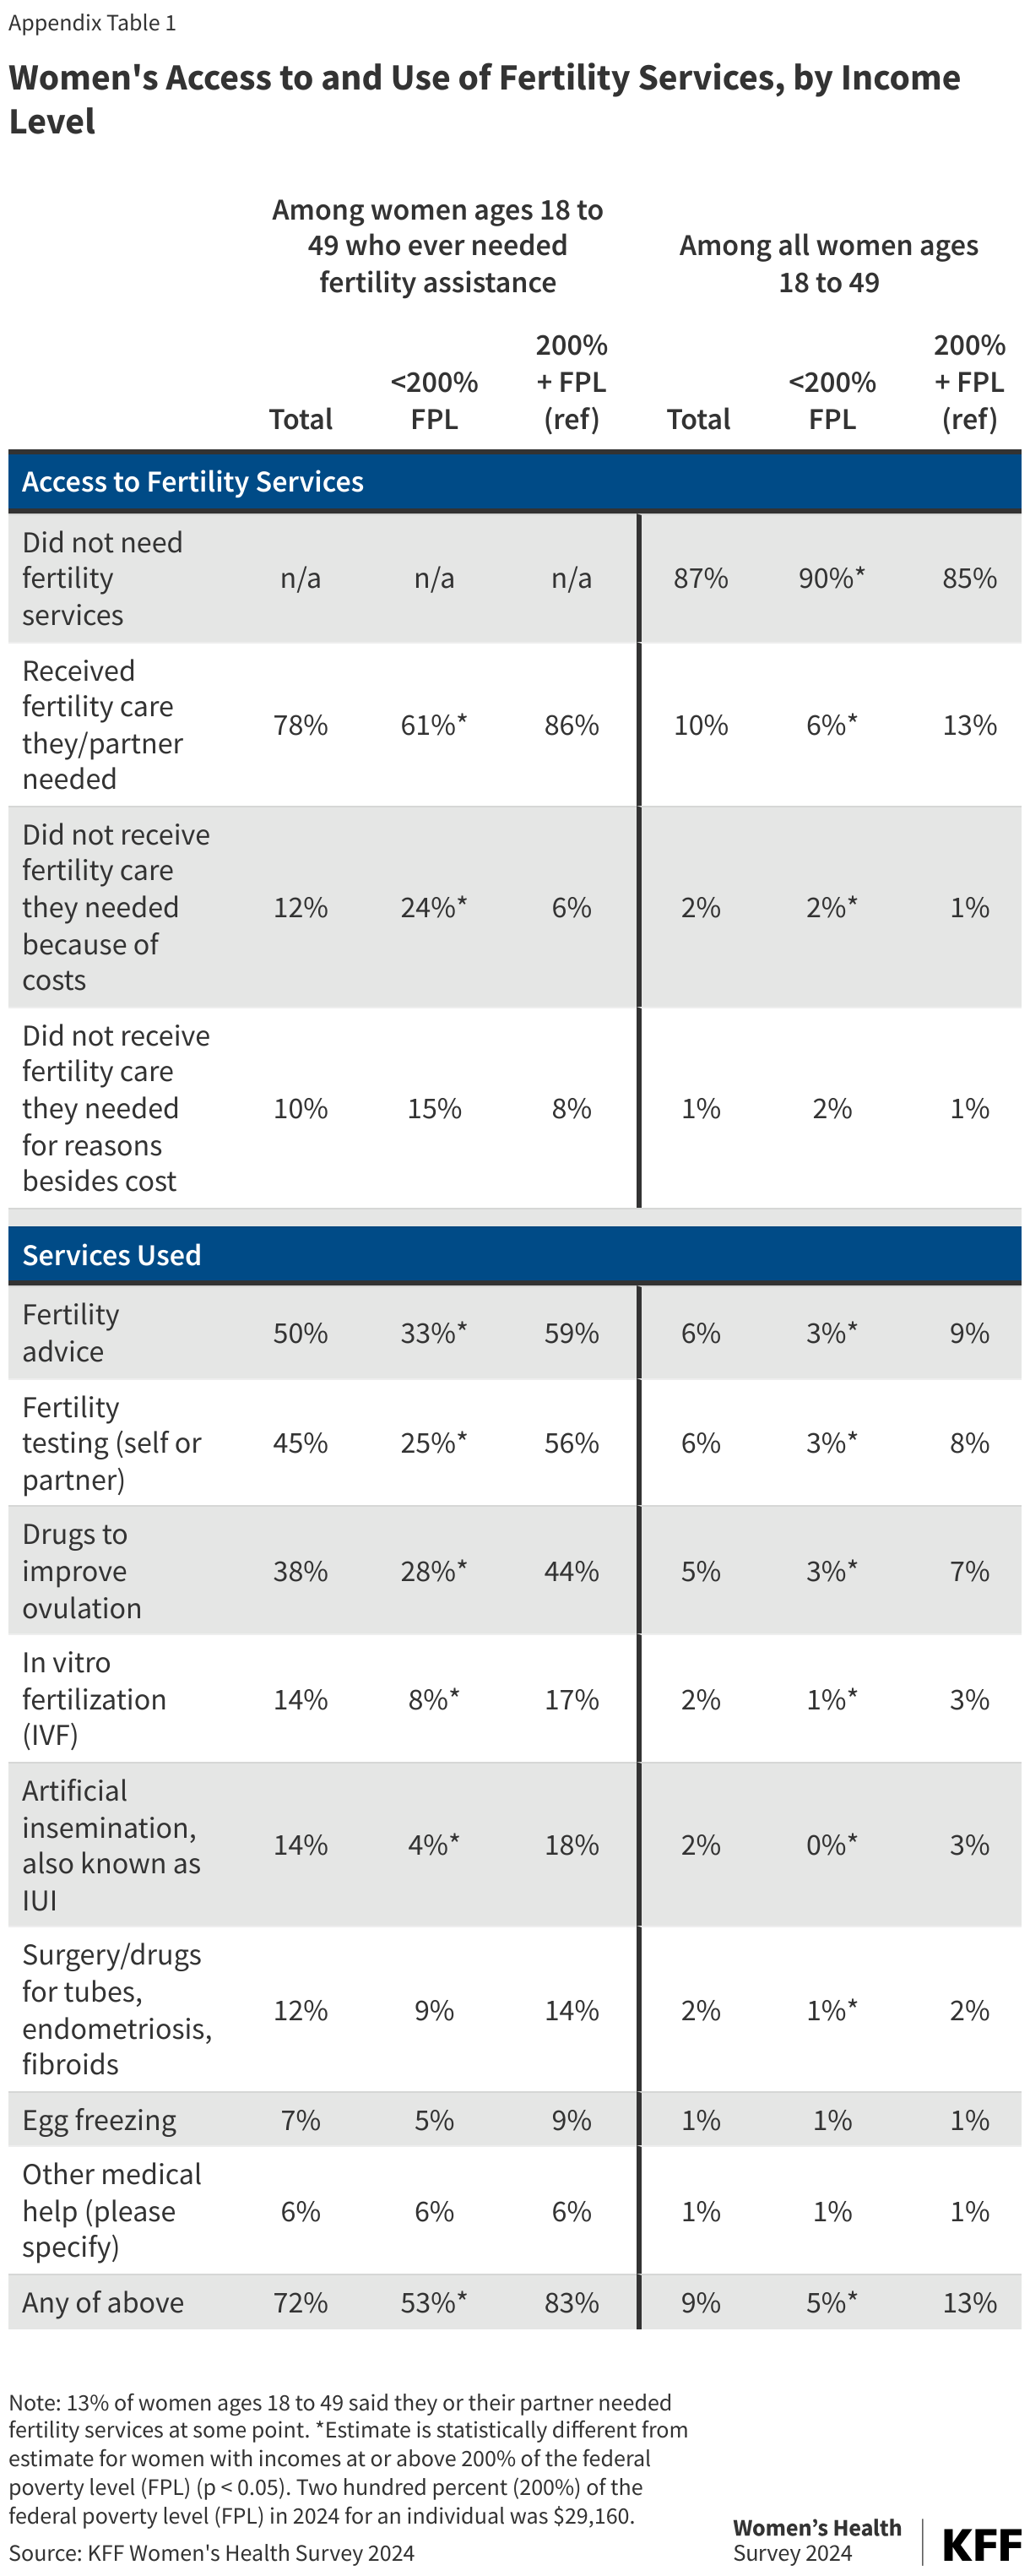
There are many obstacles to receiving fertility care, including costs, coverage, provider availability, and time constraints. However, cost is by far the single largest barrier. Among reproductive age women who reported needing fertility services at some point, 12% (2%of all reproductive age women) say they did not receive these services and cost was the primary reason (Figure 3). Not surprisingly, this is more common among women with lower incomes. Among women who said they ever needed fertility services, a quarter (24%) with lower incomes cite cost as the main reason they could not obtain fertility services, compared to 6% of women with higher incomes. Overall, this represents 2% of all reproductive age women with low incomes and less than 1% of those with higher incomes who say they did not obtain fertility services because of cost.

Coverage for fertility services is limited in both private insurance and Medicaid. The 2024 KFF Employer Health Benefits Survey finds that about a quarter (27%) of large firms that offer health benefits cover IVF services. Some states require state-regulated private insurers to cover some level of fertility services, but Medicaid, the health coverage program for people with lower incomes, rarely covers fertility services. In fact, federal law exempts state Medicaid programs from a requirement to cover fertility medications, which is different from most other outpatient prescription drugs which typically must be covered by the program.

There is a wide range of services that people may use for fertility assistance and the costs vary widely too, with the most expensive services exceeding thousands of dollars on average, which makes them out of reach for most people, particularly those with lower incomes and those with limited or no insurance coverage.

The Majority of Women Who Needed Fertility Services Received Them, But Cost Was the Primary Reason For Not Receiving Needed Fertility Services

Types of Fertility Services

The leading fertility services that women report receiving are advice, testing, and drugs to improve ovulation.

Fertility assistance encompasses a broad array of services, including advice and counseling, medications, surgical procedures, diagnostic tests, imaging studies, cryopreservation, intrauterine insemination (IUI), in-vitro fertilization (IVF), and surrogacy. Depending on individual circumstances, people may use a variety of these services to become pregnant and/or to prevent miscarriages, particularly if they have a history of or are at higher risk for pregnancy loss. The costs of services also vary greatly.

Among the 13% of reproductive age women who ever needed fertility services, about half said they received advice (50%) or testing for themselves or their partner (45%), and more than a third (38%) received drugs (e.g. clomid, hormones, etc.) to improve ovulation (Figure 4). Just over one in ten (12%) women said they had a corrective surgery or drugs to address an issue such as fibroids or endometriosis. Among all reproductive age women, the shares who have used these services are smaller and presented in Figure 4 and Appendix Table 1.

Among the one in eight reproductive age women who said they or their partner ever needed fertility services, 14% report they received IVF, and 14% report they received artificial insemination, also known as IUI. This translates to 2% of all reproductive age women who report receiving IVF or IUI.

IVF is a medical procedure where a sperm and egg are combined in a lab setting to create an embryo, which is then placed in the uterus. While a relatively small share of people ever use IVF or IUI, many seek these services after trying a range of other services such as medications, acupuncture, and surgeries. The IVF process is complex and can involve several procedures, including egg freezing, which 7% of women who needed fertility services said they received. Costs for a single course of IVF average between $9,000 and $14,000, and many people require multiple rounds. Insurance coverage of IVF is limited in private insurance and nearly non-existent for those covered by Medicaid, making it unaffordable for many people. Some grant programs are available to help offset costs, but they are limited and only reach a relatively small portion of people in need of services.

Artificial insemination, also known as Intrauterine insemination (IUI) is another fertility procedure that involves injecting sperm into the uterus. It is less invasive and less expensive than IVF, and some people choose it for those reasons.

In the wake of public outrage at the Alabama court ruling, politicians across parties have said they want to promote greater access to IVF, including former President Donald Trump who has said that he would provide access to full coverage of IVF costs if elected President through a mandate on insurance companies and federal funding. At the same time, a federal proposal to guarantee a right to IVF access across the country failed to pass in the U.S. Senate twice in 2024, with opposition from nearly all Republican members, including Vice Presidential Nominee JD Vance during the first IVF vote in June.

Among the One in Eight Reproductive Age Women Who Say They Ever Needed Fertility Assistance, 14% Report Receiving In Vitro Fertilization (IVF)

Smaller shares of women with lower incomes report receiving fertility services.

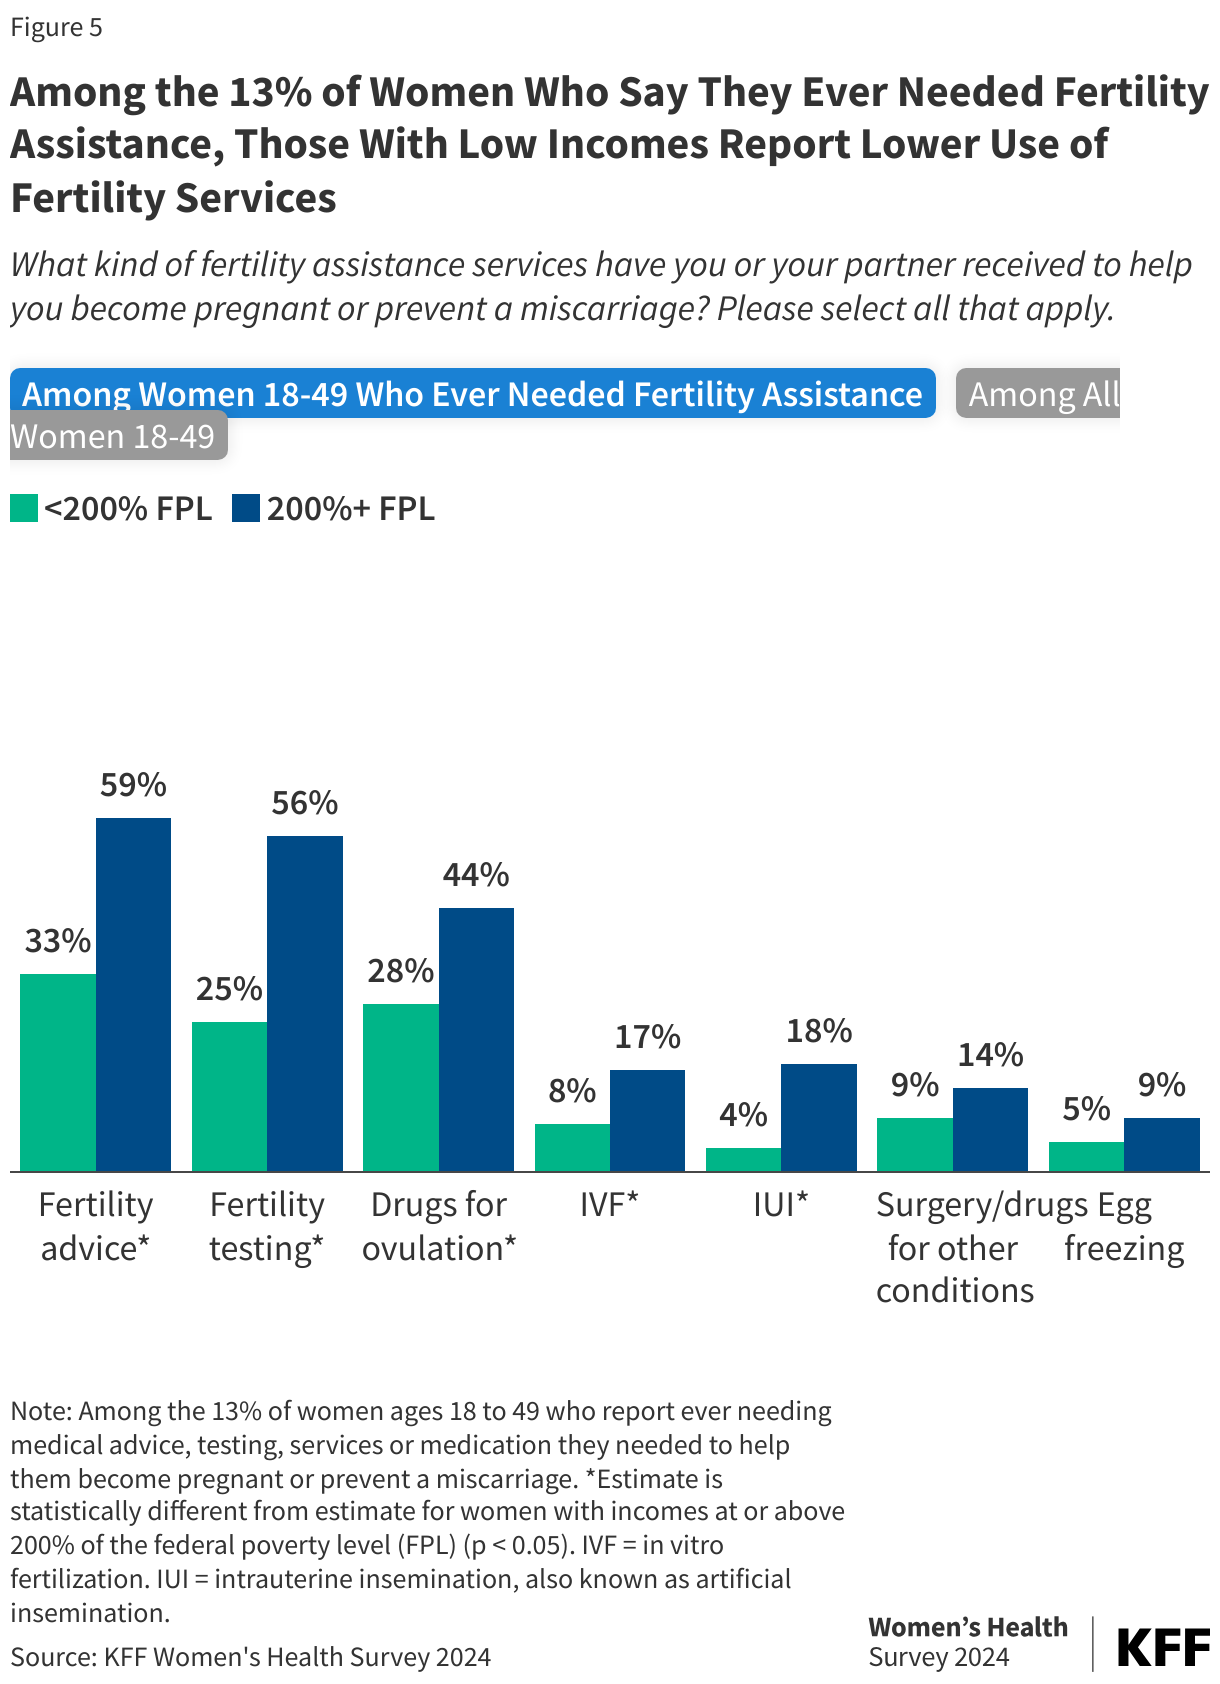
Fertility services can be very costly, and women with lower incomes report using many services at lower rates compared to those with higher incomes (Figure 5). Among the 13% of reproductive age women who needed fertility services, one-third of women with lower incomes say they received advice, compared to nearly six in ten women with higher incomes (59%). About one in four women with lower incomes who needed fertility services say that have used drugs for ovulation (28%) and testing services for themselves or a partner (25%), which is lower than women with higher incomes (44%and 56% respectively). Eight percent of women with low incomes who have ever needed fertility services say they received IVF, compared to 17% of women with higher incomes. Similarly, smaller shares of women with low incomes who needed fertility services (4%) report receiving IUI compared to those with higher incomes (18%).

Among the 13% of Women Who Say They Ever Needed Fertility Assistance, Those With Low Incomes Report Lower Use of Fertility Services

Women’s Perceptions on Access to Fertility Services

One-third of women ages 18 to 49 say it is difficult to access infertility services in their state.

One-third of women of reproductive age say it is difficult (32%) to access infertility services in their state. A smaller share say it is easy (19%), while almost half (48%) do not know, likely because 93% of this group (data not shown) say they have never needed such care. Notably, among women who say they have needed fertility care at some point, almost half (48%) characterize access as difficult (Figure 6).

About Half of Reproductive Age Women Who Have Needed Infertility Services Say it Is Difficult to Access in Their State

Cost stands out as the single largest barrier to fertility care, and across the board, access to the range of fertility services is lower among people with lower incomes. There are no federal requirements to cover fertility services in insurance plans. Some states have enacted fertility coverage requirements, but their reach is limited and piecemeal. Former President Trump has said that if elected, his administration would require full coverage for the costs of IVF, but this would not be possible without Congress passing a law. This seems unlikely given the two failed attempts to pass a law recognizing the right to IVF services.

Women's Access to and Use of Fertility Services, by Income Level

Gaps in Awareness of Insurance Requirements to Cover Preventive Services Among Women

Published: Oct 18, 2024

The Affordable Care Act (ACA) was passed over 14 years ago and yet, there are still gaps in awareness that federal law requires plans to cover the full cost of recommended preventive health care services, especially contraception.

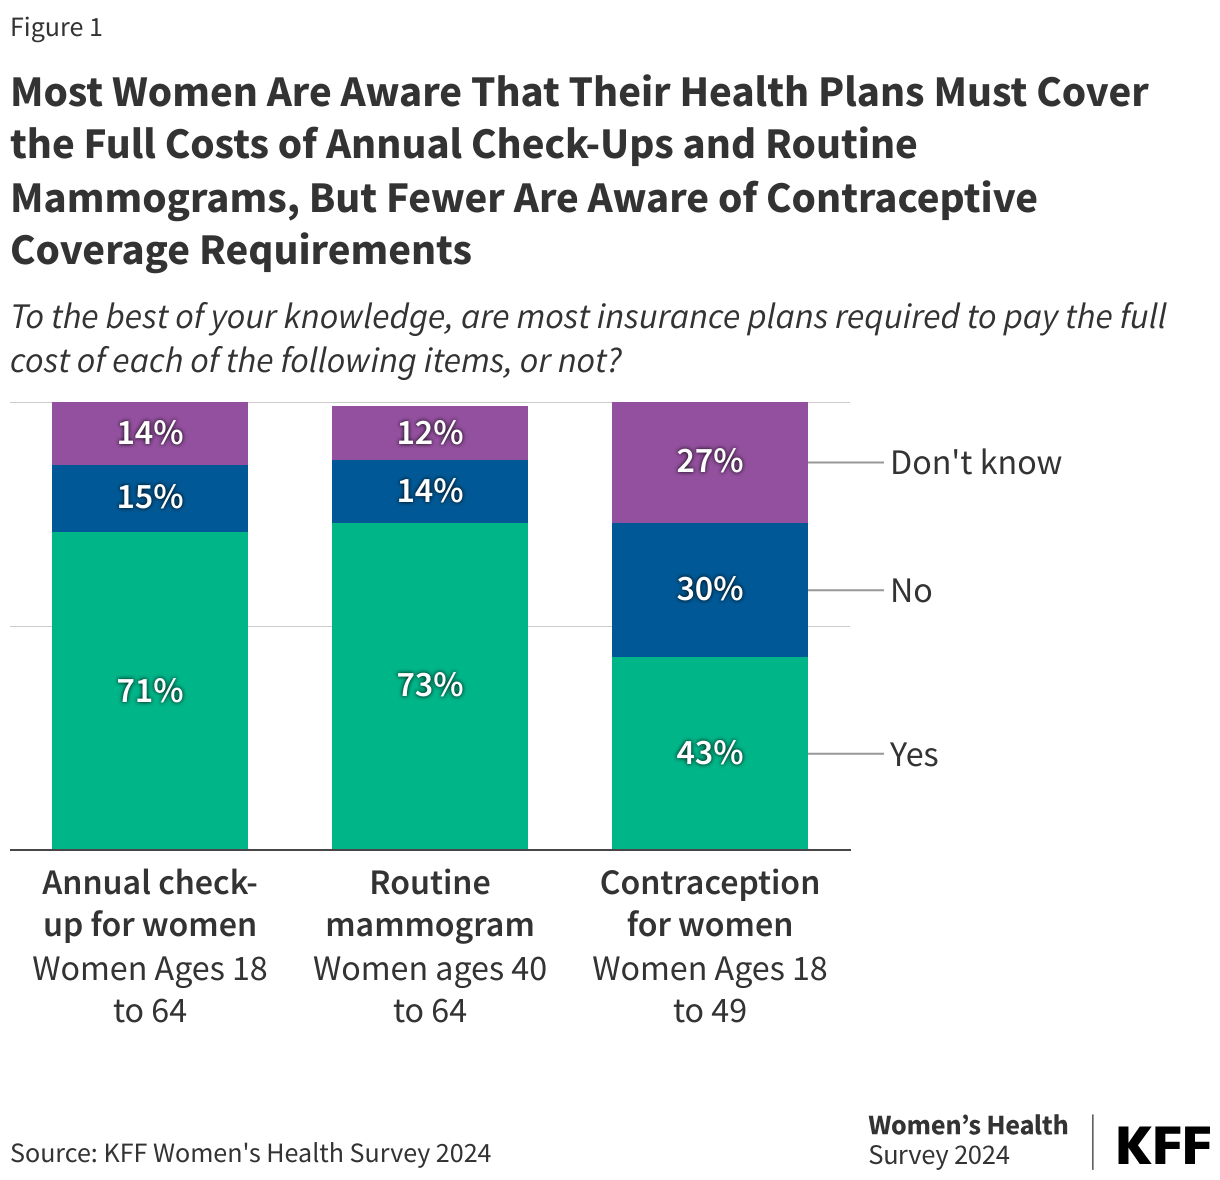
Under the ACA, most private health plans and Medicaid expansion programs must provide coverage with no cost-sharing for many recommended preventive services that are important to women, including female contraceptives, mammograms, and yearly checkup visits. After a decade of major debates over the future of the ACA, today large majorities across partisanship have a favorable opinion of this ACA policy. However, there have been several legal challenges contesting part or all of the ACA, including an ongoing lawsuit, Braidwood Management Inc. v. Becerra, that aims to eliminate the coverage requirement for certain preventive services. While large shares of women ages 18 to 64 (71%) are aware that the ACA’s preventive services requirements cover an annual check-up for women without cost-sharing, nearly three in ten (29%) women either don’t know or believe it does not. Awareness of the benefit is much lower among women ages 18 to 25 compared to women ages 50 to 64 (52% vs. 77%). Knowledge of the requirement to cover routine mammograms is high (73%) among women over the age of 40, but one in four (26%) are not aware (Figure 1).

Most Women Are Aware That Their Health Plans Must Cover the Full Costs of Annual Check-Ups and Routine Mammograms, But Fewer Are Aware of Contraceptive Coverage Requirements

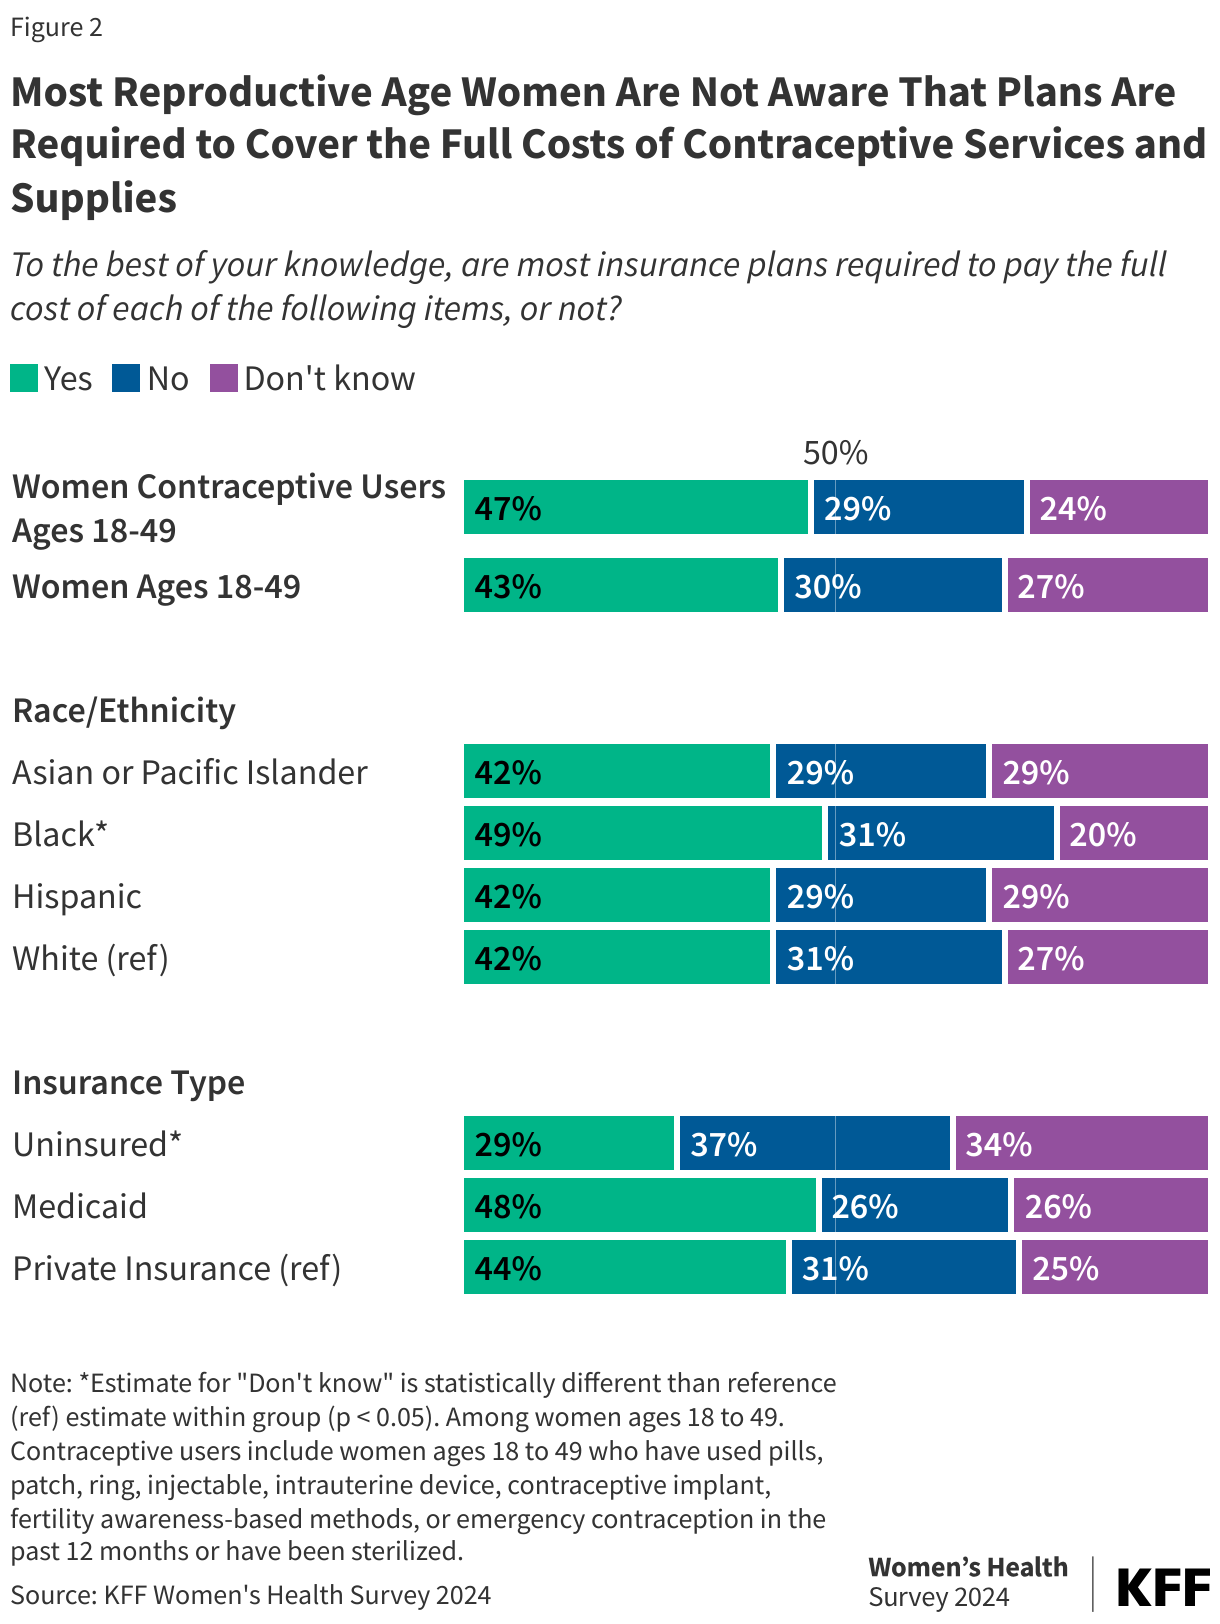
Even though most women use contraceptives, and plans are required to cover all FDA-approved prescription methods, less than half of reproductive age women (43%) and contraceptive users (47%) know that their insurance should cover the costs in full. Higher shares of Black women are aware of this requirement compared to White women (49% vs. 42%). Notably, less than half (44%) of women with private insurance coverage, for whom this requirement applies, are aware that most insurance plans are required to pay the full cost of birth control for women (Figure 2).

Most Reproductive Age Women Are Not Aware That Plans Are Required to Cover the Full Costs of Contraceptive Services and Supplies

It is possible that some women who are not aware of the contraceptive coverage requirement, have actually paid some out-of-pocket costs for their contraception. There have been a number of reports of people still paying out-of-pocket for their contraception, and recent Congressional investigations have found that some health insurers have continued to charge for contraception that is supposed to be covered in full. In response, the federal government continues to release guidance to clarify and reiterate the requirements for health plans.

Currently, all ACA preventive service requirements are in effect, however, the future is uncertain with legal challenges pending. Furthermore, the lack of knowledge of this benefit may result in fewer women accessing recommended preventive care.

Methodology

The 2024 KFF Women’s Health Survey was designed and analyzed by women’s health researchers at KFF. The survey was conducted from May 13 – June 18, 2024, online and by telephone among a nationally representative sample of 6,246 adults ages 18 to 64, including 3,901 women ages 18 to 49. Women include anyone who selected woman as their gender or who said they were non-binary transgender, or another gender and chose to answer the female set of questions about sexual and reproductive health.

Racial and Ethnic Health Disparities: Potential Implications of the Election

Published: Oct 17, 2024

Former President Trump and Vice President Harris have taken widely different stances and approaches on recognizing and addressing racial and ethnic disparities in health and health care. Former President Trump took executive action to prohibit federal agencies and contractors from providing training based on “divisive concepts” such as racism and sexism. As candidate, he has vowed to focus on “anti-White” racism, not racism against people of color. The Biden-Harris Administration has identified advancing racial equity as a federal priority, acknowledged that structural and systemic racism drive disparities, and recognized that social and economic factors play an important role in determining individuals’ health and well-being. Beyond these differences, variation in the candidates’ actions and proposals across different areas of health care, including health coverage, reproductive and maternal health, and immigrant health and well-being are likely to have important implications for future efforts to address health disparities as outlined below.

Health Coverage

Trump’s record as president included plans to repeal or weaken the Affordable Care Act (ACA) and cap and reduce federal Medicaid financing, while Vice President Harris has focused on efforts to “protect and strengthen Medicaid and the ACA.” Trump has said in the recent campaign that he’s not planning to repeal the ACA, though he has said he has “concepts” of a plan to replace it and would create a plan with “much better health care.” Although the Trump Administration never issued a detailed plan to replace the ACA, Trump’s budget proposals as president included plans to convert the ACA into a block grant to states, cap federal funding for Medicaid, and allow states to relax the ACA’s rules protecting people with preexisting conditions. Those plans, if enacted, would have reduced federal funding for health care by about $1 trillion over a decade, with trade-offs of higher out-of-pocket premiums for people, more uninsured, higher spending and greater risk for states, and restrictions in Medicaid eligibility. Under the Biden-Harris Administration, legislation was enacted that provided incentives for remaining non-expansion states to implement the ACA Medicaid expansion and provided enhanced subsidies for people to purchase Marketplace coverage. Harris has proposed making these enhanced subsidies permanent as they are currently set to expire at the end of 2025. Under the Biden-Harris Administration, there has been record ACA enrollment.

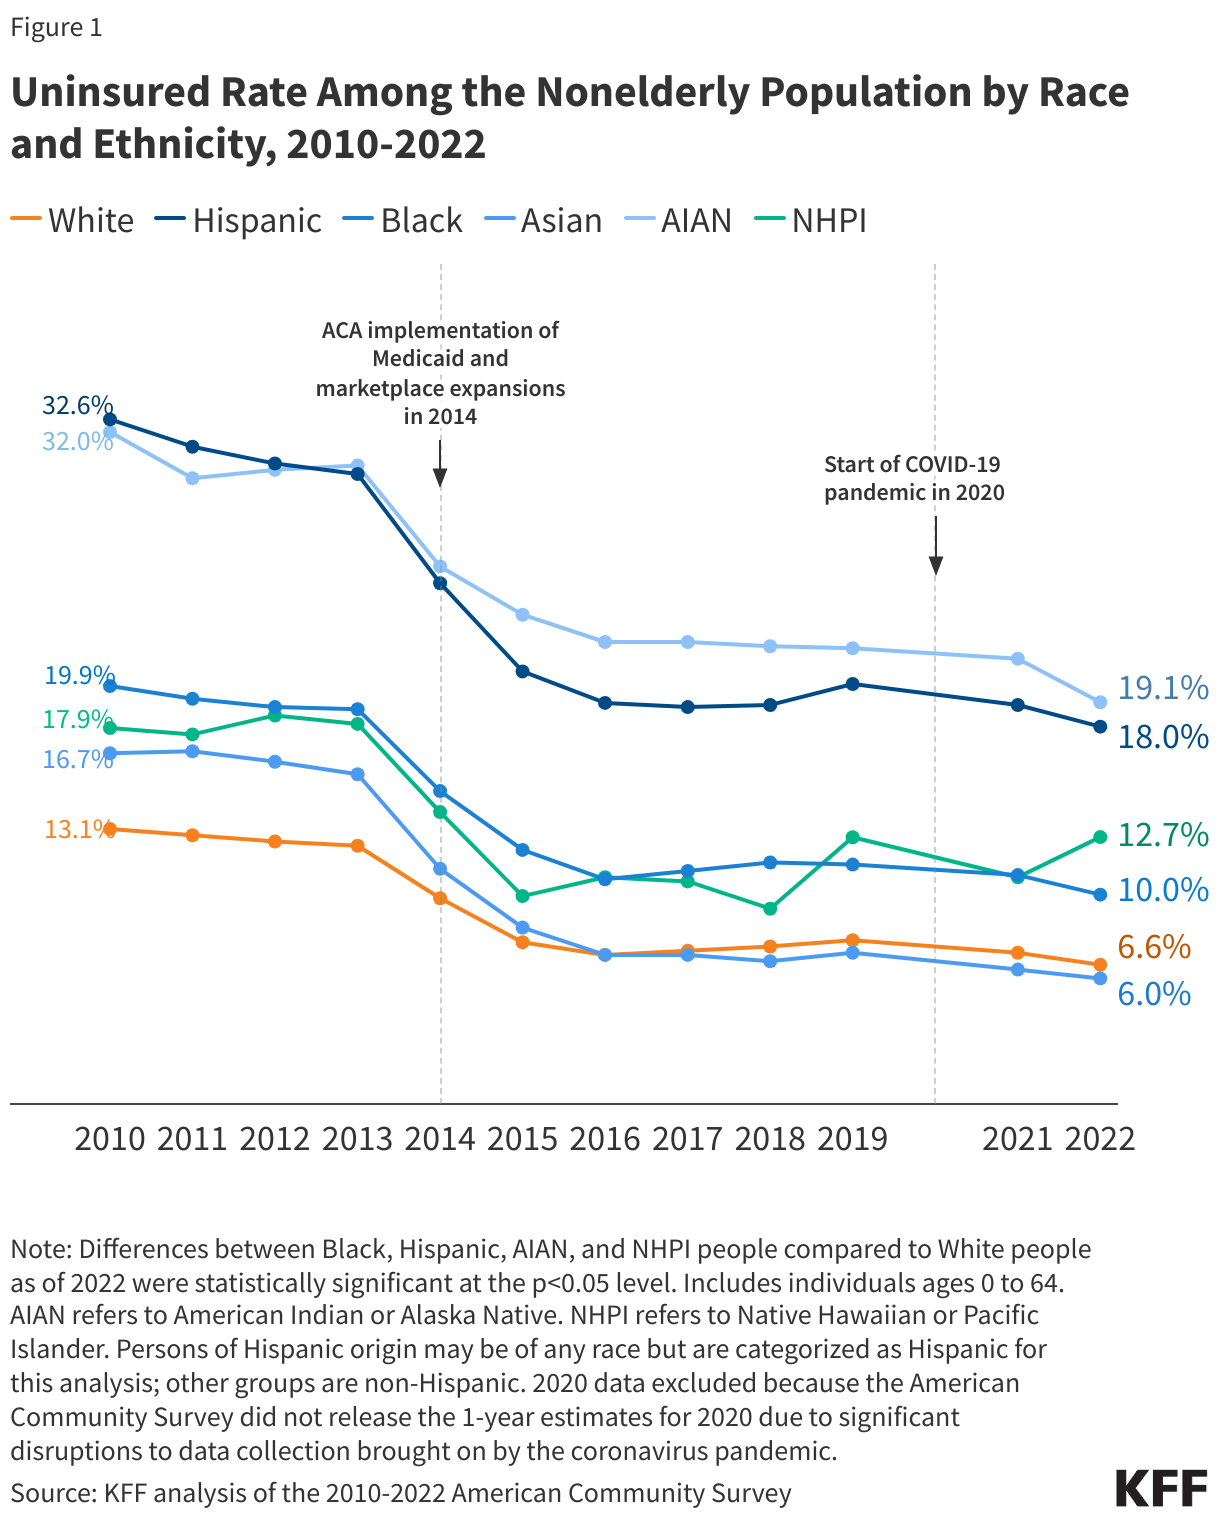
Future directions of ACA Marketplace and Medicaid coverage have important implications for racial and ethnic disparities in health coverage. Following the ACA health coverage expansions in 2014, there were large gains in coverage across racial and ethnic groups, which helped to narrow but not eliminate racial disparities in coverage (Figure 1). Continued efforts to increase access to coverage and improve continuity of coverage could further narrow these disparities. Conversely, coverage losses through the Marketplaces or Medicaid could reverse progress and widen disparities. Health coverage plays a key role in enabling people to access health care and protecting families from high medical costs.

Uninsured Rate Among the Nonelderly Population by Race and Ethnicity, 2010-2022

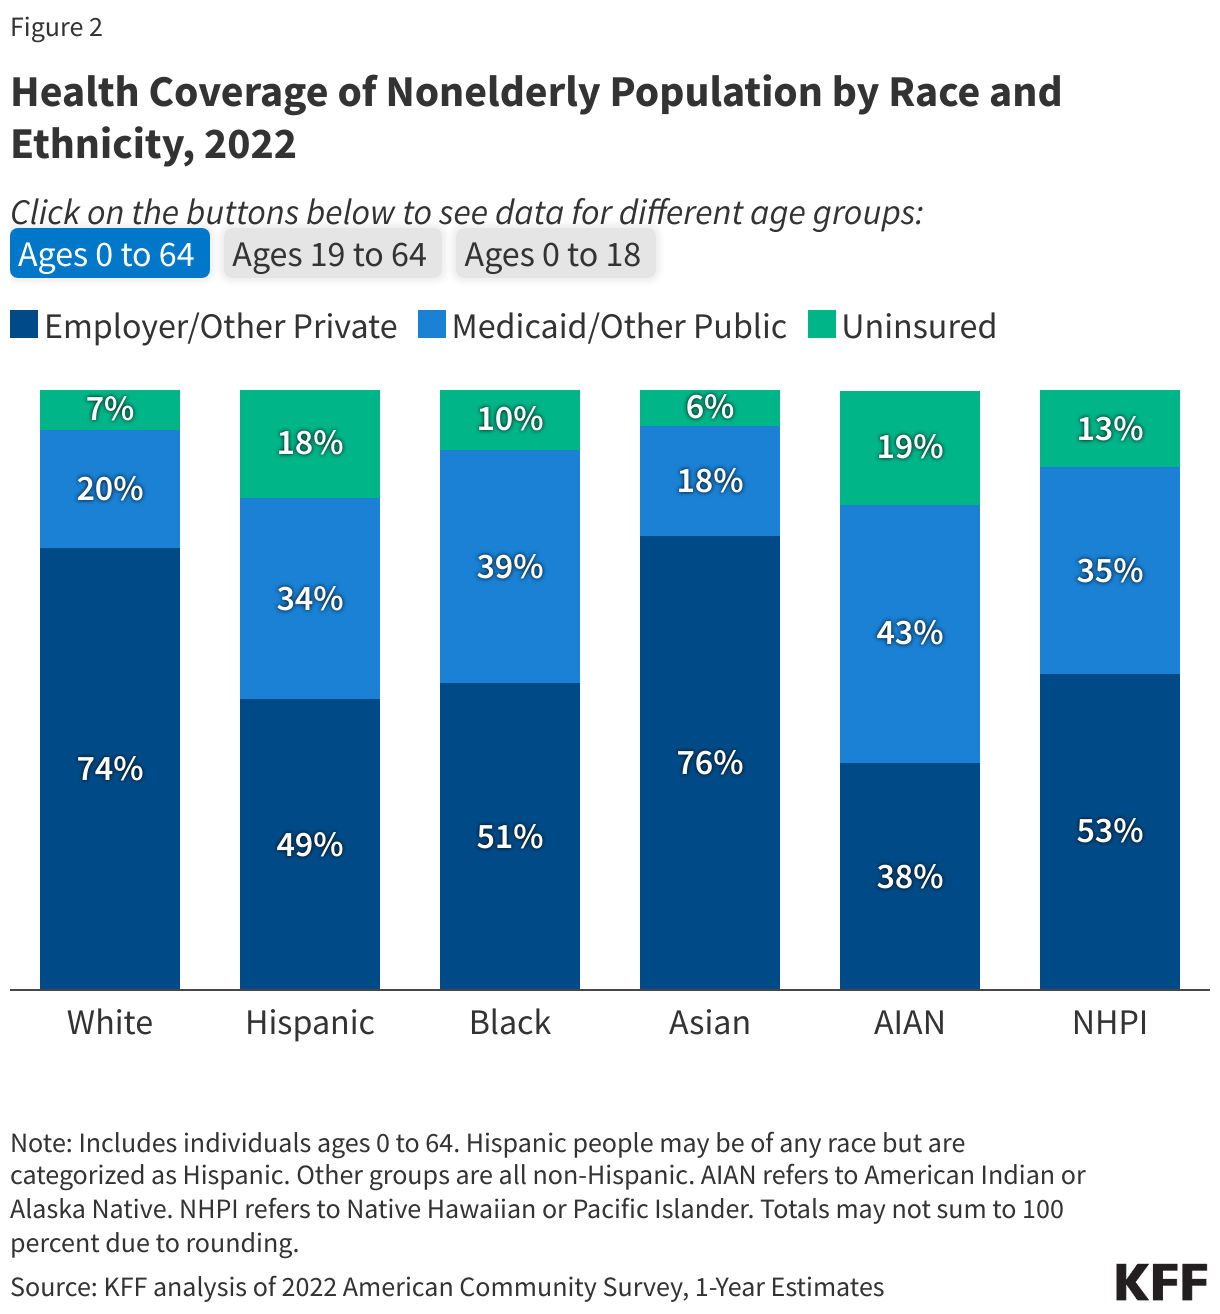
Changes to Medicaid may have particularly important implications for racial and ethnic health disparities given that it is a major source of health coverage for people of color. Medicaid helps to fill gaps in private coverage for many people of color, particularly children (Figure 2). Research suggests that ACA Medicaid expansion has contributed to a reduction in racial and ethnic disparities in health coverage. Adoption of the ACA Medicaid expansion in the remaining ten non-expansion states could continue to close coverage disparities. Nationally, over six in ten people in the coverage gap are people of color. Moreover, uninsured nonelderly Black people are more likely than White people to fall in the Medicaid “coverage gap” because a greater share live in states that have not implemented the Medicaid expansion.

Health Coverage of Nonelderly Population by Race and Ethnicity, 2022

Reproductive and Maternal Health

Vice President Harris has been and is an outspoken leader and advocate for reproductive freedom, while former President Trump has taken credit for the overturning of Roe v. Wade and has expressed support for letting states set their own abortion policy, including banning abortion. While abortion is the most prominent health care campaign issue, the election could also have large implications for contraceptive care and maternal health. Vice President Harris’ call for reproductive freedom includes access to contraception. The Trump Administration issued multiple regulations that restricted the availability of funding for contraception. During his campaign, he initially expressed that states could restrict access to contraceptives, but shortly afterwards, also said that he would not support this. As Senator, Vice President Harris sponsored the MOMNIBUS, a package of bills aimed at improving quality of and access to maternity care. Among other actions, under the Biden-Harris Administration, legislation was passed that allows states to extend Medicaid postpartum coverage from 60 days to 12 months. It also released a Maternal Health Blueprint that outlines future priorities. Former President Trump also issued a maternal health plan near the end of his term and signed federal legislation that provided funding for maternal mortality review committees.

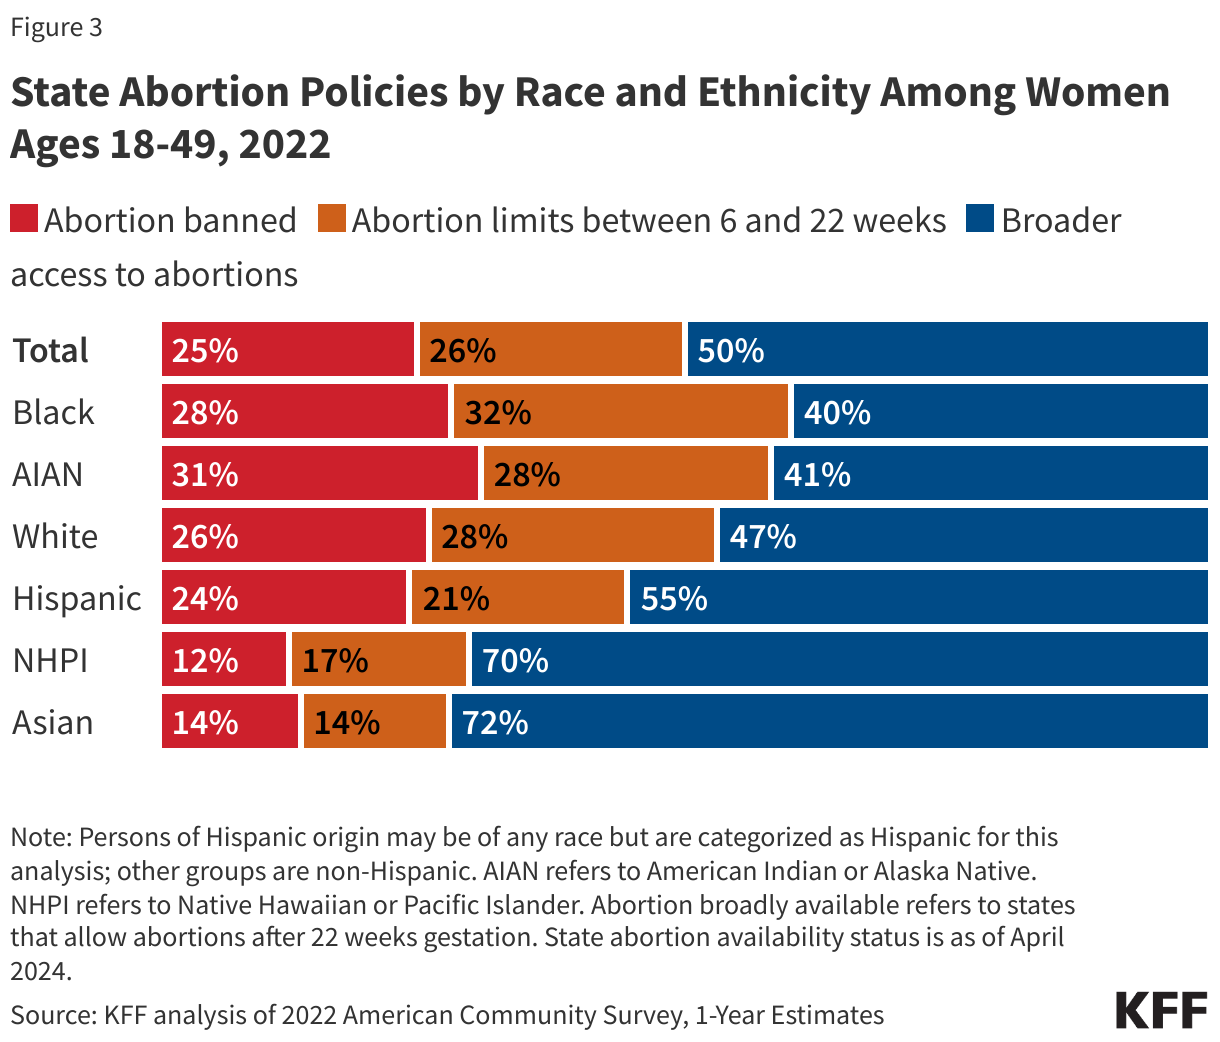
The outcome of the election may have important implications for abortion restrictions, which in turn, will likely impact racial and ethnic disparities in maternal health. Pregnancy-related mortality rates among American Indian and Alaska Native (AIAN) and Black women are over three times higher compared to White women. State restrictions on abortion in the wake of the overturning of Roe v. Wade may widen maternal health disparities. Six in ten Black and AIAN women of reproductive age live in states with bans or restrictions compared to just over half of their White counterparts (Figure 3). People of color also are more likely than their White counterparts to face structural barriers that make it difficult to travel out of state for an abortion.

State Abortion Policies by Race and Ethnicity Among Women Ages 18-49, 2022

Future directions of Medicaid coverage for pregnant women and family planning services as well as efforts to improve maternal health also may impact disparities. Medicaid covers about 4 in 10 births nationally, including more than two-thirds among Black and AIAN people. Nearly all states have implemented the option to extend postpartum coverage from 60 days to 12 months, facilitating more continuous coverage during this period. KFF research also has found that the ACA’s Medicaid expansion promotes continuity of coverage in both the prenatal and postpartum periods. Additionally, over half of the states have established programs that use Medicaid funds to cover the costs of family planning services for low-income women who remain uninsured, and Medicaid accounts for 75% of all publicly funded family planning. Moreover, many state Medicaid programs have implemented policies, programs, and initiatives to improve maternity care and outcomes, including expanding coverage for benefits such as doula care, home visits, and substance use disorder and mental health treatment; and using new payment, delivery, and performance measurement approaches.

Immigrant Health and Well-Being

As president and candidate, Trump pursued restrictive immigration policies and spread anti-immigrant rhetoric and misinformation; the Harris campaign has emphasized her tough on crime stance as a former attorney general of a border state and her support for stricter border security. During his presidential term, Trump implemented more restrictive enforcement policies, issued a proclamation suspending entry of immigrants into the United States unless they provided proof of health insurance, rescinded the Deferred Action for Childhood Arrivals (DACA) program, and made changes to public charge policies that newly considered the use of non-cash assistance programs, including Medicaid, to determine whether people could enter the U.S. On the campaign trail, he has promised to carry out the “largest domestic deportation” in American history and to end birthright citizenship for children of undocumented immigrants. He also has spread misinformation about immigrants, describing them as a source of crime, a burden for taxpayers, and a drain on government programs like Medicare and Social Security. The Biden-Harris Administration reversed the Trump Administration’s public charge changes and the proclamation that suspended entry of immigrants unless they provided proof of health insurance. It also extended Marketplace eligibility to DACA recipients in 2024.

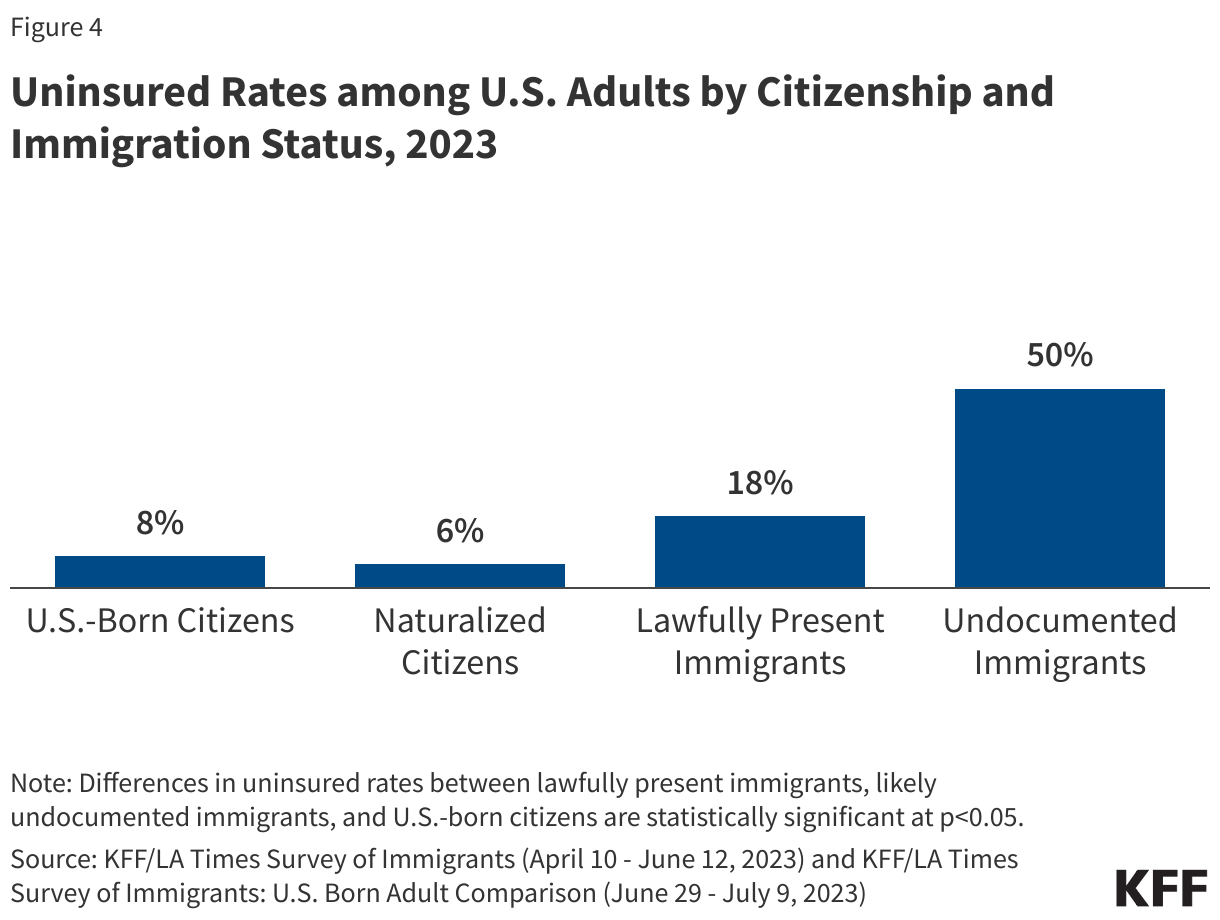
The future of immigration policies has important implications for the health and well-being of immigrants. Immigrants face large disparities in health and health care, including high uninsured rates, which reflect immigrant eligibility restrictions on health coverage programs funded by the federal government (Figure 4). Undocumented immigrants are prohibited from accessing federally funded programs, including Medicaid, Medicare, and the ACA Marketplaces, while many lawfully present immigrants are not eligible for these programs when they first arrive to the U.S. They also face barriers to care, including language access challenges, confusion about eligibility for health coverage and other public programs, and immigration-related fears. Earlier KFF analysis found that the policies and actions taken under the Trump Administration increased these fears, making immigrants more reluctant to access health coverage and care. Overall, research shows that immigrants use less health care and have lower health care costs than their U.S.-born counterparts, reflecting that they are younger and healthier and that they face greater barriers to care. Data also show that undocumented immigrants contribute billions in federal, state, and local taxes, with a sizeable share going toward programs that they cannot access, like Social Security and Medicare, and that they help subsidize health care for U.S.-born citizens

Uninsured Rates among U.S. Adults by Citizenship and Immigration Status, 2023

Understanding the Inequitable Impacts of Hurricanes and Other Natural Disasters in the Wake of Hurricanes Helene and Milton

Authors: Nambi Ndugga, Drishti Pillai, and Samantha Artiga
Published: Oct 16, 2024

Extreme weather events used to be once in a century occurrences, but due to climate change, they have increased in both intensity and frequency. Hurricane Helene has claimed over 200 lives and is the deadliest hurricane to hit the continental U.S. since Hurricane Katrina. It is also projected to be one of the most expensive storms to hit the country. Hurricane Milton is one of the worst storms to hit Florida in over 100 years. The Biden-Harris Administration has mobilized resources to support the Federal Emergency Management Agency (FEMA), the Department of Defense and efforts to provide emergency assistance to families. At the same time, FEMA is facing ongoing misinformation and disinformation that may hamper response efforts. Amid recovery and response efforts, it’s important to recognize that hurricanes and other natural disasters have far-reaching impacts on health and well-being in their immediate aftermath and over the long-term. These impacts are uneven, with many groups who already face disparities in health and health care bearing the brunt of storms and other disasters. The uneven impacts reflect disparities in people’s risk of exposure to natural disasters; their ability to prepare for, evacuate from, and to recover from a natural disaster; and long-term impacts as discussed below.

Many of the same factors that contribute to health inequities leave some communities at higher risk of experiencing a natural disaster. Low income communities and communities of color are on the front lines of natural disasters and climate change. Due to historical residential segregation including redlining, people of color are more likely to live in neighborhoods that have worse infrastructure increasing their risk of harm and limiting their ability to prepare or safely shelter-in-place. In most states, homes in formerly redlined neighborhoods are more likely to be in flood zones, however in Florida more blue- and greenlined “desirable” neighborhoods have a higher risk of flooding due to proximity to the beach. Data on patterns of flooding associated with Hurricanes Helene and Milton are not yet available. Rural communities face challenges responding to natural disasters, ranging from physical isolation, high poverty rates, and limited access to health care as well as limited financial capacity.

The Southeast region of the U.S. is particularly vulnerable to severe tropical storms due to climate change, and its persistently high poverty rates inhibit residents’ ability to prepare for and recover from storms. Further, many of the states in the Southeast have not implemented the ACA Medicaid expansion, leaving lower income residents in those states with more limited access to health care, which may contribute to challenges addressing both immediate and longer term health needs. A significant proportion of people of color live in the South, with more than half of Black people residing in Southern states. Moreover, one study finds that Black communities are about twice as likely as other communities in the Southeast to experience a hurricane. It is estimated that, by 2050, homes owned by Black people in this region will be nearly twice as likely to be damaged by hurricanes compared to other communities.

Evacuation efforts for storms have highlighted disparities in peoples’ abilities to prepare for and evacuate in advance of major storms. About half of immigrants have limited English proficiency (LEP) and may face language barriers accessing evacuation and preparation resources. When Hurricane Beryl tore through Houston in 2024, significant portions of the city’s community with LEP felt unprepared as most emergency resources were written in Spanish and English but not other languages spoken by a large number of residents. Low-income communities, many of whom are people of color, are more likely to face financial challenges in preparing for natural disasters. A survey of Hurricane Harvey evacuees finds that people who evacuated spent on average between $1,200 to $2,300, accounting for lodging, transportation, food, and lost income.

There are also gaps in federal disaster management and response efforts. Research finds that recovery efforts are often inequitably distributed and favor White and wealthier communities over lower income communities and communities of color. In a KFF survey of Texas Gulf residents affected by Hurricane Harvey, six in ten affected Black residents reported feeling like they were not getting the help they needed to recover compared to a third of affected White residents. Further, a federal report finds that there were disparities in response efforts to Hurricane Harvey in Texas and Hurricane Maria in Puerto Rico, with Hurricane Harvey survivors receiving more aid faster compared to survivors of Hurricane Maria. The report also cited language barriers as a major issue that contributed to delays in people receiving aid and recovery support. Noncitizen immigrants are less likely to access recovery assistance programs than citizens, reflecting eligibility restrictions, immigration-related fears, and language barriers.

The impacts of hurricanes and other natural disasters are long-lasting. Research finds that hurricanes contribute to excess mortality years after they have passed, with Black people generally experiencing higher cumulative excess deaths compared to their White counterparts. In addition, major storms can increase the risk of illness and injury, disrupt infrastructure, and negatively impact the economy. For example, Hurricane Helene’s damage to a key manufacturer of IV solutions in North Carolina has led to a temporary supply disruption that will affect the broader U.S. medical system. Damage to infrastructure caused by storms can also compromise emergency response efforts, limit access to basic needs, and disrupt access to necessary health care and prescription medications. Storms can also have long-lasting mental health impacts. Data from a KFF survey of New Orleans residents who lived in the area during Katrina reported lingering stress and problems with their mental health due to the hurricane, ten years after the storm.

The federal government has taken steps to advance climate change adaptation and promote risk reduction and community resilience. For example, the Building Resilient Infrastructure and Communities initiative supports states, local governments, Tribes, and territories in designing projects to strengthen infrastructure and minimize risks before disasters occur. FEMA has developed a National Risk Index to identify locations most at risk for 18 natural hazards, adopted climate resilience building standards, and dedicated funding to support communities at risk for climate-related extreme weather events and other natural disasters. Research suggests that efforts at the local, state, Tribal, and federal levels are key to adapting to and mitigating the worsening impacts of climate change.

The Opportunities and Realities of Citizen-Initiated State Ballot Abortion Measures

Authors: Mabel Felix, Laurie Sobel, and Alina Salganicoff
Published: Oct 16, 2024

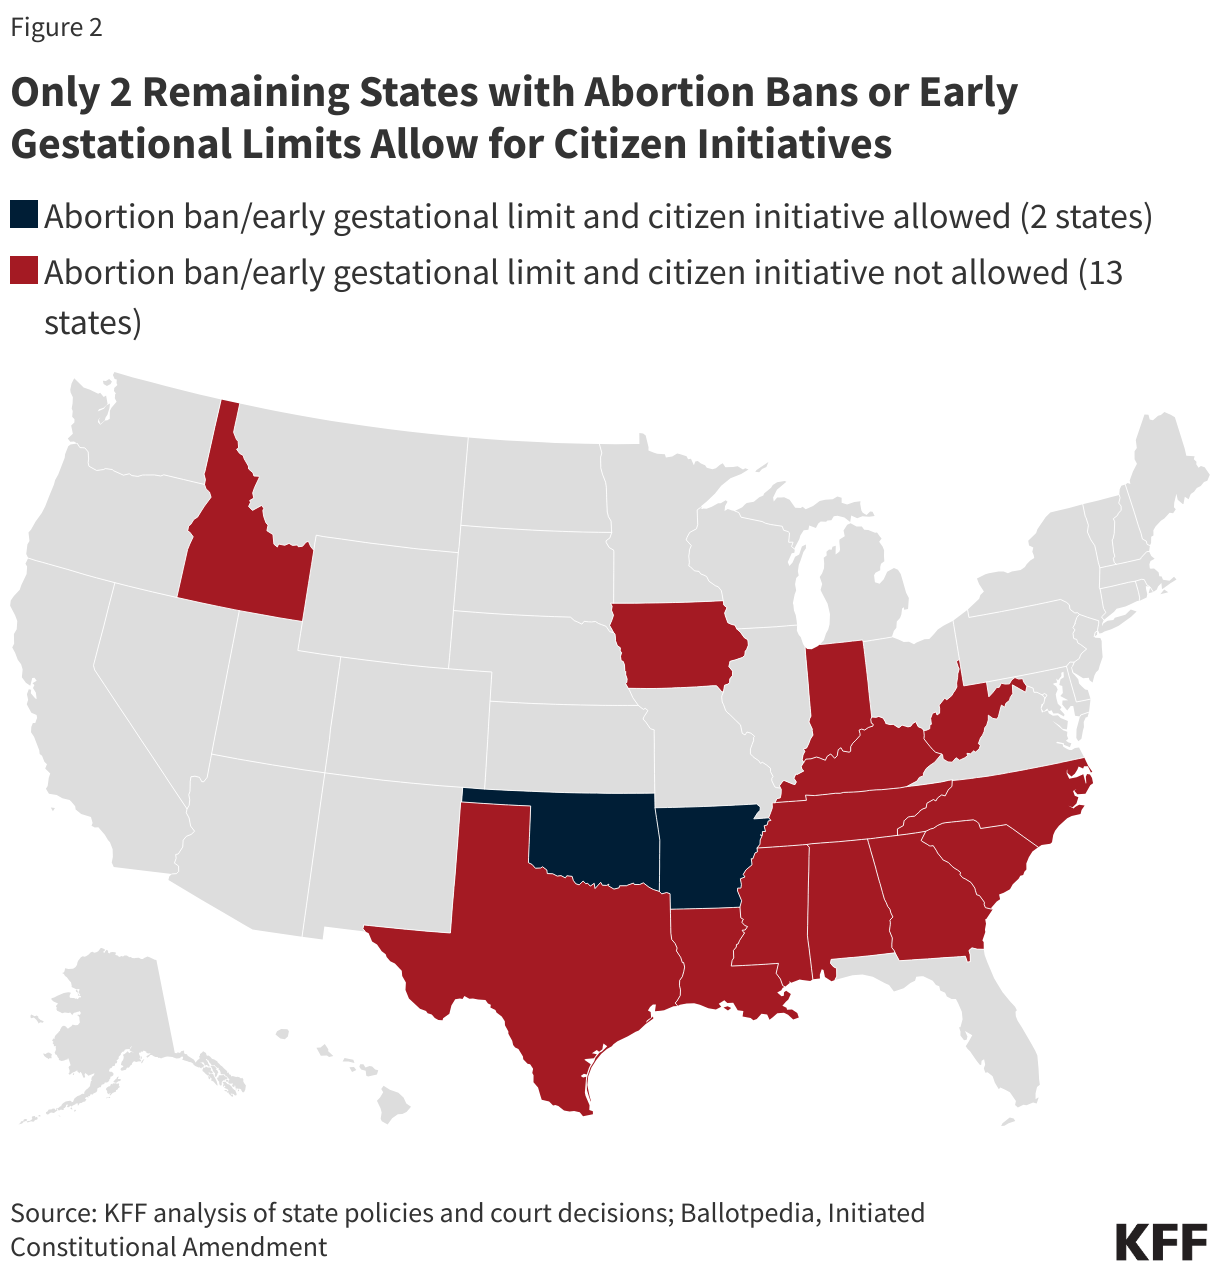
In its Dobbs decision, the Supreme Court wrote that it was returning the decision to restrict or protect abortion “to the people and their elected representatives.” Presidential candidate Trump claims credit for this decision and says that as a result, the “states are voting.” States are making decisions on abortion policy, but it’s mostly been state legislatures and state courts, not the voters, who have weighed in. Few states with abortion bans have a process for citizen-initiated constitutional amendments, including those that would protect the right to abortion. In this current election cycle, in those states, anti-abortion lawmakers and activists have utilized many different strategies in their efforts to block abortion measures from qualifying for the ballot or put roadblocks in their place.

The Challenging Path to the Ballot

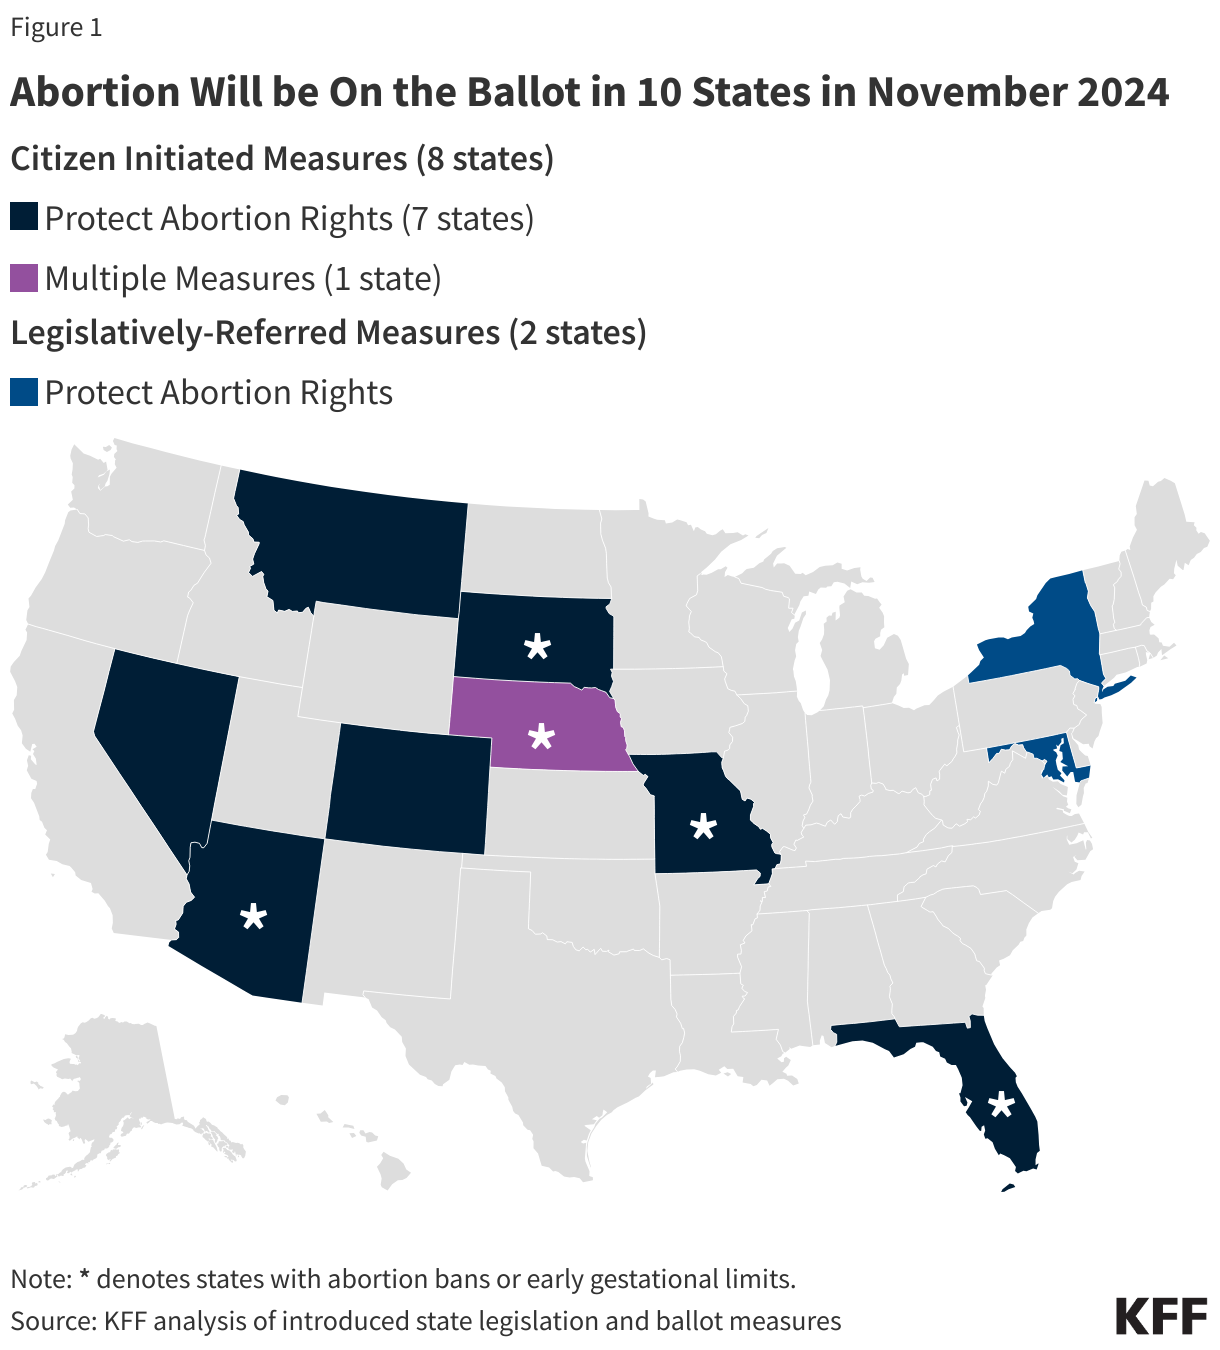
Overall, a total of 10 states will vote on abortion measures this November; eight initiated by citizens and two referred by the legislature (Figure 1). Citizen-initiated ballot measures to amend a state’s constitution provide a direct pathway for the electorate to decide whether or not abortion should be legal in their state, regardless of how their elected representatives have approached abortion policy. This pathway is open only in 17 states. While there are a total of 10 states with abortion measures on the November ballot, (Figure 1), voters in five of these states will be voting on whether to invalidate their state’s abortion ban or early gestational restriction.

Abortion Will be On the Ballot in 10 States in November 2024

The stakes of having an abortion measure on the ballot are high for abortion rights supporters and opponents because every time abortion has been placed on the ballot since the Dobbs decision, the side favoring abortion has won. In states with abortion bans or restrictions and a process for citizens to propose constitutional amendments, lawmakers and anti-abortion activists have tried to hamper attempts to place measures on the ballot in a number of ways.

  • In Arizona, an anti-abortion group asked the court to remove the measure from the ballot, arguing that the language available to petition signers did not correctly convey the measure’s impact.
  • In challenges to the proposed abortion amendments in Nebraska and Missouri, opponents argued that the proposals violate the states’ rules that measures pertain to only one subject matter. In Missouri they also argued the petition did not specify which laws and constitutional provisions would be repealed if the amendment were approved by voters. The supreme courts of these states rejected these arguments and allowed the measures to remain on the ballot.
  • In South Dakota, a challenge seeking to disqualify the abortion ballot measure will not reach its conclusion before voters cast their ballots leaving open the possibility that the measure could be invalidated while votes are being cast. A trial at a county court will begin after early voting has commenced to determine the validity of the signatures collected. While voters will cast their votes for this constitutional amendment, if the state supreme court invalidates it, the constitution will not be amended even if the measure receives enough votes to pass.

Moving Goal Posts

  • In 2023, the Arkansas legislature passed a law requiring that constitutional amendment petitions obtain signatures from 50 of 75 counties in the state (up from the previous requirement of 15 counties).
  • Lawmakers in Florida, Missouri, and Oklahoma have introduced legislation to increase the percentage of the vote needed for constitutional amendment measures to pass, but none of these bills passed.
  • In 2023, ahead of an election where voters would weigh in on a constitutional amendment to protect the right to abortion, Ohio lawmakers placed a measure on the August ballot that would have increased the percentage of the vote needed for a Constitutional amendment ballot measure to pass from a simple majority to 60% and that would have increased the required number of counties from which campaigns need to gather signatures from 44 counties to all 88 in the state. Voters rejected the measure to raise the threshold and, in the November 2023 election, 57% of voters approved the abortion rights measure.
  • In 2022, the Arkansas legislature placed a constitutional amendment on the ballot that would have increased the percentage of the vote needed for ballot measures to pass to 60% (up from a simple majority), but as in Ohio, voters in Arkansas rejected the measure.
  • Similar approaches have been adopted in North Dakota and Arizona where this November, voters will cast their ballots on measures that would make it more difficult to get a citizen-initiated constitutional amendment on the ballot.

Using Biased Language in Ballot Materials

  • The Missouri Secretary of State drafted an incorrect summary of the measure for display at polling centers that would have stated the measure “will prohibit any regulation of abortion, including regulations designed to protect women undergoing abortions and prohibit any civil or criminal recourse against anyone who performs an abortion and hurts or kills the pregnant women.” Proponents of the measure filed a challenge against this summary and a judge struck it down and replaced it with an unbiased description.
  • In Arizona, the Republican-majority legislative council wrote an official ballot measure summary describing fetuses as “unborn human being[s],” which was initially blocked by a lower court, but ultimately upheld by the Arizona Supreme Court.
  • The Florida official financial impact statement for the ballot contains information unrelated to the financial impact of the amendment and speculates about future litigation on reproductive care, falsely implying that the amendment will block the state’s parental consent requirement.

Proposing Competing Initiatives

  • Months after Nebraska’s Protect the Right to Abortion constitutional initiative – which would protect the right to abortion up to viability – had been filed with the Nebraska Secretary of State, anti-abortion advocates introduced competing initiatives. The first, which did not receive enough signatures to appear on the ballot, would have amended the state constitution to define fetuses as persons. The second measure, which will appear on the November ballot, would amend the constitution to ban abortion after the first trimester. If the measure banning abortion after the first trimester and the measure protecting a right to abortion up to viability both pass, the one with most votes would be adopted.

Invalidating Signatures

  • After signatures for the proposed abortion measure were submitted, the Montana Secretary of State changed the rules for determination of acceptable signatures, reclassifying some registered voters as “inactive” and making these signatures unacceptable to be counted toward the total. Proponents of the measure sued to block these changes and won the case, allowing the signatures of newly deemed “inactive” voters to be counted.
  • The Arkansas Secretary of State refused to qualify a proposed measure that would have protected the right to abortion up to 20 weeks LMP, citing lack of compliance regarding paid signature gatherers. This decision was appealed by ballot measured proponents, but the Arkansas Supreme Court upheld this decision, and the initiative failed to make it to the voters.

Citizen-initiated campaigns to amend a state’s constitution can be very costly, especially when litigation is involved. When proponents of these amendments are blocked from placing them on the ballot after months of gathering signatures and campaigning, starting over again may not be financially feasible. It could be difficult to find anew the kind of financial support these petitions need to succeed and in the intervening time, the state legislature could change the rules for citizen initiatives to make amending the constitution even more difficult.

The Wording of the Constitutional Amendment Matters

Even when abortion rights measures pass, some abortion restrictions may remain, making the language of the constitutional amendment and how the state supreme court interprets it an additional important factor in shaping abortion access in the state. For instance, although the 2023 Ohio Reproductive Freedom Amendment prohibits any state laws that “burden, penalize, prohibit, interfere with or discriminate” against abortion care and abortion providers, Ohio laws limiting state Medicaid coverage of abortion, requiring parental consent, and a 22-week LMP gestational limit are still in effect. A state trial court recently blocked Ohio laws that had required a 24-hour waiting period, two in-person visits, and the state-mandated information before providing an abortion, ruling that these laws violate the Reproductive Freedom Amendment. However, this case has been appealed and the ultimate decision rests with the state’s supreme court, which currently has a 4-3 Republican majority. The court could change after the November election in which 3 seats are being contested. However, many voters are not knowledgeable about their state supreme court judges or their positions on abortion. There are 18 states holding elections for their supreme court this year. Two states (Ohio and Michigan) could see a partisan majority flip as a result of this election and other states that have nonpartisan races could also see an ideological shift in their supreme court as a result of the election.

Citizen-Proposed Constitutional Amendments Not an Option in Many States Where Abortion is Banned

Only 2 Remaining States with Abortion Bans or Early Gestational Limits Allow for Citizen Initiatives

Thirteen states with abortion bans or earlier gestational limits do not have a citizen initiative process to amend their constitutions. In these states, citizens cannot directly vote on their state abortion laws beyond electing legislators that support abortion rights or relying on changes in the ideological orientation of their state Supreme Courts. In some of these states, citizens may file legal challenges against abortion laws in hopes that the state supreme court will invalidate them and interpret the state constitution as protective of the right to abortion. However, the South Carolina, Idaho, and Iowa state supreme courts have recently ruled that there is no right to abortion and three states – Louisiana, Tennessee, and West Virginia – amended their state constitution to explicitly state it does not protect a right to abortion.

The 2024 election could be unique in its impact on state abortion laws. If all the measures protecting abortion pass this November, the only remaining states that allow citizen initiatives and ban abortion will be Oklahoma, and Arkansas. Citizen initiatives are also permitted in North Dakota, where a lower court recently struck down the state’s abortion ban. If the Supreme Court of North Dakota reverses the lower court’s ruling, proponents of abortion rights could try to place a constitutional amendment on a ballot at a future date.

The U.S. Government and Global Health

Published: Oct 15, 2024

This fact sheet does not reflect recent changes that have been implemented by the Trump administration, including a foreign aid review and restructuring. For more information, see KFF’s Overview of President Trump’s Executive Actions on Global Health.

Key Facts

  • U.S. government (U.S.) global health efforts aim to help improve the health of people in low- and middle-income countries while also contributing to broader U.S. global development goals, foreign policy priorities, and national security concerns.
  • The U.S. has been engaged in international health activities for more than a century and today is the largest funder and implementer of global health programs worldwide.
  • Many different U.S. government departments and agencies, congressional committees, and funding streams are involved in these efforts.
  • Through both bilateral programs and multilateral engagement, the U.S. supports activities that address a range of global health challenges (including but not limited to HIV, malaria, family planning and reproductive health, maternal and child health, and global health security) in approximately 80 countries.
  • Total U.S. global health funding through regular appropriations was approximately $12.3 billion in FY 2024, up from $5.4 billion in FY 2006; additionally, supplemental funding has been provided in response to emergencies, such as Ebola, Zika, and the COVID-19 pandemic, in certain years.

Why Is the U.S. Engaged in Global Health?

U.S. global health efforts aim to help improve the health of people in developing countries while also contributing to broader U.S. global development goals (e.g., advancing a free, peaceful, and prosperous world), foreign policy priorities (e.g., promoting democratic institutions, upholding universal values, and promoting human dignity), and national security concerns (e.g., protecting Americans from external threats, sustaining a stable and open international system).1  For these reasons, the U.S. government has been engaged in international health activities for more than a century and today is the largest funder and implementer of global health programs worldwide. The U.S. global health response – a key component of the U.S. international development portfolio, accounting for about 17% of the international affairs budget2  – is a multi-pronged, multi-billion dollar investment that targets a myriad of global health challenges, countries, and stakeholders. Efforts involve many different U.S. government departments and agencies, congressional committees, and funding streams.

What Is the U.S. Role?

The U.S. role in global health is multifaceted. The U.S. government:

  • acts as a donor by providing financial and other health-related development assistance (e.g., commodities, like contraceptives, or bed nets for protection from disease-carrying mosquitoes) to low- and middle-income countries;
  • operates programs and delivers health services;
  • provides technical assistance and other capacity-building support;
  • participates in major international health organizations through global health diplomacy and other efforts;
  • conducts research;
  • supports international responses to disasters and other emergencies; and
  • partners with governments, non-governmental groups, and the private sector.

What Agencies and Departments Are Involved?

The U.S. engagement in global health is largely carried out by executive branch departments and agencies (see organization chart below), but the legislative branch also plays an important role.

This figure is a visual representation of the "Organization of U.S. Global Health Efforts." It is seperated between Congress and the White House (which branches off into USAID, State, and HHS).


Executive Branch

Day-to-day, U.S. global health activities are administered through arms of the government, including: the White House through its National Security Council (NSC), which acts to coordinate national security and foreign policy decisions across federal agencies, with staff focused on development, global health, and humanitarian response as well as global health security and biodefense, along with the White House’s Office of Pandemic Preparedness and Response Policy (OPPR) and Office of Science and Technology Policy (OSTP); the Department of State through its new Bureau for Global Health Security and Diplomacy (GHSD), which coordinates the Department’s work on global health security and HIV, including PEPFAR, as well as provides diplomatic support (through U.S. Ambassadors and others) in implementing U.S. global health efforts; the U.S. Agency for International Development (USAID), which leads U.S. international development assistance and implements U.S. global health programs including through its Bureau for Global Health; and Department of Health and Human Services (HHS) operating divisions, particularly the Centers for Disease Control and Prevention (CDC), which works to prevent, detect, and respond to disease threats around the world including through its Center for Global Health, and the National Institutes of Health (NIH), which conducts behavioral and biomedical science research, including global health research, on diseases and is the largest public funder of biomedical research in the world. Additionally, the HHS Office of Global Affairs leads the department’s engagement with bilateral and multilateral partners.

Legislative Branch

Congress introduces, considers, and passes global health-related legislation; oversees global health efforts; authorizes and appropriates funding; and confirms presidential appointees to key U.S. global health positions. See the KFF primer on Congress and global health.

What Types of Efforts Are Supported?3 

The U.S. government supports a wide array of bilateral and multilateral global health efforts in countries around the world, partnering with numerous community and private sector organizations, as well as other governments and international and multilateral organizations, to carry out its global health activities:

Bilateral Efforts

U.S. bilateral (two-party; country-to-country; U.S. support that is for the benefit of another country and is provided to a government, NGO, or other group for this purpose) programs provide direct support to approximately 80 low- and middle-income countries and typically operate in a particular set of countries with their own budgets, staff, strategies, objectives, and monitoring and evaluation practices; they often involve multiple U.S. agencies/departments.4  See “What Are the Major Programs?” below.

Multilateral Efforts

U.S. support for multilateral (multi-country, usually through an international organization involving or supported by multiple governments; U.S. support provided to a multilateral organization is channeled to support programs in or benefitting other countries) global health efforts includes:

  • making financial contributions to international organizations (e.g., Gavi, the Vaccine Alliance [Gavi], and the Global Fund to Fight AIDS, Tuberculosis and Malaria [the Global Fund]) and United Nations agencies (e.g., the United Nations Children’s Fund [UNICEF]);
  • serving as a member-nation of large multilateral health organizations (e.g., the World Health Organization [WHO] – see the KFF fact sheet);
  • participating in multilateral governance (e.g., as a Board member of an organization);
  • serving as signatory to international health standards, treaties, and agreements;
  • providing technical assistance to international organizations; and
  • providing additional staff capacity to international organizations (by detailing U.S. government employees to these organizations for periods of time).

What Are the Major Programs?

HIV/PEPFAR

While the U.S. first provided funding to address the emerging global HIV epidemic in 1986, funding and attention has increased significantly in the last decade, particularly following the 2003 announcement of the President’s Emergency Plan for AIDS Relief (PEPFAR) by President Bush. PEPFAR’s launch led to a major increase in U.S. support for HIV prevention, treatment, and care efforts, as well as contributions to the Global Fund, the Joint United Nations Programme on HIV/AIDS (UNAIDS), and the International AIDS Vaccine Initiative (IAVI). The Department of State’s U.S. Global AIDS Coordinator oversees this government-wide effort, which is implemented by USAID, CDC, and other agencies.5  See the KFF fact sheet on the global HIV/AIDS epidemic, the KFF fact sheet on U.S. PEPFAR efforts, and the KFF fact sheet on the U.S. and the Global Fund.

Tuberculosis (TB)

USAID began its global TB control program in 1998, and since that time, the U.S. response has grown, particularly expanding after 2003 when the U.S. government’s commitment to addressing TB was highlighted as part of PEPFAR. Today, led by USAID and implemented by and involving several agencies, U.S. TB efforts focus on diagnosis, treatment, and control of TB (including multi-drug resistant and extensively drug-resistant TB [MDR/XDR TB]) and on research. The U.S. is also a donor to the Global Drug Facility of the Stop TB Partnership, a global network of public and private entities working to eliminate TB.6  See the KFF fact sheet on U.S. TB efforts.

Malaria/PMI

Engaged in malaria work since the 1950s, the U.S. supports malaria efforts through the President’s Malaria Initiative (PMI, launched in 2005) as well as other activities, including research. PMI programs, overseen by USAID’s U.S. Global Malaria Coordinator and implemented by USAID and CDC, center on expanding coverage of six key high-impact interventions: diagnosis of malaria and treatment with artemisinin-based combination therapies (ACTs), entomological monitoring, intermittent preventive treatment in pregnancy (IPTp), indoor residual spraying (IRS) with insecticides, insecticide-treated mosquito nets (ITNs), and seasonal malaria chemoprevention (SMC). See the KFF fact sheet on PMI and other U.S. malaria efforts.

Neglected Tropical Diseases (NTDs)

Having historically engaged in NTD efforts through research and surveillance, the U.S. expanded its response by launching the USAID NTD Program in 2006, which aimed to reduce the prevalence of seven NTDs (ascariasis or roundworm, hookworm, trichuriasis or whipworm, lymphatic filariasis or elephantiasis, onchocerciasis or river blindness, schistosomiasis or snail fever, and trachoma) through integrated treatment programs using mass drug administration (MDA), and the U.S. NTD Initiative in 2008, which aimed to intensify efforts and increase funding for activities across the U.S. government. Efforts are led by USAID and involve CDC, the National Institutes of Health (NIH), and other agencies. See the KFF fact sheet on U.S. NTD efforts.

Family Planning/Reproductive Health (FP/RH)

The U.S. has been engaged in international research on FP and population issues as well as other FP/RH efforts, including the purchase and distribution of contraceptives in developing countries, since the 1960s. Today, led by USAID and involving several agencies, U.S. FP/RH activities are designed to decrease the risk of unintended pregnancies and maternal and child mortality through effective interventions, including contraception, counseling, and post-abortion care. See the KFF fact sheet on U.S. FP/RH efforts and the KFF fact sheet on statutory requirements and policies related to these efforts.

Maternal and Child Health (MCH)

The U.S. has been involved in efforts to improve MCH since the 1960s. Today, led by USAID and involving several agencies, U.S. MCH activities aim to: improve equity of access to and use of services by vulnerable populations; bring to scale a range of high impact interventions that mitigate maternal, newborn, and under-five deaths; prevent and address the indirect causes of such deaths (such as HIV, TB, and malaria); strengthen integration of maternal health services with FP; and strengthen health systems. Additionally, some water, sanitation, and hygiene (WASH) activities are part of the environmental health efforts within the USAID MCH program. The U.S. is also a donor to global organizations addressing MCH, like Gavi; UNICEF; and the Global Polio Eradication Initiative (GPEI). See the KFF fact sheet on U.S. MCH efforts, the KFF fact sheet on U.S. polio efforts, and the KFF fact sheet on the U.S. and Gavi.

Nutrition/Feed the Future

For more than 40 years, USAID has been involved in nutrition efforts, aiming to prevent undernutrition through interventions such as nutrition education, nutrition during pregnancy, exclusive breastfeeding, and micronutrient supplementation.7  USAID’s nutrition efforts are coordinated with the U.S. Feed the Future Initiative (FtF, launched in 2009), which aims to address global hunger and food security and is led by USAID with several U.S. government agencies including the U.S. Department of Agriculture. See the KFF fact sheet on U.S. MCH efforts (which includes U.S. nutrition efforts).

Global Health Security

While the U.S. government has supported global health security (GHS) work for more than two decades, its involvement has expanded over time, with attention to these efforts growing significantly due to the COVID-19 pandemic. Meant to reduce the threat of emerging and re-emerging diseases by supporting preparedness, detection, and response capabilities worldwide, U.S. GHS efforts are primarily carried out by the White House, USAID, CDC, the Department of Defense (DoD), and the Department of State. The U.S. has also played a key role in development of the “Global Health Security Agenda (GHSA),” an international partnership launched in 2014 and now involving more than 70 countries and international organizations. Through the GHSA, U.S. government agencies work with host governments and partners to help countries make measurable improvements in capabilities to detect and respond to emerging disease events and achieve global health security targets. Further, in 2022 the U.S. was an early supporter and is the largest funder of the Pandemic Fund, a multilateral global financing mechanism that aims to help countries build their capacity to prevent, prepare for, and respond to epidemics and pandemics. See the KFF brief on the U.S. GHS efforts.

Where Do These Programs Operate?

U.S. global health efforts are carried out in approximately 80 countries through bilateral support to countries or through regional programs.8  The majority of countries reached through bilateral support are located in sub-Saharan Africa (35 countries), followed by the Western Hemisphere (16 countries), East Asia and Oceania (11 countries), South and Central Asia (9 countries), Europe and Eurasia (4 countries), and Middle East and North Africa (4 countries) (see the KFF tracker on U.S. global health programs by country and region). Additional countries are reached indirectly through U.S. contributions to multilateral organizations. The U.S. typically operates multiple global health programs in most of the countries. While more support is generally directed to countries facing a higher burden of disease, other factors influencing where U.S. health assistance is directed include the presence of willing and able partner governments; a history of positive relations and goodwill with host countries; strategic and national security priorities; funding; and personnel availability.9 

How Much Funding Is Provided?10 

The U.S. is the largest donor to global health in the world, and its investment in global health has grown significantly since the early 2000s.11  However, since FY 2010, U.S. funding for global health has remained relatively flat, with spikes in some years due to emergency supplemental funding for disease outbreaks (see figure below). Key highlights and funding trends include (also see KFF’s U.S. global health budget tracker and fact sheets):

  • funding for global health is channeled through multiple agencies and programs; most funding is provided by Congress to the Department of State (largely because most PEPFAR funding is channeled through the department), followed by USAID, HHS, and DoD;12 
  • the majority of U.S. funding for global health (around 80%) is captured under the Global Health Programs account, with an additional $1-2 billion per year for global health activities provided through other accounts;
  • most U.S. global health funding goes to HIV programs, which have received the most funding of any U.S. global health program since FY 2001 and have historically accounted for approximately half of total funding through regular appropriations;
  • most funding (approximately 80% in the last decade) is provided bilaterally with the remainder provided to multilateral organizations, such as the Global Fund and Gavi (see the KFF brief on U.S. multilateral global health engagement);13  and
  • most U.S. global health funding designated for specific country and regional efforts is allocated to sub-Saharan Africa, followed by South and Central Asia, the Western Hemisphere, East Asia and Oceania, the Middle East and North Africa, and Europe and Eurasia.14 
U.S. Global Health Funding (in billions), FY 2006 - FY 2025 Request (Stacked column chart)
  1. USAID website, “Mission, Vision and Values,” webpage, https://www.usaid.gov/about-us/mission-vision-values; U.S. Department of State and USAID, Joint Strategic Plan FY2022-FY2026, March 2022. White House, National Security Strategy, October 2022. ↩︎
  2. KFF analysis of the FY 2025 International Affairs Congressional Budget Justification. This percentage is the share of State and USAID global health funding provided through the International Affairs account (including Function 150, 300, and 800 accounts). ↩︎
  3. KFF global health policy fact sheets, https://modern.kff.org/topic/global-health-policy/?s=&fs%5Bcustom_date_range%5D%5B%5D=&fs%5Bcustom_date_range%5D%5B%5D=&fs%5Bpost_type%5D%5B%5D=fact-sheet&layout=list. ↩︎
  4. KFF analysis of FY 2023 country level data in the U.S. Foreign Assistance Dashboard website, ForeignAssistance.gov, accessed June 2024. Includes countries receiving bilateral global health funding through the Global Health Programs (GHP), Economic Support Fund (ESF), and Development Assistance (DA) accounts. Due to the unique nature of the program, funding provided through the Food for Peace (FFP) account at USAID is not included in this analysis. The U.S. Foreign Assistance Dashboard does not break out bilateral funding for NTDs. As such, this analysis includes countries supported by USAID’s NTDs and programs as reported by USAID’s “Where we work” page accessed https://www.neglecteddiseases.gov/where-we-work and through personal communication with USAID. Additional countries may be reached through regional programs. ↩︎
  5. Other agencies and departments involved include the National Security Council (NSC), National Institutes of Health (NIH), Health Resources and Services Administration (HRSA), U.S. Food and Drug Administration (FDA), Peace Corps, and Departments of Labor, Commerce, and Defense (DoD). ↩︎
  6. Stop TB Partnership website, www.stoptb.org/. ↩︎
  7. USAID, “Nutrition,” webpage, https://www.usaid.gov/global-health/health-areas/nutrition. ↩︎
  8. Reflects U.S. global health programs by country and region as identified in FY 2023 planned funding data from ForeignAssistance.gov for all global health programs, with the exception of Neglected Tropical Diseases (NTDs), whose countries were identified through the FY 2023 USAID NTD fact sheet and personal communication with USAID. See also KFF’s U.S. Global Health Budget Tracker for more details on planned funding by country. ↩︎
  9. KFF, The U.S. Global Health Initiative: A Country Analysis, 2011. ↩︎
  10. Unless otherwise specified, U.S. global health funding in this section refers to funding through regular appropriations only. KFF analysis of data from the Office of Management and Budget, Agency Congressional Budget Justifications and Operating Plans, Congressional Appropriations Bills, Press Releases, and Conference Reports; and U.S. Foreign Assistance Dashboard website, ForeignAssistance.gov. ↩︎
  11. KFF, Historical Trends in U.S. Funding for Global Health, May 2021. KFF analysis of OECD DAC CRS database, June 2024. KFF analysis of data from the Office of Management and Budget, Agency Congressional Budget Justifications and Operating Plans, Congressional Appropriations Bills, Press Releases, and Conference Reports; and U.S. Foreign Assistance Dashboard website, ForeignAssistance.gov. ↩︎
  12. Based on specified funding for global health programs in the President’s budget request, ForeignAssistance.gov, and Congressional appropriations bills. There is additional funding for global health activities that is determined at the agency level and is not specified by the Administration or in Congressional appropriations (e.g., Economic Support Fund [ESF] at USAID); these amounts are estimated using prior year levels. ↩︎
  13. KFF analysis of data from the Office of Management and Budget, Agency Congressional Budget Justifications and Operating Plans, Congressional Appropriations Bills, Press Releases, and Conference Reports; and U.S. Foreign Assistance Dashboard website, ForeignAssistance.gov. ↩︎
  14. KFF analysis of FY 2023 country level data in the U.S. Foreign Assistance Dashboard website, ForeignAssistance.gov, accessed June 2024. Includes countries receiving bilateral global health funding through the Global Health Programs (GHP), Economic Support Fund (ESF), and Development Assistance (DA) accounts. Due to the unique nature of the program, funding provided through the Food for Peace (FFP) account at USAID is not included in this analysis. ↩︎

2025 Medicare Advantage Plan Choices are Stable, Following Years of Steady Growth

Authors: Jeannie Fuglesten Biniek, Meredith Freed, Anthony Damico, and Tricia Neuman
Published: Oct 15, 2024

Note: This analysis was updated on November 25th to reflect the October version of the 2025 CMS Landscape file. For more information, please see: Medicare Advantage 2025 Spotlight: A First Look at Plan Offerings | KFF and Medicare Advantage 2025 Spotlight: A First Look at Plan Premiums and Benefits | KFF

In the months leading up to the Medicare annual open enrollment period that runs from October 15th through December 7th, there were questions about how modifications to the payment formula and higher utilization would impact the number of Medicare Advantage plans that would be offered in 2025. A review of the plans available for individual enrollment shows that the total number of plans declined by 6% (from 3,959 to 3,719). Some reports have suggested that this translates into a dramatic drop in the number of plans available to the average Medicare beneficiary. However, taking a closer look, the Medicare Advantage market appears relatively stable.

KFF analysis finds the average Medicare beneficiary will have the option of 34 Medicare Advantage prescription drug (MA-PD) plans in 2025, just 2 fewer than the 36 options available in 2024 (Figure 1). Across all plans for individual enrollment, including those with and without prescription drug coverage, the average beneficiary has 42 options in 2025, compared to 43 options in both 2023 and 2024. Since 2018, the number of plans available to the average beneficiary has doubled.

The Number of Medicare Advantage Plans Available to the Average Medicare Beneficiary is Stable in 2025

While a full KFF analysis of plan offerings and benefits will follow, at a high level, 2025 looks similar to 2024 in terms of plan choice.

    The average Medicare beneficiary has access to plans offered by 8 different firms in 2025, the same as in 2024, and an increase of 2 firms since 2018. Virtually all enrollees (99%) also have access to at least one zero premium plan that includes prescription drug coverage, consistent with recent years and substantially higher than the 84% in 2018.

The decrease in the total number of Medicare Advantage plans means that some Medicare beneficiaries will find that their current coverage is no longer an option for next year. In most cases, these beneficiaries live in counties where they will continue to have a myriad of Medicare Advantage plan options, potentially including some from the same insurer for the plan in which they are currently enrolled. In some cases, people will be moved into a new plan under the same insurer automatically if the contract includes another plan of the same type (i.e., HMO or PPO) in the same county. Others will have to make an active choice about their Medicare coverage if they wish to enroll in another Medicare Advantage plan.

Though higher than in previous years, a relatively small number of Medicare Advantage beneficiaries are enrolled in a plan in 2024 that has been terminated for the coming year and will not be automatically assigned to a new plan. People in this group will be able to enroll in another Medicare Advantage plan if one is available or choose traditional Medicare. If they choose traditional Medicare, they will qualify for a special enrollment period for Medigap with guaranteed issue rights, meaning they can switch to traditional Medicare and will not be denied a Medigap policy due to a pre-existing condition.

Every year, Medicare Advantage plans change in ways that could be important to enrollees, including the scope and generosity of extra benefits, cost sharing for Medicare-covered benefits, rules for using covered services (such as referral requirements and prior authorization), drug formularies, and provider networks. Despite these changes, most Medicare beneficiaries report that they do not compare coverage options on an annual basis. While reviewing the various features of plans can be daunting, beneficiaries can take some comfort in the stability of the Medicare Advantage market in terms of the number of plans available to them in 2025.

Teens, Drugs, and Overdose: Contrasting Pre-Pandemic and Current Trends

Authors: Nirmita Panchal and Sasha Zitter
Published: Oct 15, 2024

Editorial Note

For newer data, please see the more recent publication, 5 Key Facts on Adolescent Mental Health and Substance Use Disorders.

Teenage drug and alcohol use is on the decline and, for the first time in recent years, drug overdose deaths among teens have slightly decreased. Adolescent overdose fatalities first spiked with the onset of the pandemic, nearly doubling from 282 deaths in 2019 to 546 deaths in 2020. These deaths decreased from 721 in 2022 to 708 in 2023, a small reduction that marked a plateau and possibly the start of a decline in adolescent overdose deaths. While it is too early to determine what the direction of overdose deaths may be, factors that may have contributed to the small decline include a decrease in pandemic-related stressors along with policies aimed at reducing overdose deaths. Through the Biden-Harris Administration, naloxone was made available over the counter, access to substance use treatment and education was expanded, including in schools, and the Kids Online Health and Safety Task Force was launched, which aims to prevent teens from purchasing drugs via social media. With the 2024 Presidential election approaching and both candidates’ plans to address the youth drug crisis differing widely, future policy efforts will depend on election outcomes.

This issue brief analyzes CDC WONDER data – including provisional data from 2023 – and data from national surveys of adolescent youth to highlight trends in substance use and overdose deaths. It explores how and where teenagers receive substance use information and treatment and how school settings can be leveraged to enhance prevention measures. Lastly, it examines federal and state prevention efforts and social media’s role in the drug crisis.

Adolescent drug fatalities more than doubled in recent years – primarily due to opioids – but slightly decreased by the end of 2023. There were 708 adolescents drug fatalities in 2023, compared to 721 in 2022 (Figure 1). Additionally, a recent KFF analysis found that opioid-related deaths among adolescents decreased in the second half of 2023. Although these findings represent the first decrease in drug overdose fatalities in recent years, they remain more than twice as high as the number of adolescent overdose fatalities prior to the pandemic (708 deaths in 2023 vs. 282 deaths in 2019, Figure 1).

Adolescent Overdose Deaths Have Increased Since Before the Pandemic, Primarily Driven by Opioids

Fentanyl overdose deaths increased by 2% from 2022 to 2023, marking the smallest annual increase in fentanyl deaths among adolescents since the pandemic began. The synthetic opioid, fentanyl, has largely driven the increase in adolescent drug fatalities since the pandemic began. In the first year of the pandemic, adolescent overdose deaths involving fentanyl increased by 177% (from 128 deaths in 2019 to 354 in 2020, Figure 1). While these deaths remain higher than pre-pandemic levels, the increase slowed to 2% from 2022 to 2023 (527 and 539 deaths, respectively).

The share of all drug overdose deaths that involved fentanyl increased faster among adolescents than adults in recent years (Figure 2). Fentanyl deaths as a share of all adolescent drug overdose deaths increased significantly from 32% in 2018 to 65% in 2020. This increase marked the first time the share of drug fatalities involving fentanyl was higher among adolescents than adults (65% vs 62% in 2020). This gap has continued to slowly widen – in 2023, 76% and 69% of adolescent and adult drug fatalities involved fentanyl, respectively. While the share of fentanyl deaths increased more among adolescents than adults over time, the number and rates of these deaths remains much lower among adolescents compared to adults (539 vs. 72,000 deaths; and 2.1 vs. 27.6 deaths per 100,000 in 2023).

The Share of Drug Fatalities Involving Fentanyl Increased Faster Among Adolescents Than Adults in Recent Years

Adolescents may obtain drugs through social media, and these drugs are often contaminated with fentanyl. In 2023, seven out of every ten counterfeit opioid pills were found by the Drug Enforcement Administration to contain a potentially deadly dose of the drug. Fentanyl is exceedingly lethal and is often used to lace drugs because it is cheap and highly potent. With the onset of the pandemic, fentanyl spread quickly into drug supplies and is often trafficked by U.S. citizens (although misinformation incorrectly links the spread of fentanyl to undocumented immigrants). Adolescent fentanyl overdoses are thought to be mostly accidental, as teens search for prescription opioids or other drugs, either for recreational or self-medication purposes, but instead encounter fentanyl-contaminated pills. Adolescents may acquire drugs through social media platforms, which are frequently scrutinized for lacking regulation around illegal drug sales. The National Crime Prevention Council estimates that eight in ten teen and young adult fentanyl overdose deaths are associated with social media contact.

Despite the increase in drug overdose deaths among adolescents in recent years, their use of drugs and alcohol has slightly declined (Figure 3). In 2023, 10% of high school students reported ever using select illicit drugs, including cocaine, heroin, inhalants, methamphetamines, ecstasy, or hallucinogens, a slight decrease from 2017 (13%). Declines were also reported in opioid misuse (14% vs. 12%) and current alcohol use (30% vs. 22%) among high school students during the same period. Marijuana use has fluctuated, but ultimately decreased slightly since 2017 (20% vs. 17% in 2023). However, adolescent marijuana use may be linked to the onset of psychotic disorders, including depression and suicidality. Among high school students, the use of e-cigarettes declined from 14% in 2022 to 10% in 2023, although e-cigarettes remain the most often used tobacco product among this population in recent years. Factors that may have contributed to the overall decline in substance use among adolescents include public education initiatives and earlier intervention.

Substance Use Among High School Students Has Decreased Over Time

As adolescent substance use and related deaths showed slight signs of improvement in 2023, so did adolescent mental health. The share of high school students reporting feelings of sadness and hopelessness – which can be indicative of depressive disorder – increased from 30% in 2013 to 42% in 2021, before slightly declining to 40% in 2023. The co-occurrence of poor mental health and substance use is common, with one in five youth who had a major depressive episode in the last year also having a substance use disorder. In a recent, CDC convenience sample survey of teens (ages 13 to 18) who used substances in the last 30 days, many teenagers reported using substances to cope with negative emotions. Although it is too early to know whether adolescent substance use and poor mental health will continue to decline, efforts to identify and harness the driving factors behind this change may help continue the downward trend.

How and where do adolescents receive substance use messaging and treatment?

More than 6 in 10 adolescents report receiving information on drug and alcohol use disorder and prevention in school (Figure 4). This information is disseminated in multiple forms, including special substance use education classes, substance use-related films, lectures, and discussions outside of class, or substance use curricula integrated into health or physical education classes. A similar share of adolescents (63%) viewed messaging on substance use prevention outside of schools, while approximately half spoke with their parents on substance use harms (51%), and a small share participated in prevention programs outside of school settings (7%).

Most Adolescents Receive Substance Use Prevention Messaging in School

In 2023, only 2 out of 10 adolescents with a substance use disorder received treatment in the past year. In 2023, 8.5% of adolescents (or 2.2 million) had a substance use disorder in the past year.1  Among these adolescents, 19.3% (or 423,000) received substance use disorder treatment in the past year.

Adolescents face a number of barriers to substance use treatment, including limited access to residential treatment facilities and buprenorphine. Among the total adolescent population, treatment for any substance use issue was more commonly received in an outpatient setting (3.3%) (i.e. at a medical clinic, doctor’s office, or therapist’s office), followed by an inpatient setting (1.4%) (i.e. at a hospital or residential treatment center) in 2023. Many residential addiction treatment facilities do not accept adolescent patients, and among facilities that do, beds may not be immediately available. The number of treatment facilities by state varies greatly, as do costs. Additionally, few facilities provide buprenorphine, a medication that can reduce withdrawal symptoms and cravings, to adolescents with opioid use disorder or discontinue it prior to discharge. Buprenorphine, a standard treatment for opioid use disorder is not approved for use by those under the age of 16, though it is recommended by the Society for Adolescent Health and Medicine. Still, some pediatricians feel uncomfortable prescribing it to adolescent patients.

Which efforts have been implemented in response to the adolescent drug crisis?

Recent federal efforts, including proposed bipartisan legislation, aim to strengthen youth substance use prevention programs in schools. The bipartisan Keeping Drugs Out of Schools Act was recently introduced, requesting federal authorization of 7 million dollars per year over 5 years for elementary, middle, and high schools to improve their drug prevention programs. The Biden-Harris administration also continues to respond to the youth drug crisis, most recently by allocating $94 million to community efforts to prevent youth overdoses via the Drug Free Communities Support Program, an initiative that often involves partnering with school districts to reduce youth substance use. Further, the Biden-Harris administration’s Safer Communities Act facilitated expansions of behavioral health services in schools through Medicaid resources.

Many states have policies allowing schools to stock naloxone (the opioid overdose reversal drug), an effort that is supported by the Biden-Harris administration, American Medical Association, and National Association of School Nurses. Most states have passed laws explicitly allowing schools to stock, naloxone, but only a few states, including Rhode Island and Washington, require it. Additionally, as of 2023, just over half of the nation’s largest school districts reported they mandate stocking naloxone. Several school districts, including, most recently, Virginia's Loudon County School Board, have proposed or passed policies allowing students to carry and administer naloxone at school, after meeting certain requirements such as completing overdose-recognition training and obtaining written permission from their guardians. Some states, such as Washington and Oregon, have also passed legislation that integrates fentanyl education into school curricula. Among schools that do not stock naloxone, some worry that doing so will impact their image and label the school as having a drug problem, while others believe that there are more effective uses for limited school funds, as schools are fairly low frequency overdose locations.

Outside of schools, federal and state lawmakers are attempting to address adolescent substance use through online safety legislation. At the federal level, accompanied by the Surgeon General’s advisory on social media and youth mental health, the Biden-Harris Administration announced the Kids Online Health and Safety Task Force, which aims to enhance the health and safety of children on the internet. Similarly, the Kids Online Safety Act, a bill designed to increase regulation and accountability for social media companies, has been passed by the Senate, and President Biden stated he will sign it if it passes the House. Additionally, senators have introduced bipartisan legislation that aims to protect the privacy and wellbeing of children online. Multiple states have introduced legislation focused on media literacy, age verification, and the online distribution of controlled substances. Social media platforms are facing pressure from parents and lawmakers alike to increase regulation and to prevent online drug sales. These tech companies are protected by Section 230 of the Communications Decency Act, which states that they are not liable for material posted on their platforms by third parties. In July of 2024, the Supreme Court turned away a case that would have warranted a thorough review of Section 230, thereby preserving the immunity of these social platforms. With mounting pressure, some social media companies are creating safety features to protect young users, including Meta’s recently announced Teen Accounts feature.

  1. NSDUH screens for substance use disorder based off of DSM-V criteria, asking substance-specific questions to all participants who indicate they have ever used a substance in order to determine the severity (mild, moderate, or severe) of the substance use disorder if one is present. Participants have a substance use disorder if they meet at least two of the eleven diagnostic criteria within the last 12 months. ↩︎