Women’s Access to Fertility Care
Findings from the 2026 KFF Women’s Health Survey
Introduction
The high costs of in vitro fertilization (IVF), limited insurance coverage for fertility services, and intersection with state level abortion laws and fetal personhood policies have brought the issue of access to fertility care into the policy spotlight. President Trump has stated that he wants to make fertility care more affordable and said he would institute an insurance coverage mandate as part of his campaign promises. There is currently no federal requirement for insurance coverage of fertility services, and the Trump administration has not issued a proposal for one. Recently, the Trump Administration advanced a policy that offers a discount on some IVF medications for people without coverage through the TrumpRx website and clarified regulations about insurance options for employers to encourage them provide fertility benefits to those covered in their employer-sponsored health insurance policies. However, the Administration’s actions to date are likely to provide limited assistance for people seeking IVF services who have gaps in coverage and who are struggling to afford the costs. While several states have enacted laws requiring some level of fertility coverage in state-regulated plans, these laws have limited reach and only affect a minority of people with private insurance coverage given that most people with employer coverage are in self-insured plans.
To understand the need for and barriers to fertility services, the 2026 KFF Women’s Health Survey included questions on fertility care. The nationally representative survey was conducted from March 11, 2026 to April 14, 2026, online and by telephone. This analysis presents survey findings among women ages 18 to 49 (n=3,538) on their reported need for and use of fertility services.
Key Takeaways
- Fifteen percent (15%) of reproductive age women say they or their partner have ever needed fertility services to help them become pregnant or prevent a miscarriage. However, not all actually received services. One in ten (11%) women ages 18 to 49 say they or their partner received fertility assistance, but a quarter of these women (3% of all reproductive age women) say they were unable to get the fertility care they needed.
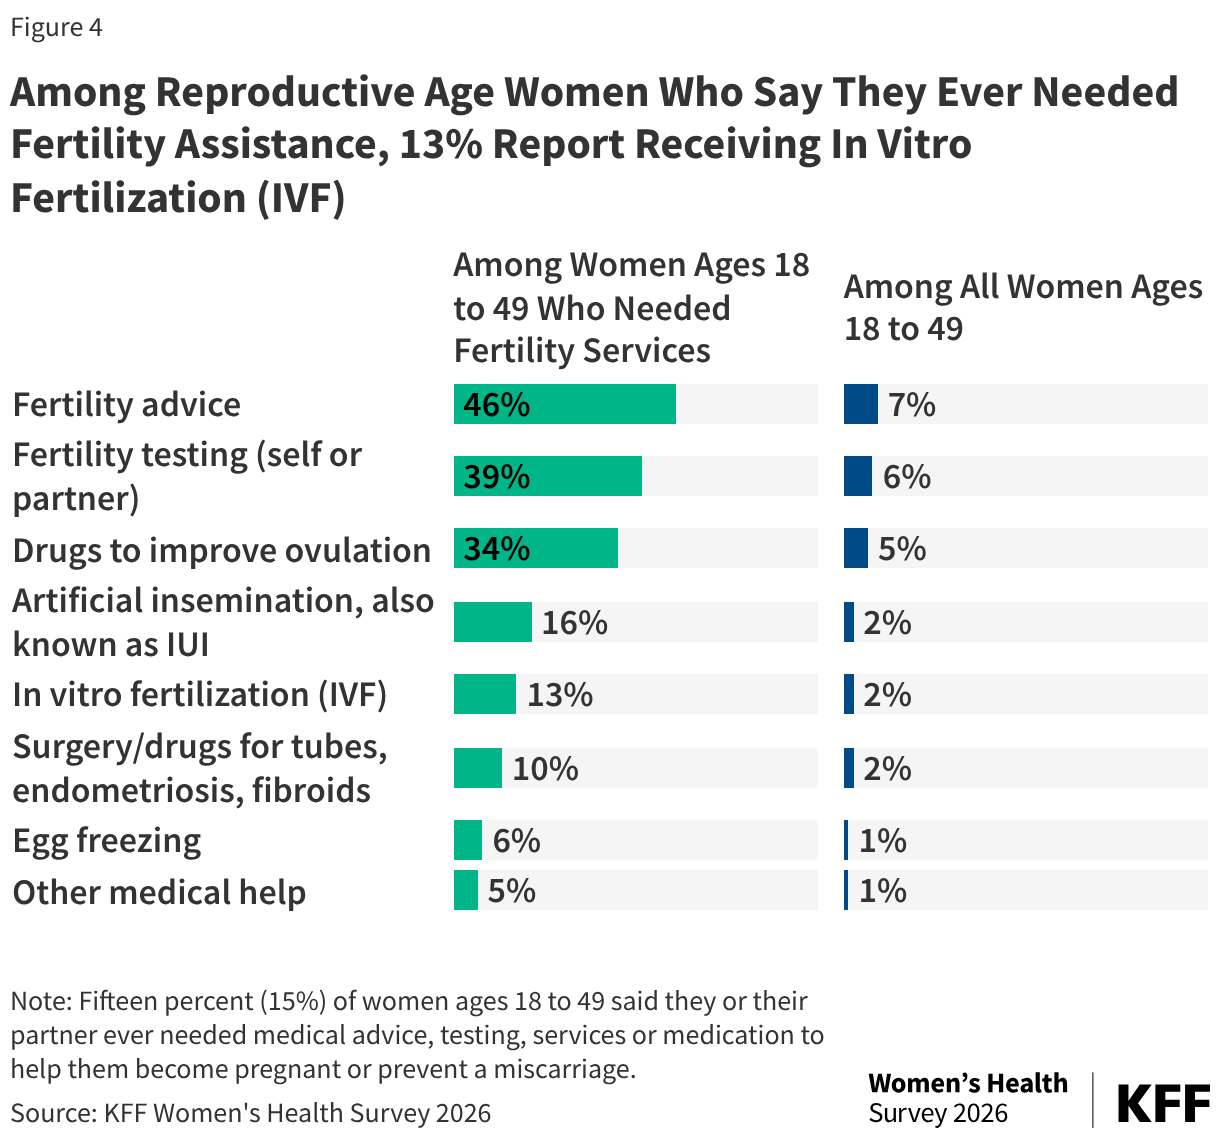
- The fertility services that reproductive age women most commonly use are fertility advice, fertility testing, and medications to improve ovulation. Only a fraction of this population say they have used IVF. Among women who say they or their partner ever needed fertility care, almost half (46%) say they received advice and 39% say they received testing services. As far as treatments, one-third (34%) say they have received drugs for ovulation. Thirteen percent (13%) of reproductive age women who say they or their partner ever needed fertility care report they received IVF, and 16% report they received artificial insemination (IUI), which translates to 2% of all reproductive age women who report ever receiving either service.
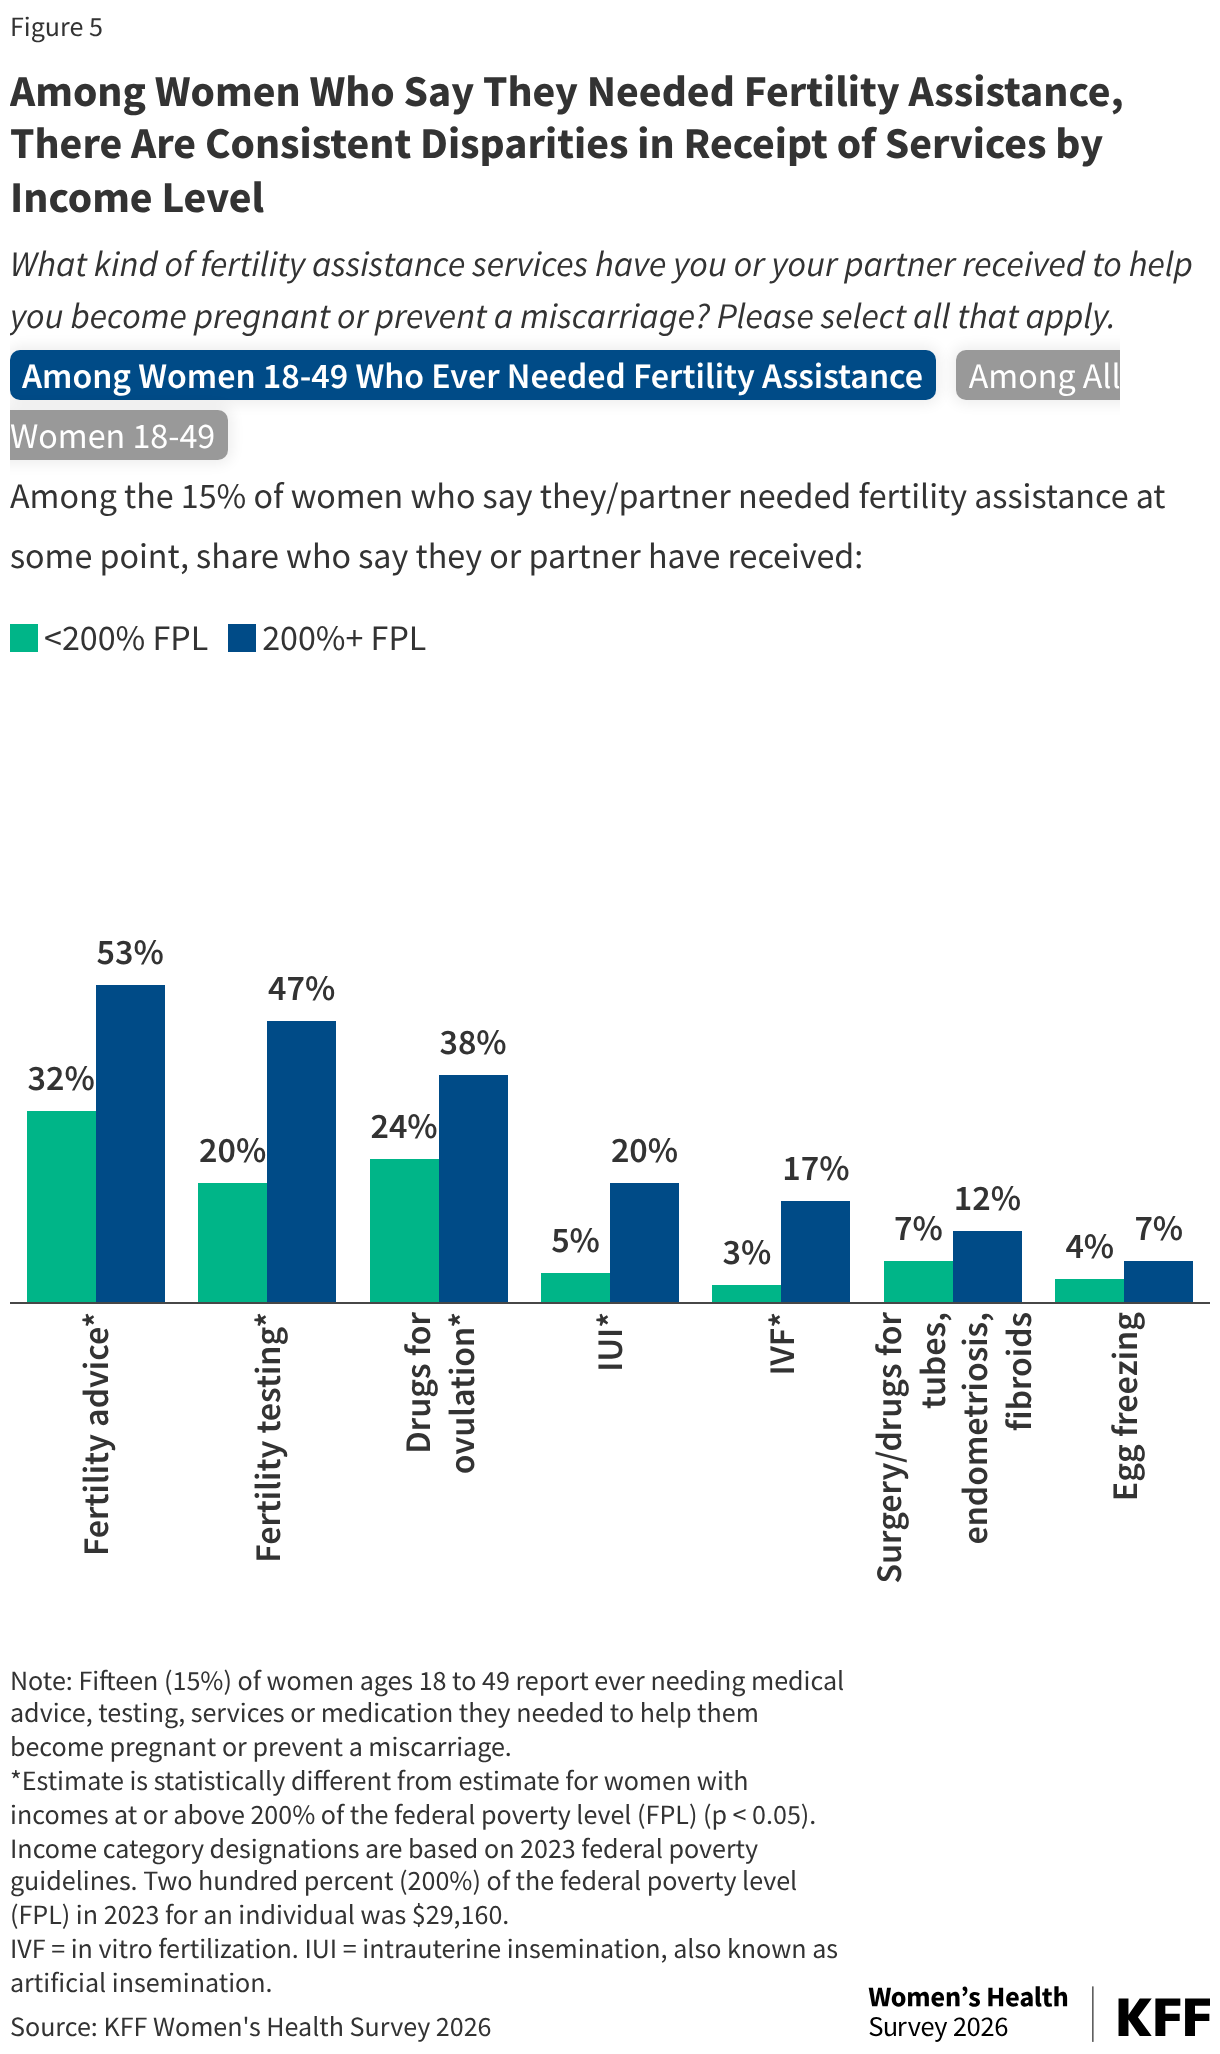
- Cost is a major barrier to the receipt of fertility services for those who need them. Use of all fertility services is more common among women with higher incomes; among women who say they did not receive needed fertility care, the leading reason is cost. For example, among reproductive age women who say they or their partner have needed fertility assistance, 17% with higher incomes say they received IVF compared to just 3% of women with low incomes. Larger shares of women with low incomes report cost as the main barrier compared to those with higher incomes.
Findings
Need for Fertility Care and Cost Barriers
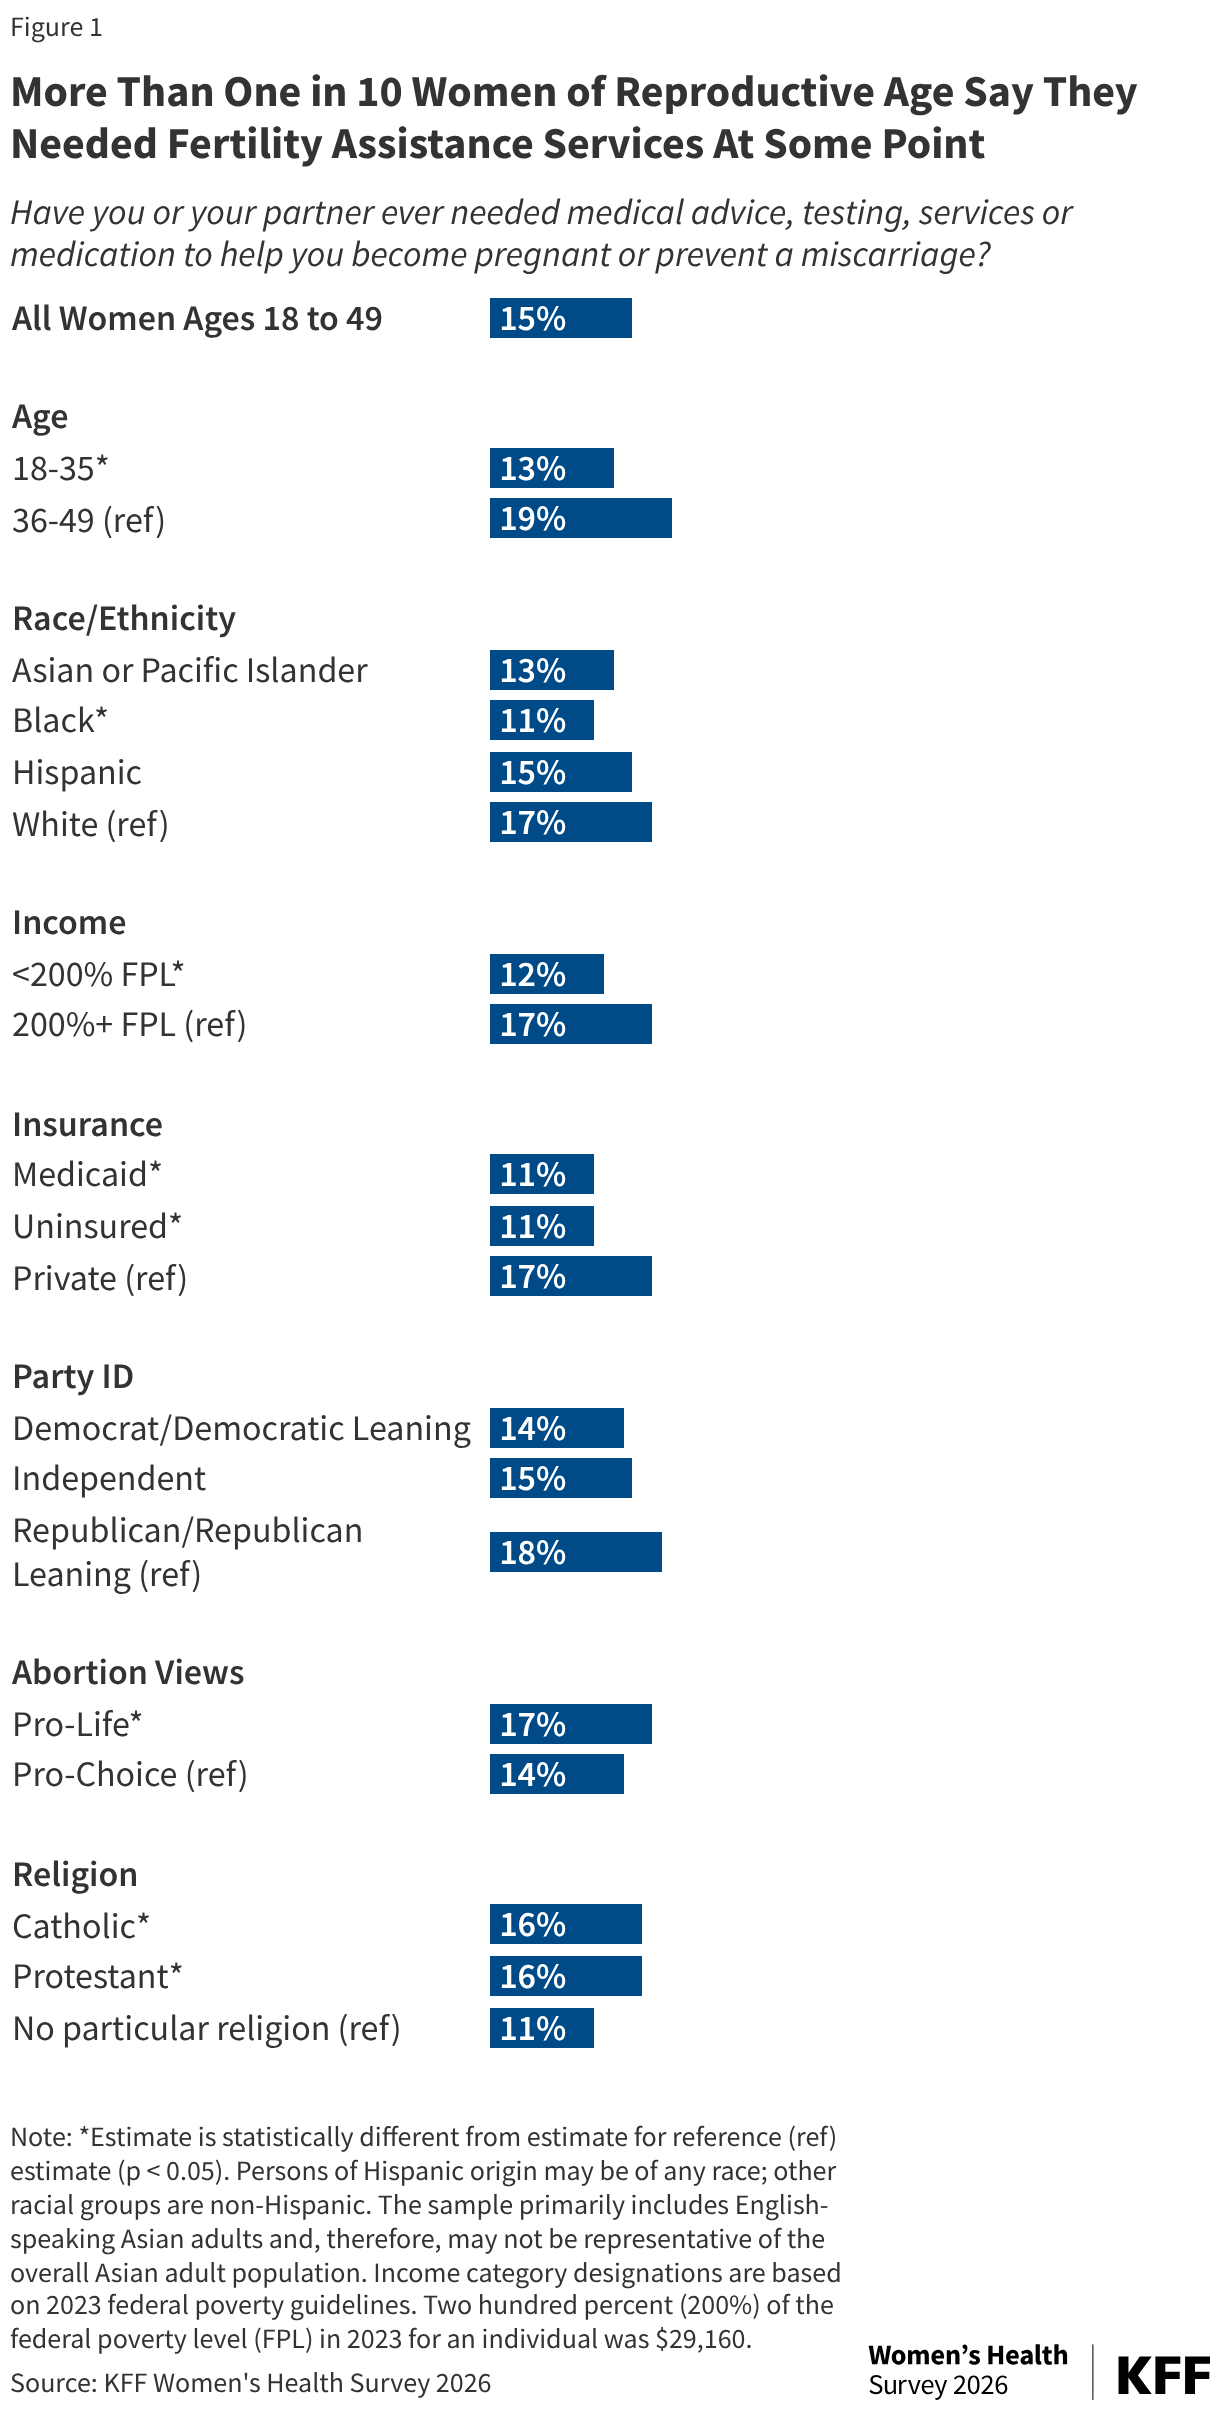
Approximately one in seven women ages 18 to 49 say they or their partner needed fertility assistance services at some point. Nationally, 15% of reproductive age women report needing fertility services to become pregnant or prevent a miscarriage at some time in their lives (Figure 1). The share reporting need increases with age, as fertility declines. Just over one in ten (12%) women ages 18 to 35 say they needed fertility services at some point, compared to 19% of women ages 36 to 49.
The reported need for fertility care is similar across most other demographic groups, except slightly lower among Black women (11%) compared to their White counterparts (17%). Nationally, 12% of women with lower incomes say they have needed fertility services, compared to 17% of women with higher incomes. About one in ten women with Medicaid coverage (11%) or who are uninsured (11%) say they have needed fertility services, lower than women with private insurance (17%). While the survey does not find differences across party lines of women reporting needing fertility care at some point, slightly more women who identify as pro-life (17%) say they or their partner has needed fertility services than women who are pro-choice (14%). Higher shares of women who identify as Protestants (16%) or Catholic (16%) report ever needing fertility assistance compared to those who do not follow a particular religion (11%).
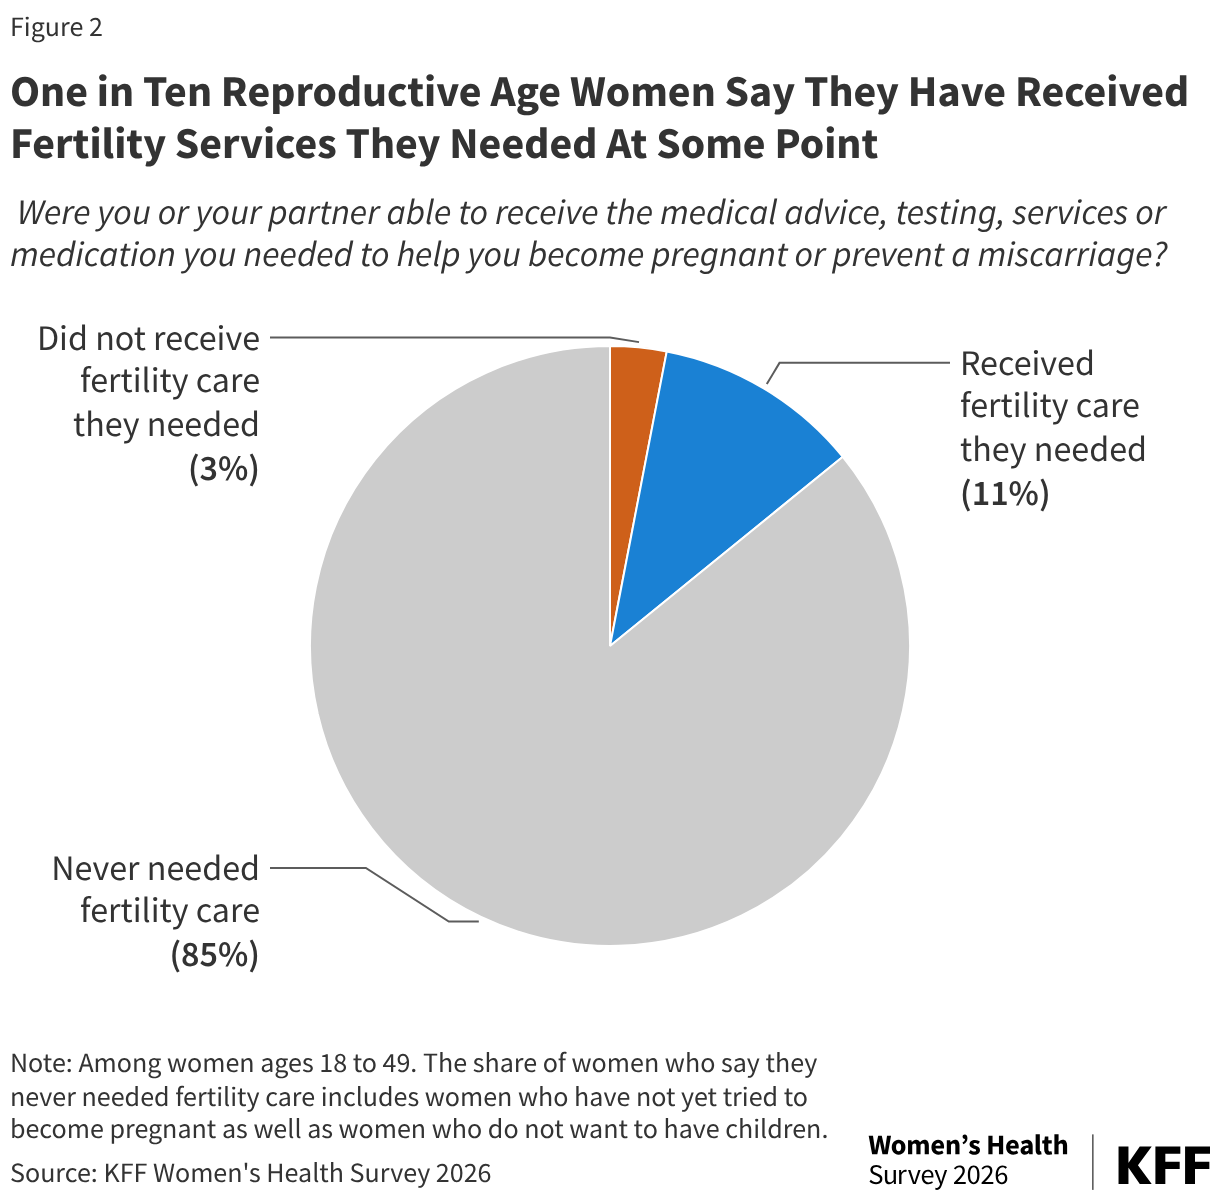
Among all reproductive age women, about one in ten (11%) say they or their partner have received fertility services at some point. Another 3% say they needed services but were not able to obtain them (Figure 2). While a relatively small share of women say they could not obtain fertility services, they may not be able to grow their families as desired because they could not afford the care they needed to get pregnant. Most reproductive age women (85%) say they have never needed fertility services (includes women who have not yet tried to become pregnant as well as women who do not want to have children).
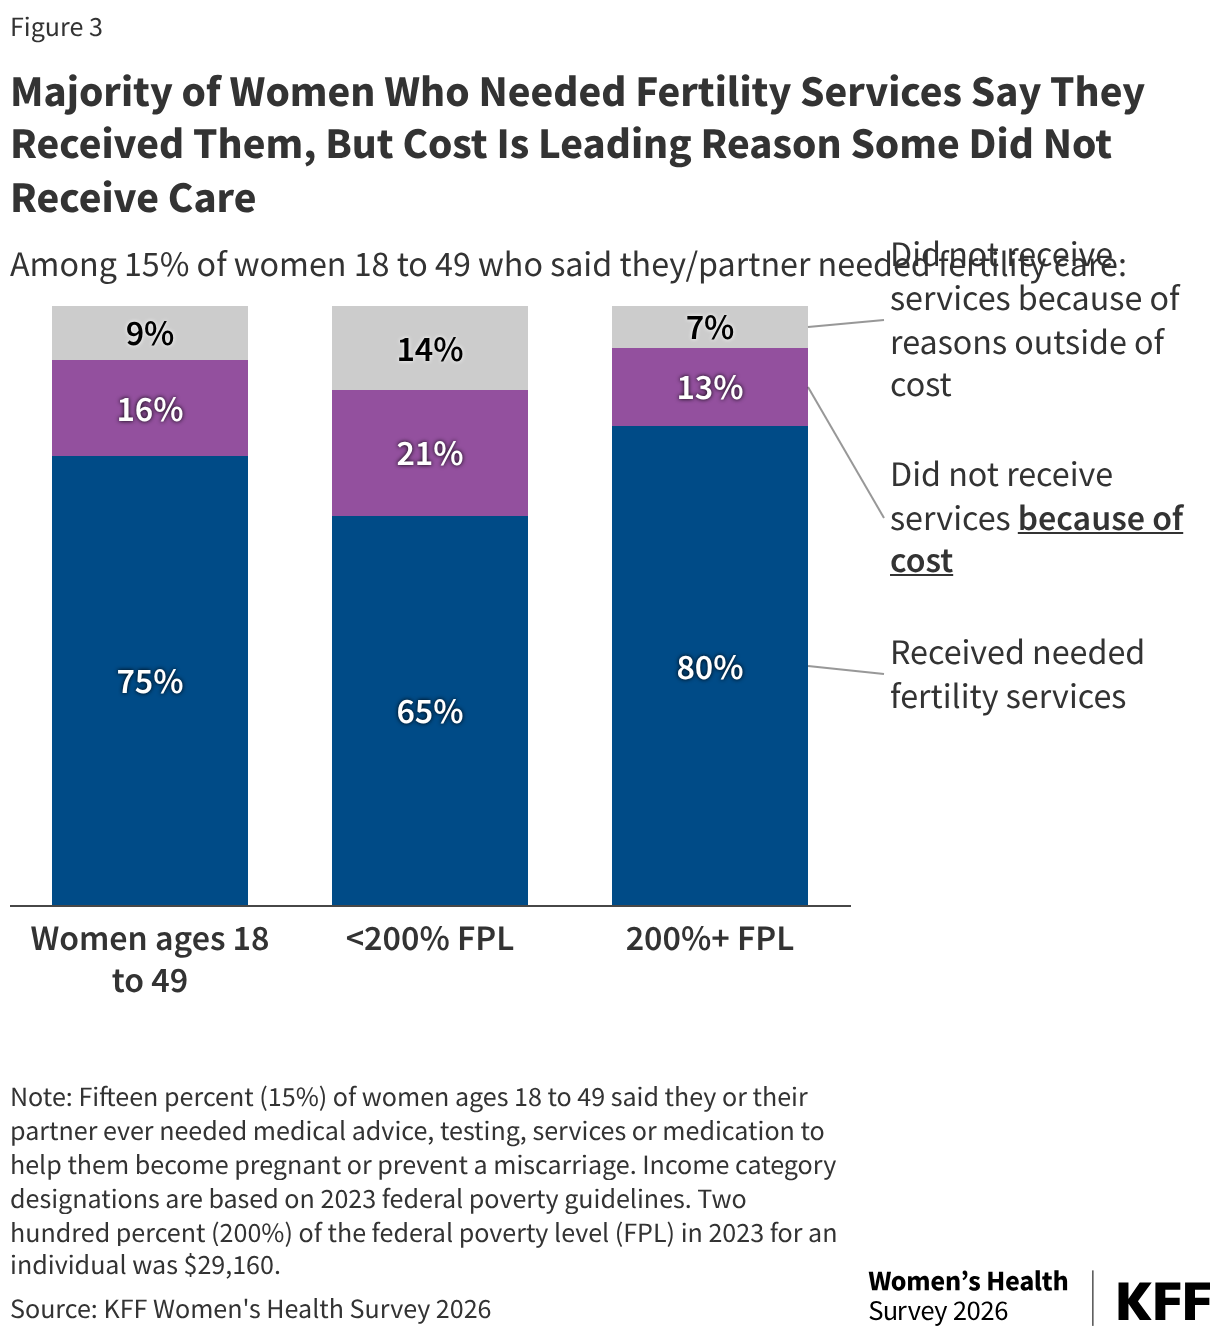
Most women who say they needed fertility services received them, but the leading reason why women say they didn’t get needed fertility services is cost. Not surprisingly, cost barriers are more common among women with lower incomes.
There are many obstacles to receiving fertility care, including costs, coverage, provider availability, and health status. However, cost is by far the single largest barrier. Among reproductive age women who reported needing fertility services at some point, 25% (3% of all reproductive age women) say they did not receive these services and cost was the primary barrier.
Among the 15% of women who said they ever needed fertility services, one in five (21%) with lower incomes (21%) cite cost as the main reason they could not obtain fertility services, compared to 13% of women with higher incomes (Figure 3). Overall, this represents 3% of all reproductive age women with low incomes and 2% of those with higher incomes who say they did not obtain fertility services because of cost.
Coverage for fertility services is limited in both private insurance and Medicaid. The 2024 KFF Employer Health Benefits Survey found that about a quarter (27%) of large firms that offer health benefits cover IVF services. Some states require state-regulated private insurers – which do not include self-insured employer plans -- to cover some level of fertility services. Medicaid, the health coverage program for people with lower incomes, rarely covers fertility services. In fact, federal law exempts state Medicaid programs from a requirement to cover fertility medications, which is different from most other outpatient prescription drugs that are typically covered by the program.
Types of Fertility Services
The leading fertility services that women report receiving are advice, testing, and drugs to improve ovulation.
Fertility assistance encompasses a broad array of services, including advice and counseling, medications, surgical procedures, diagnostic tests, imaging studies, cryopreservation, intrauterine insemination (IUI), in-vitro fertilization (IVF), and surrogacy. Depending on individual circumstances, people may use a variety of these services to become pregnant and/or to prevent miscarriages, particularly if they have a history of or are at higher risk for pregnancy loss. The costs of services vary widely, ranging from a few hundred dollars for diagnostic tests and medications to upwards of $25,000 for one cycle of IVF, and some patients may need multiple cycles before they get pregnant.
Among the 15% of reproductive age women who ever needed fertility services, almost half said they received advice (46%). Four in ten said they received testing for themselves or their partner (39%), and about one-third (34%) obtained medications (e.g. clomid, hormones, etc.) to improve ovulation (Figure 4). One in ten (10%) women said they had a corrective surgery or used medications to address an issue that make getting pregnant or carrying a pregnancy difficult such as fibroids or endometriosis.
Among reproductive age women who said they or their partner ever needed fertility services, 13% report they received IVF and 16% report they received artificial insemination, also known as IUI. This translates to 2% of all reproductive age women who report receiving either IVF or IUI.
IVF is a costly medical procedure where eggs are removed from the ovary and are fertilized with sperm in a lab setting to create an embryo, which is then placed in the uterus. Artificial insemination, also known as Intrauterine insemination (IUI) is another fertility procedure that involves injecting sperm into the uterus. It is less invasive and less expensive than IVF and is often selected for those reasons.
While a relatively small share of people ever use IVF or IUI, many seek these services after trying a range of other services to get pregnant, such as medications, acupuncture, and surgeries.
Smaller shares of women with lower incomes report receiving fertility services.
A smaller share of women with low incomes report that they obtained fertility services. This is the case for diagnostic services such as fertility advice and testing as well as treatments, including ovulation drugs. For IVF, the most intensive and expensive service, 17% of women with higher incomes who needed fertility assistance obtained IVF, compared to 3% of women with low incomes (Figure 5).
Methodology
The 2026 KFF Women’s Health Survey was designed and analyzed by women’s health researchers at KFF. The survey was conducted from March 11 – April 14, 2026, online and by telephone among a nationally representative sample of 5,854 adults ages 18 to 64, including 3,538 women ages 18 to 49. Women include anyone who selected woman as their gender. Sampling, data collection, weighting, tabulation, and IRB approval by the University of Southern Maine’s Collaborative Institutional Review Board were managed by SSRS of Glenn Mills, Pennsylvania in collaboration with women’s health researchers at KFF.
Throughout the reports of findings, we refer to “women.” This includes respondents who said their gender is “woman,” and includes those who selected “woman” in addition to another gender, such as “transgender,” or “non-binary,” or another gender. We followed this approach to try to include as many people as possible but recognize that some people who need and seek abortion and other reproductive health care services may not be represented in the findings or identify as women. Some questions about sexual and reproductive health were only asked among those with a specific sex assigned at birth (i.e. male or female).
The national sample was drawn from two nationally representative probability-based panels: the SSRS Opinion Panel and the Ipsos Knowledge-Panel. The SSRS Opinion Panel is a nationally representative probability-based panel where panel members are recruited randomly in one of two ways: (a) Through invitations mailed to respondents randomly sampled from an Address-Based Sample (ABS) provided by Marketing Systems Groups (MSG) through the U.S. Postal Service’s Computerized Delivery Sequence (CDS); (b) from a dual-frame random digit dial (RDD) sample provided by MSG. For the online panel component, invitations were sent to panel members by email followed by up to five reminder emails. 5,660 panel members completed the survey online and panel members who do not use the internet were reached by phone (n=194). Another 514 respondents were reached online through the Ipsos Knowledge Panel to help reach adequate sample sizes among subgroups of interest, specifically women ages 18 to 49. This panel is recruited using ABS, based on a stratified sample from the CDS. The questionnaire was translated into Spanish, so respondents were able to complete the survey in English or Spanish.
The national sample was weighted by splitting the sample into three groups: [1] Women 18-49, [2] Women 50-64, and [3] Men 18-64 and each group was separately weighted to match known population parameters (see table below for weighting variables and sources). Weights within the three groups were then trimmed at the 4th and 96th percentiles, to ensure that individual respondents do not have too much influence on survey-derived estimates. After the weights were trimmed, the samples were combined, and the weights adjusted, so that the groups were represented in their proper proportions for a final combined, gender by age-adjusted weight.
| Dimensions | Source |
| Age | Current Population Survey 2025 |
| Education | |
| Age by Education | |
| Age by Gender | |
| Census Region | |
| Race/Ethnicity by Nativity | |
| Home Tenure | |
| Civic Engagement | 2023 CPS Volunteering and Civic Life Supplement |
| Internet Frequency | Pew Research Center’s National Public Opinion Reference Survey (NPORS 2025) |
| Population Density | Claritas Pop-Facts Premier 2026 |
| Voter Registration | CPS 2024 Voting and Registration Supplement |
The margins of sampling error for the national sample of women ages 18 to 64 and reproductive age women ages 18 to 49 are plus or minus 2 percentage points. Numbers of respondents and margins of sampling error for key subgroups are shown in the table below. For results based on other subgroups, the margin of sampling error may be higher. Sampling error is only one of many potential sources of error and there may be other unmeasured error in this survey.
| Group | N (unweighted) | M.O.S.E. |
| National Women Ages 18-64 | 4,688 | ± 2 percentage points |
| White, non-Hispanic | 2,262 | ± 2 percentage points |
| Black, non-Hispanic | 767 | ± 4 percentage points |
| Hispanic | 1,135 | ± 4 percentage points |
| Asian or Pacific Islander | 347 | ± 6 percentage points |
| 18-25 | 508 | ± 5 percentage points |
| 26-35 | 1,313 | ± 3 percentage points |
| 36-49 | 1,715 | ± 3 percentage points |
| 50-64 | 1,152 | ± 3 percentage points |
| <200% FPL | 1,641 | ± 3 percentage points |
| 200%+ FPL | 2,707 | ± 2 percentage points |
| 200%-399% FPL | 1,232 | ± 3 percentage points |
| 400%+ FPL | 1,475 | ± 3 percentage points |
| Private | 2,876 | ± 2 percentage points |
| Employer-Sponsored | 2,490 | ± 2 percentage points |
| Individually Purchased | 386 | ±6 percentage points |
| Medicaid | 977 | ± 4 percentage points |
| Uninsured | 537 | ± 5 percentage points |
| Democrat/Democrat leaning | 2,267 | ± 3 percentage points |
| Independent | 628 | ± 5 percentage points |
| Republican/Republican leaning | 1,354 | ± 3 percentage points |
| National Women Ages 18-49 | 3,538 | ± 2 percentage points |
| White, non-Hispanic | 1,536 | ± 3 percentage points |
| Black, non-Hispanic | 620 | ± 5 percentage points |
| Hispanic | 944 | ± 4 percentage points |
| Asian or Pacific Islander | 304 | ± 6 percentage points |
| <200% FPL | 1,300 | ± 3 percentage points |
| 200%+ FPL | 1,949 | ± 3 percentage points |
| Private | 2,117 | ± 3 percentage points |
| Medicaid | 785 | ± 4 percentage points |
| Uninsured | 456 | ± 6 percentage points |
| Democrat/Democrat leaning | 1,752 | ± 3 percentage points |
| Independent | 496 | ± 5 percentage points |
| Republican/Republican leaning | 896 | ± 4 percentage points |
General Notes:
- Percentages may not add to 100%, or to subtotals indicated, due to rounding.
- The “No answer” category includes refusals and those who volunteered “don’t know” responses.
- The “Not sure” or “Don’t know” categories are only shown in tables when it was an explicit response option (i.e., shown on web or read via telephone) for survey respondents.
- A category with ‘(VOL.)’ signifies a response option was not shown or read via telephone for survey respondents.
- Insufficient sample size for analysis is denoted with “n/a” (e.g, FER4a). The sample size itself is shown, but the percentages are not.
- Some survey questions were asked of males and females based on sex assigned at birth, which is shown in the base text above each question. However, the topline tables show results based on current gender identity.
- Income is based on 2023 ASPE income levels. Two hundred percent (200%) of the federal poverty level (FPL) in 2023 for an individual was $29,160.
- The sample primarily includes English-speaking Asian adults and, therefore, may not be representative of the overall Asian adult population. Despite this limitation, it is important to report the views of Asian adults on the topics in this study. As always, Asian adults’ responses are incorporated into the general population figures throughout this report.