Implications of Potential Federal Medicaid Reductions for Addressing the Opioid Epidemic

Published: May 14, 2025

National opioid overdose deaths have declined since mid-2023 and provisional 2024 data suggest the decline is continuing. Despite recent improvements, opioids were still involved in over 79,000 deaths in 2023—well above pre-epidemic levels. The opioid epidemic’s impact remains widespread with nearly three in ten adults (29%) reporting in a 2023 KFF poll that they or a family member experienced an opioid addiction.

Medicaid provided coverage to nearly half (47%) of all nonelderly adults with opioid use disorder (OUD) in 2023, according to data from the National Survey on Drug Use and Health (NSDUH). State-level NSDUH data from 2021-2022 show even higher Medicaid coverage rates among adults with OUD in states that expanded Medicaid under the Affordable Care Act (ACA). In recent years, state Medicaid programs have also expanded access to OUD treatment and medications, which reduce the risk of overdose death.

The Trump administration’s opioid policies emphasize expanding access to medication treatment and naloxone. At the same time, the House and Senate are working on legislation to meet the requirements in the budget resolution, specifying cuts to Medicaid of up to $880 billion or more over 10 years. To meet the required federal budget cuts, a newly introduced House bill proposes a number of provisions that could affect Medicaid eligibility and coverage stability for adults with OUD including work requirements and increased eligibility determinations. Such changes would contribute to reductions in Medicaid enrollment and increases in the uninsured and would come at a tenuous moment for the opioid epidemic, as deaths have begun to decline, but future progress is not certain. Amid this evolving policy landscape, this brief analyzes Medicaid coverage and treatment of adults with OUD using data from NSDUH and Medicaid claims data.

Medicaid is the main source of coverage for adults with opioid use disorder and among those receiving treatment services.

Medicaid covers 47% of all nonelderly adults with OUD and is the primary coverage source among those receiving treatment services. Specifically, Medicaid covers over half (56%) of those receiving medication for opioid use disorder (MOUD) and roughly two-thirds (64%) of adults receiving outpatient treatment and peer support services (Figure 1). MOUD treatment, recommended by clinical guidelines, reduces risk of all-cause and overdose mortality.

Medicaid Covers Nearly Half of All Nonelderly Adults with Opioid Use Disorder and Most Adults Receiving Treatment

Most adults with OUD in Medicaid are eligible through Medicaid expansion.

Overall, 61% of adult Medicaid enrollees diagnosed with OUD—about 900,000 adults—are eligible through Medicaid expansion (Figure 2), with state-level rates ranging from 33% in Arkansas to 95% in Illinois (Appendix Table 1). In expansion states, over two-thirds of Medicaid enrollees with OUD qualify through ACA expansion (Figure 2), facilitating access to medication treatment and other care. A number of provisions in the House bill would affect the expansion group, including work requirements and cost sharing requirements. Such changes could lead to coverage losses or disruptions, including for adults with OUD, potentially limiting or interrupting access to treatment. Research indicates that MOUD treatment cessation is linked to significantly increased mortality risk, with individuals experiencing a six-fold higher mortality risk in the four weeks immediately after discontinuing treatment.

Over 6 in 10 Adult Medicaid Enrollees Diagnosed with OUD are Covered Through Medicaid Expansion Nationally

Other federal actions may also affect opioid response efforts.

The restructuring of Health and Human Services (HHS) by the Trump administration folds the Substance Abuse and Mental Health Services Administration (SAMHSA) into a new agency, reduces staff, and may eliminate certain opioid-focused programs. Additionally, the reported dismissal of the entire staff administering the NSDUH—a key source of national data collecting data for over 50 years about trends in mental health and substance use disorders—-could limit access to key data used to monitor and respond to the opioid crisis. The President’s discretionary budget request for 2026–which has not been adopted to date–proposes just over $1 billion in cuts to SAMHSA programs, including cuts to programs funding clean syringe exchanges and safe supplies. The discretionary budget decisions will be part of the budget appropriations process.

Methods

Medicaid Claims Data:This analysis used the 2021 T-MSIS Research Identifiable Files including  the inpatient (IP), long-term care (LT), other services (OT), and pharmacy (RX) claims files merged with the demographic-eligibility (DE) files to identify Medicaid expansion enrollees and those diagnosed with OUD and those who receive MOUD.

Identifying Opioid Use Disorder: OUD diagnoses were identified using an algorithm adapted from the Behavioral Health Service Algorithm (BHSA) reference codes provided by the Urban Institute. The BHSA identifies OUD using a combination of ICD-10 diagnosis codes, procedure codes, service codes, and National Drug Codes (NDCs) which are used to identify OUD and MOUD. Medication treatment (MOUD/MAT) includes medications that the FDA has approved for OUD treatment. (See: Victoria Lynch, Lisa Clemans-Cope, Doug Wissoker, and Paul Johnson. Behavioral Health Services Algorithm. Version 4. Washington, DC: Urban Institute, 2024.)

Enrollee Inclusion Criteria:Enrollees were included if they were ages 19-64, had full Medicaid or CHIP coverage for at least one month, and were not dually eligible for Medicare.

State Inclusion Criteria: To assess the usability of states’ data, the analysis examined quality assessments from the DQ Atlas for OT claims volume and OT managed care encounters and compared the share of adults diagnosed with any mental illness (AMI) in each states’ Medicaid data to estimates for adult Medicaid enrollees from the 2021-2022 restricted National Survey on Drug Use and Health (NSDUH). States were excluded if: (1) they received a “High Concern/ Unusable” rating on the relevant DQ Atlas assessment measure, and (2) their Medicaid estimate of AMI differed from the NSDUH estimate by more than 15.1 percentage points (the 75th percentile of all differences).

If at least 70% of a state’s Medicaid enrollees were covered by either managed care or by fee for service, only the corresponding DQ Atlas indicator was considered (i.e. managed care encounters volume or claims volume (FFS)). For states with more mixed delivery systems, both sets of indicators were considered; in these cases; a “High Concern/Unusable” rating on either measure, combined with a difference above 15.1 percentage points, led to exclusion. Based on these criteria, Mississippi was excluded, leaving 49 states and D.C. in the analysis.

Although Idaho and Virginia expanded Medicaid before 2021, their adult expansion enrollees primarily appear within the traditional adult eligibility group. Missouri is excluded due to its mid-2021 expansion. Consequently, these states are excluded from Figure 2.

National Survey on Drug Use and Health: This analysis uses data from the 2023 National Survey of Drug Use and Health (NSDUH), a nationally representative survey that, among other topics, collects information about symptoms of substance use disorders, including OUD. Respondents meet NSDUH’s OUD definition if they meet DSM-V criteria related to prescription opioids or heroin. Following NSDUH’s current methodology, individuals who misuse only fentanyl are not included in the OUD treatment definition; sensitivity analyses indicate that this exclusion minimally affects results (adding 10 observations) and does not meaningfully alter rates reported in Figure 2. Consistent with NSDUH’s approach to calculating SUD treatment rates among those needing treatment, the denominator includes respondents receiving outpatient therapy for OUD or prescription medication for OUD (MOUD).

Medicaid-Enrolled Adults Diagnosed with Opioid Use Disorder (OUD), Covered Through Medicaid Expansion

The President’s Malaria Initiative and Other U.S. Government Global Malaria Efforts

Published: May 13, 2025

Note: This fact sheet largely reflects activities prior to the second Trump administration, which has issued numerous executive actions that directly affect global health efforts, and has been updated to highlight key recent actions that may affect PMI and other U.S. global malaria efforts. See also the KFF fact sheet on the Trump administration’s foreign aid review and the status of PMI.

Key Facts

  • About half of the world’s population is at risk of being infected with malaria. In 2023, there were an estimated 263 million cases of malaria and 597,000 deaths from malaria worldwide. Sub-Saharan Africa is the hardest hit region in the world.
  • While gains have been made over the past two decades in increasing access to malaria prevention and treatment, many challenges (including drug and insecticide resistance and climate change impacts) continue to complicate malaria control efforts in hard-hit areas. Recently, in promising developments, the first malaria vaccine was recommended in 2021 by the World Health Organization (WHO) for widespread use in children, and its broader rollout began in 2023. Additionally, in late 2023, WHO recommended a second malaria vaccine. These vaccines are now being rolled-out across Africa in routine childhood immunization programs.
  • The U.S. government (U.S.) has been involved in global malaria activities since the 1950s and, today, is the largest donor government to global malaria efforts.
  • U.S. malaria efforts include activities primarily through the U.S. President’s Malaria Initiative (PMI) that is overseen by the U.S. Global Malaria Coordinator, as well as through other U.S. activities; collectively, the U.S. reaches approximately 30 countries.
  • U.S. funding for malaria control efforts and research activities was approximately $1 billion in FY 2025, up from $873 million in FY 2016. Additionally, the U.S. is the largest donor to the Global Fund to Fight AIDS, Tuberculosis and Malaria (Global Fund), which in turn is the largest overall funder of malaria efforts in the world.
  • As the Trump administration reorganizes foreign assistance (and Congress considers whether to approve these changes), including dissolving the U.S. Agency for International Development (USAID) – the lead implementer of PMI, its impact on the future of U.S. global malaria efforts remains to be seen.

Global Situation1 

Malaria is one of the world’s most common and serious tropical diseases, with about half the world’s population at risk of being infected with malaria. Although preventable and treatable, malaria causes significant morbidity and mortality, with the greatest numbers of cases and deaths in resource-poor regions and among young children.2 

Malaria: an infectious disease caused by certain Plasmodium parasites, which are transmitted to humans by Anopheles mosquitoes. This mosquito thrives in warm, tropical, and subtropical climates. Infection with malaria parasites can cause common symptoms like fever, chills, and flu-like illness and lead to anemia, causing severe malaria disease and sometimes death. When the infected parasites clog small blood vessels in the brain, causing cerebral malaria, it can also be fatal.3 

Strategies and efforts to address malaria have evolved over time, with global eradication efforts waning in the 1970s, resulting in rising rates.4  In the late 1990s, malaria began to receive renewed attention, particularly after the 1998 creation of the Roll Back Malaria Partnership (RBM), now referred to as the RBM Partnership to End Malaria.5  In 2000, all nations agreed to global malaria targets as part of Millennium Development Goal 6 (combat HIV/AIDS, malaria, and other diseases). Since then, expanded efforts by the U.S. government, other donor governments, multilateral institutions, and affected countries have helped to increase access to malaria prevention and treatment and reduce cases and deaths, and there has been, at times, discussion of the possibility of finally eradicating the disease.6 

Today global malaria activities are focused on sustaining, improving, and expanding efforts to control the disease. Still, the rate of progress has stalled in some countries recently, and many challenges continue to complicate malaria control efforts in countries with ongoing malaria transmission, including poverty, poor sanitation, weak health systems, limited disease surveillance capabilities, natural disasters, armed conflict, migration, climate change, and the presence of counterfeit and/or sub-standard antimalarial drugs.7 

Morbidity and Mortality8 

  • WHO estimates that there were approximately 263 million cases of malaria and 597,000 deaths, mostly among children under the age of five, in 2023. Overall, substantial scale-up of malaria interventions helped reduce the malaria case incidence and death rates over the past two decades, though case incident rates were slightly higher in 2023 than in 2022 due to increased rates in some countries.
  • Multidrug-resistant malaria is a widespread and recurring problem, and while highly-effective artemisinin-based combination therapies (ACTs) have been introduced to treat drug-resistant strains, evidence suggests ACT resistance is occurring in parts of Asia and Africa.9  Resistance to insecticides has emerged as a problem in Africa, the Americas, Eastern Mediterranean, South-East Asia, and the Western Pacific.10 
  • Certain groups, particularly pregnant women and children, are more vulnerable. Making up 76% of all malaria deaths in the Africa region, children under five are especially at-risk of malaria infection, because they lack developed immune systems to protect against the disease. Other high-risk groups include people living with HIV/AIDS, travelers, refugees, displaced persons, and migrant workers entering endemic areas.

Interventions

Malaria control efforts involve a combination of prevention and treatment strategies and tools, such as:

  • insecticide-treated bed nets (ITNs),11 
  • indoor residual spraying (IRS) with insecticides,
  • diagnosis and treatment with antimalarial drugs, particularly artemisinin-based combination therapies (ACTs),12 
  • intermittent preventive treatment in pregnancy (IPTp, a drug treatment for pregnant women that prevents complications from malaria for a woman and her unborn child),
  • perennial malaria chemoprevention (PMC, formerly called intermittent preventive treatment in infants (IPTi), a drug treatment aimed at reducing adverse effects of malaria in children belonging to age groups at high risk of severe malaria), and
  • seasonal malaria chemoprevention (SMC, a treatment course administered at monthly intervals to children belonging to age groups at high risk of severe malaria during the high malaria transmission season).

More recently, in 2021, WHO recommended, and in 2022 prequalified, the first malaria vaccine (RTS,S/AS01 or RTS,S) and in 2023 recommended and prequalified a second malaria vaccine (R21/Matrix-M or R21), both of which have been shown to be safe and effective in preventing malaria in children during clinical trials.13  As of December 2024, 17 countries that represent approximately 70% of the global malaria burden offered these vaccines through routine childhood immunization programs, and more are planning to introduce or scale them up.14  Roll-out of these vaccines will depend on financing and country decisions about whether to adopt the vaccines as part of their national malaria control strategies, among other things.

Access to prevention and treatment services has grown over time, as ITN coverage has increased and the number of ACT treatments procured by the public and private sectors has expanded substantially.15 

Global Goals

Since the late 1990s, new initiatives and financing mechanisms have helped increase attention to malaria and contributed to efforts to achieve global goals; these include the RBM Partnership to End Malaria, a global framework established in 1998 for coordinating malaria efforts among donor governments, major UN agencies, international organizations, and affected countries, among others; and the Global Fund to Fight AIDS, Tuberculosis and Malaria (Global Fund), an independent, international financing institution established in 2001 that provides grants to countries to address TB, HIV, and malaria (see the KFF fact sheet on the U.S. and the Global Fund).16 

These and other efforts work toward achieving major global malaria goals that have been set through:

  • Sustainable Development Goals (SDGs). Adopted in 2015, the SDGs aim to end the malaria epidemic by 2030 under SDG Goal 3, which is to “ensure healthy lives and promote well-being for all at all ages.”17 
  • Global Technical Strategy for Malaria (GTS). Developed in close alignment with the RBM Partnership and adopted by the World Health Assembly in 2015, the GTS includes the goals of reducing malaria incidence and mortality rates by at least 90% by 2030, eliminating the disease in at least 35 new countries, and preventing the disease’s re-establishment in countries that are malaria free.

With these goals, the GTS sets out a vision for countries to accelerate progress towards malaria elimination, and globally, more countries are moving towards elimination. Since 2000, 26 countries (Algeria, Argentina, Armenia, Azerbaijan, Belize, Cabo Verde, China, Egypt, El Salvador, Georgia, Iran, Iraq, Kazakhstan, Kyrgyzstan, Malaysia, Maldives, Morocco, Oman, Paraguay, Sri Lanka, Syrian Arab Republic, Tajikistan, Turkey, Turkmenistan, United Arab Emirates, and Uzbekistan) have attained three consecutive years of zero indigenous malaria cases and are therefore recognized as having eliminated the disease.18  In 2023, of 83 malaria-endemic countries, 47 countries worldwide were reported to have been nearing elimination.19  Most recently, in March 2024, WHO along with Ministers of Health in Africa and other partners convened a Malaria Ministerial Conference and signed a declaration committing to accelerating action to end deaths from malaria.20 

The U.S. Government

Involved in global malaria activities since the 1950s, the U.S. government (U.S.) is the largest government donor to malaria efforts.21  It is also the largest donor to the Global Fund, which in turn is the largest overall funder of malaria efforts in the world.22 

History

The U.S. government’s international response to malaria began in the 1950s through activities at the U.S. Centers for Disease Control and Prevention (CDC) and U.S. Agency for International Development (USAID); early efforts focused on technical assistance but also included some direct financial support for programs overseas.

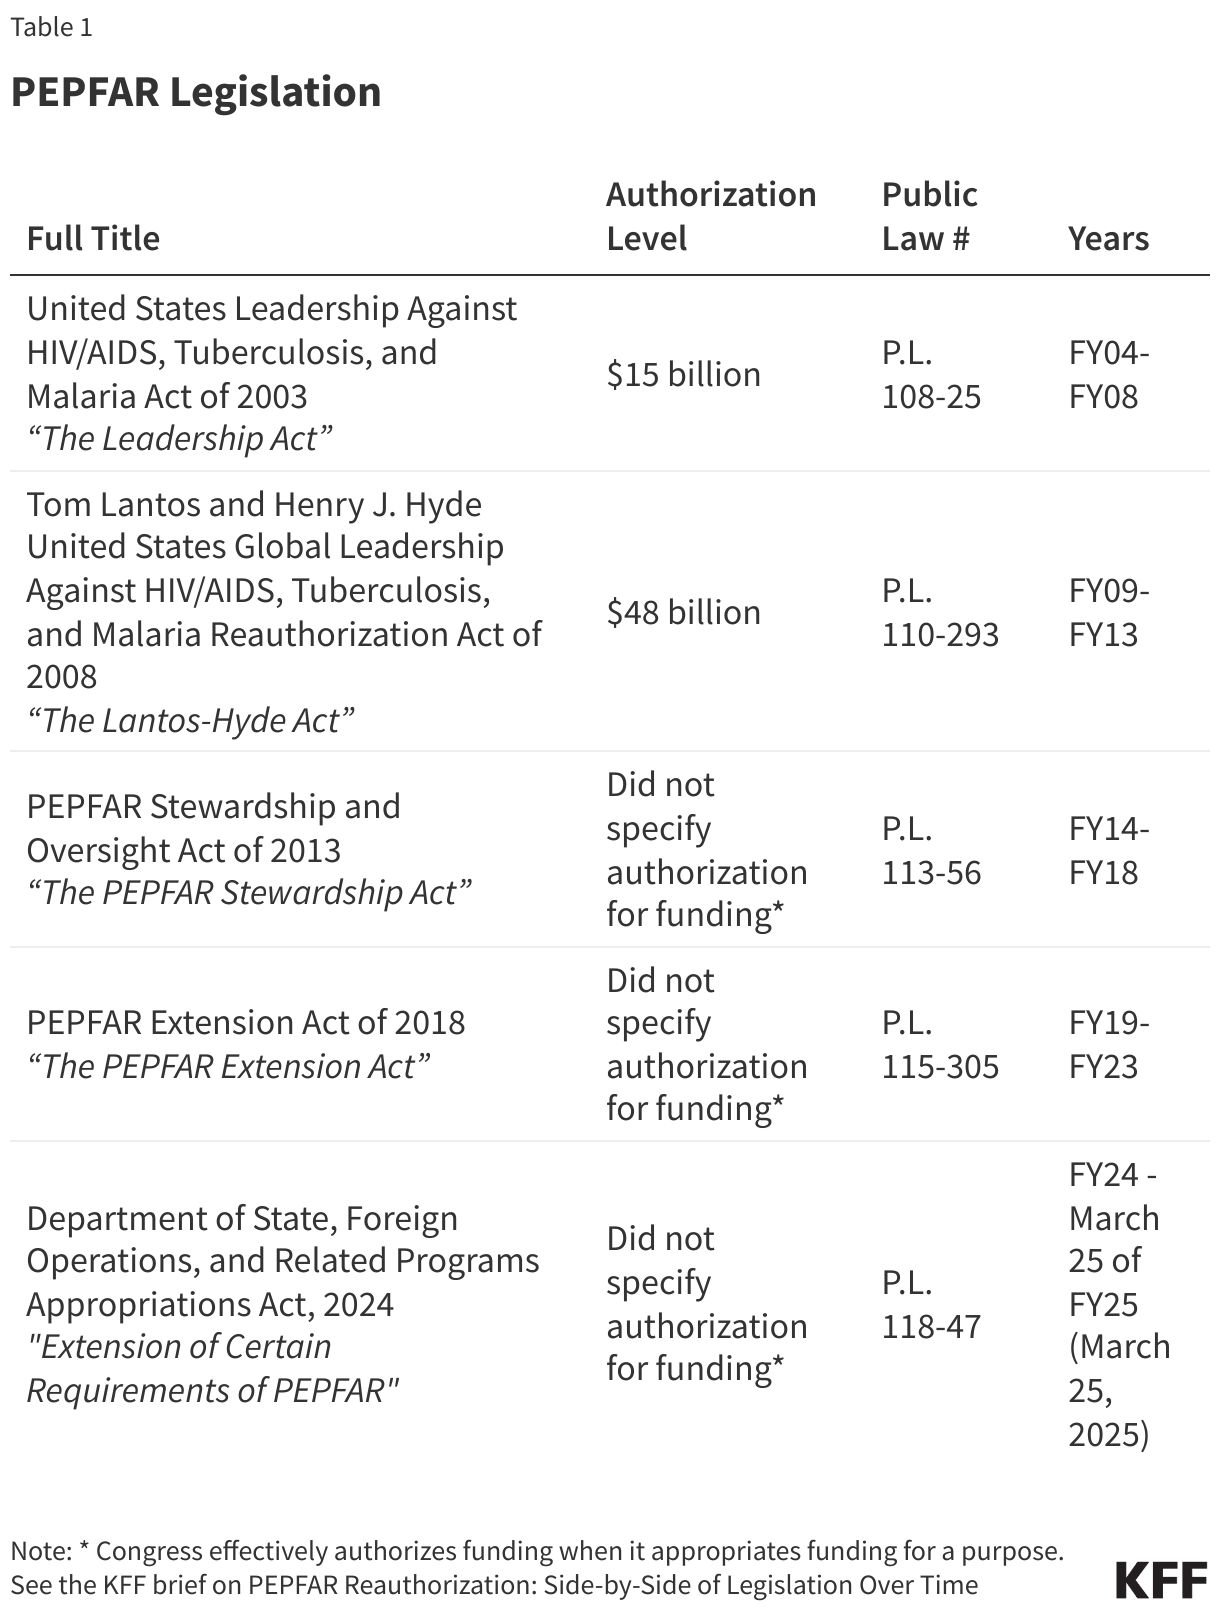
Since the early 2000s, the U.S. has assigned a heightened priority to and provided greater funding for bilateral and multilateral malaria efforts. In 2003, the U.S. Leadership Against HIV/AIDS, Tuberculosis, and Malaria Act of 2003 (the legislation that created PEPFAR, the expanded U.S. government response to global AIDS) authorized five years of funding for bilateral malaria efforts and the Global Fund. In 2005, the U.S. launched the President’s Malaria Initiative (PMI), a five-year effort to address malaria in 15 hard-hit African countries, which has since been extended and expanded. In 2008, the Lantos-Hyde U.S. Global Leadership Against HIV/AIDS, Tuberculosis, and Malaria Reauthorization Act of 2008 (which reauthorized PEPFAR) authorized another five years of funding and codified the position of the U.S. Global Malaria Coordinator.23  More recently, in 2021, the U.S. released its PMI strategy for 2021-2026, which outlines its goals as well as its approach to achieving them by 2026.24  (See the KFF fact sheet on PEPFAR, the KFF fact sheet on the Global Fund, the KFF brief on PEPFAR reauthorization legislation, and the KFF dashboard monitoring progress toward global malaria targets in PMI countries.)

Organization and Goals

President’s Malaria Initiative (PMI)25 

Launched in 2005, the President’s Malaria Initiative (PMI) is an interagency initiative to address global malaria that was, until its recent dissolution, led by USAID and implemented in partnership with CDC. It is overseen by the U.S. Global Malaria Coordinator, who is appointed by the President and reports to the USAID Administrator, and an Interagency Advisory Group made up of representatives from USAID, CDC, the National Institutes of Health (NIH), the Department of Defense (DoD), the State Department, the Peace Corps, the National Security Council, and other U.S. government agencies.26  USAID has served as the lead implementing agency for U.S. global malaria efforts, primarily through PMI, with other agencies also carrying out malaria activities. Collectively, prior to the second Trump administration, U.S. bilateral activities reached approximately 30 countries.27  Now, as the Trump administration reorganizes foreign assistance (and Congress considers whether to approve these changes), having dissolved USAID, it is unclear whether it will integrate any remaining USAID global health activities, including PMI, into the State Department, and what the future holds for PMI. See the KFF fact sheet on the status of malaria efforts.

Goals

In 2021, the U.S. released the President’s Malaria Initiative Strategy 2021-2026; its goals include:

  • reducing malaria mortality by one-third from 2015 levels in high-burden PMI-supported countries, 28 
  • achieving a greater than 80% reduction from PMI’s original 2000 baseline levels,
  • reducing malaria morbidity in PMI-supported countries with high and moderate malaria burden by 40% from 2015 levels,29  and
  • assisting at least ten PMI-supported countries to meet the WHO criteria for national or sub-national elimination and at least one country in the Greater Mekong subregion to reach national elimination.

The strategy also states that these efforts contribute to longer term goals, such as elimination of malaria in a growing number of countries, and aligns with global priorities.30 

Key Activities31 

Prior to the current administration, PMI activities focused on expanding access to and the use of six key malaria control interventions: insecticide-treated bed nets (ITNs), indoor residual spraying (IRS) with insecticides, entomological monitoring, intermittent preventive treatment in pregnancy (IPTp),32  diagnosis of malaria and treatment with artemisinin-based combination therapies (ACTs), and seasonal malaria chemoprevention (SMC).33 

They also included a range of malaria control activities, including technical assistance to affected countries, monitoring and evaluation, supply chain management, and commodity procurement (since the start of PMI, U.S. support for commodities, such as ITNs, insecticides, and antimalarial drugs, like ACTs, has increased significantly34 ). Additionally, PMI supported activities in the following areas: behavior change communication, health systems strengthening, monitoring and evaluation, operational research, elimination, and community health.35 

USAID had also supported regional efforts in Latin America and the Caribbean, including providing technical assistance to support countries in tailoring their approaches for malaria control through its Amazon Malaria Initiative.36  CDC provided technical assistance to these regional efforts and was also designated as the WHO Collaborating Center for Prevention and Control of Malaria,37  though with the Trump administration’s announcement that the U.S. would withdraw from WHO, the future of this partnership remains an open question. It also remains to be seen how recent announcements of global health reductions at CDC could further affect malaria efforts.

Additionally, NIH and DoD have been involved in malaria research and development (R&D). NIH is the lead agency for U.S. malaria R&D efforts (including its International Centers of Excellence for Malaria Research program, which established a global network of malaria research centers in 2010 to support research activities in malaria-endemic countries).38  DoD also supports extensive R&D efforts as well as worldwide malaria disease surveillance, and technical assistance and capacity building with local partners.39   The future of U.S. support for these efforts is uncertain as the Trump administration reduces and eliminates foreign research grants.

Countries Reached

Prior to the current administration, PMI spanned 27 sub-Saharan African “focus countries” (gradually scaled up from three countries in FY 2006), as well as three countries in Southeast Asia under the PMI Greater Mekong Subregion regional initiative.40  Focus countries were selected based on the following criteria:41 

  • high malaria burden,
  • alignment of National Malaria Control Plan (NMCP) with WHO standards,
  • country capacity to implement national control policies,
  • willingness to partner with the US in fighting malaria, and
  • involvement of other international donors (e.g., Global Fund; World Bank).

Both USAID and CDC stationed staff in each PMI focus country, though USAID staff are or have been recalled to the U.S. due to the Trump administration’s dissolution of USAID and reorganization of foreign assistance.

Beyond PMI, the Amazon Malaria Initiative spanned several countries in Latin America and the Caribbean, and other U.S. activities may reach more countries. For example, CDC and USAID have carried out activities in additional countries in sub-Saharan Africa, the Caribbean, and Asia.42 

Multilateral Efforts

The U.S. partners with international institutions and supports global malaria funding mechanisms. Key partners include the World Health Organization (although the second Trump administration immediately announced the U.S. would withdraw as a member of and halt funding to WHO), the RBM Partnership, and the World Bank. Additionally, the U.S. government is the largest donor to the Global Fund, which has approved over $22 billion in funding for malaria programs worldwide and is the largest overall funder of global malaria efforts.43 

Funding44 

U.S. funding for malaria, which is specified by Congress in annual appropriations bills and includes support for PMI as well as other malaria control efforts and research activities, has increased over the past decade from $873 million in FY 2016 to approximately $1 billion in FY 2025; while funding increased over the period, it has been relatively flat in recent years (see figure for the latest information). Additional U.S. support for malaria activities is provided through its contribution to the Global Fund. (See the KFF fact sheet on the U.S. Global Health Budget: Malaria/PMI and the KFF budget tracker for more details on historical appropriations for U.S. global malaria efforts.)

Most U.S. bilateral funding for malaria has been provided through the Global Health Programs account at USAID with additional funding provided through NIH, CDC, and DoD. The majority of U.S. malaria funding has been directed to PMI focus countries, with additional funding directed to other bilateral and regional malaria efforts as well as malaria research activities.

U.S. Funding for Global Malaria, FY 2016 - FY 2025
  1. WHO, World Malaria Report 2024, 2024. ↩︎
  2. WHO, World Malaria Report 2024, 2024. WHO, “Malaria fact sheet,” webpage, Dec. 2024, https://www.who.int/en/news-room/fact-sheets/detail/malaria. ↩︎
  3. CDC Malaria website, https://www.cdc.gov/malaria/hcp/clinical-features/ ↩︎
  4. M. Tanner, D. de Savigny, “Malaria Eradication Back on the Table,” Bulletin of WHO, Vol. 86, No. 2, 2008. ↩︎
  5. Launched by the World Health Organization, the United Nations Children’s Fund, the United Nations Development Programme, and the World Bank as “an effort to provide a coordinated global response to the disease.” RBM Partnership to End Malaria, “RBM Partnership to End Malaria Overview,” webpage, https://endmalaria.org/about-us/overview1. ↩︎
  6. M. Tanner, D. de Savigny, “Malaria Eradication Back on the Table,” Bulletin of WHO, Vol. 86, No. 2, 2008; WHO, World Malaria Report 2024, 2024. ↩︎
  7. WHO, World Malaria Report 2024, 2024; M. Tanner and D. de Savigny, “Malaria Eradication Back on the Table,” Bulletin of WHO, Vol. 86, No. 2, 2008; RBM, The Global Malaria Action Plan, 2008; K. Senior, “Climate Change and Infectious Disease: A Dangerous Liaison?”, The Lancet. Vol. 8, No. 2,  2008; CDC, “Preventing Malaria While Traveling,” webpage, https://www.cdc.gov/malaria/prevention/index.html. ↩︎
  8. WHO, World Malaria Report 2024, 2024; WHO, “Malaria fact sheet,” webpage, Dec. 2024, https://www.who.int/en/news-room/fact-sheets/detail/malaria. ↩︎
  9. WHO, World Malaria Report 2024, 2024; Global Plan for Artemisinin Resistance Containment (GPARC), 2011; Emergency Response to Artemisinin Resistance in the Greater Mekong Subregion: Regional Framework for Action 2013-2015, April 2013; Status report on artemisinin resistance and ACT efficacy, December 2019, accessed here: https://apo.who.int/publications/i/item/status-report-on-artemisinin-resistance-and-act-efficacy; “Malaria: Artemisinin partial resistance” webpage, https://www.who.int/news-room/questions-and-answers/item/artemisinin-resistance. WHO, Strategy to respond to antimalarial drug resistance in Africa, 2022. ↩︎
  10. To address insecticide resistance, the WHO issued updated guidance in 2023 recommending the use of dual active ingredient ITNs. WHO, Press release: WHO publishes recommendations on two new types of insecticide-treated nets, March 2023. ↩︎
  11. In 2023, WHO published recommendations on two new types of dual active ingredient insecticide-treated mosquito nets, designed to provide greater protection against malaria than previously recommended nets. WHO, World Malaria Report 2024, 2024. ↩︎
  12. For a detailed description of WHO’s recommendations on the use of drugs to prevent malaria in high-risk groups, please see WHO’s Guidelines for Malaria. WHO, Guidelines for Malaria, March 2023. ↩︎
  13. Vaccines that are added to WHO’s prequalification list are endorsed by WHO as having gone through comprehensive evaluation to determine that the vaccine is safe and effective. WHO, Press release: WHO recommends groundbreaking malaria vaccine for children at risk, October 2021. WHO, Press release: WHO recommends R21/Matrix-M vaccine for malaria prevention in updated advice on immunization, October 2023. WHO, Press release: WHO prequalifies a second malaria vaccine, a significant milestone in prevention of the disease, December 2023. ↩︎
  14. WHO, Press release: Life-saving malaria vaccines reach children in 17 endemic countries in 2024, December 2024. ↩︎
  15. WHO, Malaria Prevention Works: let’s close the gap, April 2017. WHO, World Malaria Report 2024, 2024. ↩︎
  16. RBM Partnership to End Malaria website, https://endmalaria.org/; Global Fund website, https://www.theglobalfund.org/en/. ↩︎
  17. UN, Transforming our world: the 2030 Agenda for Sustainable Development, 2015. ↩︎
  18. WHO, World Malaria Report 2024, 2024. ↩︎
  19. Countries that were malaria endemic in 2000 and reported fewer than 10,000 malaria cases are said to be “nearing elimination.” WHO, World Malaria Report 2024, 2024. ↩︎
  20. WHO, Press release: African health ministers commit to end malaria deaths, March 2024. ↩︎
  21. WHO, World Malaria Report 2024, 2024. ↩︎
  22. KFF: Global Financing for Malaria: Trends & Future Status, 2014; Mapping the Donor Landscape in Global Health: Malaria, 2013; World Malaria Report 2024, 2024. KFF analysis of OECD DAC CRS database, February 2025. ↩︎
  23. U.S. Congress, Public Law 108-25, May 27, 2003; U.S. Congress, Public Law 110-293, July 30, 2008. ↩︎
  24. The PMI 2021-2026 strategy is an update to PMI’s 2015-2020 strategy. PMI, U.S. President’s Malaria Initiative Strategy 2021-2026, October 2021. ↩︎
  25. PMI website, https://www.pmi.gov/; USAID, “The President’s Malaria Initiative,” fact sheet, May 2023; PMI, The President’s Malaria Initiative: Eighteenth Annual Report to Congress, 2024; PMI, FY 2017 Greater Mekong Subregion Malaria Operational Plan, 2017; CDC, “President’s Malaria Initiative,” webpage, https://www.cdc.gov/malaria/malaria_worldwide/cdc_activities/pmi.html. ↩︎
  26. PMI. “Leadership” webpage, accessed: https://www.pmi.gov/about-us/#leadership. ↩︎
  27. KFF analysis of data from the U.S. Foreign Assistance Dashboard website, www.foreignassistance.gov, accessed February 2025. PMI, Eighteenth Annual Report to Congress, 2024. CDC, “Malaria’s Global Malaria Activities” webpage, https://www.cdc.gov/malaria/malaria_worldwide/cdc_activities/index.html. ↩︎
  28. The countries targeted by PMI that are considered high burden include Angola, Benin, Burkina Faso, Cameroon, Côte d’Ivoire, Democratic Republic of the Congo, Ghana, Guinea, Liberia, Mali, Mozambique, Niger, Nigeria, and Sierra Leone. PMI, President’s Malaria Initiative Strategy 2021-2026, 2021. ↩︎
  29. The countries targeted by PMI that are considered moderate burden include Madagascar, Malawi, Tanzania, Uganda, and Zambia. PMI, President’s Malaria Initiative Strategy 2021-2026, 2021. ↩︎
  30. PMI, President’s Malaria Initiative Strategy 2021-2026, 2021. ↩︎
  31. PMI, “What We Do,” webpage, https://www.pmi.gov/what-we-do/. ↩︎
  32. Another preventive treatment includes PMC in countries where that treatment is relevant. To date only Sierra Leone has prioritized PMC for PMI support in their NMCPs. PMI, President’s Malaria Initiative Technical FY 2024 Guidance. ↩︎
  33.   SMC is only recommended for geographic regions where the malaria transmission season is four months or less. PMI, President’s Malaria Initiative Technical FY 2024 Guidance. ↩︎
  34. PMI, “Malaria Operational Plans,” webpage, https://www.pmi.gov/resources/malaria-operational-plans-mops/. ↩︎
  35. PMI, “What We Do,” webpage, https://www.pmi.gov/what-we-do/. ↩︎
  36. USAID, “Malaria: Countries,” webpage, https://www.usaid.gov/global-health/health-areas/malaria/countries. CDC, “CDC’s Global Malaria Activities” webpage, https://www.cdc.gov/malaria/malaria_worldwide/cdc_activities/index.html. ↩︎
  37. CDC, “CDC’s Malaria Program,” fact sheet, 2023. ↩︎
  38. NIAID: “Malaria,” webpage, https://www.niaid.nih.gov/diseases-conditions/malaria; “International Centers of Excellence for Malaria Research (ICEMR),” webpage, https://www.niaid.nih.gov/research/excellence-malaria-research. ↩︎
  39. KFF, The Department of Defense and Global Health: Infectious Disease Efforts, 2013. ↩︎
  40. In September 2017, PMI announced the addition of five new focus countries, bringing the number of PMI programs to 24 in sub-Saharan Africa. PMI. Press release: PMI Launches and Expands in West and Central Africa, September 2017; In April 2023, PMI announced its intention to expand to three more sub-Saharan African countries, increasing the total number of partner countries reached to 30 (27 in Sub-Saharan Africa and 3 in the Greater Mekong Region); the three additional countries include Burundi, The Gambia, and Togo. PMI, U.S. President’s Malaria Initiative Announces Plans to Expand to New Partner Countries, April 2023; PMI, “Where We Work,” webpage, https://www.pmi.gov/where-we-work/. ↩︎
  41. PMI, 2011 PMI Fifth Annual Report, April 2011. ↩︎
  42. CDC, “CDC’s Global Malaria Activities,” webpage, https://www.cdc.gov/malaria/malaria_worldwide/cdc_activities/index.html. ↩︎
  43. Global Fund, Global Fund Data Explorer: https://data.theglobalfund.org/; accessed October 2024. KFF analysis. ↩︎
  44. KFF analysis of data from the Office of Management and Budget, Agency Congressional Budget Justifications, Congressional Appropriations Bills, and the U.S. Foreign Assistance Dashboard website, www.foreignassistance.gov. ↩︎

The U.S. President’s Emergency Plan for AIDS Relief (PEPFAR)

Published: May 13, 2025

Note: This fact sheet largely reflects activities prior to the second Trump administration, which has issued numerous executive actions that directly affect global health efforts, and has been updated to highlight key recent actions that may affect PEPFAR. See also the KFF fact sheet on the Trump administration’s foreign aid review and the status of PEPFAR.

Key Facts

  • Although the U.S. has been involved in efforts to address the global AIDS crisis since the mid-1980s, the creation of the President’s Emergency Plan for AIDS Relief (PEPFAR) in 2003 marked a significant increase in funding and attention to the epidemic. Now, 20 years in, PEPFAR reports saving an estimated 26 million lives and is currently providing HIV prevention and treatment services to millions.
  • PEPFAR is the largest commitment by any nation to address a single disease in the world, credited with not only saving millions of lives but also helping to change the trajectory of the global HIV epidemic.
  • PEPFAR funding is comprised of U.S. bilateral funding and U.S. contributions to multilateral organizations addressing HIV, primarily the Global Fund to Fight AIDS, Tuberculosis and Malaria (Global Fund).1 
  • To date, U.S. funding for PEPFAR has totaled over $120 billion, growing from $1.9 billion in FY 2004 to $6.5 billion in FY 2025; FY 2025 funding, which Congress provided through a continuing resolution, includes $4.8 billion provided for bilateral HIV efforts and $1.7 billion for multilateral efforts ($50 million for UNAIDS and $1.65 billion for the Global Fund).2 
  • PEPFAR has been reauthorized by Congress four times, most recently in March 2024 for one year. Although that authorization expired on March 25, 2025, PEPFAR is a permanent part of U.S. law and, other than a set of eight time-bound provisions, continues as long as Congress appropriates funding for the program.
  • More broadly, PEPFAR is – for the first time in its two-decade history – facing significant challenges that could impede its ability to fulfill its mission. The Trump administration has instituted a review of all foreign assistance, including for PEPFAR, as well as a funding freeze. These actions have already resulted in significant disruption and limitation of PEPFAR’s scope and services, and it is unknown whether the administration will recommend further changes to PEPFAR and how or if Congress will respond to these recommendations.

Global Situation

HIV, the virus that causes AIDS (“acquired immunodeficiency syndrome” or Advanced HIV Disease), has become one of the world’s most serious health and development challenges. Today, there are approximately 39.9 million people living with HIV, and tens of millions of people have died of AIDS-related causes since the beginning of the epidemic (see the KFF fact sheet on the global HIV epidemic).3 

Box 1: Snapshot of Global Epidemic Today

  • Number of people living with HIV: 39.9 million
  • Number of people newly infected with HIV: 1.3 million
  • Number of AIDS-related deaths: 630,000
  • Number of people with HIV on treatment: 30.7 million

Notes: Reflects 2023 data.

U.S. Government Efforts

Although the U.S. has been involved in efforts to address the global HIV/AIDS crisis since the mid-1980s,4  the creation of the President’s Emergency Plan for AIDS Relief (PEPFAR) in 2003 marked a significant increase in funding and attention to the epidemic.5  PEPFAR, the U.S. government’s global effort to combat HIV and the largest global health program devoted to a single disease, is credited with saving millions of lives and helping to change the trajectory of the global HIV epidemic. It was announced in January 2003 during President George W. Bush’s State of the Union and authorized by Congress that same year through the Leadership Act (see Table 1). The Leadership Act governs PEPFAR’s HIV response, as well as U.S. participation in the Global Fund (an independent, international multilateral financing institution that provides grants to countries to address HIV, TB, and malaria) and bilateral assistance for TB and malaria programs.6  Congress has updated, extended, and made changes to the program through the Lantos-Hyde Act of 2008, the PEPFAR Stewardship Act of 2013, the PEPFAR Extension Act of 2018, and more recently, a short-term reauthorization of PEPFAR that extended certain timebound provisions through late March 2025, when they were allowed to lapse (see Table 1 and the KFF brief on PEPFAR reauthorization legislation over time). This short term reauthorization signaled a departure from the program’s long history of strong bipartisan support across multiple Congresses and administrations when, in an increasingly partisan environment, it was caught up in the broader U.S. political debate over abortion (see the KFF brief on PEPFAR’s short term reauthorization). This and other rapidly-evolving developments, including the Trump administration’s review of foreign assistance, has introduced significant uncertainty about PEPFAR’s future, including its reauthorization prospects, although PEPFAR is a permanent part of U.S. law and will continue as long as Congress continues to provide funding to it.

PEPFAR Legislation

Organization

PEPFAR’s original authorization established new structures and authorities, consolidating all U.S. bilateral and multilateral activities and funding for global HIV/AIDS. Several U.S. agencies, host country governments, and other organizations are involved in implementation.7 

PEPFAR is overseen by the U.S. Global AIDS Coordinator, who is appointed by the President, confirmed by the Senate, and reports directly to the Secretary of State, as established through PEPFAR’s authorizing legislation.8  The Coordinator holds the rank of Ambassador and leads the Office of the Global AIDS Coordinator (OGAC) at the Department of State.9  The Coordinator has primary responsibility for the oversight and coordination of all U.S. global HIV activities and funding across multiple U.S. implementing agencies and departments. In addition, the Coordinator serves as the U.S. Government’s board member to the Global Fund (the U.S. Government holds a permanent seat on the Global Fund’s Board). The Coordinator is dual-hatted as the U.S. Special Representative for Global Health Diplomacy and also leads the broader Bureau of Global Health Security and Diplomacy, which brings together PEPFAR with global health security and global health diplomacy functions.10  Currently, the President has not yet nominated a Coordinator and it is unclear when or whether someone will be nominated.

In addition to the Department of State, other implementing departments and agencies for HIV activities include: the U.S. Agency for International Development (USAID), PEPFAR’s largest government implementing agency (the Trump administration has moved to dissolve USAID, creating uncertainty about how PEPFAR’s implementation will be managed by the U.S. government going forward); the Department of Health and Human Services, primarily through the Centers for Disease Control and Prevention (CDC); the Departments of Labor, Commerce, and Defense (DoD); and the Peace Corps.11  As the Trump administration continues its review of foreign assistance and pursues reorganization of global health programs, Congress has yet to weigh in and it is unclear what the future of PEPFAR will look like.

Key Activities and Results

PEPFAR reports saving an estimated 26 million lives and its activities have focused on expanding access to HIV prevention, treatment, and care interventions. These have included provision of antiretroviral treatment, pre-exposure prophylaxis, voluntary male circumcision, condoms, and other commodities related to HIV services (see Table 2).12 ,13  In addition, PEPFAR has launched specific initiatives in key strategic areas. For example, in 2015, PEPFAR launched DREAMS, a public-private partnership that aims to reduce HIV infections in adolescent girls and young women.

The latest results reported by PEPFAR indicate that it has:

  • supported testing services for 83.8 million people in FY 2024;
  • prevented 7.8 million babies from being born with HIV, who would have otherwise been infected;
  • provided care for more than 6.6 million orphans, vulnerable children (OVC), and their caregivers;
  • supported training for nearly 342,000 new health care workers; and
  • supported antiretroviral treatment for 20.6 million people.14 

Additionally, it reports that PEPFAR reached 2.3 million adolescent girls and young women with HIV prevention services in FY 2024, and new diagnoses among this population have declined, with the higher rate of initiation of pre-exposure prophylaxis (PrEP) to prevent HIV infection in countries implementing the DREAMS initiative compared to areas without DREAMS programming.15  The Trump administration’s foreign aid review and funding freeze have limited PEPFAR’s activities to those defined in a limited waiver, significantly scaling back PEPFAR’s scope to what the waiver defines as “life-saving HIV services,” which include only certain activities: HIV treatment and care, prevention of mother-to-child transmission (PMTCT), pre-exposure prophylaxis (PrEP) for pregnant and breastfeeding women, and HIV testing.

Key PEPFAR-Funded HIV Interventions

Countries Reached

Historically, PEPFAR bilateral programs were carried out in more than 50 countries.16  Additional countries are reached through U.S. contributions to the Global Fund. PEPFAR currently requires 25 countries17  and the Asia, Western Hemisphere, and West Africa regional programs to develop “Country Operational Plans” (COPs) and “Regional Operational Plans” (ROPs), respectively, to document annual investments and anticipated results.18  OGAC reviews and the Global AIDS Coordinator approves COP/ROPs.

Funding19 

Total PEPFAR funding20  includes bilateral funding for HIV activities conducted by U.S. implementing agencies as well as U.S. contributions to the Global Fund and UNAIDS,21  as specified by Congress for PEPFAR in annual appropriations bills.22  It represents the majority of U.S. global health funding (about 53% in recent years23 ) and is the largest commitment by any nation to address a single disease in the world. To date, PEPFAR funding has totaled over $120 billion, with funding reaching $6.5 billion in FY 2025 (in FY 2025, PEFPAR funding was provided through a continuing resolution, which maintained the prior year amount; see figure).

U.S. Funding for the President's Emergency Plan for AIDS Relief (PEPFAR),FY 2004 - FY 2025

PEPFAR’s creation marked a significant increase in the amount of funding provided by the U.S. for HIV. Trends in funding for bilateral programs and contributions to multilateral organizations are as follows (see the KFF fact sheet on the U.S. Global Health Budget: Global HIV Funding, Including PEPFAR and U.S. Global Health Budget: The Global Fund):

  • Bilateral HIV Funding: The majority of PEPFAR funding (ranging from 70-77% each year over the past decade) is provided for bilateral programs through the State Department (most of which is then transferred to other agencies), USAID, CDC, and DoD. Bilateral funding rose rapidly from $822 million in FY 2003 (the year before PEPFAR) to a peak of $5.0 billion in FY 2010. Between FY 2010 and FY 2013, it declined by more than $750 million. While it has risen since then, bilateral funding in FY 2025 ($4.8 billion), which Congress provided through a continuing resolution, was still $233 million below its peak level, and funding has been mostly flat for the past several years.
  • Multilateral Contributions: The U.S. also supports global HIV efforts through contributions to the Global Fund and UNAIDS. Support for the Global Fund, which accounts for most of the multilateral contributions, increased rapidly in its early years and fluctuated over time; it reached its highest level to date ($2.0 billion) in FY 2023. In FY 2025, funding for the Global Fund, which represented a carry-over from FY 2024 levels due to the continuing resolution, was $1.65 billion, $375 million less than the FY 2023 level, though this is due to a legislative requirement that limits the amount the U.S. can contribute to the Global Fund to not more than 33% of all contributions.24  The U.S. contribution to UNAIDS was $45 million for most years over the past decade, but increased to $50 million in FY 2022, where it has remained.
  • Emergency Funding: In FY 2021, an additional $3.8 billion in emergency supplemental funding was provided for bilateral HIV ($250 million) and the Global Fund ($3.5 billion) to address COVID-19.25 

Spending Directives26 

PEPFAR has included several spending directives, or earmarks, from Congress over the course of its history, many of which have changed over time:

  1. The Leadership Act, PEPFAR’s original authorization, included the following spending directives: 55% of funds were to be spent on treatment; 15% on palliative care; 20% on prevention, of which at least 33% be spent on abstinence-until-marriage programs; and 10% on OVC. While these were included as “sense of Congress” recommendations, the treatment, OVC, and abstinence-until-marriage earmarks were made requirements as of FY 2006.
  2. The Lantos-Hyde Act relaxed some of these directives for the FY 2009 – FY 2013 period: while still requiring that 10% of funds be spent on programs targeting OVC, it changed the treatment earmark from 55% to requiring that at least half of bilateral HIV assistance be spent on treatment and care. It removed the 33% abstinence-until-marriage directive and replaced it with a requirement of “balanced funding” for prevention to be accompanied by a report to Congress if less than half of prevention funds were spent on abstinence, delay of sexual debut, monogamy, fidelity, and partner reduction activities in any host country with a generalized (high prevalence) epidemic.
  3. The PEPFAR Stewardship Act, The PEPFAR Extension Act, and recent short-term reauthorization have maintained the language in the Lantos-Hyde Act. With the expiration of the short-term reauthorization, eight timebound provisions have now lapsed.

PEPFAR & The Global Fund

The U.S. is the single largest donor to the Global Fund. Appropriations for the U.S. contribution to the Global Fund totaled approximately $31.5 billion from FY 2001 through FY 2025.27  This includes, $3.5 billion in FY 2021 emergency funding that the U.S. government provided to the Global Fund to help the organization address the impacts of COVID-19 (in addition to the $250 million in emergency funds provided to bilateral HIV for COVID-19-related efforts).28 

The Global Fund provides another mechanism for U.S. support by funding programs developed by recipient countries, reaching a broader range of countries, and supporting TB, malaria, and health systems strengthening (HSS) programs in addition to (and beyond their linkage with) HIV.29  To date, over 120 countries30  have received Global Fund grants. Most Global Fund support (52%) has been committed to HIV and HIV/TB programs,31  followed by 29% to malaria, 15% to TB, and 4% to other health issues.32  The original authorization of PEPFAR, and subsequent reauthorizations, included a limit on annual U.S. contributions to the Global Fund that prevented them from causing cumulative U.S. contributions to exceed 33% of the Global Fund’s total contributions (see the KFF fact sheet on the Global Fund). 33 ,34 

  1. KFF analysis of The Global Fund: https://data-service.theglobalfund.org/downloads. ↩︎
  2. Totals represent funding specified by Congress in annual appropriations bills and/or identified by agencies for the Department of State, USAID, CDC, and DoD. In addition, international HIV research activities are supported by the NIH Office of AIDS Research (OAR) through its annual appropriated budget, but these amounts are not considered part of PEPFAR. See KFF’s “Breaking Down the U.S. Global Health Budget by Program Area” for additional information. ↩︎
  3. UNAIDS. 2024 UNAIDS Global AIDS Update: The urgency of now – AIDS at the crossroads; July 2024. ↩︎
  4. The U.S. first provided funding to address the global HIV epidemic in 1986. Then, in 1999, President Bill Clinton announced the Leadership and Investment in Fighting an Epidemic (LIFE) Initiative to address HIV in 14 African countries and in India. Later, in 2002, President George W. Bush announced the International Mother and Child HIV Prevention Initiative focused on 12 African and two Caribbean countries. ↩︎
  5. PEPFAR. 2009 Annual Report to Congress; Jan. 2009. ↩︎
  6. U.S. Congress. P.L. 108-25; May 27, 2003. ↩︎
  7. KFF. The U.S. Government and Global Health, Sep. 2022. CRS. PEPFAR Reauthorization: Key Policy Debates and Changes to U.S. International HIV/AIDS, Tuberculosis, Malaria and Programs and Funding; Jan. 2009. ↩︎
  8. U.S. Congress. Public Law No: 108-25; May 27, 2003. ↩︎
  9. U.S. Department of State. “Leadership – Bureau of Global Health Security and Diplomacy” webpage, https://www.state.gov/leadership-bureau-of-global-health-security-and-diplomacy. ↩︎
  10. Department of State. “ Leadership – Bureau of Global Health Security and Diplomacy,” webpage, https://www.state.gov/leadership-bureau-of-global-health-security-and-diplomacy/. ↩︎
  11. PEPFAR. “About Us,” webpage, https://www.state.gov/about-us-pepfar/. ↩︎
  12. Table 2 categorization is based on interventions laid out in the PEPFAR Financial Classification Reference Guide, used for program budgeting. See: PEPFAR Financial Classifications Reference Guide, June 2024. ↩︎
  13. KFF. Funding for Key HIV Commodities in PEPFAR Countries; July 2021. ↩︎
  14. PEPFAR. PEPFAR Latest Global Results; December 2024. ↩︎
  15. The 15 African countries that are implementing DREAMS include Botswana, Cote d’Ivoire, Eswatini, Haiti, Kenya, Lesotho, Malawi, Mozambique, Namibia, Rwanda, South Africa, Tanzania, Uganda, Zambia, and Zimbabwe. PEPFAR. DREAMS Country Fact Sheets; June 27, 2020; PEPFAR. PEPFAR Latest Global Results; December 2024. ↩︎
  16. PEPFAR, “Where We Work” webpage, https://www.state.gov/where-we-work-pepfar/; PEPFAR 2023 Country Operational Plan Guidance for all PEPFAR Countries; and CDC’s “Where We Work” webpage, https://www.cdc.gov/global-hiv-tb/php/where-we-work/. ↩︎
  17. The 25 countries that are required to complete a FY23 COP are Angola, Botswana, Burundi, Cameroon, Cote d’Ivoire, Democratic Republic of the Congo, Dominican Republic, Eswatini, Ethiopia, Haiti, Kenya, Lesotho, Malawi, Mozambique, Namibia, Nigeria, Rwanda, South Africa, South Sudan, Tanzania, Uganda, Ukraine, Vietnam, Zambia, and Zimbabwe.  PEPFAR. “Where We Work” webpage, https://www.state.gov/where-we-work-pepfar/. ↩︎
  18. PEPFAR. 2023 Country and Regional Operational Plan Guidance and Technical Considerations; Feb. 2023. ↩︎
  19. U.S. Congress. Public Law No: 112-25; Aug. 2, 2011. White House Office of Management and Budget (OMB). OMB Report to the Congress on the Joint Committee Sequestration for Fiscal Year 2013; March 1, 2013. KFF analysis of data from: Congressional appropriations bills and reports; Federal Agency Budget and Congressional Justification documents; ForeignAssistance.gov; KFF personal communication with the Office of Management and Budget. ↩︎
  20. Overall PEPFAR funding technically includes support for bilateral HIV and TB activities, as well as contributions to multilateral organizations (specifically, the Global Fund and UNAIDS). This analysis only focuses on bilateral funding for HIV and contributions to multilateral organizations. ↩︎
  21. UNAIDS is the Joint United Nations Programme on HIV/AIDS, the U.N. system’s coordinating body that serves to help galvanize worldwide attention to AIDS. ↩︎
  22. Totals represent funding specified by Congress for PEPFAR in annual appropriations bills and/or identified by agencies for the Department of State, USAID, CDC, and DoD. In addition, international HIV research activities are supported by the NIH Office of AIDS Research (OAR) through its annual appropriated budget, but these amounts are not considered part of PEPFAR. See KFF’s “Breaking Down the U.S. Global Health Budget by Program Area” for additional information. ↩︎
  23. Includes bilateral funding for HIV as well as U.S. contributions to UNAIDS and the Global Fund to Fight AIDS, Tuberculosis and Malaria through regular appropriations. ↩︎
  24. U.S. Congress. Public Law No: 118-47; March 23, 2024. ↩︎
  25. KFF analysis of data from the “American Rescue Plan Act of 2021” (P.L. 117-2). ↩︎
  26. U.S. Congress. Public Law No: 108-25; May 27, 2003. U.S. Congress. Public Law No: 110-293; July 30, 2008. U.S. Congress. Public Law No: 113-56; Dec. 2, 2013. U.S. Congress. Public Law No: 115-305; Dec. 11, 2018. U.S. Congress. Public Law No: 118-47; March 23, 2024. ↩︎
  27. Includes funding through regular appropriations and emergency supplemental funding. KFF analysis of data from: Congressional appropriations bills and reports; Federal Agency Budget and Congressional Justification documents; ForeignAssistance.gov; KFF personal communication with the Office of Management and Budget. ↩︎
  28. KFF analysis of data from the “American Rescue Plan Act of 2021” (P.L. 117-2). ↩︎
  29. Congress states that the Global Fund is the multilateral component of PEPFAR in the following: U.S. Congress. Public Law No: 110-293; July 30, 2008. U.S. Congress. Public Law No: 113-56; Dec. 2, 2013. ↩︎
  30. Does not include countries that may have received funding through multi-country or regional programs. Additional countries may be reached through multi-country or regional programs. ↩︎
  31. Of the 52% committed to HIV and HIV/TB programs, 39.4% was for HIV activities and 12.3% was for HIV/TB activities. ↩︎
  32. In 2020, some donor governments provided COVID-specific emergency contributions to the Global Fund in addition to their contributions to core activities. For the purposes of this fact sheet, these COVID-specific amounts have been excluded as they cannot be attributed to a specific area, such as HIV, TB, or malaria. The Global Fund. Data Explorer; accessed July 2024: https://data.theglobalfund.org/. ↩︎
  33. U.S. Congress. Public Law No: 108-25; May 27, 2003. U.S. Congress. Public Law No: 110-293; July 30, 2008. U.S. Congress. Public Law No: 113-56; Dec. 2, 2013. U.S. Congress. Public Law No: 118-47; March 23, 2024. KFF. PEPFAR Reauthorization: Side-by-Side of Legislation Over Time, brief. ↩︎
  34. See the KFF. The U.S. & The Global Fund to Fight AIDS, TB and Malaria, fact sheet; and KFF. PEPFAR Reauthorization: Side-by-Side of Legislation Over Time, brief. ↩︎

Mapping Hospitals By Congressional District

Published: May 12, 2025

The House and Senate are working on legislation to meet the requirements in the budget resolution, which targets cuts to Medicaid of up to $880 billion or more over 10 years. Although it is unclear what specific policies will be included in the final reconciliation bill, significant reductions in Medicaid spending would likely impact hospitals given that the program accounted for about one fifth (19%) of all spending on hospital care in 2023. Reductions in payments to hospitals, coupled with an increase in the number of uninsured Americans, resulting from Medicaid spending cuts or other policy changes would likely have implications for hospital finances, access to hospital services, the quality of patient care, and local economies (in that hospitals are the sixth largest employer in the country across industry subsectors).

The interactive map below shows the number of hospitals in each congressional district as reported in the American Hospital Association Annual Survey Database, updated through May 7, 2025. These counts include different types of hospitals, such as general, children’s, psychiatric, and long-term care hospitals. Federal hospitals, such as hospitals operated by the Department of Veterans Affairs, are excluded. (See Methods for additional information). Key takeaways include:

  • There is at least one hospital in each of the 435 congressional districts, and as many as 69 hospitals in one district (KS01, which covers a large portion of the state).
  • The large majority of congressional districts (94%) include at least five hospitals, most (61%) include at least ten hospitals, and about one in six (18%) include at least twenty hospitals.
  • The average congressional district includes 14 hospitals.
  • Republican congressional districts have 17 hospitals, on average, and Democratic districts have 10 hospitals, on average. Republican congressional districts may have more hospitals in part because they include some districts with large land areas, such as North Dakota, South Dakota, and Wyoming, each of which is one congressional district.
Every Congressional District Has At Least One Hospital

This work was supported in part by Arnold Ventures. KFF maintains full editorial control over all of its policy analysis, polling, and journalism activities.

Methods

This analysis uses the American Hospital Association (AHA) Annual Survey Database, which represents all hospitals in the United States and its associated areas. The analysis reflects the hospitals included in the 2023 data release, updated to reflect closures, openings, and other changes identified and reported by the AHA as of May 7, 2025. Federal hospitals—such as hospitals operated by the Department of Veterans Affairs—were excluded from the analysis.

This analysis excludes hospitals identified in the data as a unit of a parent hospital, meaning that counts are conservative in areas where these units operate. Hospital systems differ in how they designate hospitals within their system as units. For instance, one system might identify a children’s hospital that is close to an affiliated general hospital as a unit, while another system may not. As another example, there are some cases where health systems in a given metropolitan area treat hospitals from different locations as units of a parent hospital (which are excluded from the count), while in other similar scenarios these hospitals are treated as being separate.

Hospitals were matched to congressional districts in effect for the 119th Congress using the Census Geocoding Services Web Application Programming Interface (API). The Census Geocoding Services API is a government product that uses the Census Bureau Data API but is not endorsed or certified by the Census Bureau. Matches were based on latitude and longitude when available—which was the case for the large majority of hospitals—or based on address. In instances where addresses could not be matched to a congressional district, the address was first matched to latitude and longitude using Google Maps and was then matched to a congressional district.

Implications of Congress Eliminating Major Biden Era Regulations for Medicaid

Published: May 9, 2025

The Biden administration finalized several major Medicaid regulations with the intent of improving access to Medicaid services. Collectively, the rules span hundreds of pages of text, are extremely complex, and were set to be implemented over several years, with measurable increases in federal Medicaid spending. Overturning the rules would reduce regulation of managed care companies, nursing facilities, and other providers; increase barriers to enrolling in and renewing Medicaid coverage, and roll back enrollee protections, payment transparency, and requirements for improved access.

As Congress looks to meet the adopted budget resolution’s requirement of cutting federal Medicaid spending by up to $880 billion or more over ten years, overturning the Biden era rules could achieve some of those savings. Early leaked documents pointed to federal savings of $420 billion over ten years to roll back “major Biden Health rules,” although it is unclear which rules are included in the total and what the source is for the estimate. It is also unclear whether repealing all of the rules will be permissible under the Senate’s rules governing reconciliation legislation, which specify that provisions in reconciliation may not be “extraneous” to the federal budget.

To count as “savings” for the purposes of reconciliation, the federal budgetary effects of legislation changes must be estimated or “scored” by the Congressional Budget Office (CBO), raising the question of to what extent CBO will count repealing Biden era rules as savings for Medicaid. CBO has published its practices around how to incorporate administrative and judicial actions into cost estimates, explaining that after regulations are finalized, the effects of the rules are considered part of current law. The effects of repealing the regulations through legislation would, therefore, be included in a cost estimate, provided new regulations replacing the Biden rules aren’t proposed and assuming the courts don’t overturn any of the regulations (as new administrative or judicial action would change current law and may affect costs estimates). As of now, the only regulation for which savings are likely to be reduced because of administrative and judicial action is the requirement for nursing facilities to maintain minimum staffing levels (details below).

Major Medicaid health rules that could be repealed as part of reconciliation include the following:

  • The Access rule addresses several dimensions of access: increasing provider rate transparency and accountability, standardizing data and monitoring, and increasing opportunities for Medicaid enrollees to provide feedback on state Medicaid policies through a new beneficiary advisory committee, with the goal of improving access to care.
  • The rule requires states to compare fee-for-service (FFS) payment rates for primary care, obstetrical and gynecological care, and outpatient mental health and substance use disorder services to Medicare rates, and publish the analysis every two years, with the first analysis published by July 1, 2026.
  • In addition, by July 1, 2026, states must publish all FFS rates on a publicly available and accessible website and make updates within one month of a payment rate change.
  • The rule also included many provisions governing access to home care (also known as home- and community-based services or HCBS), which include ensuring that at least 80% of spending on certain services be spent on compensation for direct care workers and requiring states to report the number of people on waiting lists for care.
  • The Managed Care rule addresses Medicaid managed care access, financing, and quality, including strengthening standards for timely access to care (e.g., through the establishment of national maximum wait time standards for certain “routine” appointments) and states’ monitoring and enforcement efforts. The rule requires states to submit annual payment analysis and establishes a ceiling on state directed payments to institutional providers like hospitals at “average commercial rates” or ACR. Other supplemental payments in fee-for-service use Medicare as the payment ceiling, which is generally substantially below what commercial insurers pay.
  • The Long-Term Care Facility (LTC) Staffing rule establishes minimum staffing standards for nursing facilities, requires state Medicaid agencies to report the percent of Medicaid payments for institutional LTC that are spent on worker compensation, and provides funding for people to enter careers in nursing homes. It is unclear whether changes to the staffing rule would count as savings for reconciliation purposes because the US District Court for Northern Texas ruled to overturn the key staffing standards in early April. CBO generally does not account for district court rulings in its cost estimates but the Trump administration has signaled that it will not appeal the ruling, suggesting that in this case, the District Court decision may stand.
  • Two rules streamline Medicaid enrollment and renewal processes for the Medicare Savings Program(MSP) and for Medicaid, CHIP and the Basic Health Program. The first rule helps eligible Medicare beneficiaries more easily access Medicaid coverage of Medicare premiums and cost sharing through the MSP while the second rule streamlines application and enrollment processes in Medicaid, aligns renewal policies for all Medicaid enrollees, including requiring states to renew eligibility only every 12 months for all Medicaid enrollees (a new requirement for people who qualify on the basis of age or disability pathways as 12-month renewals were already required for children and adults by the Affordable Care Act), facilitates transitions between Medicaid, CHIP, and subsidized Marketplace coverage, and eliminates certain barriers for children in CHIP. The rule also updates documentation and recordkeeping requirements to reduce payment errors based on insufficient documentation. Many provisions in the MSP rule have already taken effect and many states are already in compliance with other provisions ahead of scheduled implementation timelines. CBO estimates that repeal of these rules would reduce federal Medicaid spending by $170 billion over ten years and reduce Medicaid coverage by 2.3 million by 2034.

VOLUME 22

Public Trust in Vaccine Information, Misrepresented Vaccine Studies, and HIV and PrEP Stigma


Summary

This volume examines findings about trusted sources of vaccine information from the latest KFF Tracking Poll on Health Information and Trust. It also explores how the misrepresentation of scientific studies, legal developments, and evolving public health guidance are contributing to the spread of false health narratives around vaccines, HIV and PrEP. Lastly, it summarizes new research on the use of generative AI to counteract vaccine misinformation, highlighting both its potential and limitations.


Featured: Latest KFF Tracking Poll on Health Information and Trust Finds Trust in Doctors for Vaccine Information Remains High, With Partisans Divided on Trust in Other Sources

The latest KFF Tracking Poll on Health Information and Trust finds that individual doctors remain the most trusted sources of reliable vaccine information among the public, while trust in other sources is lower and often characterized by large partisan gaps.

Large majorities of adults and parents say they have at least a “fair amount” of trust in their own doctor (83%) or their child’s pediatrician (81%) to provide reliable information about vaccines. Fewer, but still majorities, trust vaccine information from government health agencies including their local public health department, the CDC, and the FDA, while about half trust pharmaceutical companies and half of parents trust their children’s school or daycare.

While majorities across partisans express trust in their doctor or child’s pediatrician to provide vaccine information, Democrats are more likely than Republicans to trust their doctor (93% v. 78%) or, among parents, their child’s pediatrician (91% v. 73%) as a source of reliable vaccine information. Additionally, larger shares of Democrats compared to Republicans express trust in vaccine information from government health agencies, though this gap has narrowed since the start of President Trump’s second term as trust has declined among Democrats and risen among Republicans. For example, 70% of Democrats and 51% of Republicans now say they trust the CDC for reliable vaccine information, a gap of 19 percentage points. In 2023 under the Biden administration, that gap stood at 48 percentage points (88% of Democrats vs. 40% of Republicans).

Republicans, in turn, are much more likely than independents and Democrats to trust President Trump and HHS Secretary Robert F. Kennedy, Jr. on vaccines. Three quarters of Republicans say they trust President Trump (74%) and Secretary Kennedy (73%) to provide reliable information about vaccines, making Republicans as likely to trust President Trump and Secretary Kennedy as they are to trust their own doctor on the subject.

Most Democrats Trust Government Health Agencies To Provide Reliable Vaccine Information, While Republicans Are More Trusting of Trump and RFK Jr.

The poll also finds that fewer than half the public express “a lot” or “some” confidence in government health agencies to carry out key responsibilities, including ensuring the safety and effectiveness of prescription drugs (46%) or vaccines (45%), responding to outbreaks of infectious diseases (42%), or acting independently without interference from outside interests (32%). Across partisans, half or fewer express at least “some” confidence in these agencies to carry out each of these responsibilities.

Across Partisanship, Half or Fewer Are Confident in Government Health Agencies To Carry Out Key Responsibilities

Recent Developments

Flu Vaccine Study Misrepresented Online Amid Severe Season

SimonSkafar / Getty Images

Influenza deaths in the United States during the 2024-2025 flu season are higher than in previous years. Although the flu vaccine can prevent severe illness, hospitalization, and death, rates of vaccination have declined since 2020. The effectiveness of seasonal flu vaccines can vary year-to-year based on how similar the vaccine is to the circulating virus, but vaccines can offer protection against severe outcomes even when they are not well-matched to circulating strains. Data from the CDC supports the effectiveness of this season’s vaccine to protect against serious outcomes, and past data show that protecting against these outcomes is a primary benefit of the flu vaccine. As influenza deaths rise, the CDC continues to recommend that everyone 6 months of age and older receive a flu vaccine every season, with rare exceptions.

But some social media posts are sharing findings from a preprint study from researchers at the Cleveland Clinic to suggest that the flu vaccine is unsafe or ineffective without sharing context about the outcomes evaluated. The study, which has not yet been peer-reviewed, looked at more than 53,000 healthcare workers during the 2024-2025 flu season and found a higher rate of infection among those who were vaccinated. However, the authors explain that flu vaccine effectiveness depends on how closely the vaccine strains match the circulating virus in a given year. The study also did not evaluate the severity of illness, such as hospitalization or death, which are the primary outcomes vaccines are intended to prevent. Protection against infection with the flu can vary, but vaccines are consistently shown to reduce the risk of serious illness. After the study was posted online, a Cleveland Clinic spokesperson clarified to PolitiFact that the study did not represent the general public and does not suggest that flu vaccination increases the risk of flu.

After the study appeared on medRxiv, social media posts began circulating with misleading claims that the flu vaccine is ineffective or harmful. For example, one account that has previously shared false claims about vaccines online wrote, “Just like the COVID jabs and pretty much any other ‘vaccine’ it appears that the flu shot is an abject failure. In a preprint study from the Cleveland Clinic, employees that got the flu shot had a 27% HIGHER chance of contracting the flu.” Another post called for the removal of the flu vaccine from the market, “pending large prospective studies of their safety and effectiveness.” These posts do not acknowledge that the study did not evaluate severe outcomes. Their claims about the vaccine’s effectiveness, therefore, are misleading and unsupported by the study’s findings.

Despite these claims, most Americans remain confident in the flu vaccine’s safety. KFF’s latest April Tracking Poll on Health Information and Trust shows that most of the public (74%) is at least “somewhat confident” in the safety of the flu vaccines. While majorities across partisans express confidence in the safety of the flu vaccines, Democrats are more likely than Republicans to say they are “very” or “somewhat confident” vaccines for the flu are safe (88% v. 68%).

Misleading Claims About HIV and PrEP Resurface Amid Preventive Care Challenge

YinYang / Getty Images

Stigmatizing claims about HIV and PrEP, a medication that can be taken to prevent HIV, continue to circulate online, reinforcing barriers to prevention. Such rhetoric has resurfaced in response to the Supreme Court case Kennedy v. Braidwood Management last month. The case challenges the Affordable Care Act’s preventive services mandate, which requires PrEP (as a highly rated preventive service) be covered without cost-sharing for most people with private insurance.

In their filings, the plaintiffs argue that requiring insurers to cover PrEP violates their religious beliefs “by making them complicit in facilitating homosexual behavior, drug use, and sexual activity outside of marriage between one man and one woman,” and that it promotes “homosexual behavior, prostitution, sexual promiscuity, and intravenous drug use.” A 2021 scoping review published in AIDS and Behavior found that PrEP-related stigma is common, often focusing on judgments about having sex without a condom or having multiple sex partners. Such beliefs may contribute to low uptake: in 2023, only 31.3% of people aged 16 and older with indications for PrEP were prescribed the drug.

However, the body of research around PrEP use and sexual risk behaviors is mixed as limitations make it difficult to draw generalizable conclusions. A 2018 systematic review found no conclusive evidence that PrEP use leads to increased sexual risk behaviors. On the contrary, the review found that offering PrEP services provides an opportunity for at-risk populations to access sexual health care, testing, treatment, and counseling that they would not otherwise receive. Multiple studies have shown that when taken as prescribed, PrEP reduces the risk of acquiring HIV through sex by about 99% and through injecting drug use by at least 74%. 

Polling Insight: A 2023 KFF poll found that about eight in ten adults (82%) say it would be more difficult to reduce the number of new HIV infections in the U.S. if PrEP were no longer required to be covered by insurance. The share who say PrEP no longer being covered will make it more difficult to reduce new HIV infections includes majorities across partisanship, and a majority of lesbian, gay, bisexual, and transgender adults.

A Majority Of U.S. Adults Say It Will Be More Difficult To Reduce New HIV Infections If Cost Of PrEP Is Not Covered

In addition, most adults (76%) – including majorities across party and race and ethnicity — view HIV/AIDS as a serious issue in the U.S., and almost two-thirds of adults (63%) are not sure if people in the U.S. who need medication to prevent getting HIV are able to get it.

Fast Track Designation for Bird Flu Vaccine Contributes to Claims that Threat of Bird Flu is Manufactured

Lu ShaoJi / Getty Images

Online conversations about bird flu spiked on April 10 after a vaccine manufacturer announced that the FDA had granted Fast Track designation to its mRNA vaccine candidate. The designation is meant to speed up the development and review process for promising vaccines targeting major public health threats. In this case, it will help accelerate clinical trials for the vaccine, which began Phase 1 in November 2024 with federal funding.

The day before the announcement, a self-described news account with over 369,000 followers on X posted that Pfizer and Moderna were in talks with the government to develop bird flu vaccines. Although HHS had previously awarded $590 million to Moderna to support development, Pfizer has not received the same designation or funding. Still, among the more than 10,000 comments on the post, many of the most-engaged-with responses amplified the idea that preparing for a potential outbreak suggests the threat is exaggerated or manufactured. Others have misrepresented the meaning of “fast track,” falsely suggesting that the vaccine is being rushed without proper safety testing, when, in reality, the designation allows for more frequent communication with the FDA and eligibility for priority and rolling review—it does not mean safety protocols are bypassed.


AI & Emerging Technology

AI-Generated Messages Show Mixed Results in Correcting Vaccine Misinformation

Delmaine Donson / Getty Images

A study from a researcher at the University of Michigan explored how generative AI can help public health communicators craft messages tailored to specific audiences. The experiment tested AI-generated corrections for vaccine misinformation, customized to match personality traits like extraversion or beliefs in pseudoscience. Participants rated their agreement with vaccine misbeliefs before and after receiving a correction, which was either AI-generated or drawn from real-world examples.

Messages tailored to extraversion performed as well as high-quality generic messages, especially among those who scored high in extraversion. But, messages aimed at people with strong pseudoscientific beliefs were ineffective and, in some cases, backfired, reinforcing skepticism. The study’s author concluded that while well-targeted AI-generated messages show promise, some messages may be counterproductive, underscoring the need for human oversight. The study adds to research examining the use of AI in public health communication. A 2023 systematic review in Journal of Medical Internet Research found that conversational AI tools can be effective in vaccine communication, especially when messages are personalized.

The findings highlight both the potential and limitations of using AI in public health messaging. KFF polling has shown that trust in AI-generated content remains low: most of the public (56%) – including half of adults who use AI — are not confident that they can tell the difference between what is true and false when it comes to information from AI chatbots.

About The Health Information and Trust Initiative: the Health Information and Trust Initiative is a KFF program aimed at tracking health misinformation in the U.S., analyzing its impact on the American people, and mobilizing media to address the problem. Our goal is to be of service to everyone working on health misinformation, strengthen efforts to counter misinformation, and build trust. 


View all KFF Monitors

The Monitor is a report from KFF’s Health Information and Trust initiative that focuses on recent developments in health information. It’s free and published twice a month.

Sign up to receive KFF Monitor
email updates


Support for the Health Information and Trust initiative is provided by the Robert Wood Johnson Foundation (RWJF). The views expressed do not necessarily reflect the views of RWJF and KFF maintains full editorial control over all of its policy analysis, polling, and journalism activities. The Public Good Projects (PGP) provides media monitoring data KFF uses in producing the Monitor.

Poll Finding

KFF Survey of Immigrants: Views and Experiences in the Early Days of President Trump’s Second Term

Published: May 8, 2025

Findings

During his second term, President Trump has implemented an array of immigration policy changes focused on restricting immigration and increasing interior enforcement efforts. While these policies have been a frequent topic of political discourse, the perspectives and experiences of immigrants themselves are often overlooked. To address this gap, this report includes new insights from a KFF Survey of Immigrants about their views and experiences during the early days of President Trump’s second term. This survey builds on the 2023 KFF/LA Times Survey of Immigrants and a KFF Survey of Immigrants in 2024 which examined claims about immigrants that circulated during the presidential election cycle. A companion report based on focus groups with Hispanic immigrants who are undocumented or living with an undocumented family member highlights the broad impacts of shifting immigration policies on this group.

Key Terms and Groups

Immigrants: In this report, immigrants are defined as adults residing in the U.S. who were born outside the U.S. and its territories. This includes naturalized citizens, lawfully present immigrants, and immigrants who are likely undocumented. Likely undocumented immigrants are included in total but cannot be reported separately due to insufficient sample size.

Naturalized citizens: Immigrants who said they are a U.S. citizen.

Lawfully present immigrants: Immigrants who said they are not a U.S. citizen but currently have a green card (lawful permanent status) or a valid work or student visa.

Key Takeaways

  • Immigrants’ worries about detention or deportation have risen sharply since 2023, even among lawfully present immigrants and naturalized citizens, and many say these worries are affecting their health. Four in ten immigrants overall (41%) now say they worry about the possibility that they or a family member could be detained or deported, up 15 percentage points from 2023 (26%). Six in ten lawfully present immigrants report being worried about immigration enforcement, as do about a quarter of naturalized citizens. About six in ten (59%) Hispanic immigrants (many of whom are noncitizens) say they worry about detention or deportation, roughly three times the share of Asian immigrants (19%) who say the same. These immigration-related fears have negatively affected immigrants’ health and well-being, with one-third of immigrants overall saying they’ve experienced worsening health conditions, increased stress and anxiety, or problems eating or sleeping since January due to concerns about their or a family member’s immigration status, rising to 41% among lawfully present immigrants.
  • As the Trump administration ramps up immigration enforcement across the country, some lawfully present immigrants report avoiding their normal activities. About one in eight (13%) immigrants overall, including one in five lawfully present immigrants, say they or a family member have limited their participation in at least one day-to-day activity like going to a community event, work, or seeking medical care due to concerns about drawing attention to someone’s immigration status. Amid increased immigration enforcement, about one-third of immigrants say they have seen or heard reports of ICE (Immigration and Customs Enforcement) presence in their community. About a third of immigrants are unsure whether ICE and CBP (Customs and Border Protection) can make arrests at “sensitive locations” such as schools, hospitals, and churches.
  • Amid confusion and fears, some immigrants have taken precautionary actions to prepare for possible immigration enforcement. Three in ten immigrants overall say they have taken at least one precautionary step like seeking out information about immigrants’ rights or consulting an immigration attorney to prepare for possible immigration enforcement, rising to 46% among lawfully present immigrants. One in twelve (8%) immigrants say they personally know someone who has been detained, deported, or arrested because of their immigration status since January, rising to about one in seven (14%) among lawfully present immigrants.
  • Four in ten immigrants say they feel “less safe” since President Trump took office, and a similar share expect their financial situation to worsen in the coming year. Substantial shares of both lawfully present immigrants (44%) and naturalized citizens (34%) report feeling less safe. More broadly, two-thirds of immigrants disapprove of how President Trump is handling his job, and a similar share say things in the U.S. have gotten off on the wrong track. Immigrants also convey unease about the future in open-ended responses describing how President Trump has affected their lives, expressing concerns about the cost of living and the availability of work.
  • Immigrants who identify with the Republican Party have generally positive views of President Trump and life in the U.S., though some express concerns. A majority of Republican immigrants say they approve (75%) of President Trump’s job performance, with substantial shares saying they feel safer since he took office (52%) and that they expect their financial situation to improve in the coming year (40%). However, there are some signs of discontent among Republican immigrants; while four in ten (42%) say President Trump’s actions so far have been “better” than they expected, about one-third (36%) say his actions have been “worse” than expected, and one-quarter disapprove of his job performance.
  • Most immigrants disapprove of President Trump’s handling of key policy areas and many of his immigration-related measures, but about half approve of his handling of border security (54% approve) and the decision to send additional military forces to the U.S.-Mexico border (53% approve). President Trump’s worst approval rating among immigrants is on his handling of inflation (75% disapprove), and majorities also disapprove of his performance on foreign policy (66%), and immigration (62%). A large majority oppose the administration’s efforts to end birthright citizenship (79%), and a smaller majority oppose efforts to deport more people living the U.S. illegally (57%). Immigrants who are Republican or lean toward the party are much more approving of President Trump’s performance and his policies, but 41% of Republican immigrants disapprove of his handling of inflation, and this group is split on his efforts to end birthright citizenship (52% approve, 48% disapprove).

Worries about being detained or deported are much higher among immigrants now than in 2023, including among lawfully present immigrants and naturalized citizens. Fielded largely before President Trump invoked the Alien Enemies Act to deport people to El Salvador and the legal case involving Kilmar Abrego Garcia made national headlines,1  the latest KFF Survey of Immigrants finds that overall, four in ten (41%) immigrants worry they or a family member could be detained or deported, up from 26% in 2023. As the Trump administration expands its focus beyond undocumented immigrants, the latest KFF Survey of Immigrants finds worries about detention and deportation have also risen among immigrants who are naturalized citizens and those who are lawfully present. About six in ten (61%) lawfully present immigrants now say they are worried about being detained or deported, roughly twice the share (33%) who said this in 2023. About twice as many naturalized citizens also say they now worry that they or a family member could be detained or deported compared to 2023 (23% vs. 12%). Worries about being detained or deported have also increased substantially among Hispanic immigrants (59% vs. 41%) and parents (50% vs. 32%). Hispanic immigrants are about three times as likely as Asian immigrants to say they worry about themselves or a family member being detained or deported (59% vs. 19%), likely reflecting the fact that a larger share of Hispanic immigrants are noncitizens.

In addition to these worries, one in twelve immigrants (8%) say they personally know someone who has been arrested, detained, or deported due to their immigration status since President Trump took office in January, rising to 14% among lawfully present immigrants and 13% among Hispanic immigrants.

Immigrants' Worries About Being Detained or Deported Are Higher Now Than in 2023, Including Among Naturalized Citizens

In addition to worries about detention and deportation, about four in ten (43%) immigrants overall say they worry they or a family member could have their legal immigration status revoked, rising to six in ten (63%) lawfully present immigrants. About half of Hispanic immigrants (54%) and immigrant parents (52%), and about a quarter of naturalized citizens (25%) and Asian immigrants (27%), say they worry about their own or a family member’s legal immigration status being revoked. Overall, about half of all immigrants (48%), rising to seven in ten (72%) lawfully present immigrants, say they worry that they or someone in their family could either be detained or deported or have their legal status revoked. While the survey does not have sufficient sample size to report on the worries of likely undocumented immigrants, recent focus groups with Hispanic immigrants who are undocumented or have an undocumented family member detail how immigration-related fears and worries are affecting their daily lives.

About Half of Immigrants Say They Have Worried About Detention, Deportation, or Revocation of Legal Status for Themselves or a Family Member

About a third (32%) of immigrants overall say they have experienced negative health repercussions due to worries about their own or a family member’s immigration status since January, rising to four in ten (41%) lawfully present immigrants. This includes about three in ten (31%) immigrants who report increased stress, anxiety, or sadness, one in five (20%) who report problems sleeping or eating, and one in eight (12%) who report worsening health conditions such as diabetes or high blood pressure as a result of immigration-related worries. Lawfully present immigrants are about twice as likely as naturalized citizens to report at least one of these negative health impacts (41% vs. 20%), as are Hispanic immigrants compared to Asian immigrants (43% vs. 17%). About four in ten (38%) immigrant parents of children under 18 say they have experienced at least one of these negative health effects due to concerns about immigration status since January. These negative effects on health are echoed in a companion report about the experiences of Hispanic immigrants living in an undocumented family, many of whom reported health impacts for themselves and their children, such as insomnia, feelings of isolation and stress, and avoiding medical care.

About One-Third of Immigrants Say They Have Experienced Negative Health Impacts Due to Worries About Immigration Status, Rising to Four in Ten Lawfully Present Immigrants

Impacts of Immigration Enforcement on Activities and Community

One in five (21%) lawfully present immigrants say they or a family member have limited their participation in activities outside the home since January due to concerns about drawing attention to someone’s immigration status. This includes about one in five lawfully present immigrants who say they or a family member have avoided traveling (18%), one in ten who have avoided going to church or other community spaces or activities (9%) or seeking medical care (9%), and smaller shares who have avoided applying for a government program that helps pay for food, housing, or health care (7%), going to work (5%), or taking a child to school or attending school events (2%). Even among immigrants who are naturalized citizens, about 5% say they or a family member have avoided at least one of these things. About one-third (35%) of immigrants overall say they know anyone (including non-family members) who has done at least one of these things, including about almost half (45%) of lawfully present immigrants and a quarter of naturalized citizens. In focus groups among Hispanic adults who are undocumented or living in a family with an undocumented family member, many participants told stories about how they are avoiding doing these activities and generally seeing fewer people out in their neighborhoods, while some said they try to avoid leaving their homes entirely due to fears about immigration enforcement.

One in Five Lawfully Present Immigrants Say They or a Family Member Have Limited Their Participation in Activities Due to Concerns About Immigration Status

Amid heightened immigration enforcement under the Trump administration, about one-third (36%) of immigrants say they’ve seen or heard reports of ICE in their community, even if they’re unsure those reports are true. About one in five immigrants say they saw or heard ICE being at store or business (22%) or a workplace employing immigrants (19%). Fewer said they heard about ICE being at or near a school (13%) or at a health care facility (6%).

About One-Third of Immigrants Say They Have Seen or Heard Reports About ICE in Their Community

As immigrants report avoiding some activities, many say they are unsure whether immigration enforcement activity can take place at “sensitive locations” such as hospitals, schools, and churches. As legal challenges continue over the Trump administration’s authority to do so, about a third (36%) of immigrants say they’re unsure whether ICE or CBP can arrest people at these “sensitive locations.” Four in ten (43%) say they think immigration enforcement arrests can take place at these places, while an additional one in five (21%) say they cannot. Confusion about this policy was echoed in KFF focus groups with Hispanic immigrants living with an undocumented family member, some of whom reported avoiding these places amid fears of immigration enforcement activity. In addition to confusion about this specific policy, one-third (36%) of immigrants say they feel they don’t have enough information about U.S. immigration policy to understand how it affects them and their family, though most (63%) say they do.

About One-Third of Immigrants Are Unsure Whether ICE and CBP Can Arrest Immigrants at Schools, Hospitals, and Churches

Amid confusion and worries, three in ten (30%) immigrants say they or a family member have taken steps to understand their rights or prepare for possible interactions with immigration authorities, rising to nearly half (46%) of lawfully present immigrants. This includes one in five immigrants who say they or a family member have sought out information about immigrants’ legal rights (20%) or who have started carrying proof of immigration status (17%). About one in ten say they or a family member have made a plan in case someone in the family is detained or deported (13%) or consulted an immigration attorney or other professional (9%). Lawfully present immigrants are more than twice as likely to say they or a family member have done at least one of these things compared to naturalized citizens (46% vs. 17%). In focus groups with Hispanic immigrants who are likely undocumented or have undocumented family members, some participants said they spoke with their children about potential scenarios involving detention, deportation, and/or family separation and said that they had assigned a local guardian for their children in case of such an event.

Three in Ten Immigrants Say They or a Family Member Have Taken Steps To Understand Their Rights or Prepare for Interactions With Authorities, Rising to Nearly Half of Lawfully Present Immigrants

Four in ten (40%) immigrants say most people in the U.S. are not welcoming to immigrants, and one in ten report experiencing discrimination or mistreatment since January. While majorities of immigrants say most people in their neighborhood (72%) and in their state (68%) are welcoming to immigrants, far fewer (31%) say the same about most people in the U.S. overall. Further, about one in seven immigrants (14%) say they have experienced discrimination or mistreatment based on their race or ethnicity, appearance, accent, or immigration status since January, and similar shares say they have been criticized or insulted for speaking a language other than English (12%) or have been told they should “go back to where they came from” (12%).

Majorities of Immigrants Say Most People in Their Neighborhood and State Are Welcoming to Immigrants, but Four in Ten Say Most People in the U.S. Are Not

Despite ongoing changes to U.S. immigration policy, most immigrants say they want to stay in the U.S. Overall, most (59%) immigrants say that, thinking about the future, they want to stay in the U.S., while one in eight (12%) say they want to move back to the country they were born in, 5% want to move to another country, and a quarter (24%) say they are “not sure.”

Immigrants’ Views of the U.S. Three Months into President Trump’s Second Term

Two-thirds (65%) of immigrants feel things in the U.S. have gotten off on the wrong track, while a third (34%) say things are going in the right direction. Most immigrants, regardless of citizenship status, say things in this country are on the wrong track, with majorities of both naturalized citizens (63%) and lawfully presents immigrants (73%) alike saying this. Similar to the public as a whole, immigrants’ views about where the country is headed are driven largely by partisan identification. About nine in ten (87%) immigrants who are Democrats or lean toward the party say things are on the wrong track, while about seven in ten (71%) who identify as Republicans or lean that way say the opposite—that things are going in the right direction.

Most Immigrants Say Things in the U.S. Are on the Wrong Track

About four in ten (43%) immigrants overall expect their financial situation to get worse in the coming year, while about a fifth expect it to get better and one-third expect it to stay the same. Fielded both before and after President Trump’s announcement and subsequent 90-day pause of widespread tariffs, the latest KFF Survey of Immigrants finds that how immigrants view their economic futures varies widely by partisanship. A majority (57%) of immigrants who are Democrats think their financial situation will get worse, whereas a plurality of Republicans (40%) think it will get better. Yet, on this question, even three in ten (30%) Republican immigrants say they think their financial situation will get worse in the coming year.

About Four in Ten Immigrants Expect Their Financial Situation in the Coming Year To Get Worse

About two-thirds (64%) of immigrants overall disapprove of Trump’s handling of his job as president, but there are wide divides by party identification. Similar to U.S. adults overall, nearly nine in ten (87%) immigrants who are Democrats disapprove of the way President Trump is handling his job as president, whereas three-quarters (75%) of immigrants who are Republican say they approve. Overall, majorities of both immigrants who are naturalized citizens (60%) and those who are lawfully present immigrants (70%) say they disapprove of the way President Trump is handling his job.

About Two-Thirds of Immigrants Overall Disapprove of How Donald Trump is Handling His Job as President, but Disapproval is Highest Among Democrats

A majority (57%) of immigrants say the Trump administration’s actions are worse than they expected, including about a third (36%) who say they are a lot worse.” While immigrants who identify as Democrats are much more likely to say the Trump administration’s actions have been worse than they expected, even among Republicans, about one-third (36%) say the Trump administration’s actions at are least “a little worse” than they expected.

A Majority of Immigrants Say the Trump Administration’s Actions So Far Are Worse Than They Expected

About half (49%) of immigrants say President Trump’s actions have had a generally negative impact on them and their family, while one in seven (14%) report a positive impact and about a third (36%) say they have had no real impact.” About seven in ten (69%) immigrants who are Democrats say the president’s actions have had a generally negative impact on them and their family, whereas about four in ten (45%) Republicans say his actions have had a generally positive impact. Across citizenship status, partisanship, and race and ethnicity, about three in ten or more immigrants say President Trump’s actions since taking office have had “no real impact” on them and their families.

About Half of Immigrants Say President Trump’s Actions Have Had a Generally Negative Impact on Them, About One-Third Say They Have Had “No Real Impact

When asked to describe how they have been negatively affected by President Trump’s actions, the largest share express concerns about the economy and impacts to their financial situation, including inflation and rising prices as well as job losses (57% among those who report a negative impact). Some (18%) say the president’s actions have caused increased stress and anxiety, while others say his actions have caused immigration-related fears (17%) like worrying about deportation or experiencing more hostility because they are an immigrant. Among immigrants who say they have been positively affected by President Trump’s actions, many (27%) said they feel more secure because of the administration’s actions on the border and immigration, or that they generally like President Trump (20%).

In Their Own Words: How Immigrants Have Been Affected By President Trump’s Actions 

In a few words, can you describe how Trump’s actions as President have affected you and your family?

Among those who said generally negative impact and mentioned the economy:

“The way he has acted has brought down the economy such as food, gas, education, and healthcare.”— 56 year-old Vietnamese immigrant man in California

“Cost of living is going up. I’m a small business owner and the current sense is that our material cost will substantially increase and our customer base is shrinking due to cost.”—60 year-old Norwegian immigrant man in California

“Although we don’t bear the brunt of these negative impacts, it’s clear Trump is actively making things harder for a middle class family like mine by imposing high tariffs and dealing with economic issues badly.” —20 year-old Chinese immigrant man in California

“Cost of everything is even higher, economy is able to crash, my retirement account is going the wrong way.” —42 year-old Indian immigrant man in California

Among those who said generally negative impact and mentioned immigration-related fears:

“Now my entire family feels unsafe and worried that the police will stop us and have negative behavior and/or be aggressive with us. Additionally, we’re very worried that the tariffs for Mexico and Canada will make the prices in the United States go up a lot.” —55 year-old Colombian immigrant woman in Texas

“It has significantly increased the uncertainty despite me being here legally. It often feels like my status is constantly at risk, making it difficult to feel truly secure in this country. There’s always the looming fear of complications when reentering from another country, adding an extra layer of stress and unpredictability. The ever-changing immigration landscape has made the process more complicated, creating a sense of anxiety and instability. This uncertainty has reached a point where America no longer feels like a safe, secure, or reliable place to build a future, forcing many to question whether staying here is truly sustainable in the long run.” —27 year-old Indian immigrant woman in Pennsylvania

“Every day there’s anxiety, frustration because of not knowing where the country is heading toward. There’s a lot of sadness and indignation. My children are scared by what they hear at school.” —40 year-old Mexican immigrant woman in California

“The fear that my husband or I will be detained by ICE and not knowing what will happen to our children is our greatest fear.” —35 year-old Mexican immigrant woman in California

“I couldn’t travel outside the US to see my parents at my home country, because of changing laws everyday.” —33 year-old Indian immigrant woman in North Carolina

Among those who said generally positive impact:

“Given us a sense of security against the criminal illegal alien; we are thankful for holding to the rule of law and protecting the US against this invasion” —53 year-old Salvadorian immigrant woman in California

“Seeing all the work that he [President Trump] has done in the short time that he has been office is absolutely amazing. I am feeling so much better about our country now that he is our President.” —54 year-old Sri Lankan immigrant woman in California

Four in ten (40%) immigrants, including 44% of lawfully present immigrants and a third (34%) of naturalized citizens, say they feel “less safe” since President Trump took office, but most (52%) Republican immigrants say they feel safer. Overall, about four in ten immigrants (42%) say they feel “about the same in terms of safety,” while 18% report feeling “safer” since President Trump took office. Feelings about safety are strongly shaped by partisanship, with about half of immigrants who are Republicans (52%) saying they feel “safer” and a similar share of immigrants who are Democrats saying they feel “less safe” (57%) since President Trump took office.

Four in Ten Immigrants Say They Feel Less Safe Since President Trump Took Office, but Half of Republican Immigrants Feel Safer

Immigrants’ Views of President Trump’s Performance and Policies

Most immigrants disapprove of the way President Trump is handling inflation (75%), foreign policy (66%), and immigration (62%), but a slim majority (54%) say they approve of how he is handling border security. Recent polls of the general public similarly find that President Trump gets his lowest marks for handling inflation and somewhat higher approval on immigration-related issues.

Majorities of Immigrants Disapprove of How President Trump is Handling Immigration, Foreign Policy, and Inflation, But More Than Half Approve of His Handling of Border Security

President Trump’s job approval among immigrants across various domains varies widely by partisanship, but across groups his lowest marks are on handling inflation. Large shares of Republican immigrants approve of how President Trump is handling border security (97%), immigration (81%), and foreign policy (75%). A smaller majority (59%) of Republican immigrants approve of how he is handling inflation. Large shares of immigrants who are Democrats say they disapprove of how President Trump is handling border security (68%), immigration (81%), foreign policy (87%), and inflation (92%). On most policy areas, the views of immigrants who are lawfully present immigrants are similar to those who are naturalized citizens, but lawfully present immigrants are more likely to disapprove of how President Trump is handling immigration than naturalized citizens (72% vs. 54%). Slim majorities of naturalized citizens (54%) and lawfully present immigrants (55%) alike approve of how he is handling border security.

Across Partisans, President Trump's Job Approval Among Immigrants Is Lowest on Handling Inflation

Majorities of immigrants disapprove of the administration’s efforts to end birthright citizenship (79%) and to deport more people living in the U.S. illegally (57%), but many approve of sending additional military forces to the U.S. border (53% approve). A Pew Research Center survey conducted earlier this year found that among the public overall, majorities disapproved of the Trump administration’s efforts to end birthright citizenship, but majorities approved of increasing deportations and sending more troops to the U.S. Mexico border.

Majorities of Immigrants Disapprove of Ending Birthright Citizenship and Deporting People Living in the U.S. Illegally, Narrowly Approve of Sending Additional Military to the U.S.-Mexico Border

Republican immigrants are more likely than those who identify as Democrats to support the Trump administration’s immigration policies but remain divided on ending birthright citizenship. On each of the three immigration policies polled, immigrants who are Republican are much more likely than Democrats to say they approve of the administration’s efforts. Notably, while about eight in ten or more Republican immigrants say they approve of the administration’s efforts to deport more people and send additional troops to the U.S.-Mexico border, Republican immigrants are split on efforts to end birthright citizenship (52% approve, 48% disapprove). Immigrants who are naturalized citizens and lawfully present immigrants have similar views on all three of the immigration policies polled.

Immigrants’ Views of President Trump’s Immigration Policies Are Shaped by Partisanship

Methodology

The KFF Survey of Immigrants: Views and Experiences in the Early Days of President Trump’s Second Term was designed and analyzed by public opinion researchers at KFF. The survey was conducted March 6-April 13, 2025, online and by telephone among a nationally representative sample of 511 U.S. immigrants in English (394), Chinese (20), Spanish (83), Korean (13), and Vietnamese (1). The sample was reached through the SSRS/KFF Immigrants Panel either online (n=469) or over the phone (n=42). The SSRS/KFF Immigrants Panel is a nationally representative probability-based panel of immigrants where panel members were recruited randomly in one of three ways: (a) Through invitations mailed to respondents randomly sampled from an Address-Based Sample (ABS) provided by Marketing Systems Groups (MSG) through the U.S. Postal Service’s Computerized Delivery Sequence (CDS); (b) a random digit dial telephone sample of prepaid cell phone numbers obtained through MSG from a dual-frame random digit dial (RDD) sample provided by MSG or (c) calling back telephone numbers from recent SSRS RDD polls whose final disposition was “language barrier,” meaning the person answering the phone spoke a language other than English or Spanish.

An initial invitation letter to the survey was sent to panel members via USPS asking them to take the survey online or by calling a toll-free number. Invitation letters were also sent via email to panelists who provided an email address during registration. Outbound call attempts were also made to panelists who provided a phone number. Online respondents received a $10 electronic gift card incentive, and phone respondents received a $10 incentive check by mail.

The sample was weighted to match the sample’s demographics to the national U.S. adult immigrant population using data from the 2023 American Communities Survey. The demographic variables included in weighting are home ownership, number of adults in household, presence of children in household, census region, length of time in the U.S., English proficiency, citizenship status, gender, age, race/ethnicity, education, and country of origin. Weights account for recontact propensity and the design of the panel recruitment survey.

In order to ensure data quality, cases were removed if they failed both quality checks: (1) had over 30% item non-response, and (2) had a length less than one quarter of the mean length by mode. In addition, respondents were asked their country of birth, and if they stated they were born in the U.S., they were asked to re-confirm that response. A small percentage of respondents (n=7; 1%) re-confirmed that they were born in the U.S. Based on this last criterion, 7 cases were removed.

The margin of sampling error including the design effect for the immigrant adults sample is plus or minus 7 percentage points. Numbers of respondents and margines of sampling error for key subgroups are shown in the table below. For results based on other subgroups, the margin of sampling error may be higher. Sample sizes and margins of sampling error for other subgroups are available by request. Sampling error is only one of many potential sources of error and there may be other unmeasured error in this or any other public opinion poll. KFF Public Opinion and Survey Research is a charter member of the Transparency Initiative of the American Association for Public Opinion Research.


GroupN (unweighted)M.O.S.E.
Total Immigrant adults511± 7 percentage points
Party ID
Democrat/Lean Democrat250± 9 percentage points
Independent/Other126± 13 percentage points
Republican/Lean Republican131± 13 percentage points
.
Immigration status
Naturalized citizen334± 8 percentage points
Lawfully present immigrant142± 12 percentage points

Endnotes

  1. Most (n=322) interviews were completed before deportation flights began on March 15, 2025 and before Kilmar Abrego Garcia’s case made national news. Abrego Garcia’s court case was filed on April 1, 2025 when 474 interviews had been completed. Since the bulk of survey interviews were conducted before President Trump invoked the Alien Enemies Act to deport immigrants to El Salvador, it’s possible that views on his handling of immigration may have shifted since the poll was conducted.   ↩︎

Living in an Undocumented Immigrant Family Under the Second Trump Administration: Fear, Uncertainty, and Impacts on Health and Well-Being

Published: May 8, 2025

Findings

Introduction

During his second term, President Trump has implemented an array of immigration policy changes focused on restricting immigration and increasing interior immigration enforcement efforts. These policy changes include restrictions on both lawful and unlawful immigration into the U.S., increased interior enforcement activities to support mass deportation, attempts to end birthright citizenship for the children of noncitizen immigrants, and rescinding protections against enforcement action in previously protected areas such as schools, churches, and health care facilities. These actions have broad impacts across immigrant families of all statuses, including the millions of U.S. citizen children living in them.

To better understand how the shifting policy environment is affecting immigrant families, KFF conducted four focus groups in March 2025 with 29 Hispanic adults who were likely undocumented or living with a likely undocumented family member in California, Texas, New Jersey and New York, and parts of the Midwest (Kansas, Missouri, North Carolina, and Nebraska) (see Methodology). These findings provide deeper understanding of experiences reported in a KFF survey of immigrant adults. The focus group participants’ experiences highlight the broad impacts of shifting immigration policies on their lives, including negative impacts on work as well as their and their children’s daily lives and routines, health, and well-being. Research suggests that many of these impacts may have long-term negative effects on health, including the health of their children. They may also have broader impacts on the nation’s economy and workforce, given the role immigrants play, particularly in certain industries such as health care, agriculture, and construction.

Major Concerns Among Immigrant Families Today

Most participants expressed major concerns about the economy and their financial situation today despite being employed. When asked about how things are going in the U.S. for them and their family, participants frequently cited concerns about the economy and its impact on their family’s finances. Like immigrant adults overall, most participants said they came to the U.S. for improved economic and/or educational opportunities for themselves and their children and talked about the significant contributions they make to the U.S. workforce. However, participants shared growing concerns about their financial situation amid the current economy, noting that it is becoming increasingly difficult to make ends meet due to rising costs. Business owners and service workers also said they were experiencing declines in income due to lower spending by consumers.

In Their Own Words: Concerns About the Economy

“Considering the financial situation that we are seeing, for example my wife and her parents came here years ago..[the] economy was different, it was a different economy, stronger, people could buy their houses more easily, etc. and you don’t see that [now]…- 38-year-old Venezuelan immigrant man in California

“Before, everything flowed differently. Now, the economy, for me, being in business…it’s super slow. People don’t spend like before. Before, they would go to the store and spend $100, but now people think twice before spending $1 because there’s no more. Before we had a bit more financial breathing room, now, we don’t.”- 42-year-old Mexican immigrant woman in Texas

“But the United States, I can speak from my experience since I arrived in 2019, before the pandemic. I can say that the little I earned back then was enough, and I could save. Currently, I earn more, and it’s still not enough. It’s very difficult to meet all the monthly needs.” – 34-year-old Ecuadorian immigrant woman in New Jersey

“I also think that this issue of tariffs that Trump is imposing is also stressing everyone out because everything is getting more expensive. Food is getting more expensive, cars are going to get more expensive, acquiring a home, work materials are also getting more expensive. So, in one way or another, that’s going to affect all of us as a society.” – 30-year-old Colombian immigrant man in New York

Participants also noted that it has become much harder to be an immigrant in the U.S. due to the changes in immigration policy and shifting attitudes towards immigrants. Many focus group participants expressed that it is much harder to be an immigrant in the U.S. due to the Trump administration’s changes to immigration policy and growing economic challenges, with one participant expressing that “The American Dream… is not like before.” Additionally, some participants reported experiencing increasing levels of discrimination and unfair treatment. Some felt they were experiencing growing levels of discrimination not only due to their immigration status but also due to their Hispanic background. Several focus group participants expressed that they feel less welcome in their communities and/or the country, with one saying that they are being made to feel like Hispanic people “shouldn’t exist”. Several participants said that they no longer feel wanted in the country even though they are following all the rules and contributing to the economy, often doing jobs that U.S.-born citizens don’t want to do.

In Their Own Words: Immigration Concerns and Shifting Attitudes Towards Immigrants

“The situation is even worse now. The “American Dream,” I think, is not like before. Before we used to say, ‘I want to go to the United States because life is better there.’ I think everything has changed now, and it’s all so difficult.” – 42-year-old Mexican immigrant woman in Texas

“It’s like the government is against us [Latinos]. We are the workforce, and I don’t understand why. We are really good people, we are workers. The point is that, for them we are not, and it seems like we’re not wanted like we were before.” – 51-year-old Colombian immigrant woman in Iowa

“We come here to work. Since I arrived, I’ve followed all the rules to the letter to be in good standing with the country. I don’t do anything wrong, and they don’t focus on that. They don’t focus on the fact that we come to work, to get ahead, to prosper, and to help the country too.” – 55-year-old Mexican immigrant woman in Kansas

“I feel like if they see you and realize you’re Mexican or [Latino], it’s like they even look at you badly, like they don’t want us here, obviously. So that part makes us feel uncomfortable.” – 29-year-old Mexican immigrant woman in Kansas

“I do feel very much feel threatened, like [Latinos] shouldn’t exist.” – 24-year-old Colombian immigrant man in Missouri

“I grew up in a very Republican community in Missouri…. In those places I’ve visited, a month ago or so, but there, you really don’t feel welcome… they realize you’re Latino or they can see it on your face, and it seems like everything changes in those kinds of communities.” – 24-year-old Mexican immigrant man in Missouri

“Currently this President, the truth I think is that he has imposed a lot of racism, even the students at schools are a little afraid, other students harass them sometimes, it’s difficult.”- 50-year-old Mexican immigrant woman in California

“I work at Taco Bell. A lot of people come in, and they’re from here, and they like it, but when they hear you speak Spanish, they look at you, and they say, ‘I don’t understand you. You have an accent.’ Before, in all the time I worked there, that didn’t happen, but now, they feel more free to get on top of you.”- 34-year-old Ecuadorian immigrant woman in New Jersey

Knowledge of Immigration Policies and Rights

Many participants said they have received information about their rights as immigrants, with a number referencing the “Know Your Rights Red Card,” although awareness varied by region. Most focus group participants in California, New Jersey, New York, and Texas reported hearing or receiving information about “Know Your Rights Red Cards.” The “Red Card” is a pocket-sized card available in numerous languages that contains information about constitutional rights during encounters with immigration enforcement officials that have been widely shared by immigrant-serving community-based organizations (Figure 1). However, most focus group participants in the Midwest were not aware of “Know Your Rights” cards, and many said that they didn’t believe they had any rights as immigrants, suggesting less outreach and education in some areas of the country.

Figure 1

Image of card available for download on RedCardOrders.com. Card reads: You have constitutional rights: 1. Do not open the door if an immigration agent is knocking. If you are inside of your house, show the card through the window or slide it under the door. 2. Do not answer any questions from an immigration agent if they try to talk to you. You have the right to remain silent. 3. Do not sign anything without first speaking to a lawyer. You have the right to speak to a lawyer. 4. If you are outside of your house, show this card to the agent. Ask the agent if you are free to leave and if they say you can, leave calmly.

Source: www.redcardorders.com

Despite many participants receiving information on immigrant rights, most remain confused and say they do not have enough information about their rights or U.S. immigration policies. Like immigrant adults overall, focus group participants said they do not have enough information to understand how U.S. immigration policies impact them and their families. Participants reported using a variety of sources to obtain information about immigration policies including but not limited to social media such as TikTok, immigration attorneys, government websites, friends and family, and English as well as Spanish-language news. However, several participants noted that they were concerned about misinformation being spread through social media. Participants expressed a need for increased availability of clear and accurate information related to immigration policy from trusted sources.

In Their Own Words: Knowledge of Immigrant Rights and Immigration Policies

“My source of information is my daughter. There’s a red paper, I think she put it in my wallet. She looked for proof that I’ve been here for so long and put it in my wallet too. She said ‘Dad, keep this, put it with your insurance,’ and she said, ‘if [ICE] stops you, read this paper.’ So I learned a little about the rights I had.”- 40-year-old Mexican immigrant man in Texas

“In the church I go to, they gave us a flyer telling us our rights in case we encounter ICE, or they come to our house or we encounter them in the street, in the office. They gave us something to read for reference.” – 54-year-old Colombian immigrant woman in New York

“I follow many social media pages and associations that are pro-immigrant. They sometimes organize meetings with immigration lawyers, where they provide advice on what should be done and offer tips to people. So, I try to follow that to get valid information, mainly coming from actual lawyers to inform myself that way.” – 34-year-old Ecuadorian immigrant woman in New Jersey

“All of that [information about immigration policies] confuses me because I don’t know who is right, and I don’t know the truth. If something happens to me, I don’t know what I’m going to do because I don’t know who is credible.” – 55-year-old Mexican immigrant woman in Kansas

“You see a lot of things on the platforms, TikTok, Instagram, Facebook, some say one thing, other say another thing, it’s very difficult to believe in a lot of things that you see, that is why I say that the information is not adequate as it should be.” – 51-year-old Mexican immigrant man in California

“One of the questions and fears of certain friends, and also mine, for being an immigrant, we have the same rights than a resident or a citizen from here? That is the question, do we have the same rights? Can we remain silent when they stop us? Can we say that we are under the United States constitution?” – 51-year-old Mexican immigrant man in California

“There’s a problem, sorry, I say there’s a problem, because there’s information, but there’s also misinformation. A lot of false news comes out. But there should be some kind of mechanism to provide information about what to do in these cases.” – 30-year-old Colombian immigrant man in New York

“I would like to know all the rights that could defend me, to defend myself, in case one day I find myself in that situation. Because, honestly, I’m not prepared for it, and I don’t even want to imagine it.” – 28-year-old Salvadoran immigrant man in Texas

Some participants said they have sought legal advice from attorneys but noted concerns about costs and potentially fraudulent immigration attorneys or notarios. Some participants said they have consulted immigration attorneys to better understand their rights as an immigrant and/or to discuss adjusting their immigration status. Participants who consulted or who had considered consulting an attorney said that the costs associated with legal services were a major barrier, with one immigrant noting they were charged a one-time, $10,000 cash payment from a lawyer. A few participants also noted concerns about “notarios”, who may represent themselves as licensed or qualified to provide immigration assistance, but are not and take advantage of the Hispanic immigrant community.

Nearly all participants said that they are experiencing resounding levels of fear and uncertainty due to shifting policies under the Trump administration. These fears extended beyond those who were undocumented to those with lawful status. Some participants noted that, during the campaign, President Trump said enforcement activity would focus on criminals, but now it feels like everyone is at risk since the administration is focusing enforcement activity on all undocumented immigrants, even if they have not committed crimes, and has eliminated lawful status and protections for some groups. Some participants were uncertain about who is and who is not at risk for deportation and the implications of registering with the Department of Homeland Security as an undocumented immigrant under the new requirement established by President Trump. A few participants noted that they heard about or previously experienced terrible conditions in detention centers, making them feel like they will take whatever steps necessary to avoid detention. Participants also noted a lot of uncertainty about the future given continually shifting policies and worried whether they or their family members may be at risk for deportation in the future. Some participants also noted growing fears among children about their parents being detained or deported.

In Their Own Words: Immigration-Related Fears and Uncertainty

“I mean, all kinds of things can happen, so you live with that fear when you go out, because obviously, as I said, you don’t know what will happen. Especially in my case, I have a six-year-old child, and that worries me a lot, mostly because of the immigration issue.” – 49-year-old Costa Rican immigrant woman in New Jersey

“Even the children worry. ‘Mom, did you get home safely?’ They’re already thinking that something is going to happen to us on the street. So that also makes me very nervous, knowing that there might come a time when they could be left here alone. That’s something, you die, and they die from sadness. An unthinkable thing.” – 54-year-old Colombian immigrant woman in New York

“You think, ‘OK, I don’t know how long I’ll really be able to stay here. I don’t know if I’ll get deported.’ And I’m also thinking about my daughter’s future because now it’s not just about me; it’s about her too. So yes, it’s really worrying.” – 39-year-old Venezuelan immigrant woman in Iowa

“And the issue is that, as far as I know, ICE has a daily quota they need to meet…so they pick up whoever, whether they have papers or not. That’s why there are also cases where they even pick up citizens in their desperation to take everyone….” – 54-year-old Colombian immigrant woman in New York

“… [the news was] saying that the immigrants had to register, and they even were given the immigration page, and they were showing supposedly the steps to follow… it gave me a lot of anxiety because… a record is saying here I am openly, you can come to look for me whenever you want.” – 52-year-old Mexican immigrant woman in California

“At the border, immigration took my visa because that day they started investigating why I had a child here and was here illegally. They took it away, and with lies, they made me sign a paper in English…that said I didn’t want my visa back. It was impossible for me to sign that I didn’t want my visa, but they lied to me and told me that if I didn’t sign, they would send me for detention here…So, out of fear, I signed, and they sent me back to Mexico.” – 42-year-old Mexican immigrant woman in Texas

In some cases, participants’ fears have been amplified by increases in enforcement activity in their communities as well as by news and social media reports of immigration raids. Participants living in border areas in California and Texas were particularly likely to report a large presence of ICE agents in their communities and noted that there was this presence before President Trump took office. However, some participants, particularly those in Texas, reported that the atmosphere was different now with ICE agents having “their weapons” or being “dressed in civilian clothes.” Several participants said they know someone who was detained or deported since President Trump took office, including neighbors and family members. Many participants noted that news stories and social media posts about enforcement activity can stoke fears, but that sometimes the social media posts about raids in the community are false. Some participants indicated that they knew that enforcement activity can now happen in places that were previously protected, such as schools and churches, further adding to their fears.

In Their Own Words: Experiences with Immigration Enforcement

“It’s very different for us, those of us who live on the border. For me, it’s normal. I can go into a store, a convenience store, and I might run into an immigration agent, a border patrol agent in green, and I can see them anywhere here in the Valley. I’m not afraid of them, but it’s very different now with ICE agents because they wear their vests, their weapons, and we already know that ICE agents will go after anyone, anyone who looks Latino.”- 40-year-old Mexican immigrant man in Texas

“Here where I live is very quiet, but [the influencers] scare you on social media.” – 41-year-old Mexican immigrant woman in California

“I think social media makes us very scared, but up until now, from everything I’ve heard, I haven’t seen anything.” – 42-year-old Mexican immigrant woman in Texas

“The friend said, that [ICE] go around dressed in civilian clothes and stand on the corner, but I already saw a case like that with my neighbor. They took the neighbors, but they were dressed in civilian clothes. I didn’t think it was ICE until later, when a daughter came and told me ‘Didn’t you see that they took my parents?’ and I told her I had seen it but I thought it was someone, a friend.” – 58-year-old Mexican immigrant man in Texas

“My cousin’s wife contacted me to ask how we were doing and how everything was around me because they deported her older nephew, but he was a person with valid TPS [Temporary Protected Status]. She says that it was simply because he had a tattoo, and he ended up in El Salvador.” – 39-year-old Venezuelan immigrant woman in Iowa

“…here where I live, when everything first started, in the Walmart that is five minutes from here, [ICE] supposedly did a raid. I don’t know if they took someone specific but just knowing that they were nearby scares me. Even if it’s the regular police I get scared.” – 34-year-old Ecuadorian immigrant woman in New Jersey

“They now even went into churches when before they used to say they couldn’t.” – 29-year-old Mexican immigrant woman in Kansas

“I also see a lot of TikToks where [immigration enforcement officials] are looking in churches and in all the restaurants, they’re looking around. So, yes, you live with that fear.” -29-year-old Mexican immigrant woman in Kansas

“…We live with fear… you see a lot of things on TV and in the news. I’m afraid when my daughter goes to university, afraid that she might not come back. You go out and as we say in my country, you’re “paniqueado” [panicked] looking around everywhere if you see something strange.” – 54-year-old Dominican immigrant woman in New York

Some participants said they have planned for the care of their children or other family members in case they are detained or deported. Some participants said they spoke with their children about potential scenarios involving detention, deportation, and/or family separation and said that they had assigned a local guardian for their children in case of such an event. A few also reported making plans for their homes or businesses in case they are detained or deported. However, others said they were avoiding talking to their children and other loved ones about potential deportation so as not to create more fear and stress.

In Their Own Words: Plans for Potential Detention or Deportation

“I spend my time thinking about scenarios of how to solve things, who’s going to take care of my son, who’s going to take care of my mom, how can I take them with me. I mean, I spend my time thinking about it, and sometimes I can’t sleep.” – 49-year-old Costa Rican immigrant woman in New Jersey

“A friend of mine, who is a citizen, told me ideally, my daughter should have a guardian. They told me to give her a power of attorney because in case I were to be deported.” – 57-year-old Colombian immigrant man in Iowa

“We have talked with the children, to be prepared, options… financial matters and all that, this situation has accelerated the process to have options, A, B, C and D, then, things that before we didn’t focus on too much, we are focusing on today because it’s more likely, so we have to be prepared with the children regarding housing, finances, family, or people to go to, in case God forbids that something happen.” – 40-year-old Mexican immigrant man in California

Impacts of Fears on Workplaces and Employment

Some participants said they have become increasingly fearful of going to work and/or that they have noticed fewer workers showing up at their workplaces due to immigration-related fears. Those working in restaurants or transportation also reported declines in income due to fewer people leaving their homes to eat or travel. Those employed in factories, construction work, and field work said they were working longer hours and more shifts since some coworkers had left. While this resulted in higher incomes for some, others felt stressed about the increases in hours and some of those working in management roles said that they were struggling to find new workers to replace those who left, with one noting that, “no one wants to work right now… they’re really scared”. While one participant said her employer had offered to provide support and resources to help protect her, another said that her employer had told her there was nothing the company could do if there was a raid at the workplace.

In Their Own Words: Impacts of Immigration-Related Fears on Work

“Once Trump came in with immigration, with the idea of wanting to kick everyone who’s not from this country, companies are deciding 100% American first. So, they’re getting rid of all Hispanic people, leaving many without jobs…Many Hispanics do the hard work, the work that Americans don’t want to do. So, [Hispanics] have been left without jobs, which is why the economy has gone down. There are no people filling those gaps.” – 34-year-old Ecuadorian immigrant woman in New Jersey

“I work in a restaurant, and we depend on tips. So, there are fewer clients because of the fear that they might get caught [by ICE]. Many prefer to bring their lunch and not go out from work, from home to work and from work to home. …They no longer go to restaurants because, supposedly, there were going to be raids on restaurants too.” – 29-year-old Mexican immigrant woman in Texas

“I’m a driver, and people that always use transportation has decreased a lot, they don’t use the transportation or they haven’t gone to work, so it has changed.” – 51-year-old Mexican immigrant man in California

“In my case, I had six workers, and three of them quit because of fear. They stopped working. Once all the raids started, they left. They left me with the work unfinished because of fear. Now people don’t want to work, they’re scared, they don’t want to go to work because they are scared. I honestly am struggling a lot because no one wants to work right now in business like this. They’re really scared.” – 42-year-old Mexican immigrant woman in Texas

“I work in the fields, and in fact, days ago when they said immigration was in Bakersfield a lot of people stopped going to work…” – 41-year-old Mexican immigrant woman in California

“My bosses are American too, and they’ve told me that if I need anything, they even told me that they need me so much and that if possible, they would try to figure out what they had to do, but that they would not let me leave. I also feel a lot of protection from them.” – 42-year-old Mexican immigrant woman in Texas

“[I feel] fear because [ICE] can come in if they want to, they are not respecting anything. For example, in my job, I asked my boss, the boss who really commands, what the corporation would do if [ICE] came. Their answer was that, if they come, they can come in, and we have no backup. If they come, they come in and ask for documents without a warrant.” – 34-year-old Ecuadorian immigrant woman in New Jersey

Impacts of Fears on Daily Lives

Participants reported stark changes in their daily lives due to immigration related fears. Many said they were limiting their time outside the home and avoiding a range of activities, such as driving, traveling, and participating in community and recreational activities, including attending church or events. One participant said she had started attending church virtually and a few others said they were no longer going to church due to fear. Many reported seeing empty restaurants, streets, and parks in their neighborhoods. Some participants noted that these changes are leading to feeling isolated and alone and spending long hours inside the home. Many said, when they do go out, they are constantly on edge and looking around the environment because they do not feel safe.

Some participants also described impacts on children’s daily lives and routines, noting that they or others in their community were scared to send their children to school, particularly in the days immediately following the election. Other participants talked about no longer being able to take their children to parks in their neighborhoods or on other outings or vacations and expressed sadness about not being able to explain to their young children why. Some participants also described instances of their children taking on more family responsibilities. For example, one participant said his U.S.-born daughter has taken on primary responsibility for running the household errands to limit the parents’ time outside the home. The participant also said that his daughter was considering joining the Army because she was told it helps her father adjust his immigration status.

In Their Own Words: Impacts of Immigration-Related Fears on Daily Lives and Routines

“We are no longer going to be able to renew our cars, for example, I used to renew it with my passport, and this will affect me because my little truck is in my name, and now we won’t be able to do that anymore.” – 29-year-old Mexican immigrant woman in Texas

“So, it’s like we’re in a constant winter, you know? Like what my colleague said, we’re always at home. So, now that summer is here, now that all of this started this year, everyone is kind of holding back when it comes to going outside, to any type of activity, whether it’s working or having some kind of business activity or any leisure activity. So, that affects you physically, emotionally, mentally as well…. You don’t feel free. You feel like you’re in a cage.” – 30-year-old Colombian immigrant man in New York

“A week before the stores were full, and the following week they were completely empty. I mean, that’s how I saw the impact [the election] had.” – 24-year-old Mexican immigrant man in Missouri

“Living under the radar, not raising alarms, staying out of situations, even staying away from a ticket, just in case they stop you for a ticket. Basically, living under the radar, as if you don’t exist.” – 30-year-old Colombian immigrant man in New York

“In the church that I visit, many Mexicans go there. …I’m almost not going to mass anymore because of…the fear. There were a lot of Mexicans, and lately the church is empty, and they’re scared.” – 54-year-old Dominican immigrant woman in New York

“Socializing… going places, whether it’s restaurants or malls because of the uncertainty of not knowing when they will do a raid. People prefer to stay home instead of exposing themselves.” – 34-year-old Ecuadorian immigrant woman in New Jersey

“I have coworkers who, when all of this started, stopped taking their children to school out of fear. So the children stayed home and missed days until they felt a little more at ease.” – 55-year-old Mexican immigrant woman in Kansas

“Yes, [fears] affected my children because… I told them about the reason for my behavior, I didn’t want to go to the store; I would just leave work, work is just two or three minutes away, right here close by, and I would lock myself up. I didn’t go out. I stayed like that. I went into this horrible fear, something awful, because I thought ‘I’m not going to fall again’…. I talked to my children, and my children cried, and it’s really sad, all of this.” – 50-year-old Honduran immigrant woman in Texas

“In my case, I have a six-year-old child. Honestly, I’m afraid to take him to the park, and he asks me, ‘Mom, why don’t we go to the park?’ How do I tell him? I’m scared. How do I tell him that we’re at risk? He doesn’t understand, he just wants to go to the park, but for me, it breaks my heart.” – 49-year-old Costa Rican immigrant woman in New Jersey

Impacts on Health and Well-Being

Immigration-related fears have taken a toll on the mental health and well-being of many focus group participants, as well as their children. Many participants described feeling anxious, stressed, depressed, isolated, and lonely due to the changes in their daily lives and constantly having to be on high alert. Participants described suffering from insomnia, loss of appetite, and symptoms such as stomach problems and migraine headaches due to fears and stress. For example, one participant said that she had lost “almost ten pounds in two weeks.” Participants also talked about how the environment has impacted children, with them experiencing increased fears and feelings of sadness.

In Their Own Words: Impacts of Immigration-Related Fears on Health and Well-Being

“I’ve realized that now I have a lot of fear at night, I think and think about what’s going to happen, what’s going to happen to me; I have insomnia now, which I didn’t have before.” – 55-year-old Mexican immigrant woman in Kansas

“Emotionally, well, it makes you feel sad, feel alone, I mean, not feeling part of anything, not feeling part of a community. I mean, you don’t interact with anyone, you don’t have anyone to talk to, no one to share your stories with, no one to listen to, you feel sad, you feel depressed, anxiety.” – 34-year-old Ecuadorian immigrant woman in New Jersey

“They [kids] were terrified when they saw what was on the news, hearing families talk, and it created fear in the kids. They’d start crying, and yes, it affects them too, especially when they’re at an age when they’re aware and can understand what’s going on.” – 55-year-old Mexican immigrant woman in Kansas

“I’ve had insomnia for two weeks. I’ve been going to sleep at 2, 3, 4, or 5 in the morning, and I have to wake up at 6. So yes, it’s affecting me. I’m more nervous, my sleep is very disturbed. I’ve lost almost ten pounds in two weeks, and it wasn’t really from January or February, we’re talking about just March.” – 40-year-old Mexican immigrant man in Texas

“A while ago, I had some stomach problems, and stress and anxiety make it worse. For me, it’s like it damaged my health.” – 24-year-old Mexican immigrant man in Missouri

Many participants report avoiding seeking health care due to concerns about costs and fears. Some participants said they are more fearful of seeking health care due to heightened fears, with a few saying that they had heard on the news that hospitals may be sharing patient information with ICE. While hospitals in Texas and Florida request information on immigration status under recent state laws, at the time the focus groups were conducted, such information was not shared with immigration officials for enforcement purposes. However, beyond fears, costs continue to be a major barrier to health care, particularly amid growing financial challenges. A few participants said that when they do seek care, they prefer to go to smaller Hispanic-serving community clinics or pop-up medical fairs as those are more affordable and that they trust those places more than larger health care facilities. Some focus group participants said they prefer to use “natural” or home health remedies instead of seeking mainstream health care in the U.S., in part due to immigration-related fears as well as challenges paying for health care in the U.S. Several participants also said that they relied on medicines that they or a family member brought from their home countries instead of purchasing medicines or seeking health care in the U.S.

In Their Own Words: Barriers to Health Care

“For the 21 years I’ve been here, the times I’ve gone to the doctor have been very few, and honestly when I go to the doctor, it’s because I feel like I’m dying or can’t bear some kind of pain.” – 40-year-old Mexican immigrant man in Texas

“I have really bad arthritis, and I’ve been to the hospital many times, but now I don’t even want to go. I don’t take my medicine, I don’t buy it because I don’t have much money. The help to get a doctor is just bad.” – 43-year-old Mexican immigrant woman in Texas

“Personally, I’ve never gone to typical American clinics, like the regular ones. I always go to places recommended by other Latinos… so at least, I don’t feel like they’re keeping a record of me or asking for papers or anything like that.” – 31-year-old Colombian immigrant woman in North Carolina

“Yesterday, I was in a car accident. I was hit, so I felt really bad. When the police officer asked me if I wanted an ambulance to take me to the doctor, I started thinking, ‘Should I go to the doctor?’ I had already heard that doctors might call immigration or ask about your status in the hospitals.” – 43-year-old Mexican immigrant woman in Texas

“…I prefer to stay at home, cure myself with natural remedies, with medicine from my country, and try to take care of my health so I don’t have to expose myself.” – 34-year-old Ecuadorian immigrant woman in New Jersey

“I also try home remedies that I know work… But yes, I’ve gone like two or three times to clinics where I feel safe… where they don’t take my personal information.” – 29-year-old Mexican immigrant woman in Kansas

Many focus group participants are fearful of accessing public programs, including health coverage, and there is persistent confusion and misunderstanding around whether participating in these programs can negatively impact immigration status. Most participants said that they were not using public assistance programs due to immigration-related fears and/or a preference to be self-reliant. A number indicated that they believe that using such programs may negatively affect their ability to adjust their immigration status in the future or put them at risk for deportation, although under public charge policy as of the time the focus groups were conducted, use of non-cash assistance programs does not negatively affect immigration status and programs cannot share information for immigration enforcement purposes. Some participants indicated that they were receiving health coverage or other assistance for their children, most of whom are U.S. citizens. Some participants also said they received health coverage for themselves through Medi-Cal, which offers state-funded coverage to immigrants regardless of status in California, or a local program in Harris County, Texas, knows as the “Gold Card.”

In Their Own Words: Concerns about Participating in Public Programs

“I prefer to not ask for anything, to avoid leaving a record or trace.”- 31-year-old Colombian immigrant woman in North Carolina

“From what I’ve heard from other people, they’re afraid that if they apply today, they might not be able to fix their immigration status in the future because they’ve received help from the government. That’s why I’ve never applied.” – 50-year-old Honduran immigrant woman in Texas

“Yes, in my case, I try not to [apply for public programs] because I feel like I don’t want to be on any list, like I’m a burden to the government. The only thing I do receive is, of course, medical insurance for my son, but I don’t think I’ll apply for food stamps or any other benefits because of the fear that I don’t want to be a burden.” – 49-year-old Costa Rican immigrant woman in New Jersey

Future Outlook

Several participants said they are considering leaving the U.S. or are uncertain about their future plans due to the current environment. KFF survey data found that most immigrants would still choose to move to the U.S. knowing what they know now. In contrast, several focus group participants said they would not choose again to move to the U.S., in part due to the strong anti-immigrant rhetoric in society and in part due to the economy. Some participants also said that they were making plans to move back to their countries of birth in the future while others expressed uncertainty and said that they were going to “wait and see what happens with this government.” Participants who were considering moving back to their countries of birth also noted challenges associated with a potential move, such as no longer being familiar with their country of birth, not knowing where to go back to, and not having any family left there since their lives, livelihoods, home, and families are in the U.S.

In Their Own Words: Future Outlook

“I spend all the time thinking because I’ve been here for 40 years, I came when I was 19, so I only know this place. So going back to a country I don’t know, I don’t know what’s going to happen, where I’m going to go, or even if I have family there.” – 49-year-old Costa Rican immigrant woman in New Jersey

“… we have started to study options, studying possibilities, there’s not a set plan, but we have the idea.” – 38-year-old Venezuelan immigrant man in California

“I already spoke to my children, and I told them that if anything happens to me again, I won’t return to the United States. I have a house, I have everything. I don’t care anymore. I’m OK because my kids have their houses, I left them everything. Now I can leave in peace, but I won’t come back here.” – 42-year-old Mexican immigrant woman in Texas who had past experience with detention

“It’s like one day we saw a life here, now we just have to wait and see what happens with this government, and if things become very hard we could end up having to go back.” – 31-year-old Colombian immigrant woman in North Carolina

Methodology

KFF conducted four focus groups with 29 Hispanic adults who are themselves a likely undocumented immigrant or living with a likely undocumented immigrant across the country to provide deeper insights into the experiences of these families amid the current environment. The four groups were conducted in March 2025 virtually in Spanish and each lasted two hours. Each group was mixed gender and included six to eight participants from several regions in the U.S.: California, Texas, New Jersey and New York, and parts of the Midwest (Kansas, Missouri, North Carolina, Nebraska).

For each group, participants were chosen based on the following criteria: Must be at least 18 years of age, identify as Hispanic, and either they or someone living with them are a noncitizen immigrant without lawful permanent resident status (a “green card”) and without a valid work or student visa, meaning they were likely undocumented. In addition, groups were chosen to represent a mix of household composition, including at least some participants who are parents; a mix of areas of employment; and a preference for recruiting participants who had sought health care in the U.S. and have someone in their household with an ongoing health condition. Participants had a variety of countries of birth including: Mexico (14), Colombia (4), Ecuador (3), El Salvador (2), Venezuela (2), Costa Rica (1), Argentina (1), Dominican Republic (1), and Honduras (1).

PerryUndem recruited and hosted the focus groups. The screener questionnaire and discussion guides were developed by researchers at KFF in consultation with PerryUndem. Groups were audio and video recorded with participants’ permission. Transcripts and recordings were de-identified and are used for research purposes only; they will be deleted after use. Each participant was given $200 after participating.

Congressional District Interactive Map: People with Medicare and Medicaid (Dual-Eligible Individuals)

Published: May 7, 2025

The recently passed budget resolution targets cuts to Medicaid of up to $880 billion or more over a decade to help pay for tax cuts. Major cuts to Medicaid may impact coverage for the almost 1 in 5 Medicare beneficiaries (11.9 million) who are also enrolled in Medicaid. For people covered under both programs (“dual-eligible individuals”), Medicare is the primary payer and covers medical acute and post-acute care, including skilled nursing facility services and home health care. Medicaid wraps around Medicare coverage by paying Medicare premiums and in most cases, cost sharing. Most dual-eligible individuals (8.5 million people in 2025) are “full-benefit” enrollees, which means they are eligible for Medicaid benefits that are not otherwise covered by Medicare, including long-term carevision, and dental. The remaining 3.4 million dual-eligible individuals, “partial-benefit” enrollees, are eligible for Medicare premiums and often, cost sharing assistance, but not for full Medicaid benefits.

It is unclear what policies might be included in the reconciliation proposals, but significant reductions in Medicaid spending would have potential implications for Medicare beneficiaries who account for nearly 30% of Medicaid spending. The interactive maps below illustrate how many people are enrolled in Medicare and Medicaid in each congressional district, including the number of people receiving full Medicaid and partial Medicaid benefits. Key takeaways include:

  • There are at least 7,300 dual-eligible individuals living in each of the 435 congressional districts, with enrollment as high as 81,300 in some districts.
  • In each congressional district, there are at least: 4,100 full-benefit dual-eligible individuals and 100 partial-benefit dual-eligible individuals.
  • The average number of dual-eligible individuals is 24,700 in Republican districts and 30,000 in Democratic districts.
  • The share of dual-eligible individuals with full Medicaid benefits varies across congressional districts, ranging from 30% to 100%.
  • The top 10 Republican districts with the highest number of dual-eligible individuals are: FL26 (58,800); KY05 (58,000); FL27 (56,300); NY11 (53,000); FL28 (51,100); WV01 (48,500); CA01 (46,300); NY21 (45,700); CA22 (41,500); and AR01 (40,900).
  • The top 10 Democratic districts with the highest number of dual-eligible individuals are: NY13 (81,300); NY15 (73,700); NY08 (71,600); NY06 (64,800); ME02 (63,300); NY14 (57,800); NY09 (57,300); CA34 (56,500); MA01 (56,400); and NY10 (55,600).
Dual-Eligible Individuals by Benefit Type and Congressional District, 2025
Share of Dual-Eligible Individuals with Full Medicaid Benefits by Congressional District, 2025

Methods

Data: To calculate Medicaid enrollment by eligibility group and congressional district, this analysis uses the KFF analytic file that merged the 2021 Master Beneficiary Summary File (MBSF) Base and the 2021 Transformed Medicaid Statistical Information System (T-MSIS) Analytic Files (TAF) Research Identifiable Files (RIF) file using a Chronic Conditions Warehouse (CCW) beneficiary identifier crosswalk and Centers for Medicare & Medicaid Services Medicare Monthly Enrollment data for January 2025 (downloaded in April 2025).

Dual-Eligible Individual Inclusion criteria: Estimates include dual-eligible individuals in 50 states and the District of Columbia if (1) they were in both the MBSF and T-MSIS files using the CCW crosswalk, and (2) Dual-eligible individuals are assigned full-benefit status and partial benefit status using an “ever” approach and a hierarchy by giving priority to the full-benefit status. Individuals were a full-benefit dual-eligible individual in each year using the Medicare monthly DUAL_STUS_CD with values of 02,04,08 or the Medicaid monthly code DUAL_ELGBL_CD with values of 02,04,08 or the monthly code RSTRCTD_BNFTS_CD_03 values of 1,A,D,4,5,7. If not a full-benefit dual-eligible and the individual had DUAL_STUS_CD with values of 01,03,05,06 or the Medicaid monthly code DUAL_ELGBL_CD with values of 01,03,05,06 or the monthly code RSTRCTD_BNFTS_CD_03 values of 2,3,C,6,E,F they were assigned partial-benefit status. For this analysis, we excluded dual-eligible individuals who only had CHIP eligibility in the year.

Assigning Dual-Eligible Individuals to Congressional Districts: This analysis used the Missouri Census Data Center’s Geocorr 2022 tool to create a zip code-to-congressional district crosswalk and a county-to-congressional district crosswalk. Using those crosswalks, we assigned dual-eligible individuals to 119th congressional districts in the T-MSIS data.

In some cases, a county or a zip code can be split among multiple congressional districts. In those cases, enrollees were randomly assigned to a congressional district based on an allocation factor from the Geocorr 2022 tool that is calculated using the 2020 decennial census.

For each state, we calculated the percentage of people living in a zip code that aligned with a single congressional district and the percentage of people living in a county that aligned with a single congressional district. In most states, the zip code alignment was better, and we used the zip code crosswalk. In 9 states (AL, IA, KY, MS, MT, NC, NE, RI, and WV), the county alignment was better, so we used the county code crosswalk.

We applied the T-MSIS distributions of dual-eligible individuals by benefit status and congressional district to the CMS Medicare administrative enrollment data. Those data report monthly enrollment for dual-eligible individuals.

The sum of full-benefit and partial-benefit dual-eligible individuals enrolled may not add to total dual-eligible enrollment due to rounding. The sum of dual-eligible individuals across congressional districts may not add to state and national totals published in other KFF resources due to rounding.

This work was supported in part by Arnold Ventures. KFF maintains full editorial control over all of its policy analysis, polling, and journalism activities.

Women’s Experiences with Intimate Partner Violence

Published: May 6, 2025

Introduction

Intimate partner violence (IPV) is a persistent public health crisis that affects many women in the United States. IPV affects disproportionately affects women but also affects people of all genders. It has a wide range of negative effects on women’s physical and mental health, such as physical injuries, pregnancy complications, and substance use. IPV also has psychosocial impacts, affecting women’s safety, economic security and freedom, isolation, and ability to care for themselves and their children.

The 2024 KFF Women’s Health Survey provides data on women experiencing IPV in the past five years. This group includes women who said that in the past five years a current or former partner did at least one of the following: made them fear for their or their family’s safety, tried to control most or all of their daily activities, hurt them physically, forced them into sexual activity. However, this population does not include those who had experiences with IPV at earlier points in their lives or other forms of IPV and should not be used as an estimate of overall lifetime IPV prevalence Many women, particularly those who are older, may have experienced IPV prior to the last five years.

This analysis reports on a range of health topics affecting women who experienced IPV in the past five years, including their health care needs and use, barriers, and mental health. The impact on women who have been historically marginalized by society and health care systems, including those who are LGBTQ+, experience physical and mental disabilities, and those who are low-income is also examined. The survey was conducted from May 13 – June 18, 2024, online and by telephone among a nationally representative sample of 5,055 women ages 18 to 64.

Key Takeaways

  • One in five (19%) women ages 18 to 64 say they have experienced intimate partner violence (IPV) in the last five years. Higher shares of women with lower incomes, LGBT+ women, and those who identify as disabled report recent IPV.
  • Many women who have experienced IPV in the past five years contend with health challenges. Large shares characterize their physical (27%) and mental (46%) health as fair or poor. One in four say that a health condition keeps them from fully participating in work or other activities. Almost half of women who have experienced IPV in the past five years incurred a physical injury as a result.
  • Over one in ten (14%) women who have experienced IPV in the past five years say that at some point they did not receive health care services they needed related to IPV. Privacy concerns, fear, and intimidation are leading reasons why people experiencing IPV do not obtain health care.
  • There are differences in where women affected by IPV usually get health care. More than a third (35%) say their usual site of care is a clinic or health center. One in ten (9%) say it is the emergency room.
  • IPV is a major concern during women’s reproductive years. Among women who experienced IPV in past five years, four in ten said they experienced violence during their most recent pregnancy or in the year before or after the pregnancy.
  • Emergency contraception is an important back-up contraceptive for reproductive age women affected by IPV. One in five report using emergency contraception in the past year. One in ten also say they have obtained it since the Dobbs ruling in case they need it. These shares are approximately double the rates reported by women who have not experienced IPV in past five years.

Rates of IPV

One in five women ages 18 to 64 say they have experienced IPV in the past five years.

IPV presents in many forms, including physical, sexual, emotional, coercion, and online. The KFF Women’s Health Survey asked about a subset of IPV experiences that women have reported experiencing in the past five years. Approximately one in ten women say that in the past five years, a current or former partner has made them fear for their or their family’s safety (11%), tried to control most or all of their daily activities (11%), hurt them physically (9%), or forced them into sexual activity (9%) (Figure 1). In total, one in five (19%) women ages 18 to 64 said they have experienced at least one of these forms of IPV in the past five years.

Throughout this brief, this is the group referenced when discussing women who have experienced IPV.

One in Five Women ages 18 to 64 Report Experiencing Some Form of Intimate Partner Violence (IPV) in Past Five Years

Larger shares of women who are younger and have lower incomes consistently report experiencing IPV compared to those who are older and have higher incomes. Conversely, women who are Asian American or Pacific Islander report lower rates of IPV compared to women of other racial and ethnic groups. While women of all subpopulations experience IPV, rates are higher among some groups (Figure 2). More than one in four (27%) women who have lower incomes say they have experienced IPV in the past five years, about twice the share of those with higher incomes (14%). One in ten (9%) AAPI women report IPV in the past five years, which is lower than women of other racial/ethnic backgrounds.

One-third of women who are LGBT+ and one in four who identify as disabled report experiencing IPV in the past five years. Rates of all the IPV questions in the survey are higher among LGBT+ women compared to those who are not LGBT+ (Figure 2). Approximately one in five LGBT+ women said that in the past five years a current or former partner has made them fear for their or family’s safety (19%), tried to control most or all of their daily activities (20%), hurt them physically (18%), or forced them into sexual activity (18%). In total, twice as many LGBT+ women (32%) said they have experienced one of these forms of IPV in the past five years compared to non-LGBT+ women (16%). One in five women with a disability say they have feared for their or their family’s safety at the hands of a current or former partner (19%).  Overall, one in four (27%) women who identifies as disabled reports experiencing at least one form of IPV in the past five years.

Higher IPV Rates Among Women Who Are Black, Hispanic, Disabled, LGBT+, Have Lower Incomes. Rates are Lower Among Asian or Pacific Islander Women.

On average, women who have experienced IPV in the past five years have lower incomes and lower rates of private health insurance.

More than half (54%) of women affected by IPV in the past five years have low incomes, compared to one-third of those who have not (Figure 3). Insurance profiles also differ between women affected by IPV and those who have not, with a lower rate of private insurance coverage and higher rate of Medicaid coverage among those who have experienced IPV in the past five years compared to those who have not.  Almost half (45%) of women who have experienced IPV in the past five years have young children, and half (54%) are not married. This is in part a reflection of the fact that many women experience IPV at young ages.

More Than Half of Women Reporting IPV in Past Five Years Have Low Incomes and One-Third Are Covered by Medicaid

Women who have experienced IPV report higher rates of some health challenges, including disability and poorer health status. One in four women who have experienced IPV in the past five years rates their health as “fair” or “poor” (Figure 4). One in four (25%) also report having a chronic condition that keeps them from participating fully in work, school, or other activities. One in five (19%) say they identify as disabled. IPV may be a cause or contributor to these conditions or could exacerbate any of them.

One in Four Women Who Have Experienced IPV in Past Five Years Have a Health Condition that Limits Work, School and Activity

Health Care Access and Barriers

Women who have experienced IPV in the past five years have heavier reliance on clinics and emergency rooms for their health care. Just under half (47%) of women who have experienced IPV in the past five years say they usually get health care in a private doctor’s office, whereas this is the site of care for the majority (62%) of those who have not experienced IPV recently (Figure 5). Three in ten (31%) women who have experienced IPV in the past five years say they usually obtain health care at a neighborhood clinic or health center, and one in ten (9%) usually get care at an emergency room. These differences in site of care may be driven by income, given that women who have experienced IPV are disproportionately lower-income.

One in Ten Women Who Have Experienced IPV in Past Five Years Usually Seek Care in an Emergency Room

Almost half of women who have experienced IPV in the past five years incurred a physical injury as a result. Some of the most common injuries reported by people who experience IPV include head trauma, gynecologic conditions, and fractures. Overall, 45% of women who experienced IPV in the past five years say that their IPV experience resulted in physical injury, which translates to about one in ten (9%) among all women ages 18 to 64 (Figure 6). Among women who experienced IPV in the past five years, majorities of those who identify as having a disability (61%) and have lower incomes (52%) report having physical injuries from IPV. The shares are similar across White, Black, and Hispanic women.

Almost Half of Women Who Reported Experiencing IPV in Past Five Years Say They Had A Physical Injury As a Result

Over one in ten (14%) women who have experienced IPV in the past five years did not receive health care services they needed. Women who experience IPV may need a wide range of health care services related to the impact of IPV. However, 14% of women who recently experienced IPV were not able to get medical or mental health care services related to IPV (Figure 7). Three in ten women say they needed health care services and did obtain them, and more than half (56%) of women who experienced IPV in the past five years say they did not need health services related to their IPV experience.

Among Women Who Experienced IPV in Past Five Years, 14% Did Not Receive Health Care They Needed

Privacy concerns, fear, and intimidation are leading reasons why women experiencing IPV do not get care. People who experience IPV are typically dealing with multiple, complicated circumstances that can affect whether, when, and if they can disclose IPV and seek and obtain care. Among women who experienced IPV in the past five years and did not receive care that they needed, nearly six in ten (58%) say it is because they did not want anyone to find out (Figure 8). For some, fear of retribution from a partner is too high to seek care. Almost four in ten (37%) women who did not receive care say they feared the police or child protective services would get involved. Prior research finds that some women affected by IPV report that involvement of police authorities can backfire on them because they lose care of their children or are accused of crimes they did not commit. Health system barriers affect women experiencing IPV too. Almost four in ten (38%) say they could not afford to get care and one in ten (12%) say services were unavailable, which may be tied to their higher rates of uninsurance. Medical billing practices can make confidentiality challenging as violent partners may get a hold of billing statements and patient records.

Concerns About Privacy, Fear, and Intimidation Keep Many Women Experiencing IPV From Obtaining Needed Health Care

IPV and Mental Health Care

Violence, control, and coercion have severe negative effects on an individual’s mental health and well-being.  IPV is associated with higher rates of depression, anxiety, and substance use.  Mental health care has been identified as one of the essential health services needed for women affected by IPV.

Women who have been affected by IPV in the past five years have poorer self-reported mental health status and emotional well-being than those who have not. Almost half (46%) of women who have experienced IPV in the past five years describe their mental health and emotional well-being as “fair” or “poor,” twice the share of those who have not (Figure 9). Conversely, 42% of women who have not been affected by IPV in the past five years describe their mental health as “excellent” or “very good,” over twice the share of women affected by IPV (18%). Just over one-third of each group rates their health as “good.”

Nearly Half of Women Who Have Experienced IPV in Past Five Years Rate Their Mental Health as Fair or Poor

Many women encounter barriers to mental health care, particularly those affected by IPV. Among women who have experienced IPV in the past five year who rate their health as fair or poor, two-thirds (66%) say that in the past year they did not obtain mental health care they thought they needed. This is also the case for half (50%) of women with fair or poor mental health who have not experienced IPV recently.

IPV and Reproductive Health

IPV often begins during women’s reproductive years, and research has documented associations between IPV and several sexual and reproductive health challenges, including higher risk for sexually transmitted infections, inconsistent use of contraception, and high rate of unplanned pregnancies.

Among reproductive age women who experienced IPV and were pregnant in the past five years, four in ten say they experienced violence around the time of pregnancy. Pregnancy can be a risky period for people experiencing IPV, as some people report that violence increases or intensifies during and after pregnancy. Experiences with IPV have been linked with greater risk for negative maternal and fetal health complications, including preterm birth, low birthweight, as well as maternal and fetal death in the most severe cases.  Among women of reproductive age (18 to 49 years old) who were pregnant and experienced IPV in the past five years, one in five say they experienced IPV in the year prior to their last pregnancy (21%), during their most recent pregnancy (22%), and in the year after (20%). Overall, four in ten women of reproductive age who have experienced IPV say they experienced IPV during one of these periods (Figure 10).

Four in Ten Reproductive Age Women Who Report Experiencing IPV in Past Five Years Said They Experienced Violence Around the Time of Pregnancy

Among women who were pregnant in the past five years, a higher share of those who also experienced IPV (65%) said they needed mental health services during or within the first year after pregnancy, compared to those who were not affected by IPV (44%).

Eight in ten women of reproductive age who have experienced IPV in the past five years report using contraception in the past year. Preventing pregnancy is the leading reason for using contraception for this group, but one in five women who have experienced IPV in the past five years use it to prevent an STI.

The majority of reproductive age women who have experienced IPV, as well as those who have not, used contraception in the past year (Figure 11).  For most contraceptive methods, rates of use are similar between women who have experienced IPV in the past five years and those who have not. However, more women affected by IPV report using condoms (38%, 33% respectively) and withdrawal (32%, 21%) compared to those not affected by IPV, which is surprising given that these methods are controlled by men. One in four women affected by IPV report they have had a sterilization procedure, one in five use IUDs and one in five say they used EC. One notable difference is why women use contraception. One in five women who have experienced IPV in the past five years say they use it to prevent an STI, twice the share among women who have not experienced IPV in the past five years (9%).

Reproductive coercion, control by an intimate partner over reproductive health issues such as use of contraception or an abortion, is also a form of IPV. More than one in ten (13%) women who have experienced other forms of IPV in the past five years also report that a partner has tried to stop them from using contraception so they would become pregnant against their will (data not shown).

A Higher Share of Women Who Have Experienced IPV Report Using Contraception to Prevent Sexually Transmitted Infections

One in four reproductive age women who have experienced IPV in past five years says they or their partner made a change in contraception practices because of the overturning of Roe v. Wade. Since the 2022 Supreme Court ruling that overturned Roe v. Wade, many states have banned or severely restricted abortion access, which has prompted some people to make changes in their use of contraception. Overall, nearly twice as many women affected by IPV (26%) say they’ve made a change than those who have not recently experienced IPV (14%). In particular, 10% of reproductive age women who have experienced IPV in the past five year has obtained EC to have on hand in case they need it. Almost one in ten (8%) report starting contraception or switching to a more effective method (Figure 12).

One in Four Reproductive Age Women Who Have Experienced IPV in the Past Five Years Report Changing Contraceptive Practices Because of Overturn of Roe