Most Hispanic Immigrants Say Their Lives Are Better In The U.S. But Face Financial And Health Care Challenges: The 2023 KFF/LA Times Survey of Immigrants
Findings
Note: This content was updated on February 14, 2024 to correct the description of how states were classified in terms of expansiveness of coverage for immigrants.
Executive Summary
Hispanic immigrants comprise the largest share of the immigrant population in the U.S., and about a third of Hispanic or Latino adults in the U.S. are immigrants. This report provides an in-depth look at the varied experiences of Hispanic immigrants living in the U.S. and highlights the unique challenges many face, as Hispanic immigrants are more likely than other immigrant groups to have limited English proficiency (LEP), be noncitizens, have lower household incomes, be uninsured, and have lower levels of educational attainment. This report details how these factors affect the experiences of Hispanic immigrants, including at work, in their communities, and in accessing health care and other services.
Despite these challenges, this report also highlights the resiliency and optimism of the Hispanic immigrant population. It reveals that, regardless of their current economic situation, most Hispanic immigrants report a higher quality of life in the U.S. than in their countries of birth and believe their children’s lives will be better than their own. Most Hispanic immigrants are working, one in four of whom report being self-employed or a small business owner, and many provide financial support to family in their countries of birth even when their own incomes are limited. Moreover, while many face challenges, circumstances vary across Hispanic immigrants, with those who are higher income and who have a green card, valid visa or citizenship faring better across many measures. However, some difficulties, such as unfair treatment in the workplace, are shared across Hispanic immigrants regardless of income or immigration status. Enhanced understanding of Hispanic immigrant experiences not only provides insight into the diversity of the population but can also help focus initiatives, policies, and resources to help address the challenges they face. (For a shortened, Spanish-language version of this report, click here.)
This report is based on The Survey of Immigrants, conducted by KFF in partnership with the Los Angeles Times during Spring 2023, the largest and most representative survey of immigrants living in the U.S. to date. With its sample size of 3,358 immigrant adults, including 1,207 Hispanic immigrant adults, the survey provides a deep understanding of immigrant experiences, reflecting their varied countries of origin and histories, citizenship and immigration statuses, racial and ethnic identities, and social and economic circumstances. KFF also conducted focus groups with immigrants from an array of backgrounds, which expand upon information from the survey (see Methodology for more details). Other reports from this survey include an overview report, a health and health care experiences report, a report on politics and policy and a report examining Asian immigrant experiences.
Key Takeaways
A majority of Hispanic immigrants in the U.S. are from Mexico, are long-term U.S. residents, and are employed; yet they face significant socioeconomic challenges. Hispanic immigrants include people born in Mexico (53%), Central America (17%), South America (16%) as well as smaller shares from other regions and countries.1 Three in four (77%) Hispanic immigrants have been in the U.S. for ten years or longer and two-thirds (67%) are employed, yet a majority live in lower income households (less than $40,000 per year). Two-thirds of Hispanic immigrants have limited English proficiency (LEP) and a similar share have a high school education or less. A majority (56%) are noncitizens, including one in four who are likely undocumented.
Like immigrants overall, most Hispanic immigrants came to the U.S. for better opportunities and most feel they are better off as a result of immigrating, with those from Central America especially likely to cite safety as a key benefit. About eight in ten Hispanic immigrants say they are better off compared to their own parents, and two thirds say they think their children’s lives will be even better, with particularly high levels of optimism for their children’s future among noncitizens and those from Central America.
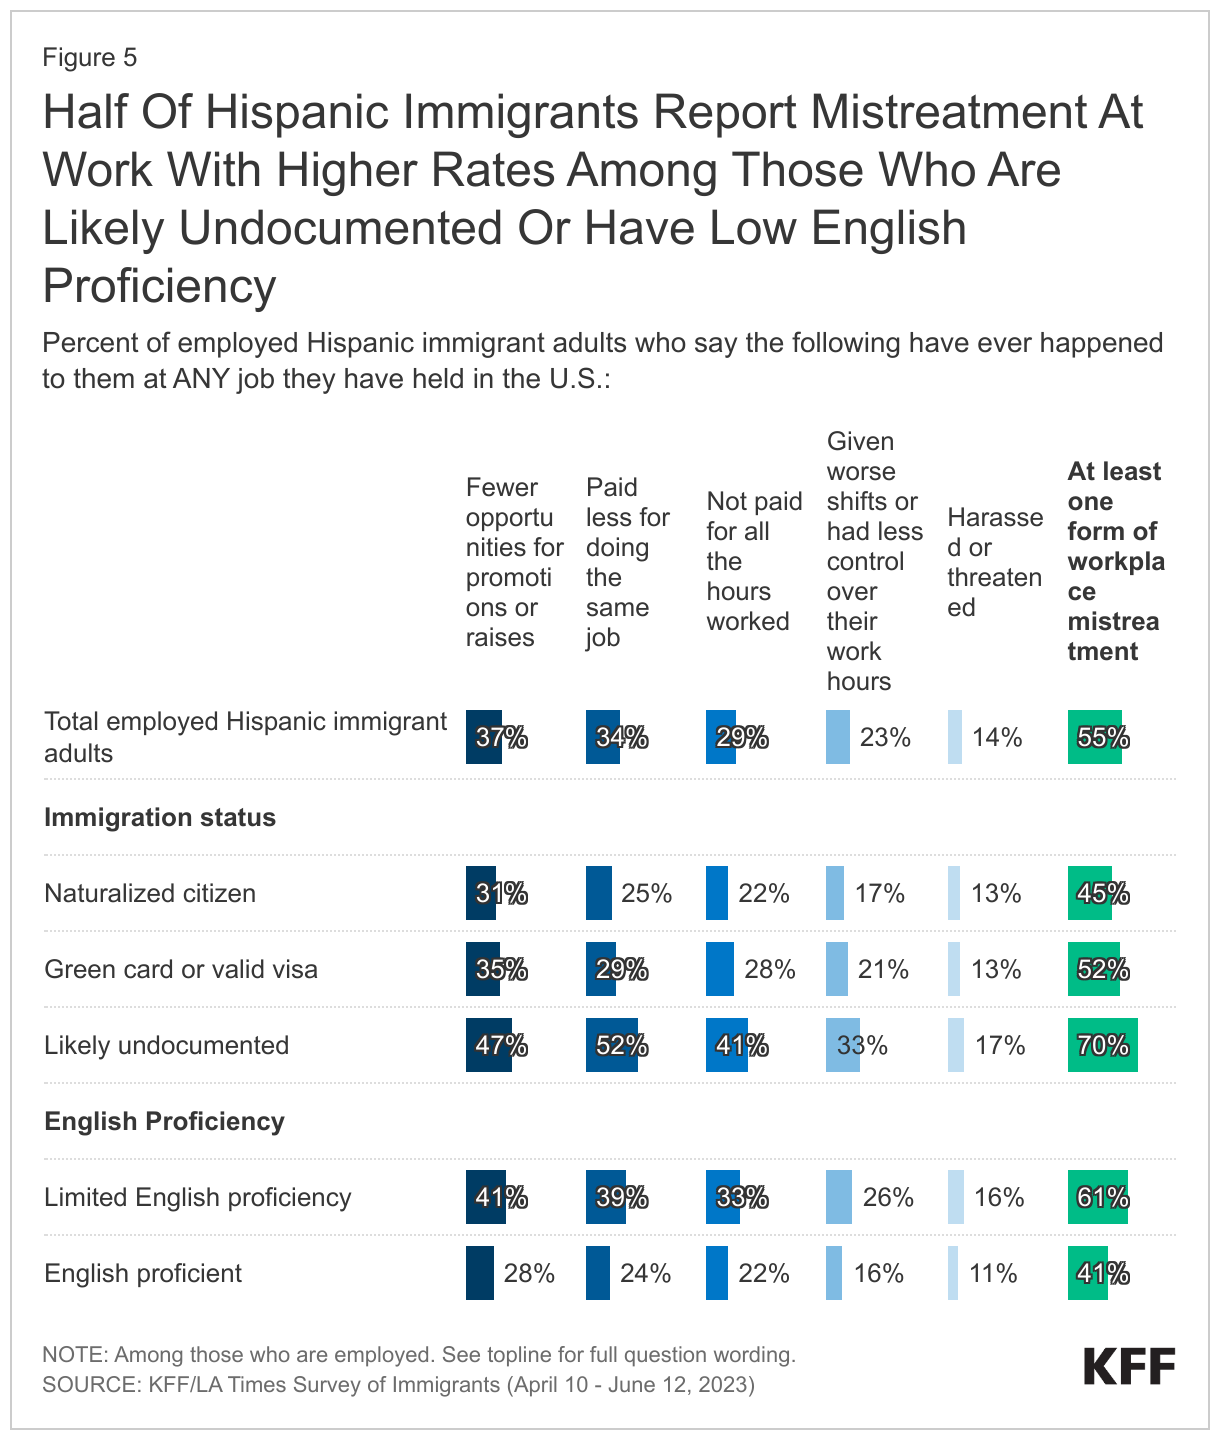
Most Hispanic immigrants are employed, yet many face unfair treatment in the workplace even among those who are citizens, are English proficient, and have at least a college degree. Two-thirds (67%) of Hispanic immigrants are working, mainly in hourly jobs. Despite high rates of employment, most have annual household incomes under $40,000 leading to challenges affording basic needs. Among working Hispanic immigrants, at least half (55%) report experiencing discrimination in the workplace. Even among those who are citizens (45%), are English proficient (41%), and who have at least a college degree (52%), substantial shares say they experience mistreatment at work because they are an immigrant.
Among the two-thirds of Hispanic immigrants who have limited English proficiency (LEP), most report experiencing language-related challenges. A majority (58%) of those with LEP say that difficulty speaking or understanding English has made it hard for them to access key services or get a job. Hispanic immigrants with LEP also report higher rates of workplace discrimination and difficulty understanding U.S. immigration laws compared to those who are English proficient.
Substantial shares of Hispanic immigrants, particularly those who are likely undocumented, say they lack sufficient information about U.S. immigration laws and policies, worry that they or a family member could be detained or deported, and have confusion about rules related to the use of public programs that help pay food, housing, or health care. About eight in ten (79%) Hispanic immigrants, rising to nine in ten of those who are undocumented, are uncertain whether use of public programs that help pay for health care, housing or food can decrease one’s chances for green card approval or incorrectly believe this to be the case. Four in ten Hispanic immigrants, including three-fourths of those who are likely undocumented, worry that they or a family member could be detained or deported.
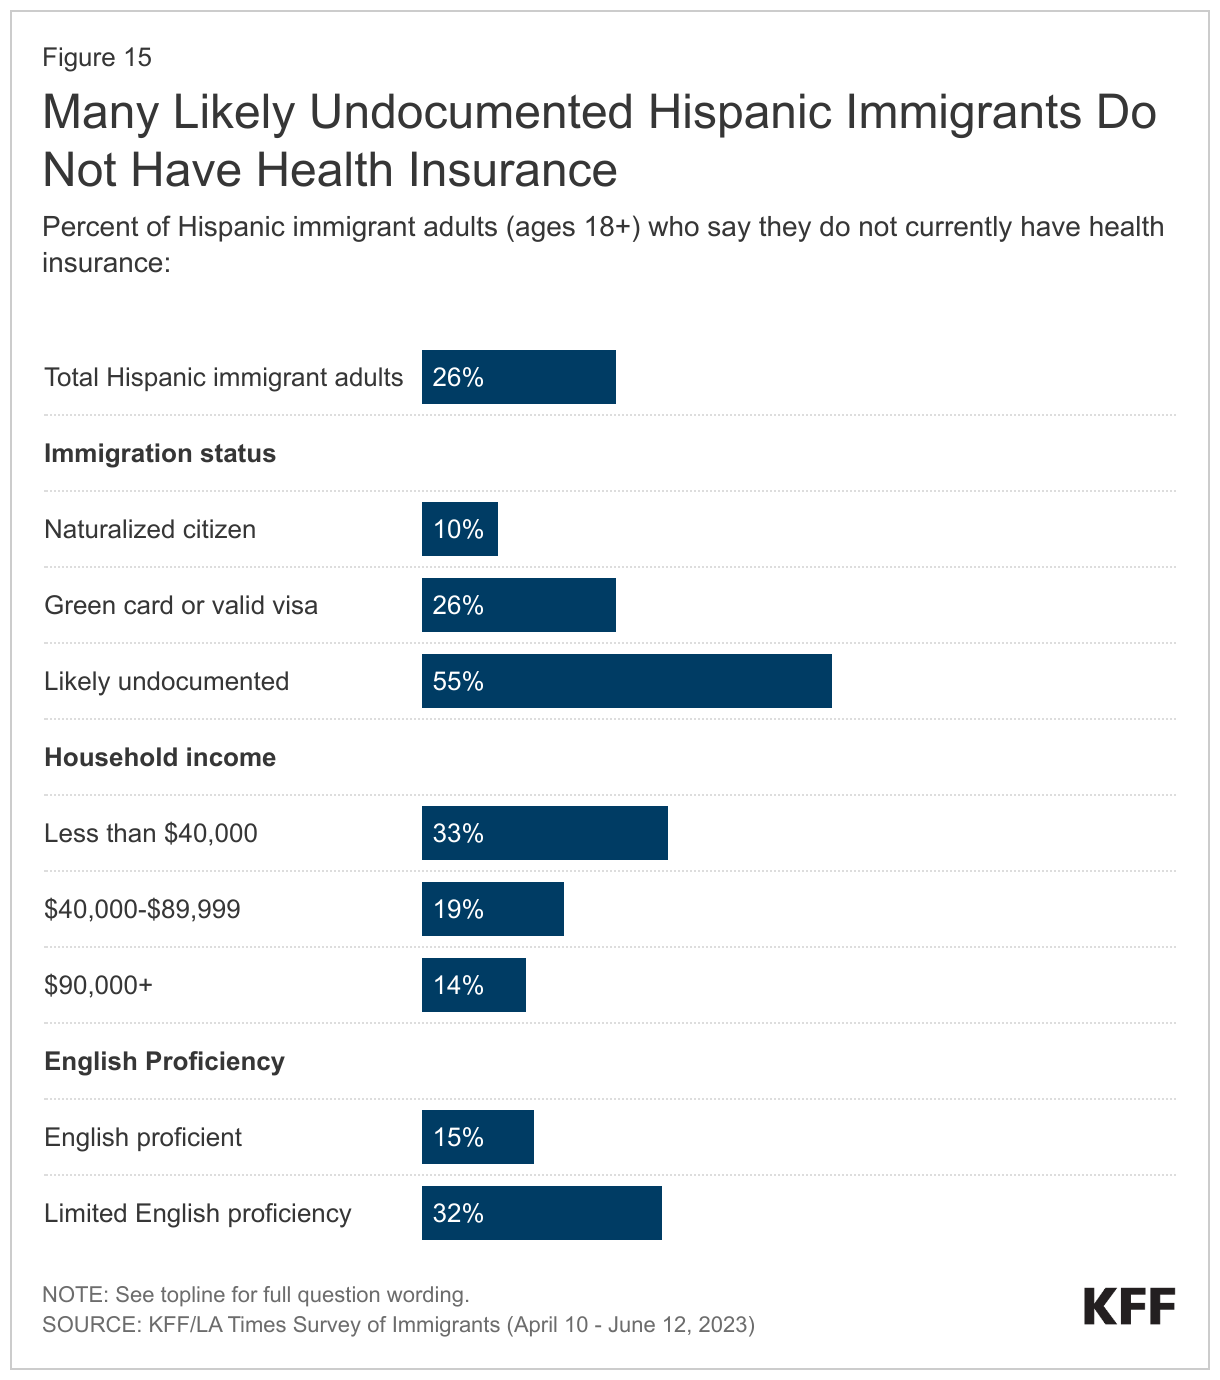
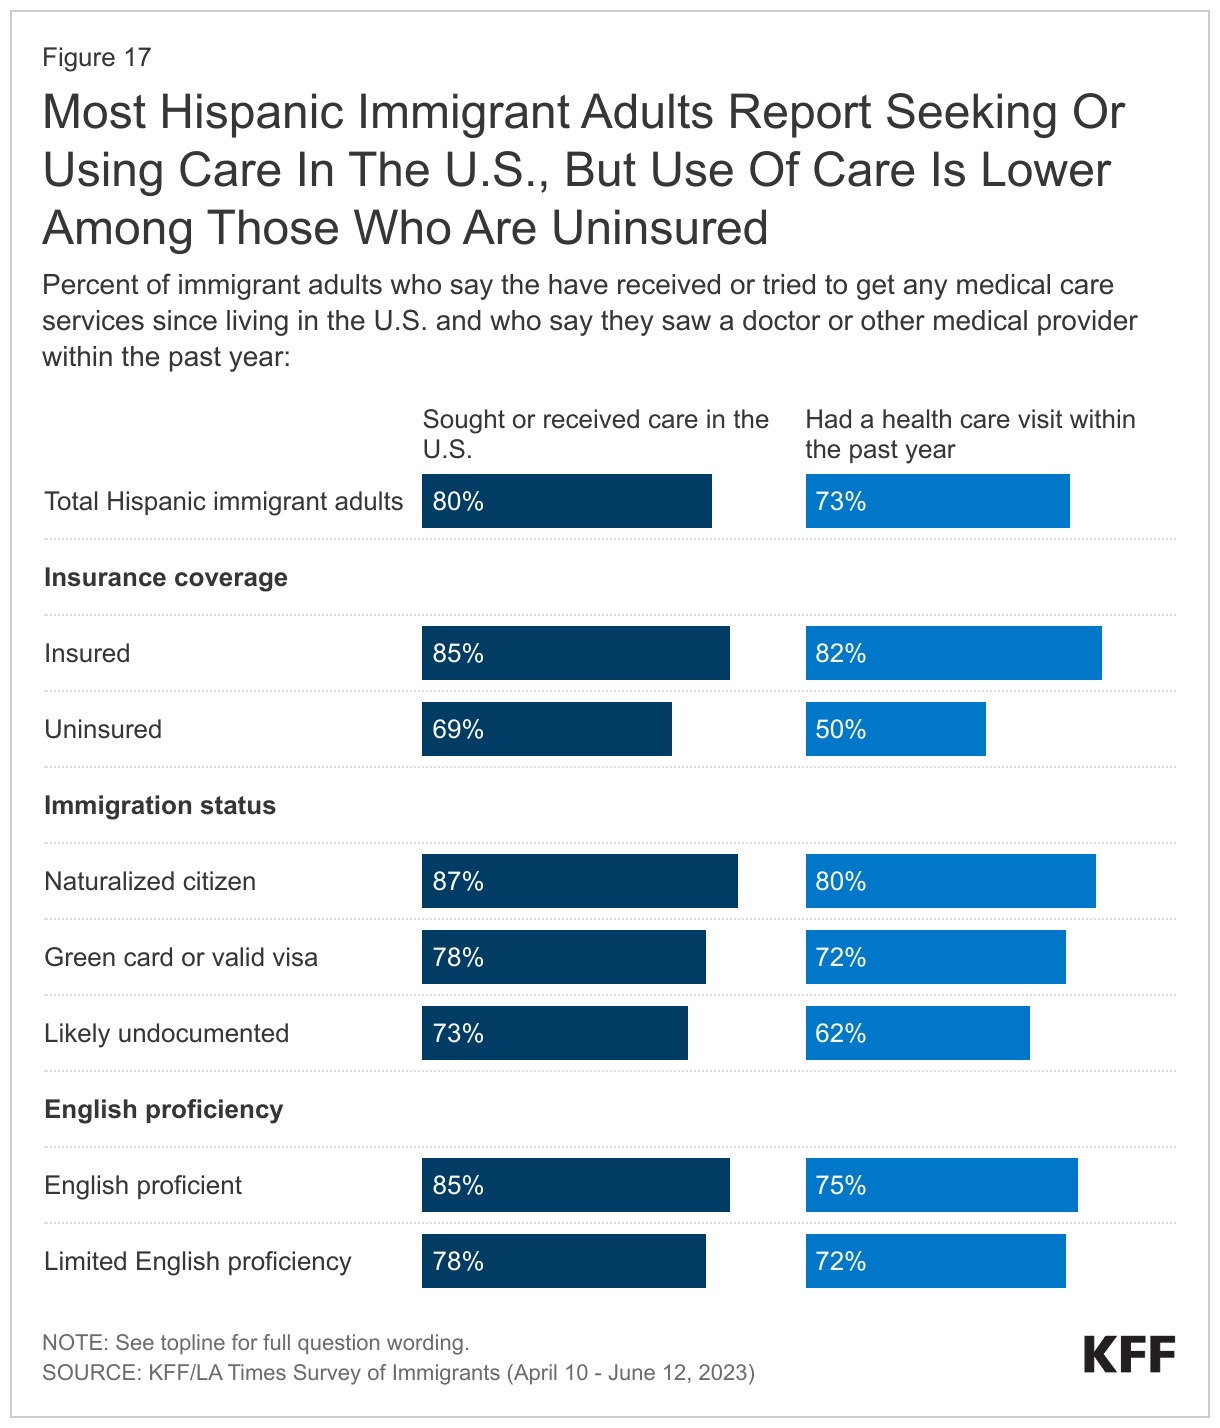
Hispanic immigrants, particularly those who are uninsured, face many challenges when it comes to accessing health care. Overall, one in four (26%) Hispanic immigrants are uninsured, but this share rises to over half (55%) among those who are likely undocumented, compared to 26% of those with a green card or valid visa and one in ten (10%) of those who are citizens. While most Hispanic immigrants have sought and recently received care in the U.S., those who are uninsured are much less likely than those with coverage to have utilized care, with just half (50%) of uninsured Hispanic immigrants having a health care visit in the past year compared with over eight in ten (82%) of those with coverage. Uninsured Hispanic immigrants also are less likely than their insured counterparts to have a usual source of care and a trusted provider and are much more likely to report skipping or postponing care in the past year.
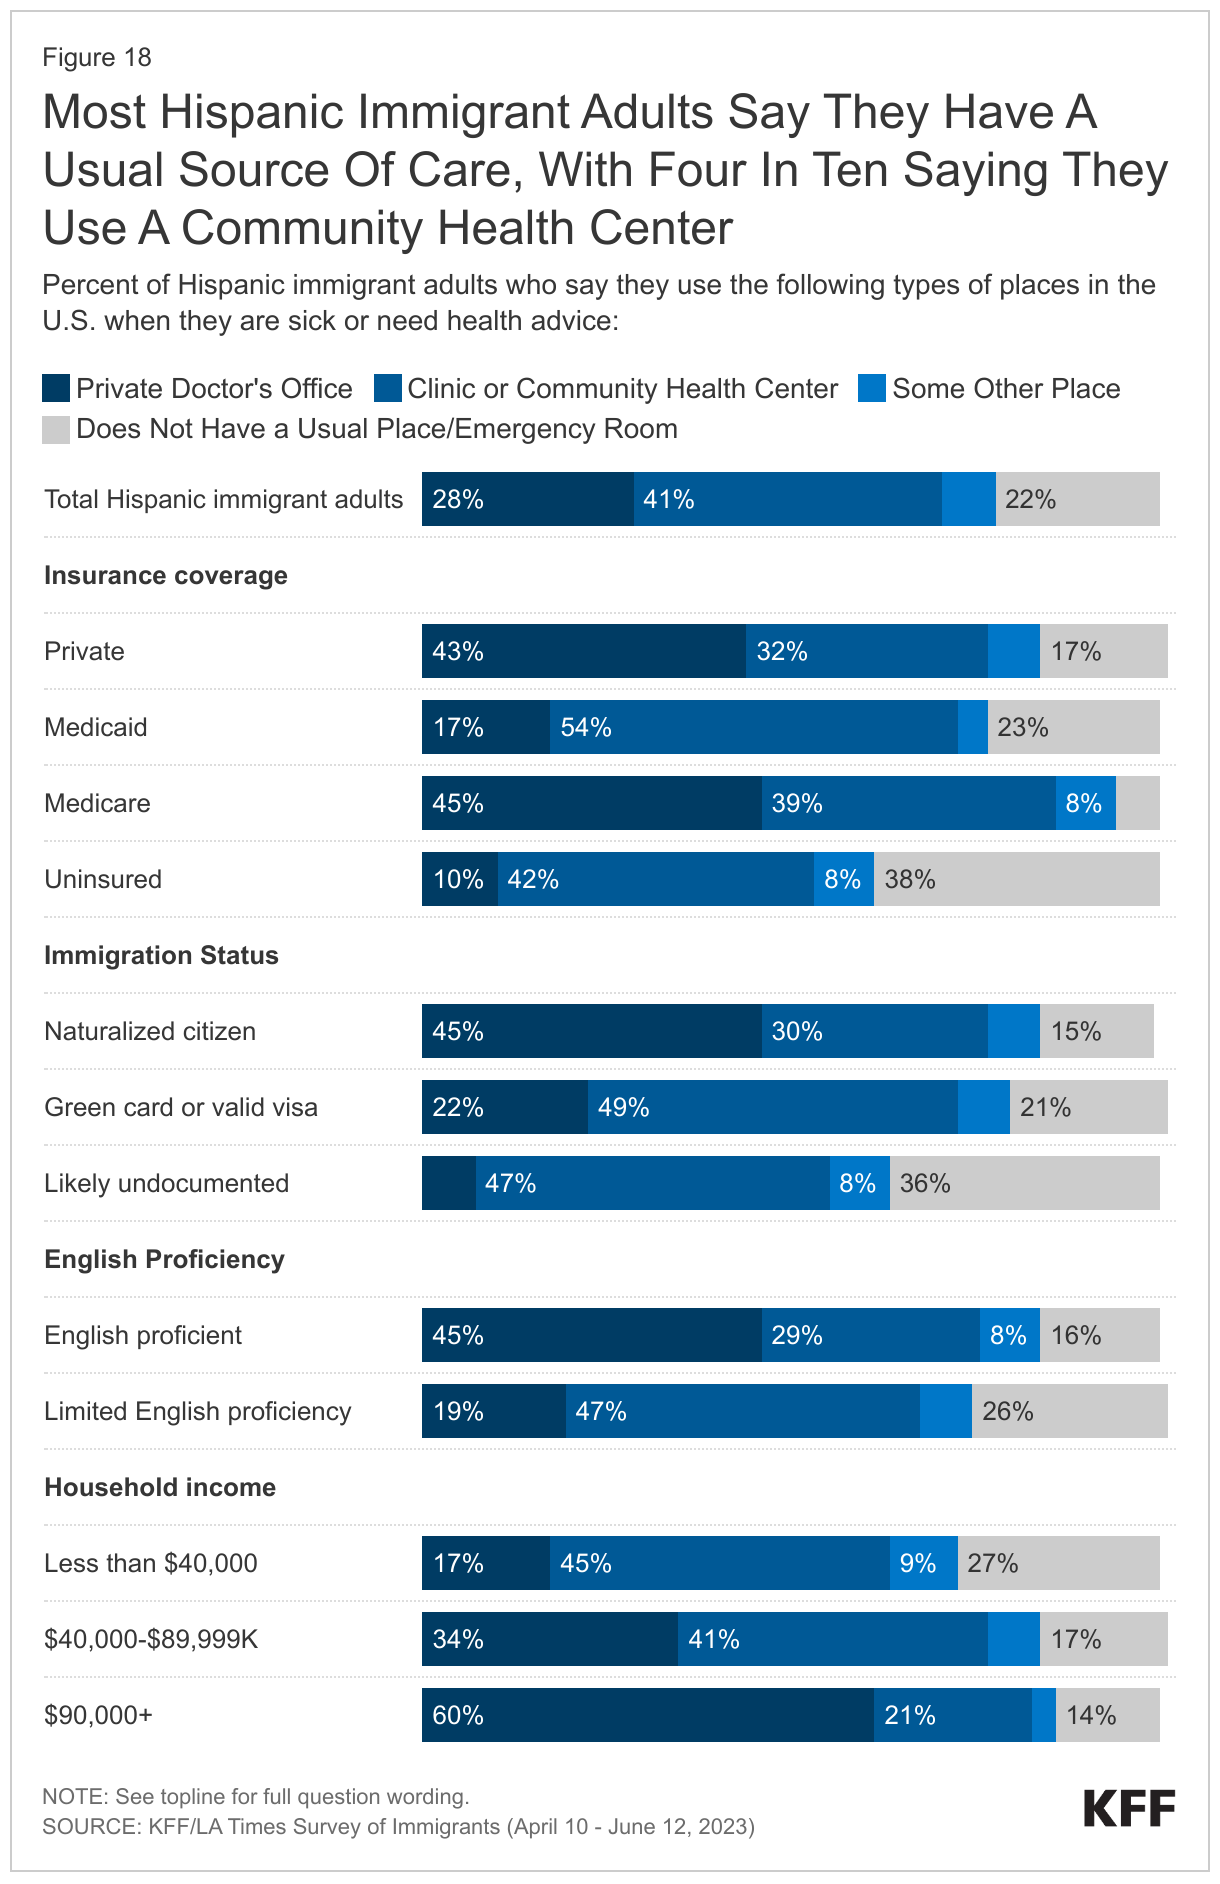
Community health centers (CHC) are the predominant place Hispanic immigrants usually go to when they are sick or need health advice and facilitate access to care for those who are uninsured. Overall, four ten (41%) of Hispanic immigrants say a CHC is their usual source of care, with substantial shares using CHCs across insurance types, immigration status, and English proficiency. CHCs are a national network of safety-net primary care providers serving low-income and medically underserved communities
Who Are Hispanic Immigrants?
Country/Region of Origin: About half (53%) of Hispanic immigrants in the U.S. are from Mexico, while about one in six are from Central America (17%) or South America (16%). Smaller shares are from either Cuba (6%) the Caribbean (6%), or other regions. See Appendix Table 2 for a list of regional groupings.
Census Region: Most Hispanic immigrants live in either the South (42%) or West (35%), while fewer live in the Northeast (15%) or Midwest (9%). More than half of Hispanic immigrants live in one of three U.S. states: California (25%), Texas (18%), or Florida (12%).
Time in country: Most Hispanic immigrants are long-term U.S. residents. About three in four (77%) have lived in the U.S. for ten years or longer, about one in ten (12%) have been in the U.S. between 5 and 9 years, while one in ten (8%) have been in the U.S. for fewer than five years. The share of Hispanic immigrants who arrived in the past 5 years is higher among immigrants from South America (16%), Central America (11%) than among those from Mexico (4%)
Employment and pay: Similar to the overall immigrant population, two-thirds (67%) of Hispanic immigrants are currently employed for pay, including three-quarters (75%) of those ages 18-64. About one in four (27%) employed Hispanic immigrants are self-employed or the owner of a business.
Parental Status: About four in ten (39%) Hispanic immigrants are the parent of a child under 18 living in their household, and the vast majority (86%) of this group say at least one of their children was born in the U.S.
English Proficiency: About two-thirds of Hispanic immigrants have limited English proficiency (LEP, defined as speaking English less than very well), including about one in ten (13%) who report they do not speak English at all. About one in three Hispanic immigrants say they speak English very well, including one in ten (11%) who speak English exclusively. The vast majority (86%) of Hispanic immigrants say they speak Spanish at home.
Immigration Status: About four in ten (43%) Hispanic immigrants are naturalized U.S. citizens, about three in ten (31%) say they have a valid visa or green card, and one in four (25%) are likely undocumented. In this report, immigrants who said they are not a U.S. citizen and do not currently have a green card (lawful permanent status) or a valid work or student visa are classified as “likely undocumented” since they have not affirmatively identified themselves as undocumented. Among Hispanic immigrants who are likely undocumented, most are from Mexico (61%), one in four are from Central America (25%), about one in ten (11%) are from South America, while very few (2%) are from the Caribbean. Overall, Hispanic immigrants account for about eight in ten (78%) of the likely undocumented immigrant population living in the U.S.
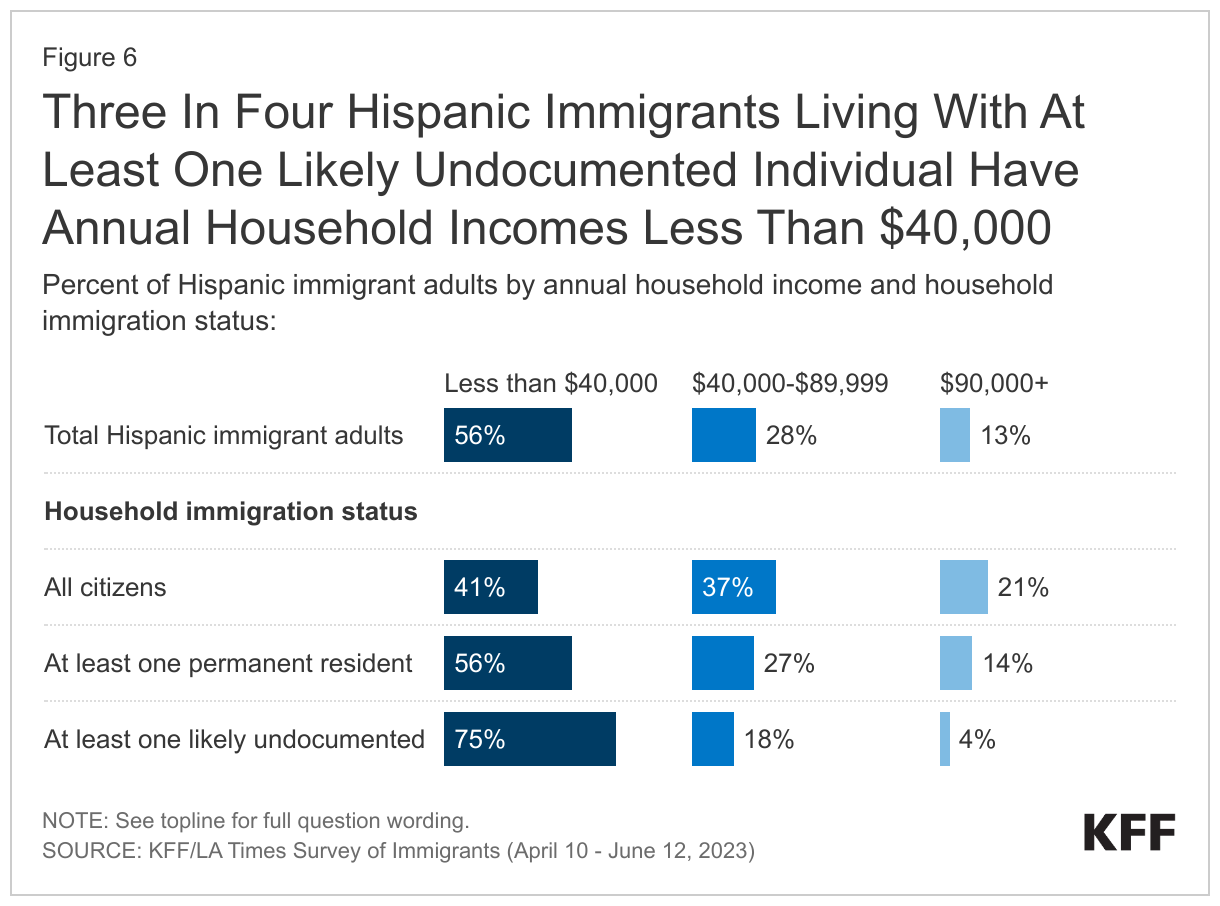
Household Income: A majority (56%) of Hispanic immigrants have annual household incomes of less than $40,000. Fewer live in middle income (28% in $40K-$89,999) or higher income (13% in $90,000+) households.
Education: About two-thirds of Hispanic immigrants have a high school education or less, including one in three (36%) who did not graduate high school. About one in six Hispanic immigrants have completed some college (18%) while a similar share has a college degree or higher (16%).
Reasons For Coming And Life In The U.S.
Like immigrants overall, a majority of Hispanic immigrants say they came to the U.S. for better economic and job opportunities (91%), a better future for their children (83%), and for better educational opportunities (81%), with many from Central America also citing more rights and freedoms and escaping unsafe or violent conditions as reasons. Hispanic immigrants from Central America stand out compared to Hispanic immigrants from Mexico and South America as having larger shares who say they came to the U.S. for more rights and freedoms (84%), to escape unsafe or violent conditions (74%), and to join or accompany family members (68%). Larger shares of Hispanic immigrants from the Caribbean also say having more rights and freedoms (86%) and to join or accompany family members (65%) were reasons for coming to the U.S.
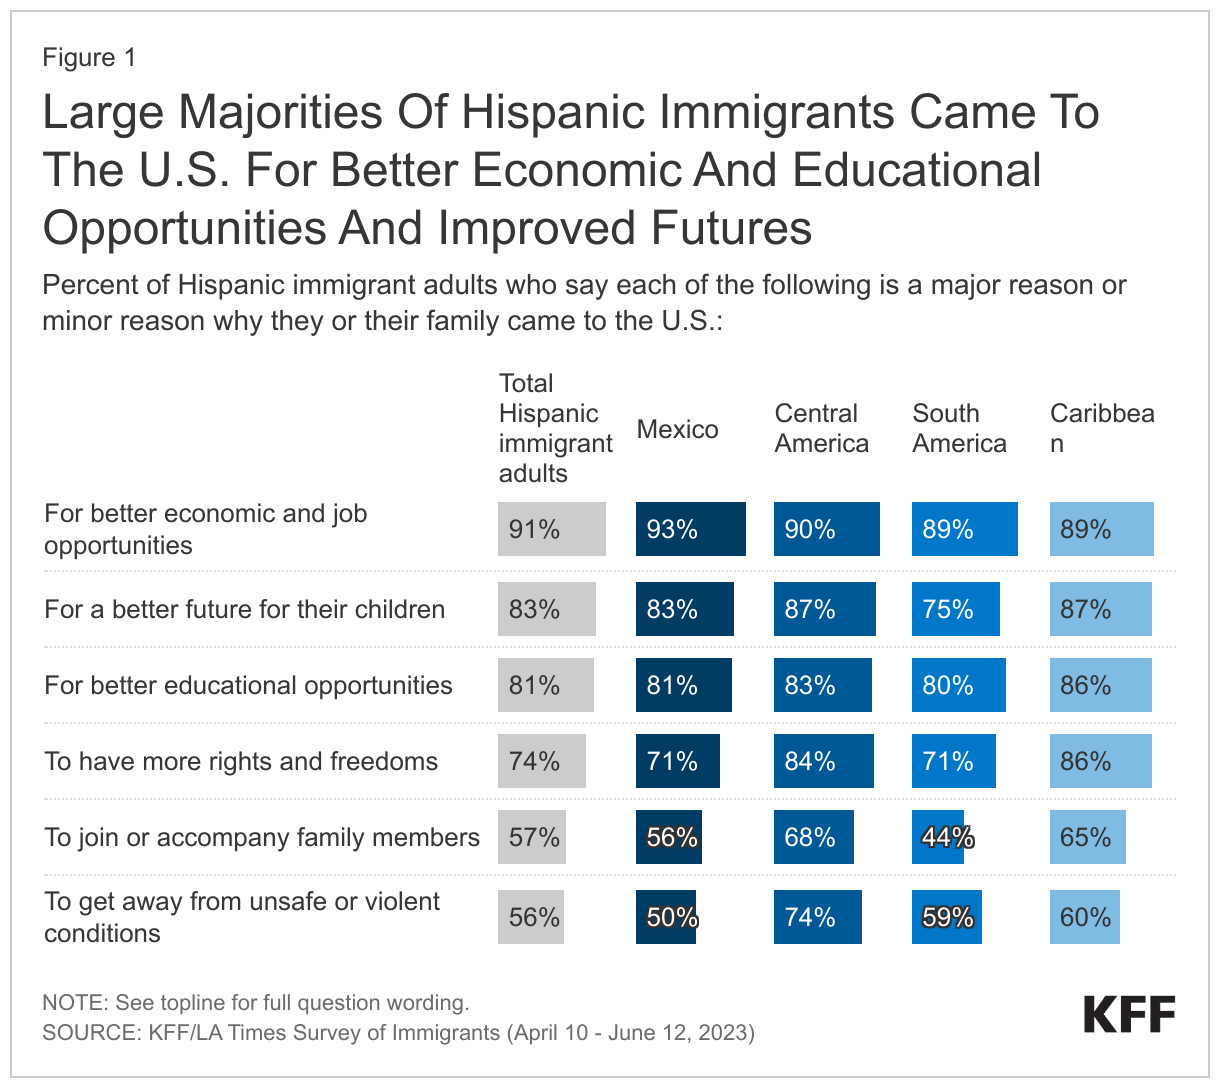
About eight in ten Hispanic immigrants say they have a better quality of life in the U.S., and Central American Hispanic immigrants are particularly likely to say their safety is improved as a result of coming to the U.S. Most Hispanic immigrants say they are better off than in the country of their birth when it comes to their educational opportunities (85%), their financial situation (82%), their employment situation (81%), and their safety (81%). About nine in ten Central American Hispanic immigrants (88%) say their safety has improved as a result of moving to the U.S., reflecting their reasons for coming to the U.S.
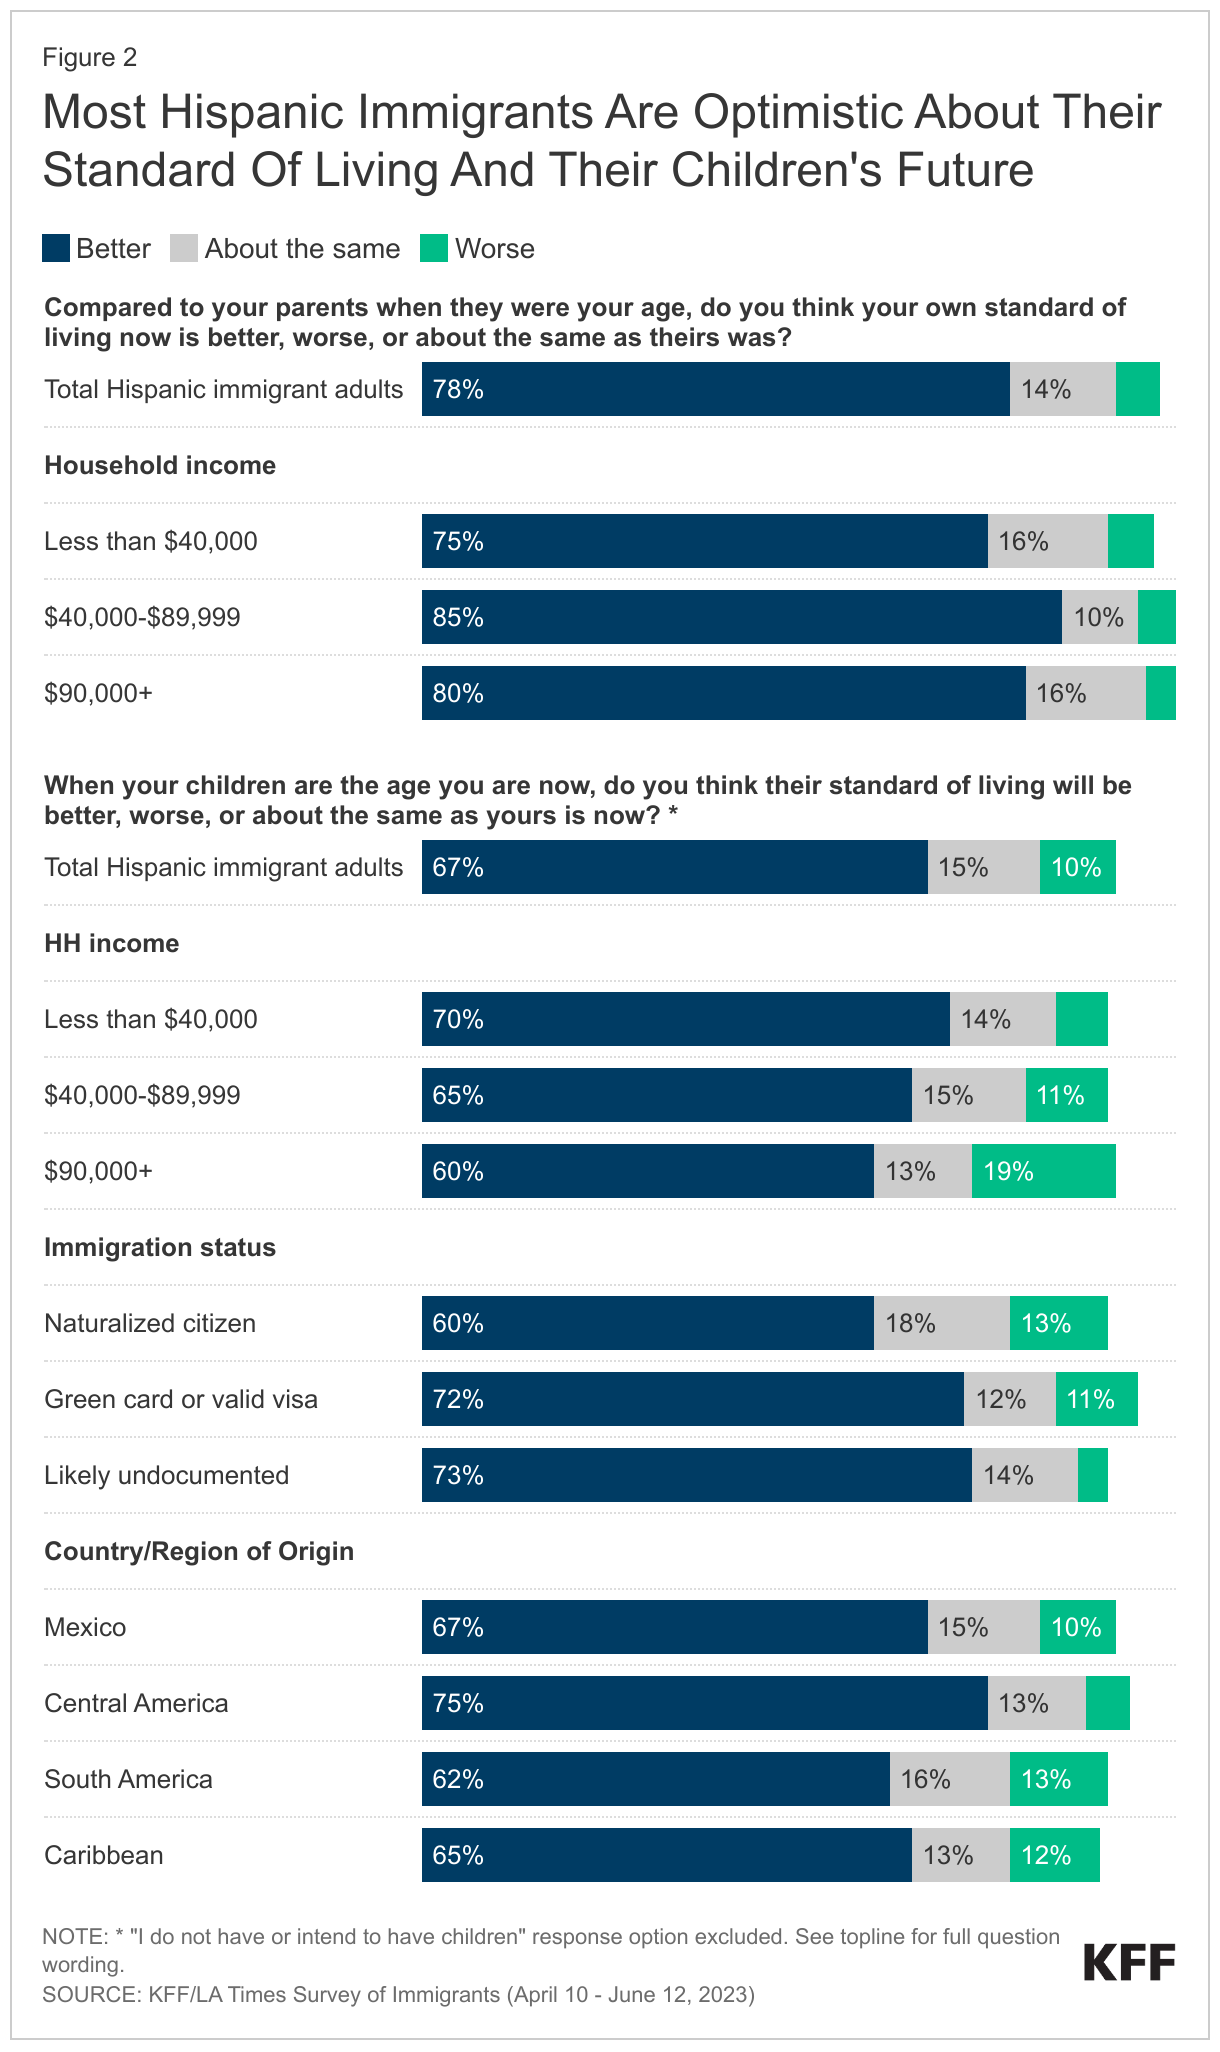
Most Hispanic immigrants say their own standard of living is better than their parents’ was at their age and that their children’s lives will be better than theirs, including those with lower household incomes. About eight in ten (78%) Hispanic immigrants say their standard of living is better compared with their parents at their age, and two-thirds (67%) say they think their children’s lives will be better than theirs. Smaller shares of Hispanic immigrants say they think their children’s lives will be worse (10%) or about the same (15%). Lower income Hispanic immigrants are as likely as those with higher household incomes to say their current standard of living is better than their parents’ was and similar shares are optimistic about their own children’s futures. Hispanic immigrants who are noncitizens (73%) and those from Central America (75%) are particularly likely to say they are optimistic for their children’s futures.
In Their Own Words: Hispanic Immigrants Say There Are Better Opportunities In The U.S. For Themselves And Their Children
In focus groups, participants expressed that while they face challenges in the U.S., they are grateful to be in the U.S. given the greater opportunities for themselves and their children. Many participants told stories of how different it was for them growing up in their home countries compared to how their children are able to grow up in the U.S.
“I’ll be motivating my kids, day by day, so that they can have a better future than me.” - 39-year-old Mexican immigrant man in California
“In my case, I think [my children are] better here. There [are] better opportunities, better jobs, schools. They can study whatever they want, whereas over there [in Guatemala], it's a little hard. There's a lot of opportunities for them to choose from.” - 57-year-old Guatemalan immigrant woman in Texas
“My daughter just graduated from college, one of the best universities here….she’s an example for the other kids to follow. Here in the States, they can have a career. Where I lived, I couldn't go to school, but they can. What I tell them is, ‘You have the ability to achieve whatever you want.’ I tell them, ‘Be successful and show the world that we can also do it. Show them that we’re not a burden, but that we also come to better ourselves.’” - 47-year-old Mexican immigrant woman in California
“Because sometimes, what my parents made wasn’t enough, so at a young age, they put you to work. You had to work to survive. Like I told my daughter, ‘Thank God we’re in this country. You don’t live wealthy, but you do have what you need.’ So, I tell her, ‘You have the opportunity to go to school, and as your dad, I’m going to make sure you study.’” - 51-year-old El Salvadorian immigrant man in California
“We’re happy because we have a better life, even though we always miss our homeland. But it’s better.” - 35-year-old Mexican immigrant man in California
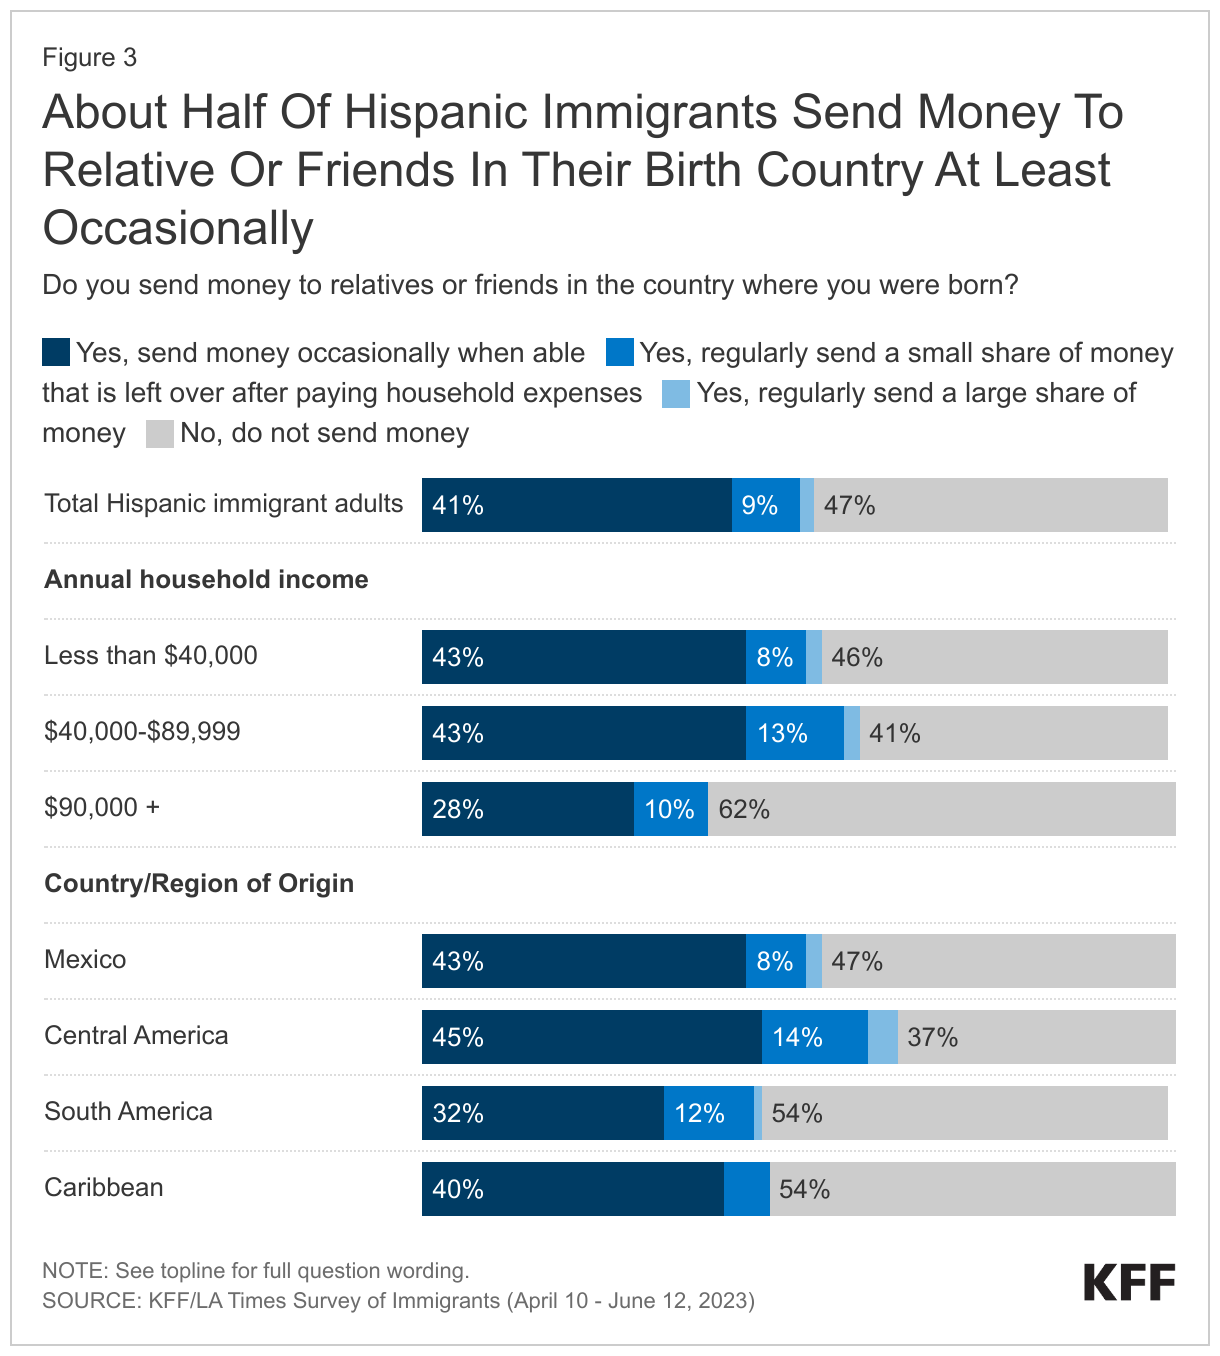
In addition to feeling that their lives are better in the U.S., about half of Hispanic immigrants support their families and friends in their country of birth by sending money at least occasionally, including among those with lower household incomes. Hispanic immigrants from Central America (62%) are more likely than those from South America (45%) or the Caribbean (46%) to say they send money at least occasionally. About half (53%) of Hispanic immigrants from Mexico send money at least sometimes. Hispanic immigrants with lower or moderate household incomes are more likely than those with higher household incomes to say they send money at least occasionally (53% vs. 58% vs. 38%).
Eight in ten Hispanic immigrants say they would choose to come to the U.S. again. Asked what they would do if given the chance to go back in time knowing what they know now, eight in ten Hispanic immigrants (80%) say they would choose to come to the U.S. again, including similarly large shares across income, immigration status, and country/region of origin. While most Hispanic immigrants share this sentiment, overall, fewer than one in ten (7%) immigrants say they would not choose to move to the U.S. and about one in ten (13%) say they are not sure whether they would choose to move to the U.S.
Overall, about six in ten (63%) Hispanic immigrants say, thinking about their futures, they plan to stay in the U.S., but about one in six (17%) Hispanic immigrants from Mexico say they plan to move back to Mexico. Overall, about one in five Hispanic immigrants say they want to move back to the country they were born in (13%) or to another country (7%), and about one in six (17%) say they are not sure if they plan to stay in the U.S. A bare majority (54%) of Hispanic immigrants who are likely undocumented say they plan to stay in the U.S., while one in four say they either plan to move back to their country of birth (20%) or move to a different country (6%) and a further one in five (20%) are not sure. One in six Hispanic immigrants from Mexico say they want to move back to their country of birth (17%), compared to smaller shares of those from South America (7%) and the Caribbean (2%).
Work Experiences
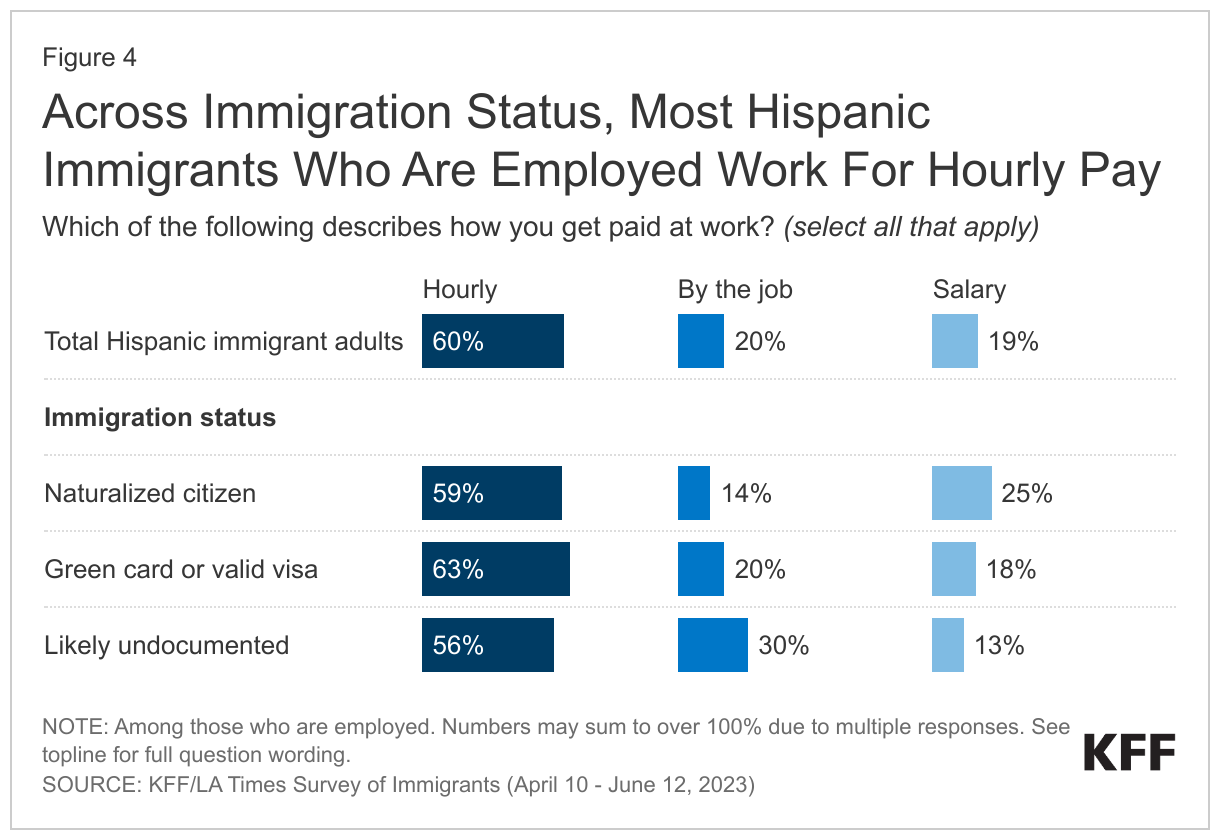
Most (67%) Hispanic immigrants are working, mainly in hourly jobs, of whom about one in four (27%) are self-employed or the owner of a small business. Similar to the overall immigrant population, two-thirds (67%) of Hispanic immigrants report they are currently employed for pay, including three-quarters (75%) of those ages 18-64. Most employed Hispanic immigrants report working for hourly pay (60%), while one in five (20%) say they are paid by the job and a similar share work for a salary (19%). Hispanic immigrants who are likely undocumented (30%) are more likely to say they are paid by the job compared to those with a valid visa or green card (20%) or those who are naturalized citizens (14%). Conversely, those who are naturalized citizens are more likely than noncitizens report they have a salaried job, with one in four (25%) saying they receive a salary. Despite these differences, most Hispanic immigrants across immigration statuses report working in hourly jobs. Nearly half (46%) of Hispanic immigrants with a college degree say they are overqualified for their jobs, compared to about one in four (23%) with less than a college degree.
About half of working Hispanic immigrants report experiencing discrimination at work, including seven in ten likely undocumented Hispanic immigrants and six in ten Hispanic immigrants with LEP. At least half (55%) of all Hispanic working immigrants say they have ever been treated differently from people born in the U.S. doing the same job at work in at least one of five ways asked about on the survey, including being given fewer opportunities for advancement (37%), being paid less for doing the same job (34%), not being paid for all the hours worked or not given overtime pay for which they were eligible (29%), being given worse shifts or less control over their work hours (17%), or being harassed or threatened by someone in their workplace because they are an immigrant (14%). Due to lack of work authorization, undocumented immigrant workers face disproportionate employment challenges and are at increased risk for workplace abuses and violations. Reflecting these increased risks, most (70%) undocumented employed Hispanic immigrants report they have experienced at least one form of workplace discrimination, including about half (52%) who say they have been paid less for doing the same job as someone born in the U.S. and four in ten (41%) who say they were not paid for all their hours worked. Additionally, six in ten (61%) working Hispanic immigrants with LEP say they have experienced at least one form of unfair treatment in the workplace. However, even among those who are citizens (45%), are English proficient (41%), and who have at least a college degree (52%), substantial shares say they experience mistreatment at work.
Financial Situation
Household incomes among Hispanic immigrants vary widely by immigration status. A majority (56%) of Hispanic immigrants live in lower-income households (under $40,000 annually), including three-quarters of those in households with at least one undocumented resident. However, Hispanic immigrants who live in a household in which everyone is a citizen are five times more likely have household incomes of $90,000 or more than those who live in a household in which at least one person is likely undocumented (21% vs. 4%).
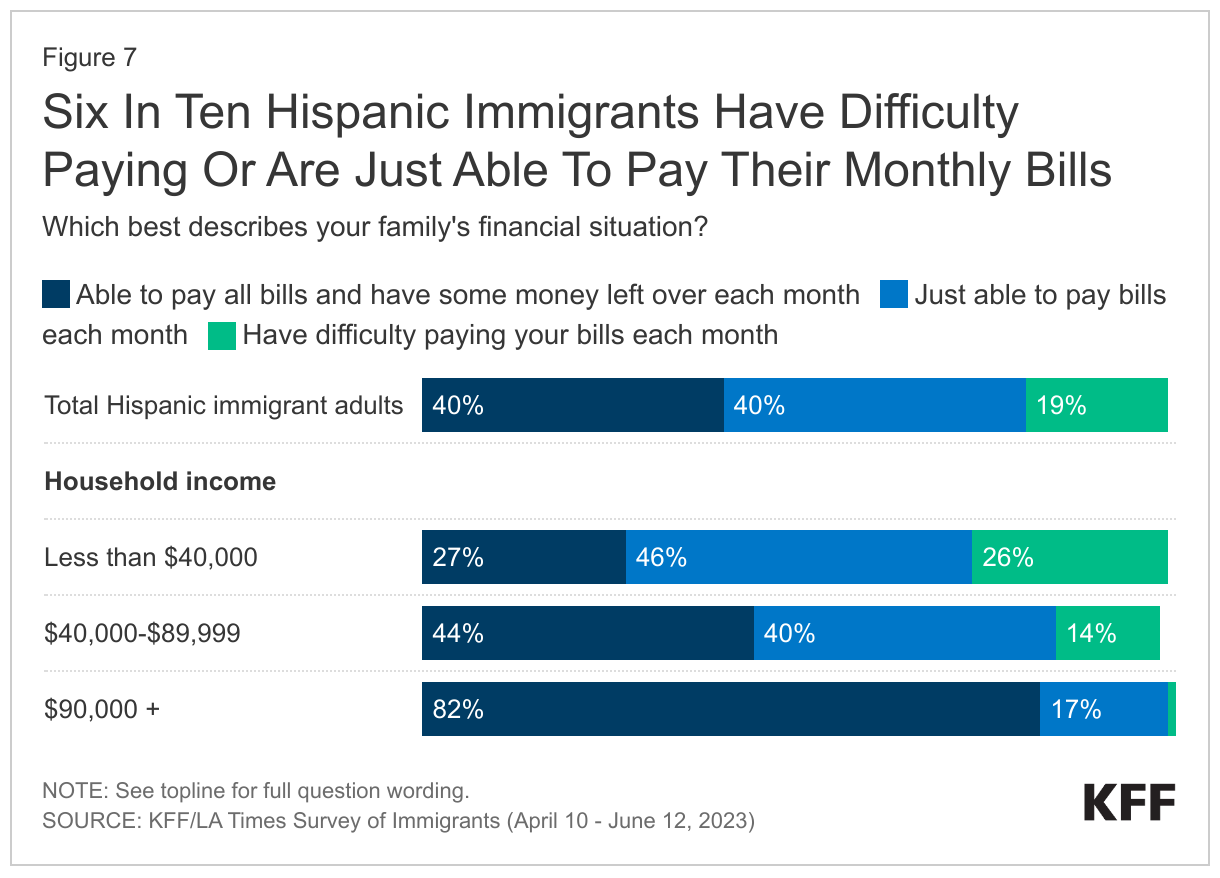
Four in ten Hispanic immigrants say they can pay their monthly bills and have money left over each month, including eight in ten (82%) among those in higher income households, however, six in ten say they are just able to pay their bills each month (40%) or have difficulty paying their bills each month (19%). The ability to pay monthly bills varies widely by household income, with about seven in ten in lower income households (less than $40,000 annually) saying they either are just able to pay their bills (46%) or have difficulty doing so each month (26%), and the large majority of those in higher income households ($90,000 or more annually) saying they have money left over each month (82%).
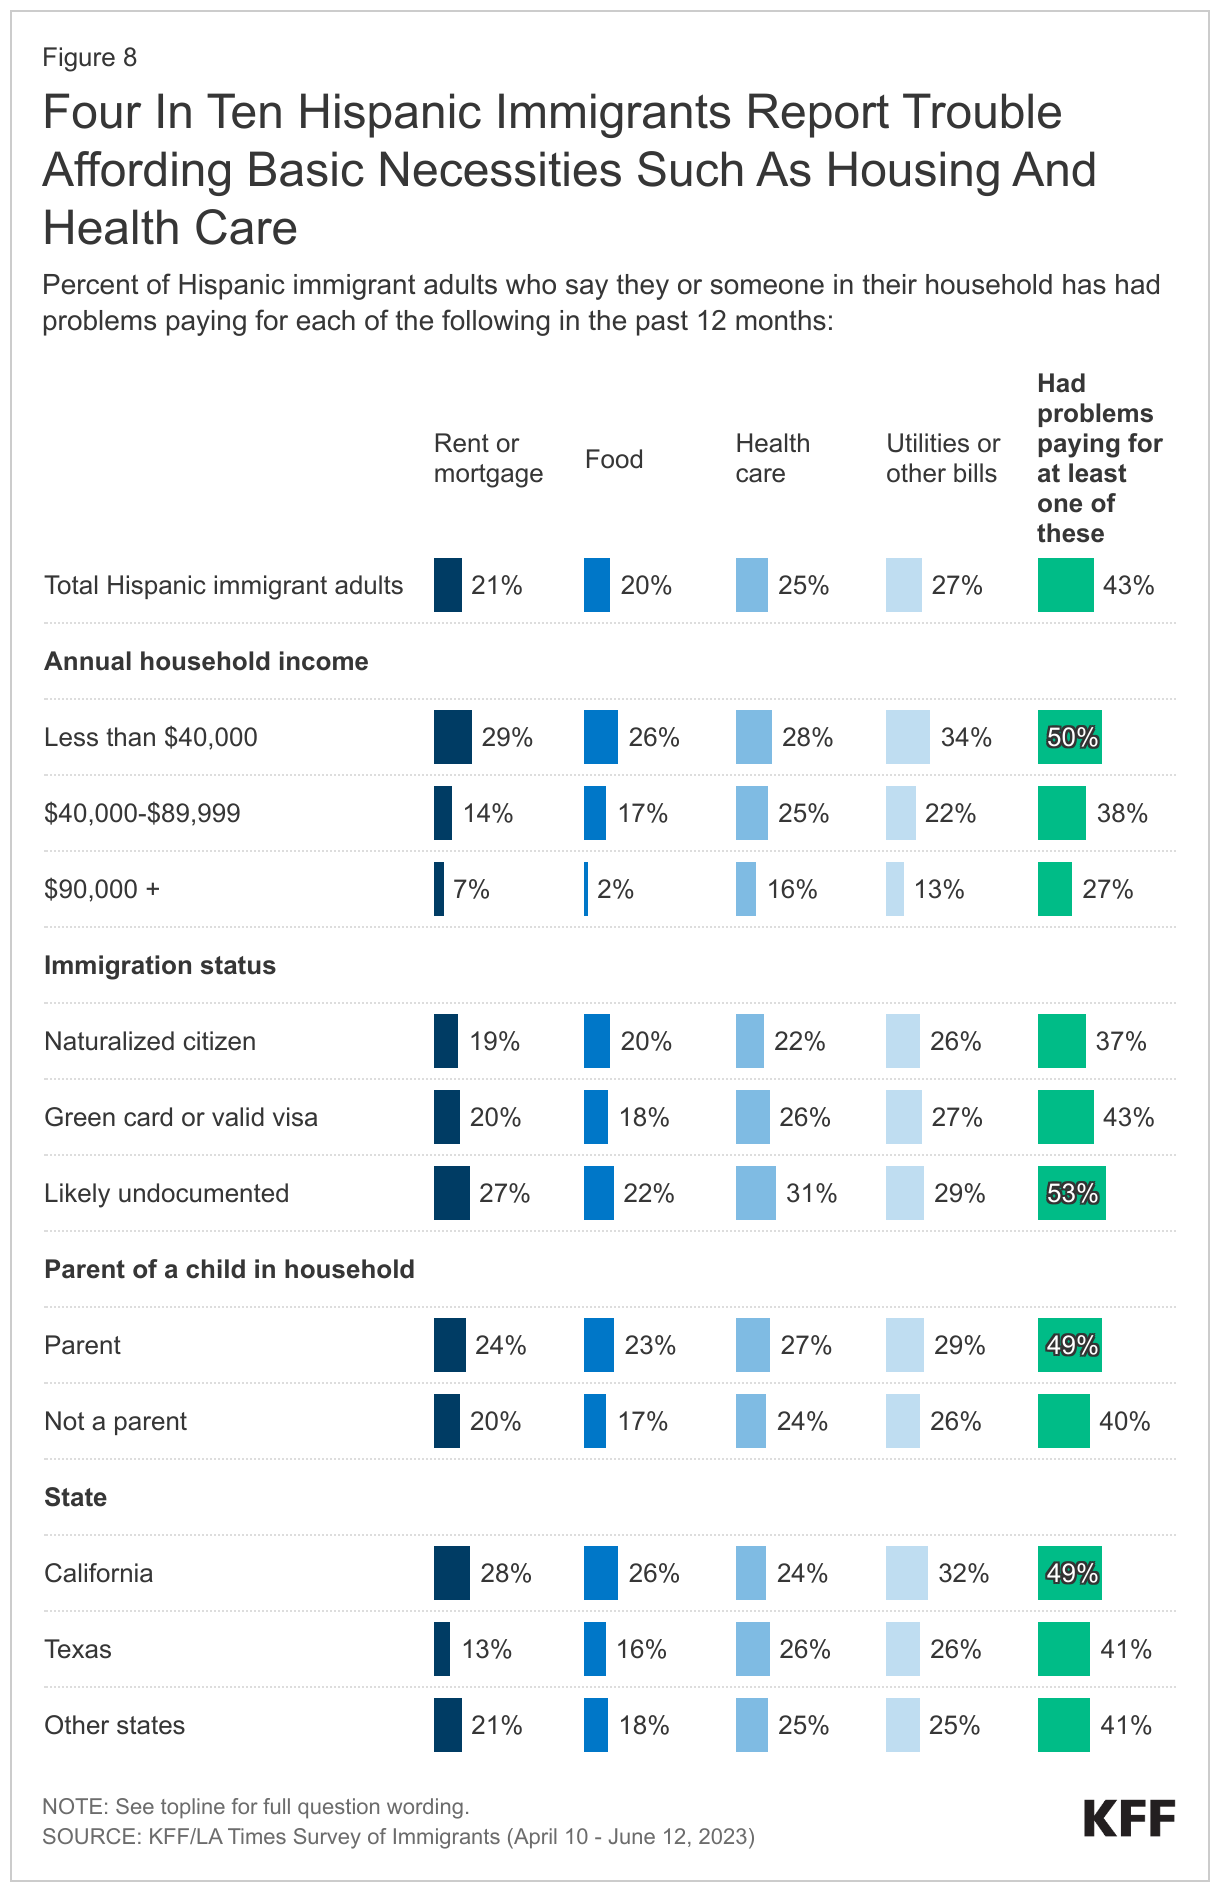
Many Hispanic immigrants in lower income households have difficulty affording basic needs. Overall, about four in ten Hispanic immigrants (43%), rising to half (50%) among lower income households, say their household has had problems paying for at least one of the following necessities in the past 12 months: utilities or other bills (27%), health care (25%), rent or mortgage (21%), or food (20%), with this. The shares who report facing these financial challenges are also larger among Hispanic immigrants who are likely undocumented (53%) and those from Mexico (47%) given that these groups are more likely to have lower incomes. In addition, Hispanic immigrants who are parents are more likely than those who are not to have problems paying for at least one of these (49% vs. 40%).
Where Hispanic immigrants live also affects their financial situation and stability. For example, Hispanic immigrants living in California are more likely than those in other states to report problems affording basic needs, particularly housing, likely reflecting the high cost of living in the area. About half (49%) of Hispanic immigrants living in California say they have had difficulties paying for necessities, including about one third (32%) who cite difficulties paying utilities or other bills, about three in ten (28%) who say they have had problems paying their rent or mortgage, and one in four who have difficulty paying for food (26%). Hispanic immigrants in Texas are about half as likely as those in California to say they have had problems paying for housing costs (13% vs. 28%).
Limited English Proficiency And Language Barriers
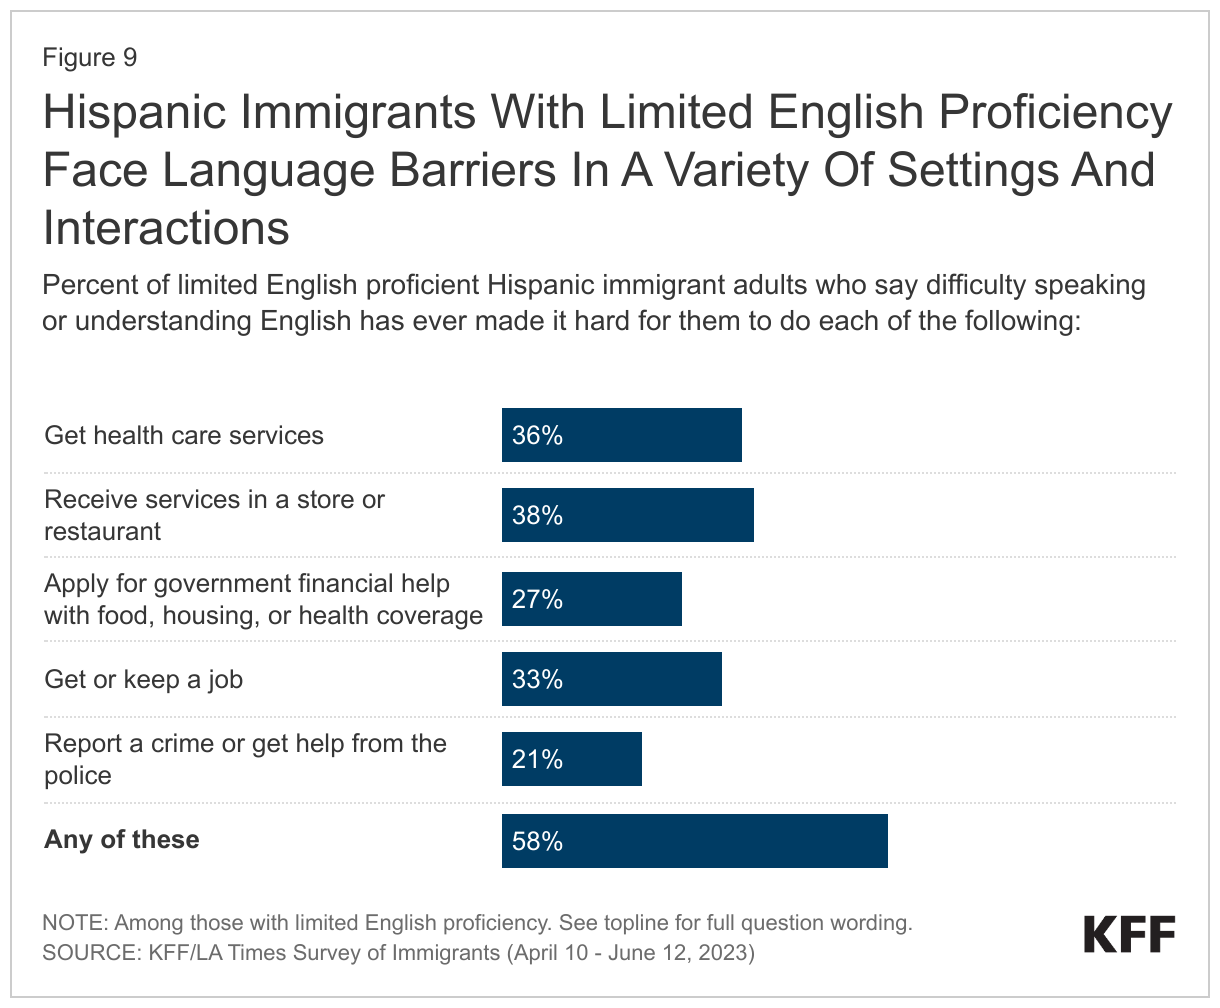
A majority of Hispanic immigrants with LEP report language barriers in a variety of settings and interactions, including one in four (23%) parents who say that difficulty speaking or understanding English has made it hard for them to communicate with their child’s school or teacher. Overall, two-thirds of Hispanic immigrants have LEP, meaning they speak English less than very well, including about seven in ten among those from Mexico (70%) and Central America (68%) compared with about six in ten among those from the Caribbean (60%) and South America (58%). Among Hispanic immigrants with LEP, a majority (58%) say that difficulty speaking or understanding English has ever made it hard for them to do at least one of the following: receive services in a store or restaurant (38%); get health care services (36%); get or keep a job (33%); apply for government financial help with food, housing, or health coverage (27%); or report a crime or get help from the police (21%). One in four (23%) Hispanic immigrant parents with LEP say difficulty speaking or understanding English has made it hard for them to communicate with their child’s school or teacher.
Immigration-Related Fears
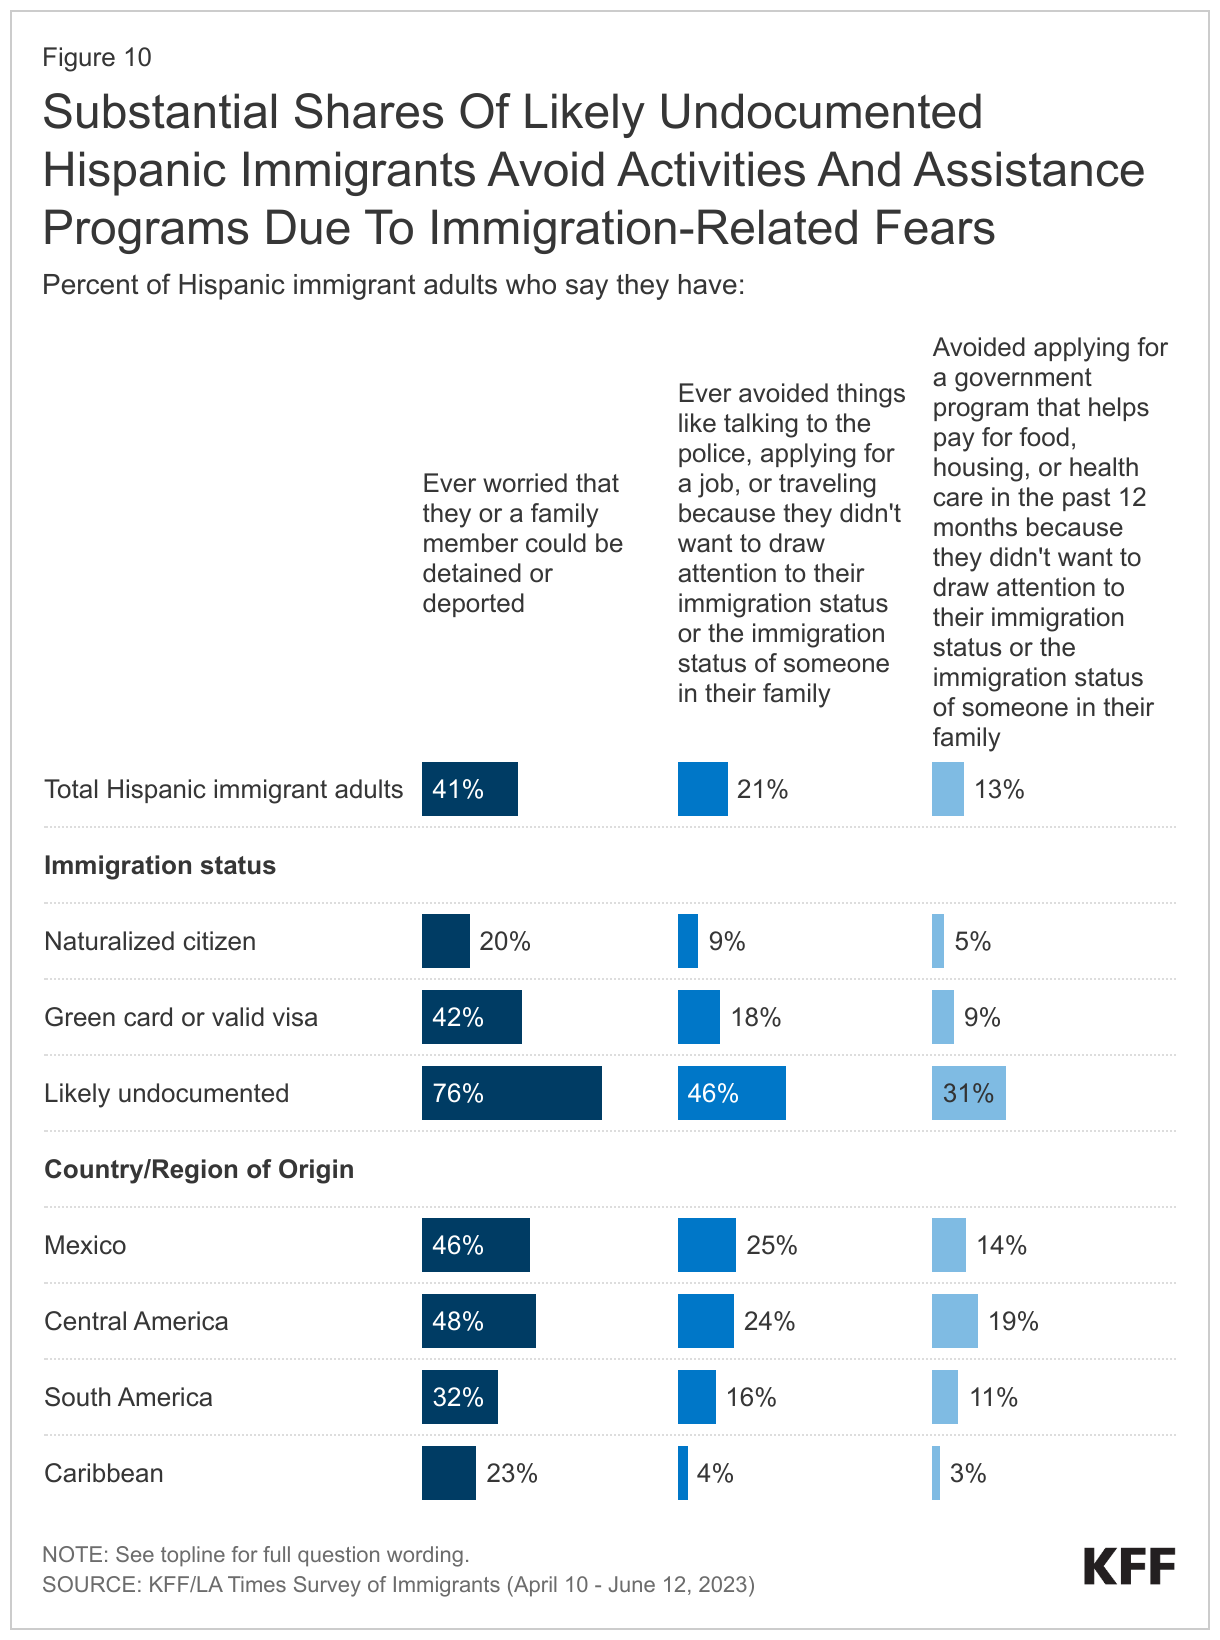
About three in four (76%) Hispanic immigrants who are likely undocumented worry they or a family member may be detained or deported. However, worries about detention or deportation are not limited to those who themselves are likely undocumented. Even among Hispanic immigrants who are naturalized citizens, one in five (20%) say they worry they or a family member could be deported, and about four in ten immigrants (42%) who have a green card or other valid visa say they have this worry. Largely reflecting the higher shares who are likely undocumented, Hispanic immigrants from Central America (48%) and Mexico (46%) are more likely to express concern about detention or deportation than are Hispanic immigrants from South America (32%) or the Caribbean (23%).
Substantial shares of Hispanic immigrants who are likely undocumented say they have avoided certain activities because they didn’t want to draw attention to their or a family member’s immigration status. This includes about one in five (21%) Hispanic immigrants overall, rising to nearly half (46%) of those who are likely undocumented, who say they have avoided things such as talking to the police, applying for a job, or traveling because they didn’t want to draw attention to their or a family member’s immigration status. In addition, about one in ten (13%) Hispanic immigrants say they have avoided applying for a government program that helps pay for food, housing, or health care in the past 12 months because of concerns about immigration status, including about three in ten (31%) of those who are likely undocumented.
U.S. Immigration Policy Knowledge
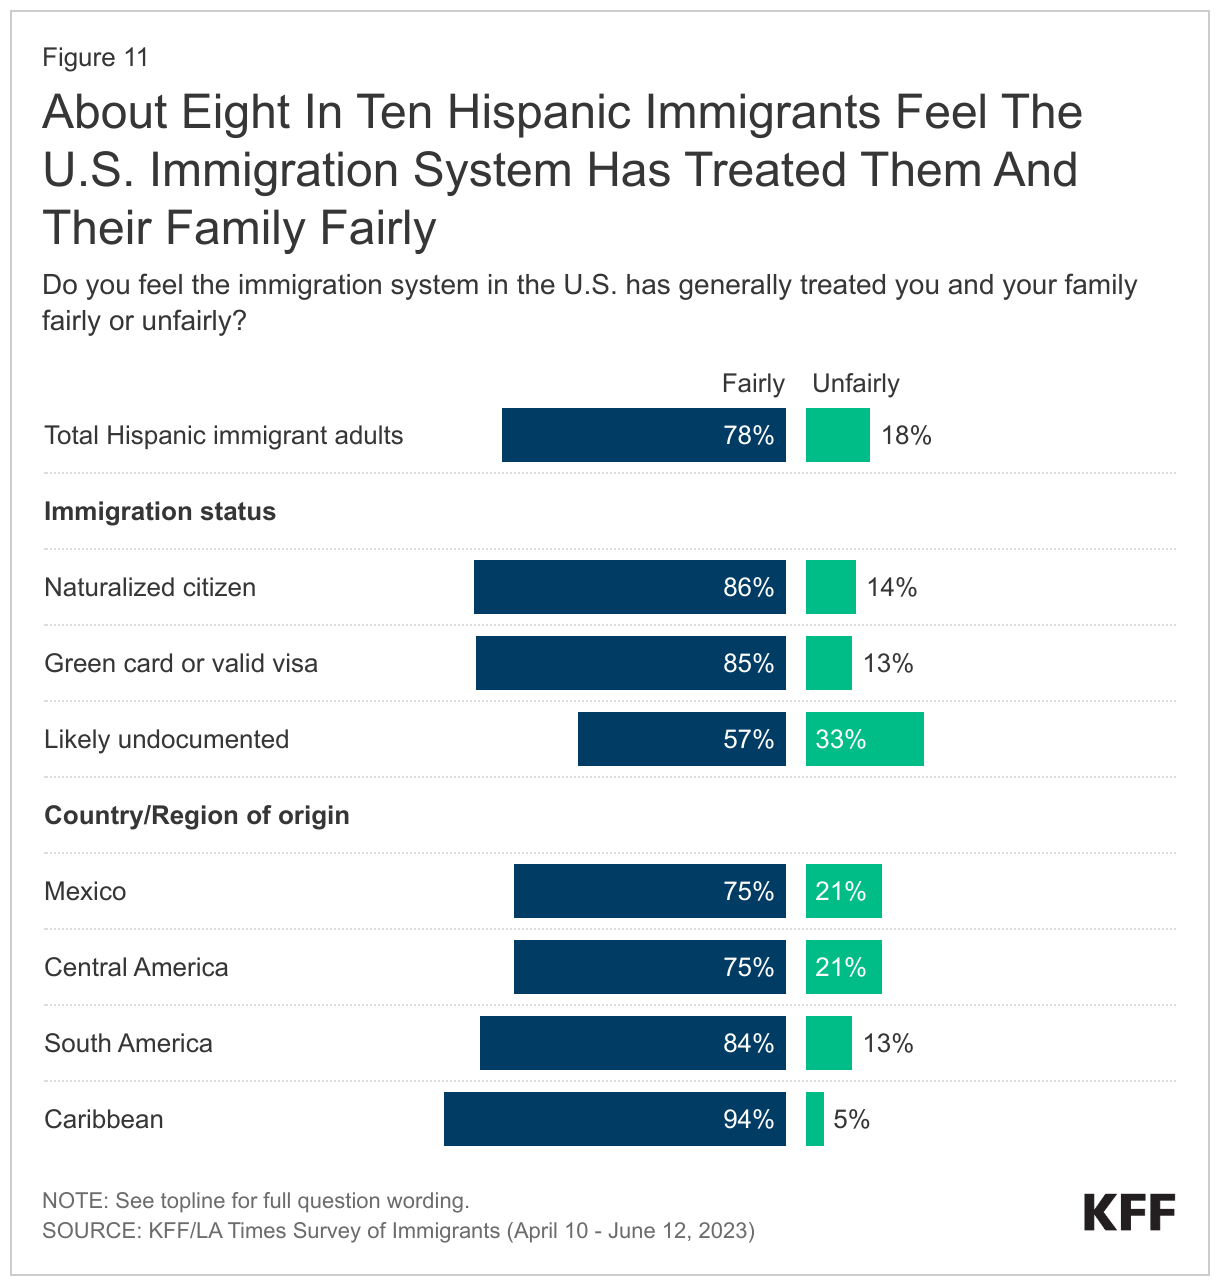
Most (78%) Hispanic immigrants say they feel the U.S. immigration system has treated them and their families fairly, but one third of those who are likely undocumented say they feel they have been treated unfairly. Largely reflecting their higher rates of being likely undocumented, about one in five Hispanic immigrants from Mexico (21%) and Central America (21%) say they and their family have been treated unfairly. Likely in part a reflection of the policy that granted Cubans who reached U.S. soil prior to 2017 a fast track to U.S. citizenship, the vast majority (94%) of Hispanic immigrants from the Caribbean say they and their families have been treated fairly by the U.S. immigration system.
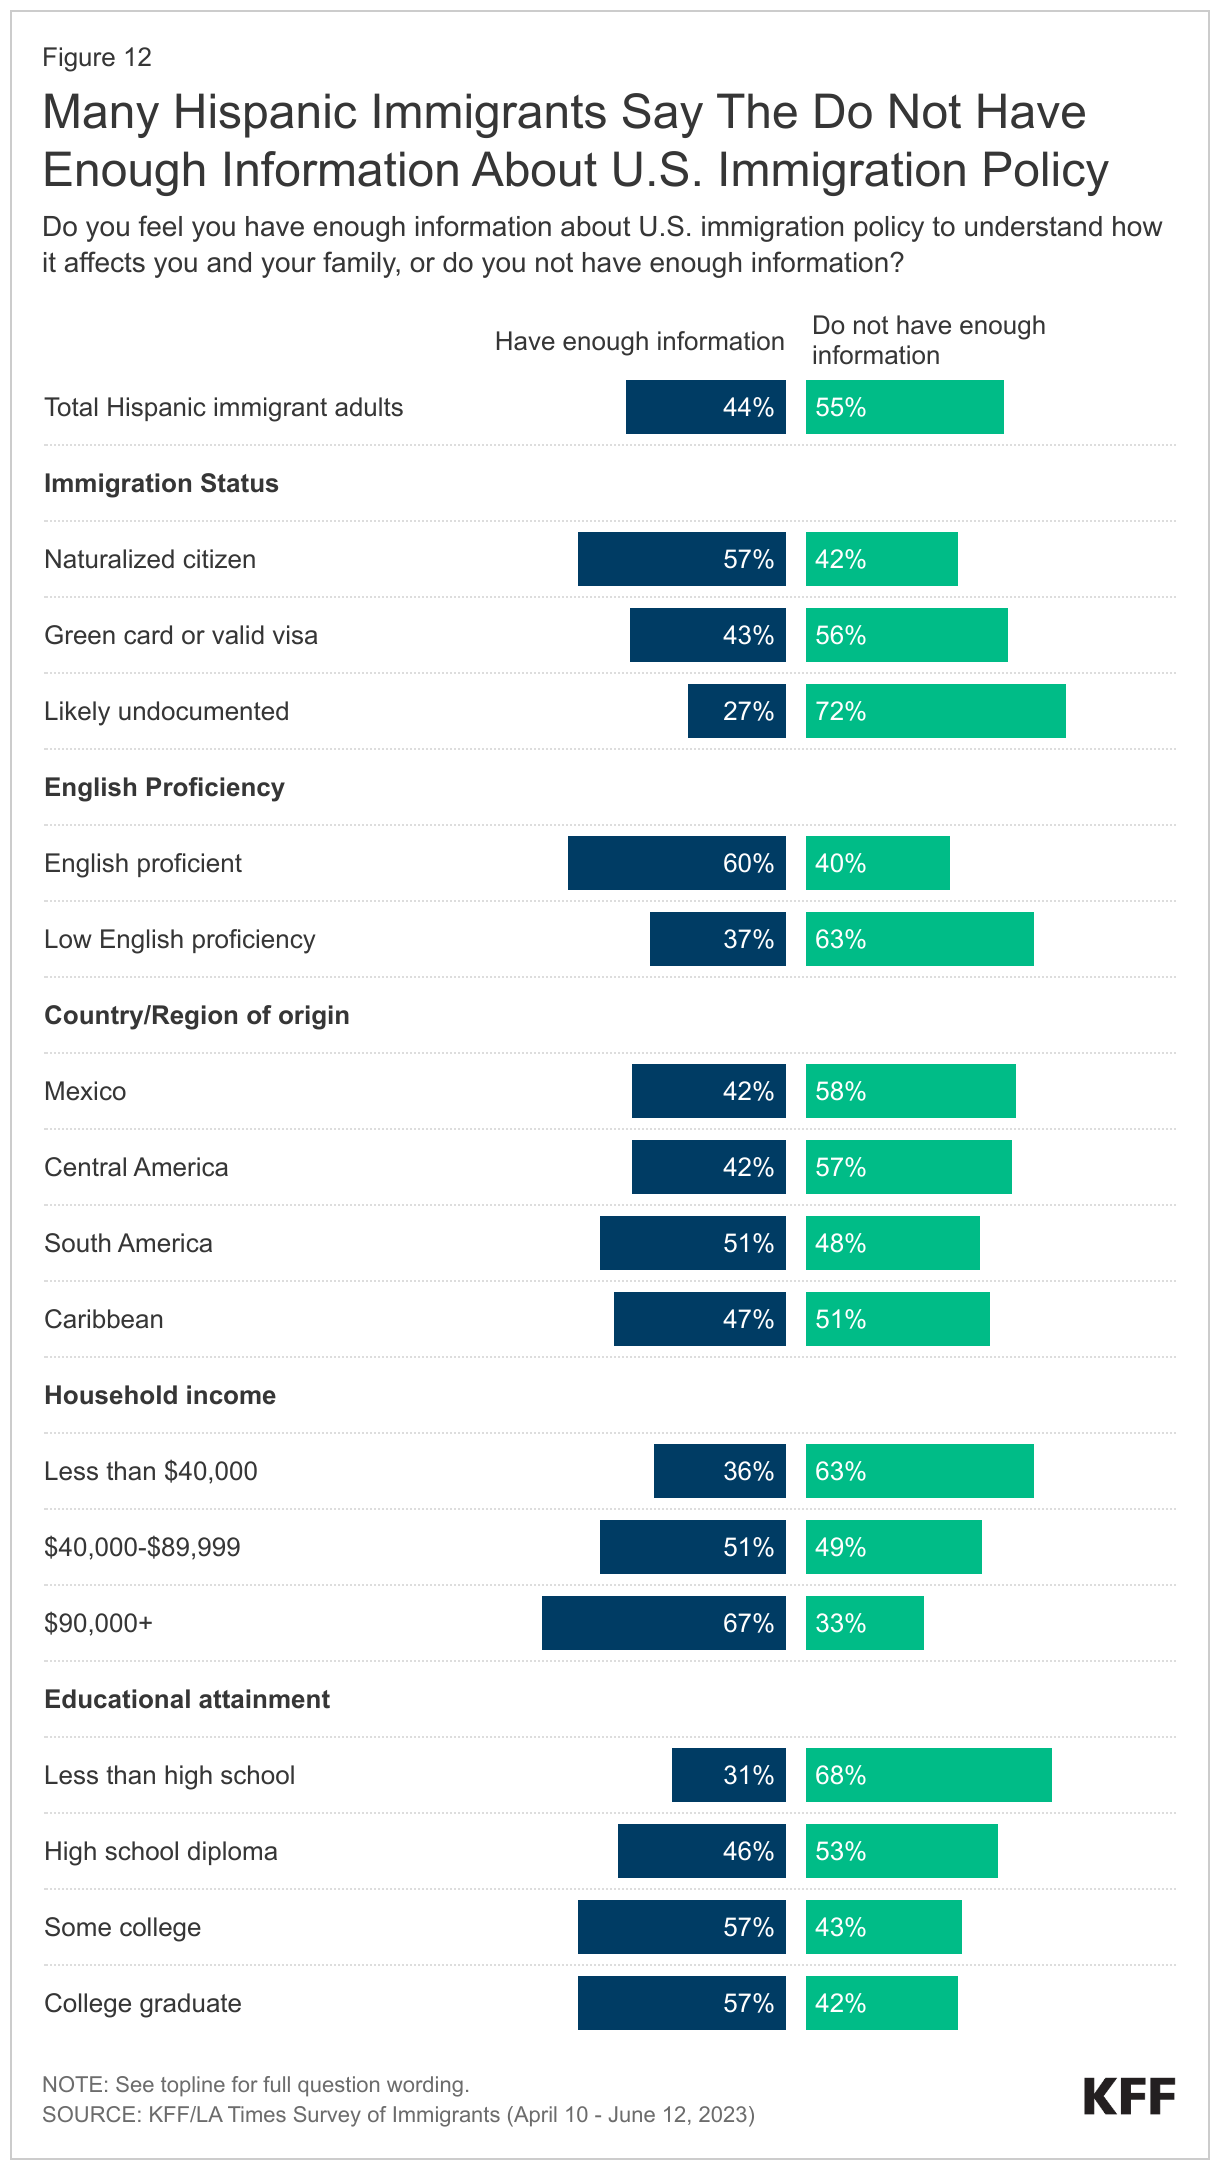
A majority (55%) of Hispanic immigrants, including about seven in ten (72%) of those who are likely undocumented, say they do not have enough information about U.S. immigration policy to understand how it affects them and their family. Most Hispanic immigrants who have a green card or valid visa (56%) and about four in ten (42%) naturalized citizens also say they lack sufficient information. Beyond differences by immigration status, the groups who are more likely to say they do not have enough information to understand how immigration policy affects them and their families include Hispanic immigrants with LEP as well as those who have been in the U.S. for fewer than ten years, have lower household incomes, and those with lower educational attainment levels. In contrast, majorities of naturalized citizens, those who are English proficient, those who have been in the U.S. for longer, and those with higher incomes and educational attainment levels say they have enough information.
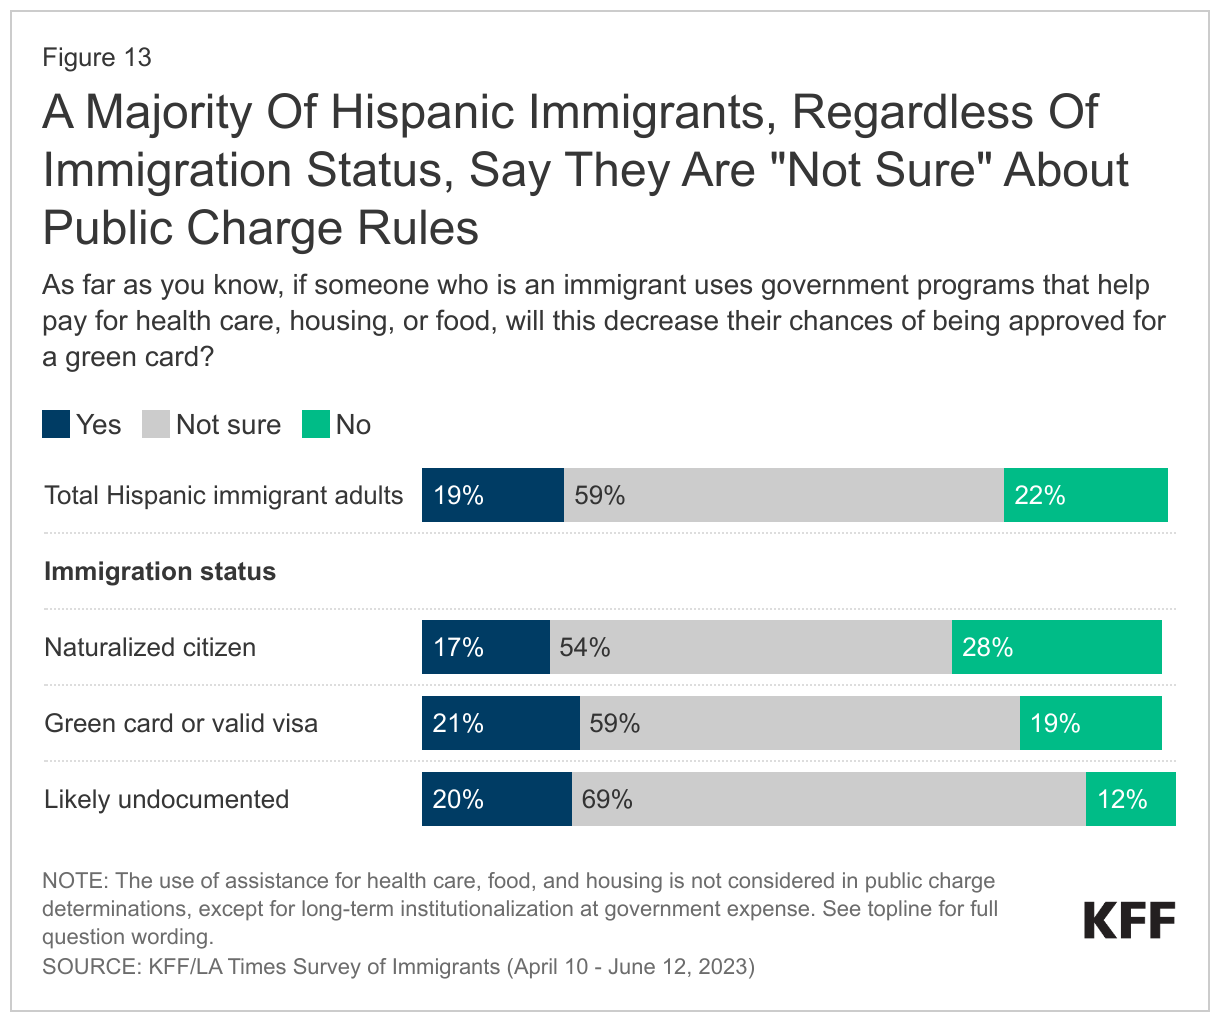
Most Hispanic immigrants are uncertain about how using assistance for food, housing, and health care may affect their immigration status. Under longstanding U.S. policy, federal officials can deny an individual entry to the U.S. or adjustment to lawful permanent status (a green card) if they determine the individual is a “public charge” based on their likelihood of becoming primarily dependent on the government for subsistence. In 2019, the Trump Administration made changes to public charge policy that newly considered the use of previously excluded noncash assistance programs for health care, food, and housing in public charge determinations. This policy was rescinded by the Biden Administration in 2021, meaning that the use of noncash benefits, including assistance for health care, food, and housing, is not considered for public charge tests, except for long-term institutionalization at government expense. However, the survey suggests that many Hispanic immigrants remain confused about public charge rules. About six in ten (59%) Hispanic immigrants say they are “not sure” whether use of public programs that help pay for health care, housing or food can decrease one’s chances for green card approval and another one in five (19%) incorrectly believe this to be the case. Among Hispanic immigrants who are likely undocumented, nine in ten are either unsure (69%) or incorrectly believe use of these types of public programs will decrease their chances for green card approval (20%).
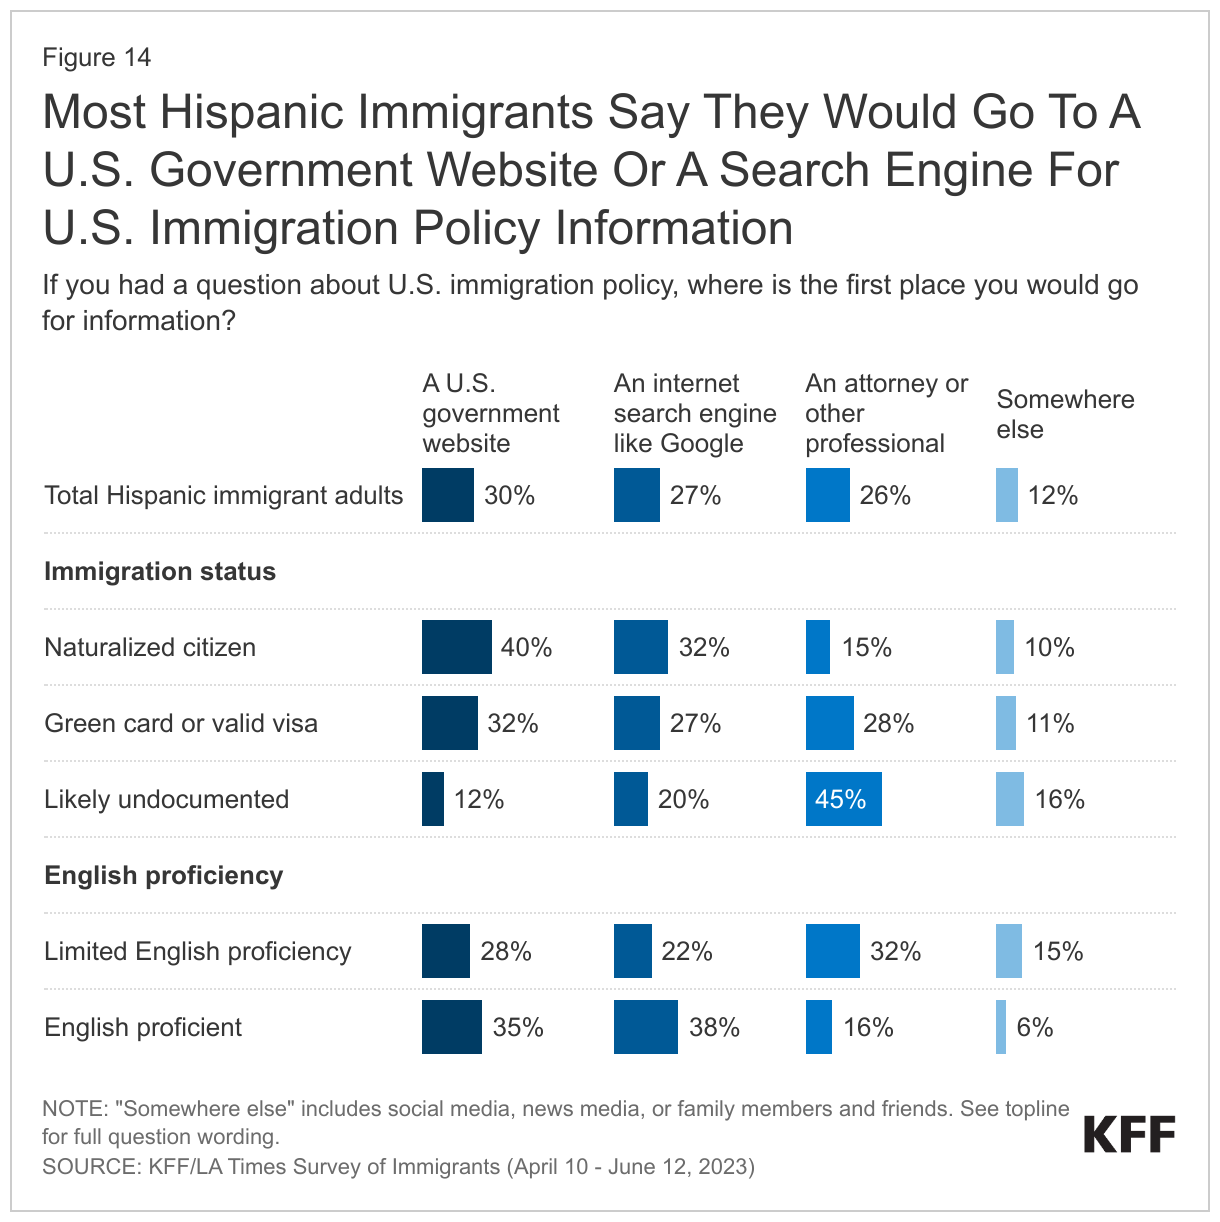
When asked where they would go if they had a question about U.S. immigration policy, most Hispanic immigrants say they would look to a government website (30%), an internet search engine like Google (27%), or an attorney or other professional (26%). Hispanic immigrants who are likely undocumented are more likely to say they would seek information from an attorney or other professional (45%) than are immigrants who are naturalized citizens (15%) or have a green card or valid visa (28%). Hispanic immigrants who have LEP are twice as likely to say they would go an attorney than those who are English proficient (32% v. 16%). As reported by the LA Times, immigration scams, particularly pretending to be an attorney are rampant, which may pose risks for undocumented immigrants.
Challenges Accessing Health Care
About one in four (26%) Hispanic immigrants are uninsured, rising to over half (55%) among those who are likely undocumented. About one in four (26%) of those with a green card or other valid visa report being uninsured and just one in ten (10%) of those who are citizens say they lack coverage. Uninsured rates are also higher among those who have lower incomes and LEP. The high uninsured rates among noncitizen and lower income Hispanic immigrants likely reflect lower levels of private coverage due to disproportionate employment in lower income jobs that are less likely to offer employer-based insurance. Medicaid coverage helps offset some, but not all, of this gap, as many noncitizen immigrants remain ineligible for federally funded coverage programs. Many lawfully present immigrants face a five-year waiting period to enroll in Medicaid or Children’s Health Insurance Program (CHIP) coverage, and undocumented immigrants are prohibited from enrolling in any federally funded coverage, including Medicaid, CHIP, Affordable Care Act (ACA) Marketplace, and Medicare coverage.
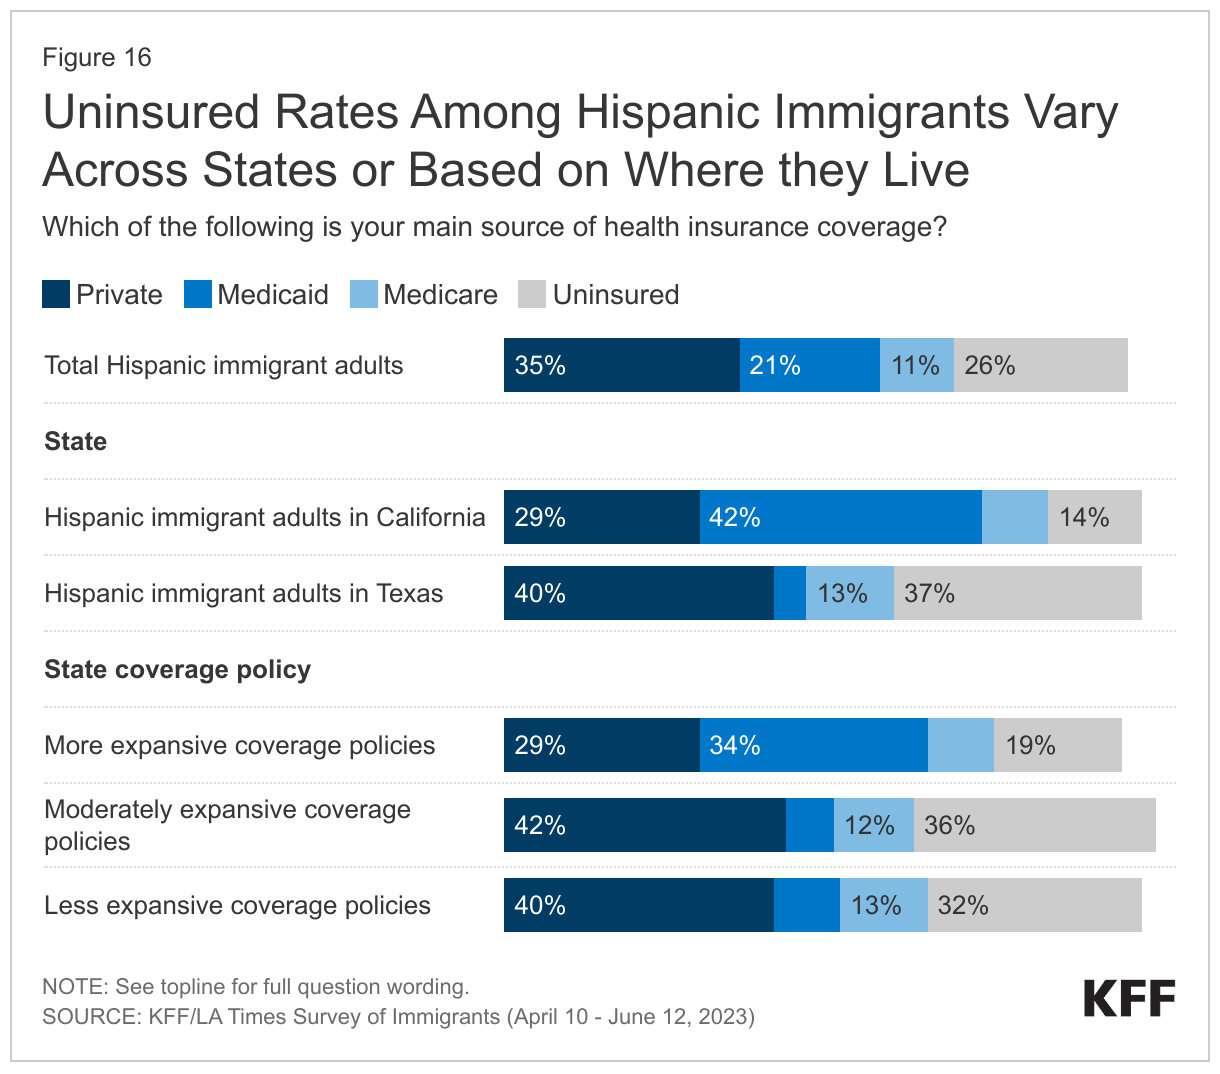
Where Hispanic immigrants live also makes a difference in their coverage rates, with higher rates of coverage among those living in states that offer more expansive coverage. States vary in the coverage they provide for their low-income population overall as well as for immigrants specifically. Those that have adopted the ACA Medicaid expansion have broader eligibility for low-income adults overall, but noncitizen immigrants still face eligibility restrictions for this coverage. Some states have expanded coverage for immigrants by eliminating the five-year waiting period in Medicaid and/or CHIP for lawfully present immigrant children and/or pregnant people and/or extending coverage to some immigrants regardless of immigration status through fully state-funded programs. Immigrants in states that have taken up more of these coverage options are less likely to be uninsured. For example, the uninsured rate for Hispanic immigrant adults in California is much lower than it is in Texas (14% vs. 37%). California has adopted the ACA Medicaid expansion to low-income adults, expanded coverage for recent lawfully present immigrant children and pregnant people in Medicaid and CHIP, and began providing fully state-funded coverage regardless of immigration status to children in 2016 and to some adults in 2019. In contrast, in Texas, Medicaid eligibility for adults remains limited to very low-income parents (16% of the federal poverty level or about $4,000 per year for a family of three), and the state does not provide any state-funded coverage for immigrants. Even in states offering more expansive coverage, about one in five (19%) Hispanic immigrants remain uninsured, which may, in part, reflect enrollment barriers for those who are eligible such as lack of knowledge or confusion around eligibility rules, immigration-related fears, difficulty completing enrollment processes, and/or language barriers.
Classifying States by Coverage Policies
Health coverage was analyzed by expansiveness of state coverage for immigrants based on state of residence reported by survey respondents. Expansiveness of coverage was classified as follows:
More expansive coverage: States were classified as having more expansive coverage if they have implemented the ACA Medicaid expansion to low-income adults, have taken up options in Medicaid and CHIP to cover immigrants, and provide state-funded coverage to at least some groups (such as children) regardless of immigration status. Even when state-funded coverage is limited to children, the availability of this coverage may reduce fears among immigrant adults about applying for coverage for themselves if they are eligible for other options.
Moderately expansive coverage: States were classified as having moderately expansive coverage if they implemented the ACA Medicaid expansion to low-income adults and have taken up at least two options available in Medicaid and CHIP to expand coverage for immigrants, including covering lawfully-residing immigrant children or pregnant people without a five year wait or adopting the CHIP unborn child option to cover income-eligible pregnant people regardless of immigration status.
Less expansive coverage: States were identified as having less expansive coverage if they have not implemented the ACA Medicaid expansion to low-income adults and/or have taken up fewer than two options in Medicaid or CHIP to expand coverage for immigrants and do not offer state-funded health coverage to immigrants.
See Appendix Table 1 for state groupings by these categories.
Overall, most Hispanic immigrants have sought health care in the U.S., and about three in four have seen a health care provider in the past year, but health care use is much lower among those who are uninsured and those who are likely undocumented. Reflecting the large role health insurance status plays in facilitating access to care, uninsured Hispanic immigrants are less likely to say they have sought or received care in the U.S. and to say they have seen a provider in the past year compared with insured Hispanic immigrants. Half of uninsured Hispanic immigrants report having a health care visit in the past year, compared to about eight in ten (82%) of their insured counterparts. Likely undocumented Hispanic immigrants and those with LEP also are generally less likely to report seeking or receiving care than their citizen and English proficient counterparts, although there is no significant difference in the share who have had a health care visit in the past year by English proficiency. In addition to higher uninsured rates among these groups, immigration-related fears and language barriers may reduce their use of care.
Most Hispanic immigrants say they have a place to go when they are sick or need health advice other than an emergency room, with four in ten (41%) saying they go to a neighborhood clinic or health center, also known as a community health center (CHC). Substantial shares of Hispanic immigrants, regardless of their insurance type, immigration status, English proficiency, and household income say a CHC is their usual source of care, highlighting their importance as a source of care for Hispanic immigrants overall. CHCs are a national network of safety-net primary care providers serving low-income and medically underserved communities, including communities of color, uninsured people, immigrants, and those in rural areas. Research shows that CHCs offer linguistically and culturally competent care to underserved racial and ethnic groups as well as people with LEP and that these services can positively impact patient satisfaction.
Uninsured Hispanic immigrants are much less likely than their insured counterparts to have a usual source of care other than the emergency room or to have a trusted doctor in the U.S. and are more likely to report skipping or postponing care. About one in five (22%) Hispanic immigrants say they do not have a usual source of care other than the emergency room, rising to over one in three of those who are uninsured (38%) or likely undocumented (36%). Moreover, while two-thirds (66%) of Hispanic immigrants overall say they have a trusted doctor or health care provider in the U.S., majorities of those who are uninsured (69%) and likely undocumented (56%) say they do not have a trusted doctor in the U.S. In addition, Hispanic immigrants who are uninsured are more likely than those who have insurance (35% vs. 21%) to say they have skipped or postponed health care services in the past 12 months.
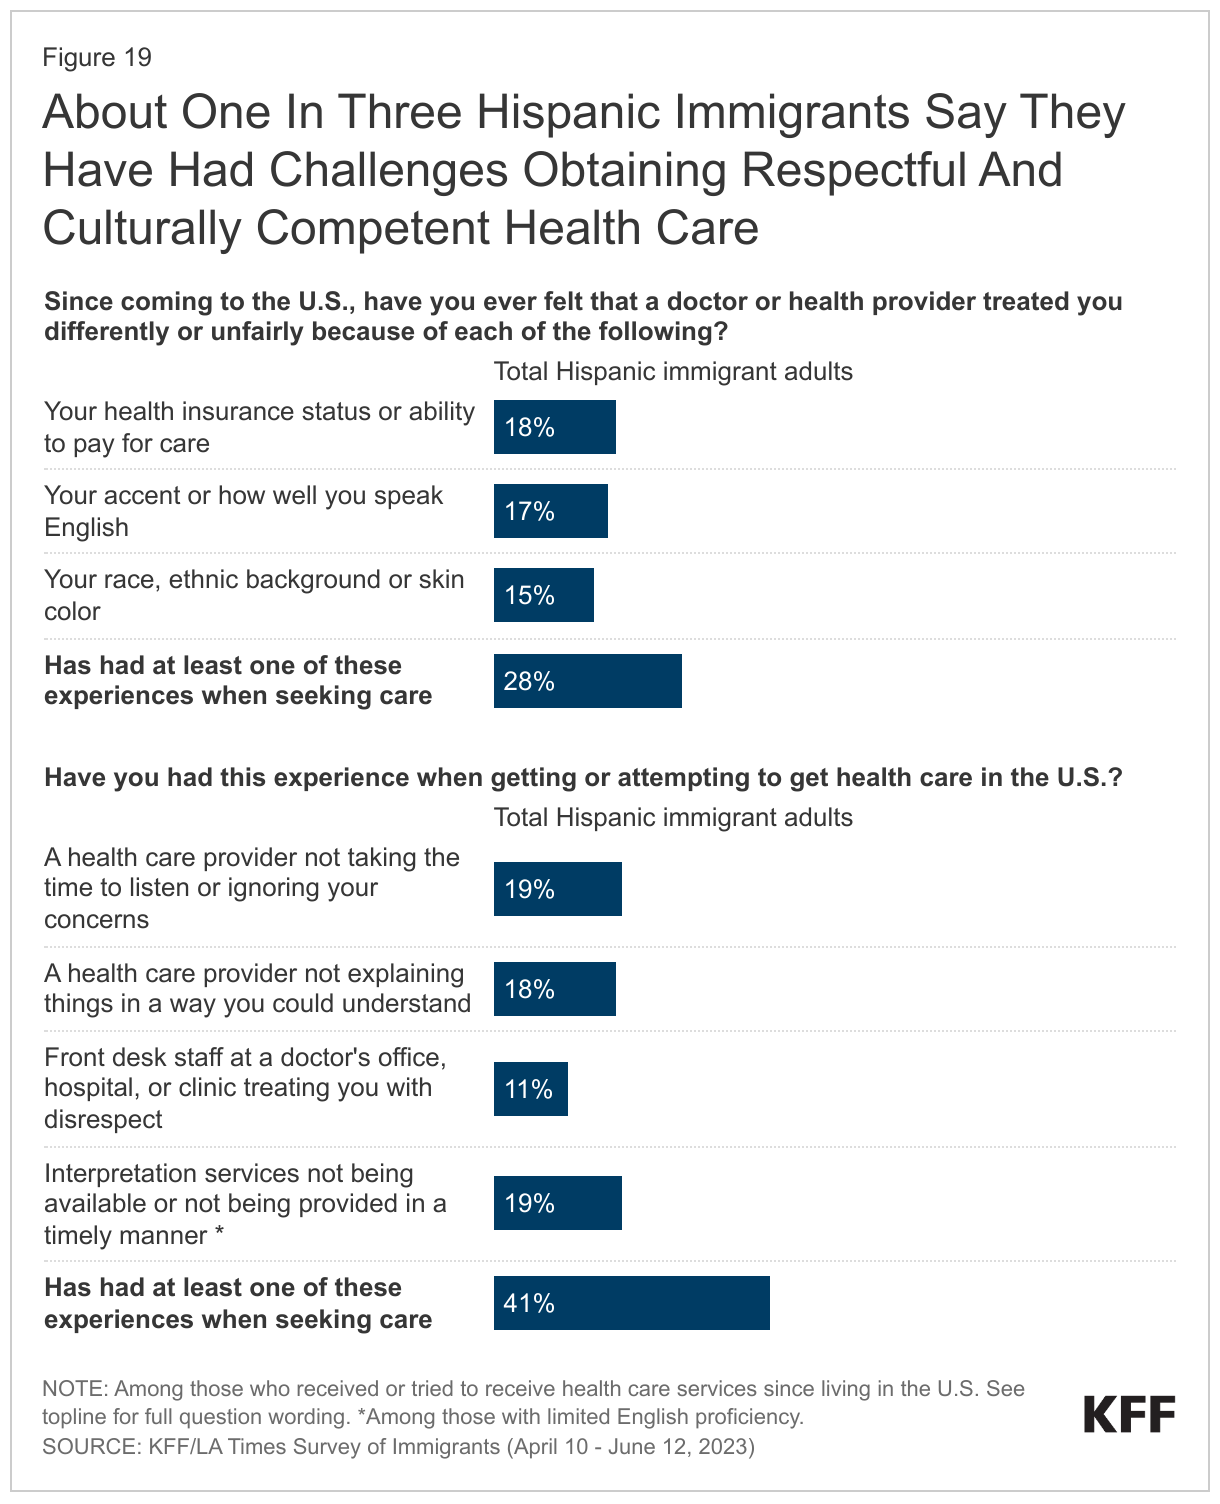
Among Hispanic immigrants who sought care in the U.S., about three in ten (28%) report being treated unfairly by a health care provider based on at least one of several factors asked about, and four in ten (41%) report at least one of several difficulties obtaining respectful and culturally competent care asked about on the survey. Specifically, about three in ten (28%) say that since coming to the U.S. they have ever been treated unfairly by a health care provider because of their insurance status or ability to pay (18%), their accent or how well they speak English (17%), and/or their race, ethnic background, or skin color (15%). Additionally four in ten (41%) say they experienced one or more of the following challenges, including a provider not taking the time to listen or ignoring concerns (19%); a health care provider not explaining things in a way they could understand (18%); being treated with disrespect by front office staff (11%); and, among those with LEP who completed the survey in a language other than English, interpretation services not available or provided in a timely manner (19%). Notably, there are few differences among Hispanic immigrants in the share reporting experiencing at least one of these challenges by coverage, income, or immigration status.
Acknowledgements:
KFF would like to thank the Association of Asian Pacific Community Health Organizations, the Black Alliance for Just Immigration, Dr. May Sudhinaraset, the National Immigration Law Center, the National Resource Center for Refugees, Immigrants, and Migrants, and UnidosUS for their invaluable inputs, insights, and suggestions throughout the planning, fielding, and dissemination of this survey project.
Methodology
The KFF/LA Times Survey of Immigrants is a partnership survey conducted by KFF and the LA Times examining the U.S. immigrant experience.
The survey was conducted April 10-June 12, 2023, online, by telephone, and by mail among a nationally representative sample of 3,358 immigrants, defined as adults living in the U.S. who were born outside the U.S. and its territories. Respondents had the option to complete the survey in one of ten languages: English (n=2,435), Spanish (n=627), Chinese (n=171), Korean (n=52), Vietnamese (n=22), Portuguese (n=16), Haitian-Creole (n=13), Arabic (n=9), French (n=9), and Tagalog (n=4). These languages were chosen as they are most commonly spoken by immigrant adults from countries of focus for the survey with limited English proficiency (LEP), based on the 2021 American Community Survey (2021).
Teams from KFF and The Los Angeles Times worked together to develop the questionnaire and both organizations contributed financing for the survey. KFF researchers analyzed the data, and each organization bears the sole responsibility for the work that appears under its name. Sampling, data collection, weighting, and tabulation were managed by SSRS of Glenn Mills, Pennsylvania in collaboration with public opinion researchers at KFF.
Respondents were reached through one of three sampling modes: an address-based sample (ABS) (n=2,661); a random digit dial telephone (RDD) sample of prepaid (pay-as-you go) cell phone numbers (n=565); and callbacks to telephone numbers that that were previously randomly sampled for RDD surveys and were identified as speaking a language other than English or Spanish (n=132). Respondents from all three samples were asked to specify their country of birth and qualified for the survey if they were born outside of the U.S.
Project design was informed by a pilot study conducted from January 31-March 14, 2022 among a sample of 1,089 immigrants in collaboration with SSRS. Prior to fielding the pilot study, KFF and SSRS conducted interviews with experts who had previous experience surveying immigrants. These conversations informed decisions on sampling, modes of data collection, recruitment strategies, and languages of interviews. The pilot test measured incidence of immigrant households across four different sample types and offered a short survey in 8 different languages both online and on the telephone. Based on the results of the pilot test, the following recruitment and data collection protocol was implemented:
Sampling strategy and interview modes:
The ABS was divided into areas (strata), defined by Census tract, based on the incidence of immigrants among the population overall and by countries of origin. Within each stratum, the sample was further divided into addresses that were flagged by Marketing Systems Group (MSG) as possibly occupied by foreign-born adults and unflagged addresses. To increase the likelihood of reaching immigrant adults, strata with higher incidence of immigrant households overall, and of immigrants from certain countries of origin were oversampled.
Households in the ABS were invited to participate through multiple mail invitations: 1) an initial letter in English with a short paragraph of instructions in each of the 10 survey languages on the back; 2) a reminder postcard in English plus up to two additional languages; 3) a follow-up letter accompanied by hardcopy questionnaires in English and one additional language; and 4) a final reminder including short messages in all 10 languages. For mailings 2 and 3, additional languages were chosen by using flags to identify the language other than English likely spoken at home. Invitation letters requested the household member ages 18 or older who was born outside of the U.S. with the most recent birthday to complete the survey in one of three ways: by going online, dialing into a toll-free number, or returning the completed paper questionnaire. In addition, interviewers attempted outbound calls to telephone numbers that were matched to sampled addresses. ABS respondents completed the survey online (n=2,087), over the phone (n=105), or by mail on paper (n=469). The random sample of addresses was provided by MSG.
The RDD sample of prepaid (pay-as-you-go) cell phone numbers was obtained through MSG. The prepaid cell phone component was disproportionately stratified to effectively reach immigrants from different countries based on county-level information. To increase the likelihood of reaching immigrant adults, counties with higher incidence of immigrants overall, and of certain countries of origin were oversampled.
The callback sample included 132 respondents who were reached by calling back telephone numbers that were previously randomly sampled for SSRS RDD surveys within two years and coded by interviewers as non-English or non-Spanish speaking. as having respondents speaking languages other than English or Spanish.
Incentives:
Initial mailings to the ABS sample included $2 as part of the invitation package, and respondents received a $10 incentive if they completed the survey in the first two weeks after the initial mailing. In order to increase participation among under-represented groups, the incentive increased to $20 for those who did not respond within the first two weeks. ABS phone respondents received this incentive via a check received by mail, paper respondents received a Visa gift card by mail, and web respondents received an electronic gift card incentive. Respondents in both phone samples received a $25 incentive via a check received by mail.
Questionnaire design and translation:
In addition to collaboration between KFF and the LA Times, input from organizations and individuals that directly serve or have expertise in issues facing immigrant populations helped shaped the questionnaire. These community representatives were offered a modest honorarium for their time and effort to review questionnaire drafts, provide input, attend meetings, and offer their expertise on dissemination of findings.
After the content of the questionnaire was largely finalized, SSRS conducted a telephone pretest in English and adjustments were made to the questionnaire. Following the English pretest, Research Support Services Inc. (RSS) translated the survey instrument from English into the nine languages outlined above and performed cognitive testing through qualitative interviews in all languages including English. The results of the cognitive testing were used to adjust questionnaire wording in all languages including English to ensure comprehension and cohesiveness across languages and modes of interview. As a final check on translation and its overlay into the web and CATI program, translators from Cetra Language Solution reviewed each question, as it appears in the program, and provided feedback. The questionnaire was revised and finalized based on this feedback.
Data quality checks:
A series of data quality checks were run on the final data. The online questionnaire included two questions designed to establish that respondents were paying attention and cases were monitored for data quality. Fifteen cases were removed from the data because they failed two or more quality checks, failed both attention check questions, or skipped over 50% of survey questions. An additional 67 interviews were removed after deemed ineligible by SSRS researchers (they were not U.S. immigrants).
Weighting:
The combined sample was weighted to adjust for the sampling design and to match the characteristics of the U.S. adult immigrant population, based on data from the Census Bureau’s 2021 American Community Survey (ACS). Weighting was done separately for each of 11 groups defined by country or region of origin (Mexico, China, Other East/Southeast Asia, South Asia, Europe, Central America, South America, Caribbean, Middle East/North Africa, Sub-Sahara Africa, all others). The samples were weighted by sex, age, education, race/ethnicity, census region, number of adults in the household, presence of children in the household, home ownership, time living in the U.S., English proficiency, and U.S. citizenship. The overall sample was also weighted to match the share of U.S. adult immigrants from each country/region of origin group. The weights take into account differences in the probability of selection for each of the three sample types. This includes adjustment for the sample design and geographic stratification, and within household probability of selection. Subgroup analysis includes data checks to ensure that the weighted demographics of subgroups are within reasonable range from benchmarks whenever possible.
The margin of sampling error including the design effect for the full sample is plus or minus 2 percentage points. Numbers of respondents and margins of sampling error for key subgroups are shown in the table below. For results based on other subgroups, the margin of sampling error may be higher. Sample sizes and margins of sampling error for other subgroups are available by request. Sampling error is only one of many potential sources of error and there may be other unmeasured error in this or any other public opinion poll. KFF public opinion and survey research is a charter member of the Transparency Initiative of the American Association for Public Opinion Research.
| Group | N (unweighted) | M.O.S.E. |
| Total | 3,358 | ± 2 percentage points |
| Race/Ethnicity | ||
| Black immigrants | 274 | ± 8 percentage points |
| Hispanic immigrants | 1,207 | ± 4 percentage points |
| Asian immigrants | 1,318 | ± 4 percentage points |
| White immigrants | 495 | ± 6 percentage points |
| Immigration Status | ||
| Naturalized citizen | 2,134 | ± 3 percentage points |
| Green card or valid visa holder | 819 | ± 5 percentage points |
| Likely undocumented | 372 | ± 6 percentage points |
| English Proficiency | ||
| Speaks English only or “very well” | 1,713 | ± 3 percentage points |
| Speaks English “less than very well” | 1,635 | ± 3 percentage points |
Focus group methodology:
As part of this project, KFF conducted 13 focus groups with immigrant adults across the country to help inform survey questionnaire development, provide deeper insights into the experiences of immigrant groups that had a smaller sample size in the survey, and to provide a richer understanding of some of the survey findings.
Two rounds of focus groups were completed. The first round of 6 groups was conducted between September-October 2022 virtually among participants living across the country who are Hispanic immigrants (conducted in Spanish), Asian (excluding Chinese) immigrants (conducted in English), or Chinese immigrants (conducted in Mandarin Chinese). The groups were separated by gender, lasted 90 minutes, and included 5-7 participants each.
The second round of groups were conducted in-person between May-June 2023 in Los Angeles, CA and Fresno, CA with Hispanic immigrants conducted in Spanish; and in Houston, TX and Irvine, CA with Vietnamese immigrants conducted in Vietnamese. In addition, virtual groups were conducted among participants living in the Texas border region (Hispanic immigrants), the Miami, FL region (Haitian immigrants), and nationally (Black immigrants from sub-Saharan Africa). Groups were mixed gender, lasted between 90 minutes and two hours, and were conducted in English, Spanish, Vietnamese, and Haitian-Creole with 5-8 participants each.
For each group, participants were chosen based on the following criteria: Must be at least 18 years of age and have been born outside of the U.S. and its territories; for groups conducted in languages other than English, must speak English “less than very well” and be able to speak conversationally in the group’s language (i.e., Spanish). In addition, groups were chosen to represent a mix of household composition, including at least some participants who are parents; a mix of household income levels, with a preference for recruiting lower income participants; a mix of health insurance types; and a mix of immigration statuses. Goodwin Simon Strategic Research (GSSR) recruited and hosted the first round of focus groups. PerryUndem recruited and hosted the second round of focus groups. The screener questionnaire and discussion guides were developed by researchers at KFF in consultation with the firms who recruited and hosted the groups. Groups were audio and video recorded with participants’ permission. Each participant was given $150-$175 after participating.
Endnotes
- Persons of Hispanic origin may be of any race but are categorized as Hispanic for this analysis and include those who selected u201cHispanic or Latino (such as Mexican, Brazilian, Cuban, or some other Latin American background)u201d when asked to describe their racial and ethnic background. ↩︎
