Overview of Health Coverage and Care for Individuals with Limited English Proficiency (LEP)
Introduction
As of 2021, 25.7 million or 8% of people ages five or older living in the United States had limited English proficiency (LEP). Guidance from the Department of Health and Human (HHS) services identifies individuals with LEP as those who do not speak English as their primary language and who have a limited ability to read, write, speak, or understand English.1 Individuals with LEP disproportionately experience gaps in health insurance coverage and poor health outcomes, in part because they may face linguistic barriers to information or communication.2 ,3 Because people of color are significantly more likely to have LEP than White people, these barriers can also exacerbate racial and ethnic disparities in health and health care. This brief provides an overview of the LEP population and their access to health coverage and care based on KFF analysis of 2021 American Community Survey data. Overall, it shows:
- Most individuals with LEP are Hispanic, Spanish-speaking adults. As of 2021, Hispanic people account for nearly two-thirds (62%) of the LEP population, while over a fifth (22%) of individuals with LEP are Asian. The top five languages spoken by people with LEP include Spanish (63%), Chinese (7%), Vietnamese (3%), Arabic (2%), and Tagalog (2%), while the remaining roughly quarter (23%) of people with LEP speak other languages. People with LEP are disproportionately concentrated in some states, with nearly 60% of people with LEP living in California (25%), Texas (14%), Florida (10%) and New York (9%).
- While Hispanic people make up the majority of people with LEP, Asian people have the highest share of individuals with LEP across racial and ethnic groups. Nearly one in three Asian people (31%) over age five have LEP, followed by nearly three in ten (28%) Hispanic people. Moreover, immigrants are significantly more likely than U.S.-born people to have LEP, with over half (56%) of noncitizens and over a third (37%) of naturalized citizens having LEP compared to just 2% of U.S.-born citizens.
- Individuals with LEP are more likely to be uninsured than their English proficient counterparts. Individuals with LEP are about as likely as English proficient individuals to live in a household with a full-time worker, but they are more likely to have lower incomes and educational attainment levels. The lower incomes among people with LEP reflect disproportionate employment in low-wage jobs that often do not offer health coverage, contributing to higher uninsured rates. Despite large gains in coverage since implementation of the Affordable Care Act (ACA), people with LEP remain three times as likely as likely as English proficient people to be uninsured. Among people with LEP, Hispanic people are particularly likely to be uninsured.
- Beyond disparities in coverage, people with LEP face other challenges and barriers to accessing high-quality health care. Language barriers between providers and patients can reduce the quality of care patients receive and result in adverse effects and/or medical errors. Disparities based on race and ethnicity, citizenship status, and educational attainment and income may compound impacts of LEP.
- Disparities in coverage for people with LEP could widen as states unwind the continuous enrollment provision in Medicaid. Mitigating coverage losses among people with LEP who remain eligible for Medicaid or for other coverage options like the ACA Marketplace will be important for preventing widening of coverage disparities. Moreover, ensuring people with LEP can access timely and qualified language assistance services can help to address challenges LEP people face in accessing health care and improve the quality of care they receive.
Who are individuals with LEP?
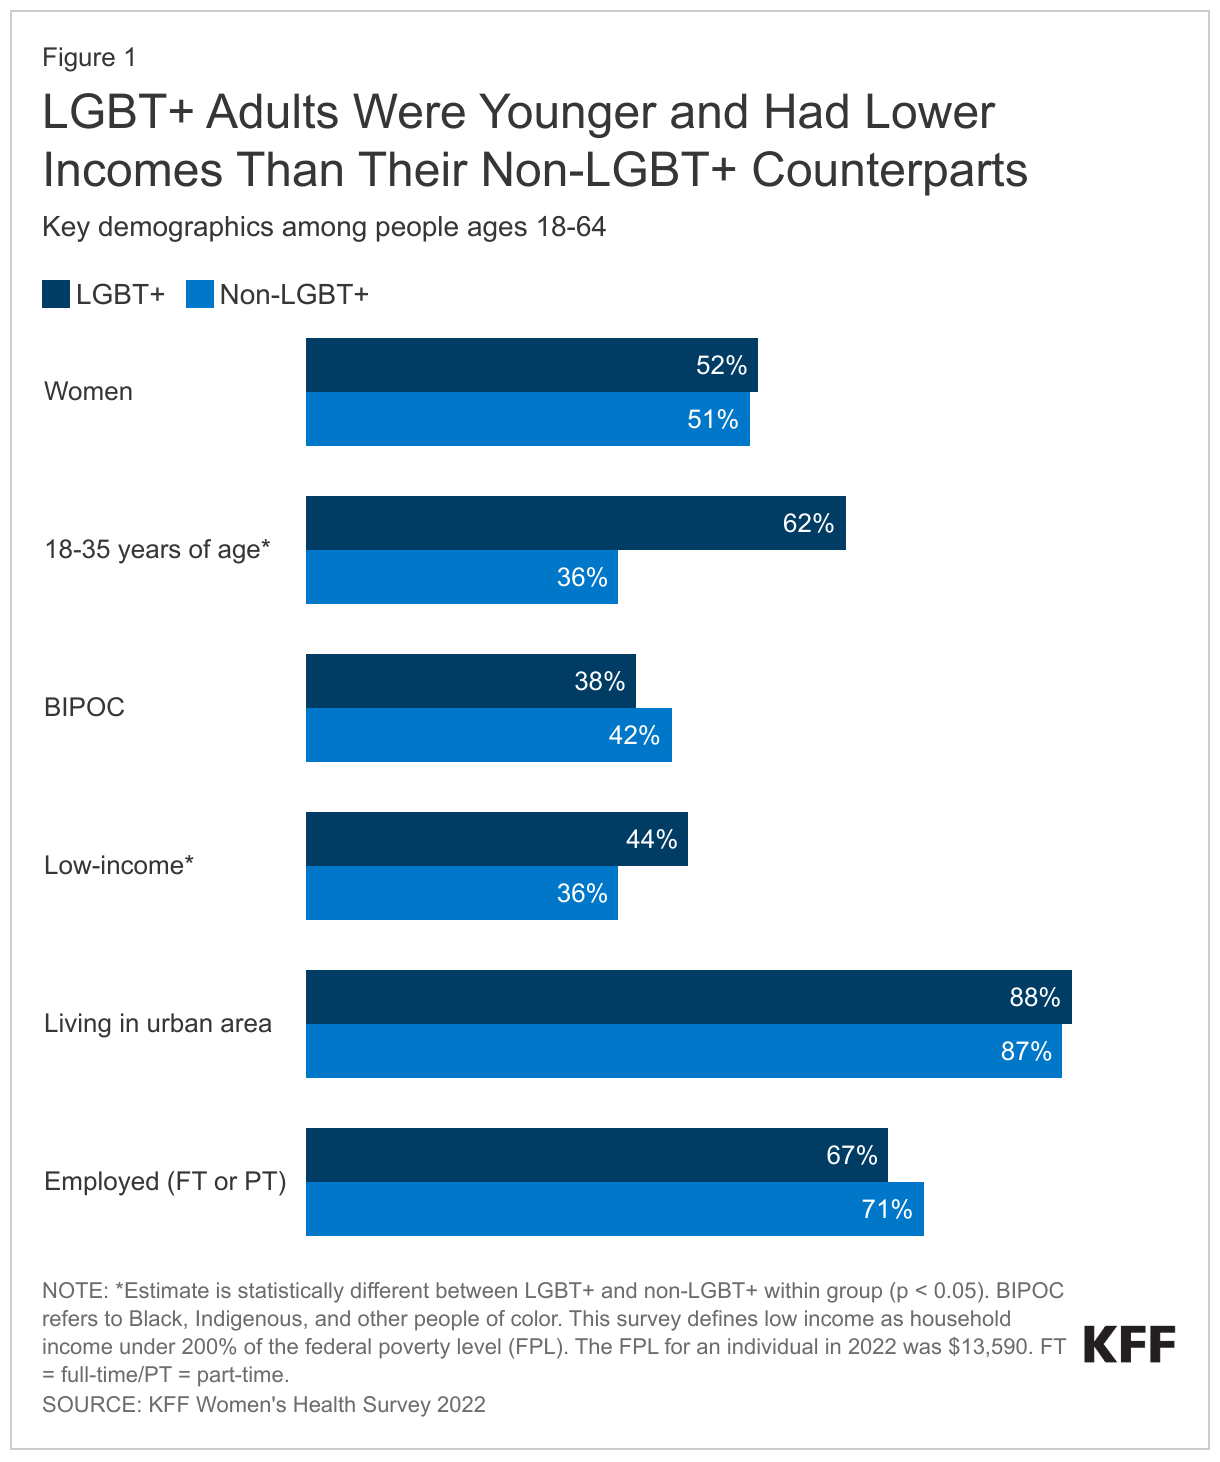
Most individuals with LEP are Hispanic, Spanish-speaking adults. Nearly nine out of ten individuals with LEP are adults, the largest share of whom are between ages 35-54 (38%) (Figure 1). Hispanic people account for nearly two-thirds (62%) of the LEP population, while over a fifth (22%) of individuals with LEP are Asian. The remainder of individuals with LEP are White (11%) or Black (4%) or of other racial and ethnic backgrounds, including American Indian and Alaska Native (AIAN) people, Native Hawaiian and Other Pacific Islander (NHOPI) people and those that identify more than one race. The top five languages spoken by people with LEP include Spanish (63%), Chinese (7%), Vietnamese (3%), Arabic (2%), and Tagalog (2%), while the remaining roughly quarter (23%) of people with LEP speak other languages. People with LEP are disproportionately concentrated in some states, with nearly 60% of people with LEP living in California (25%), Texas (14%), Florida (9%) and New York (9%).

Who is more likely to have LEP?
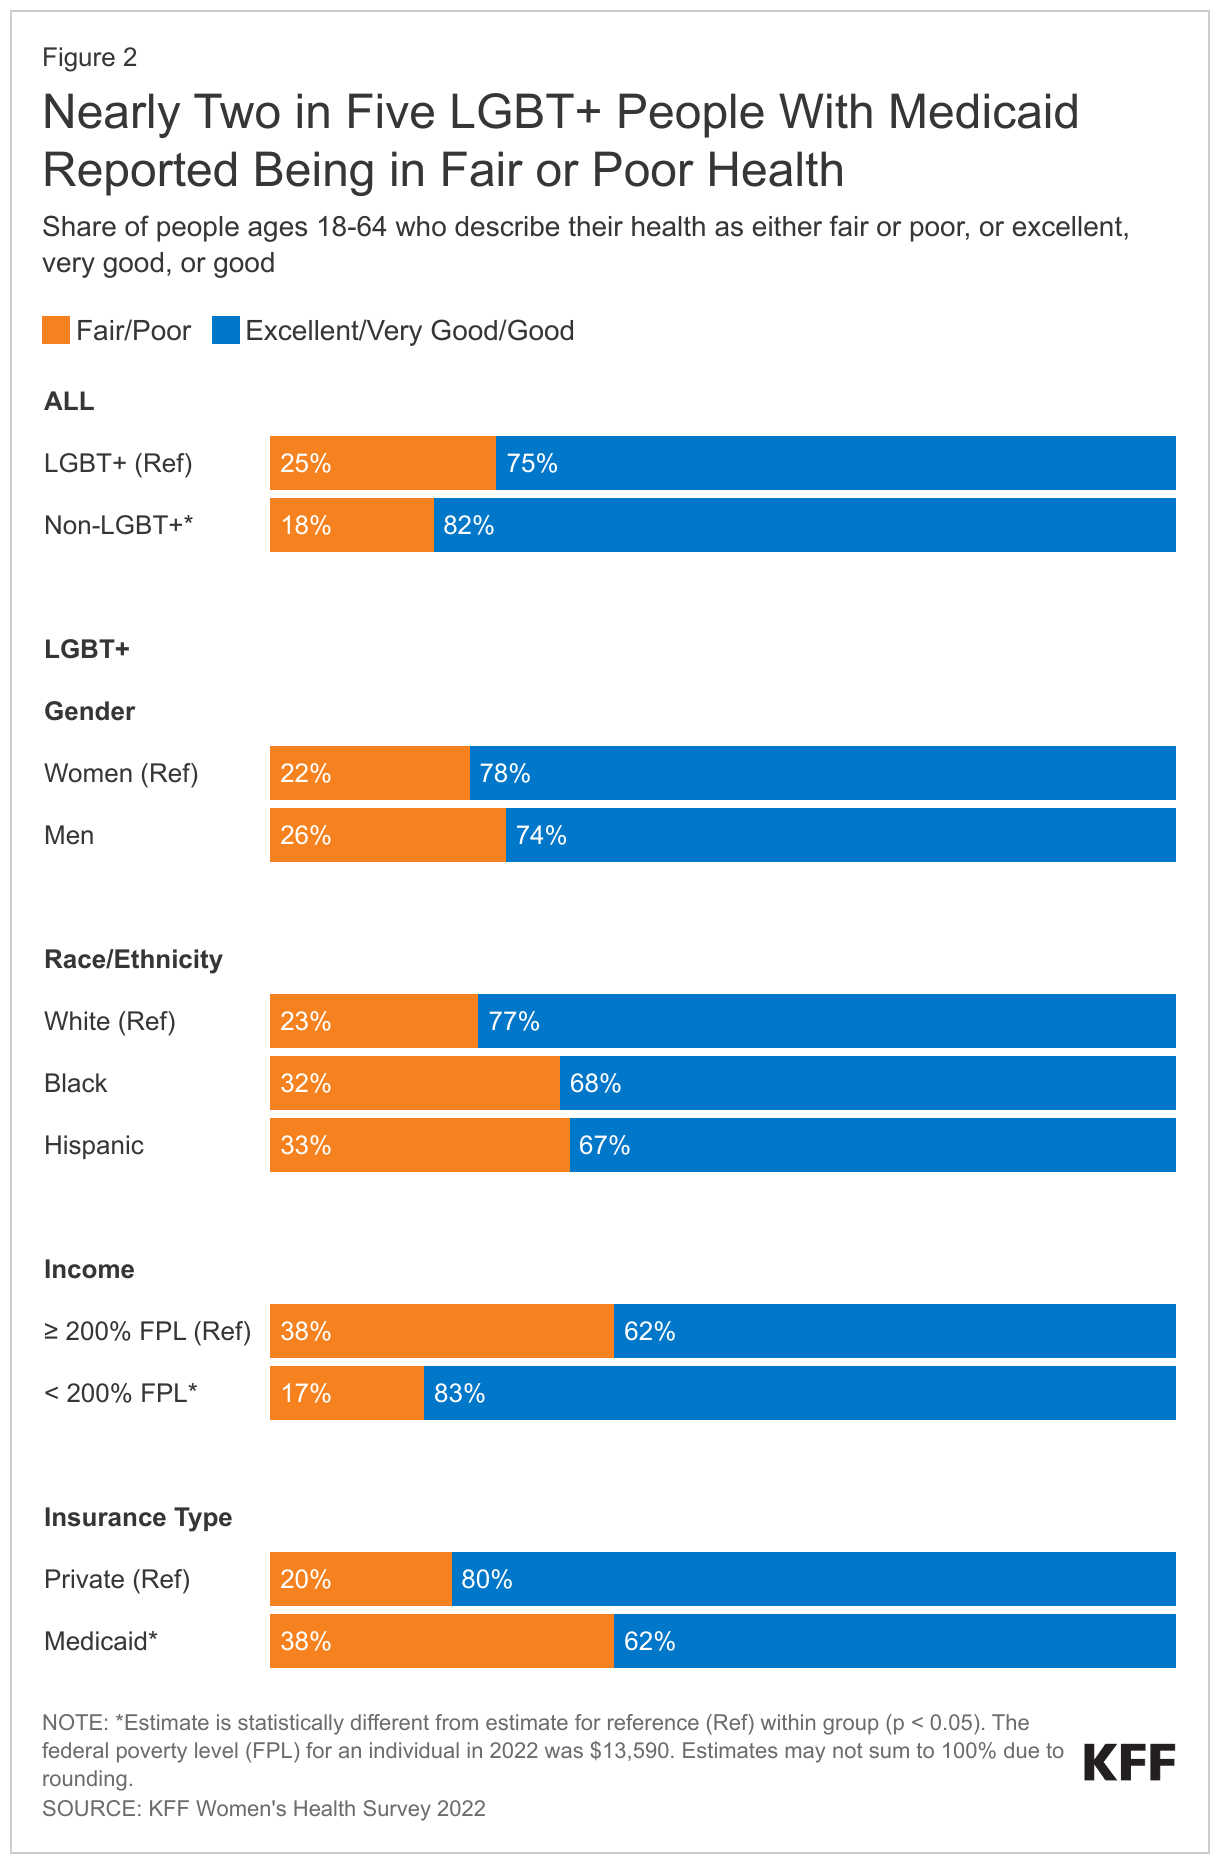
Nationwide, 8% of individuals over age five have LEP, but this share is higher in some states (Figure 2). The share of individuals with LEP varies widely across states, from a low of less than 1% in West Virginia to a high of 18% in California. Other states with relatively high shares of individuals with LEP include New York (13%), Texas (13%), Florida (12%), Hawaii (12%), New Jersey (12%), Nevada (11%), and Massachusetts (10%).

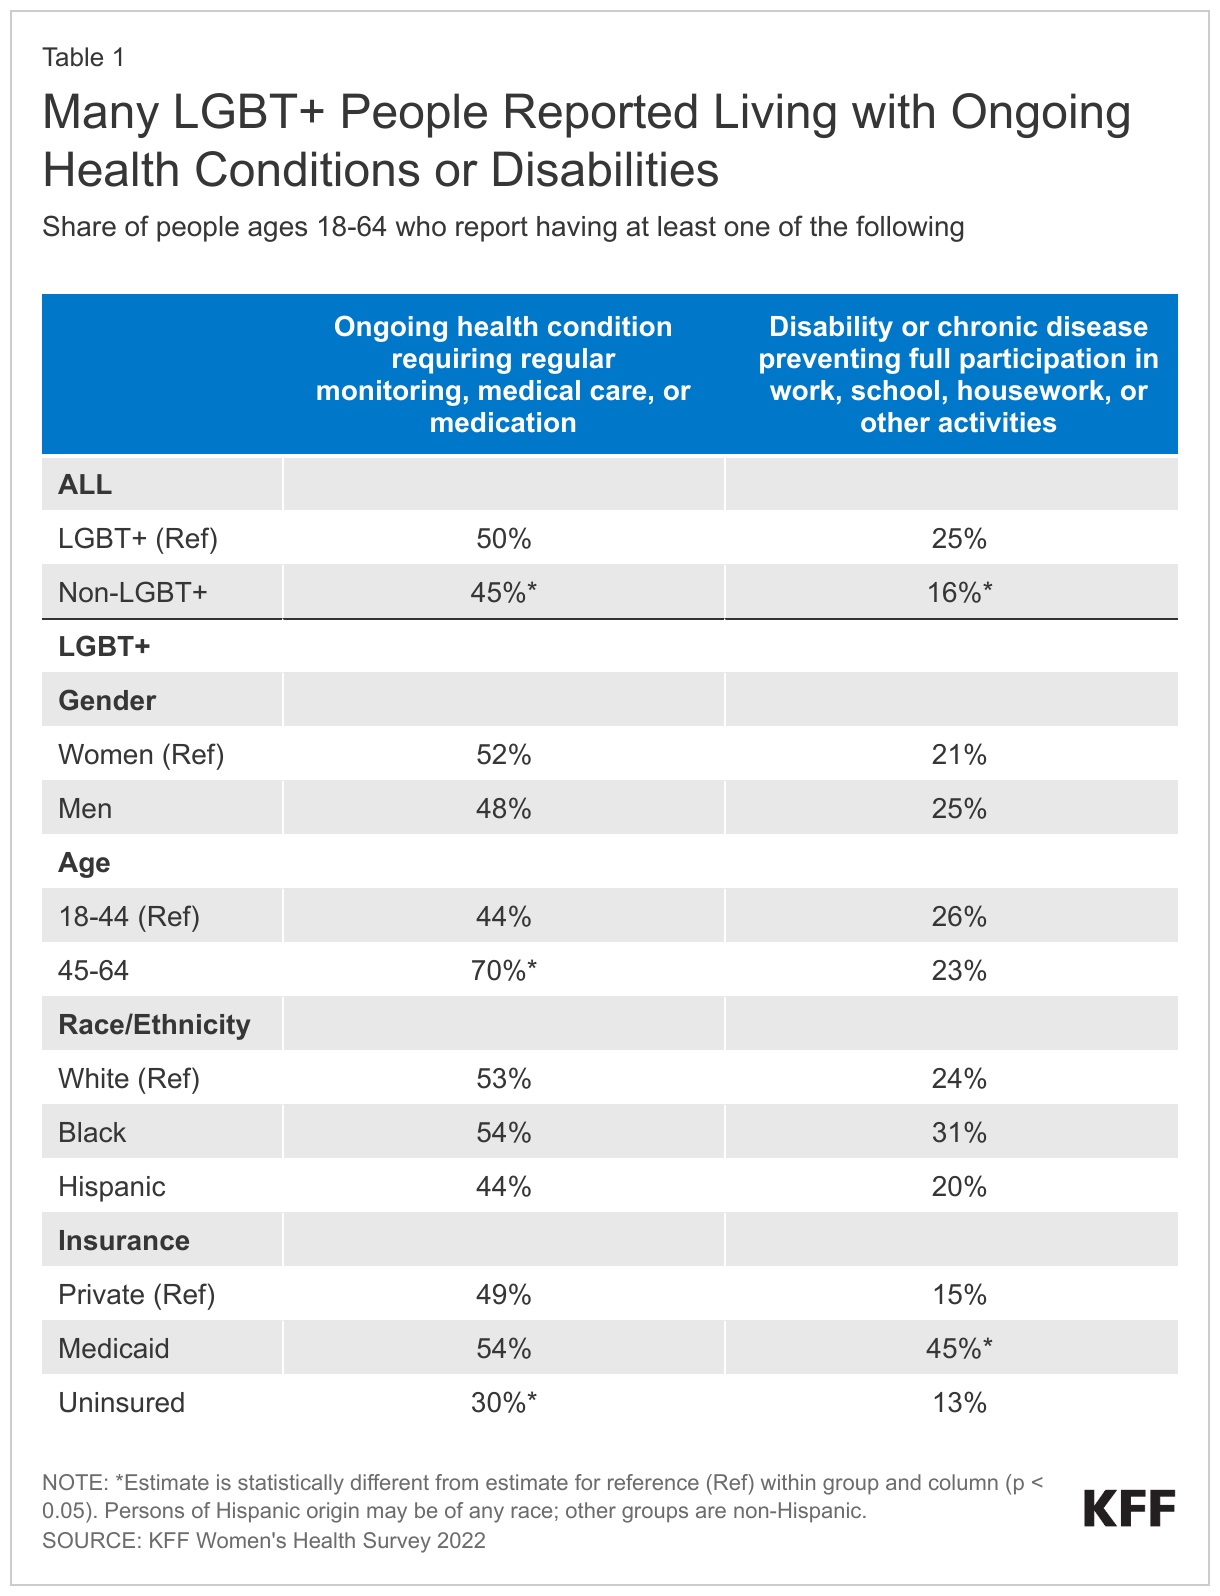
Asian people have the highest share of individuals with LEP across racial and ethnic groups, with nearly one in three (31%) individuals over age five having LEP as of 2021, followed by nearly three in ten (28%) Hispanic people and 12% of NHOPI people (Figure 3). Shares of individuals with LEP are lower among other racial and ethnic groups at less than 5%. Noncitizens (56%) and naturalized citizens (37%) are also significantly more likely to have LEP compared with U.S-born citizens (2%).

How does work, education, and income vary by English proficiency?
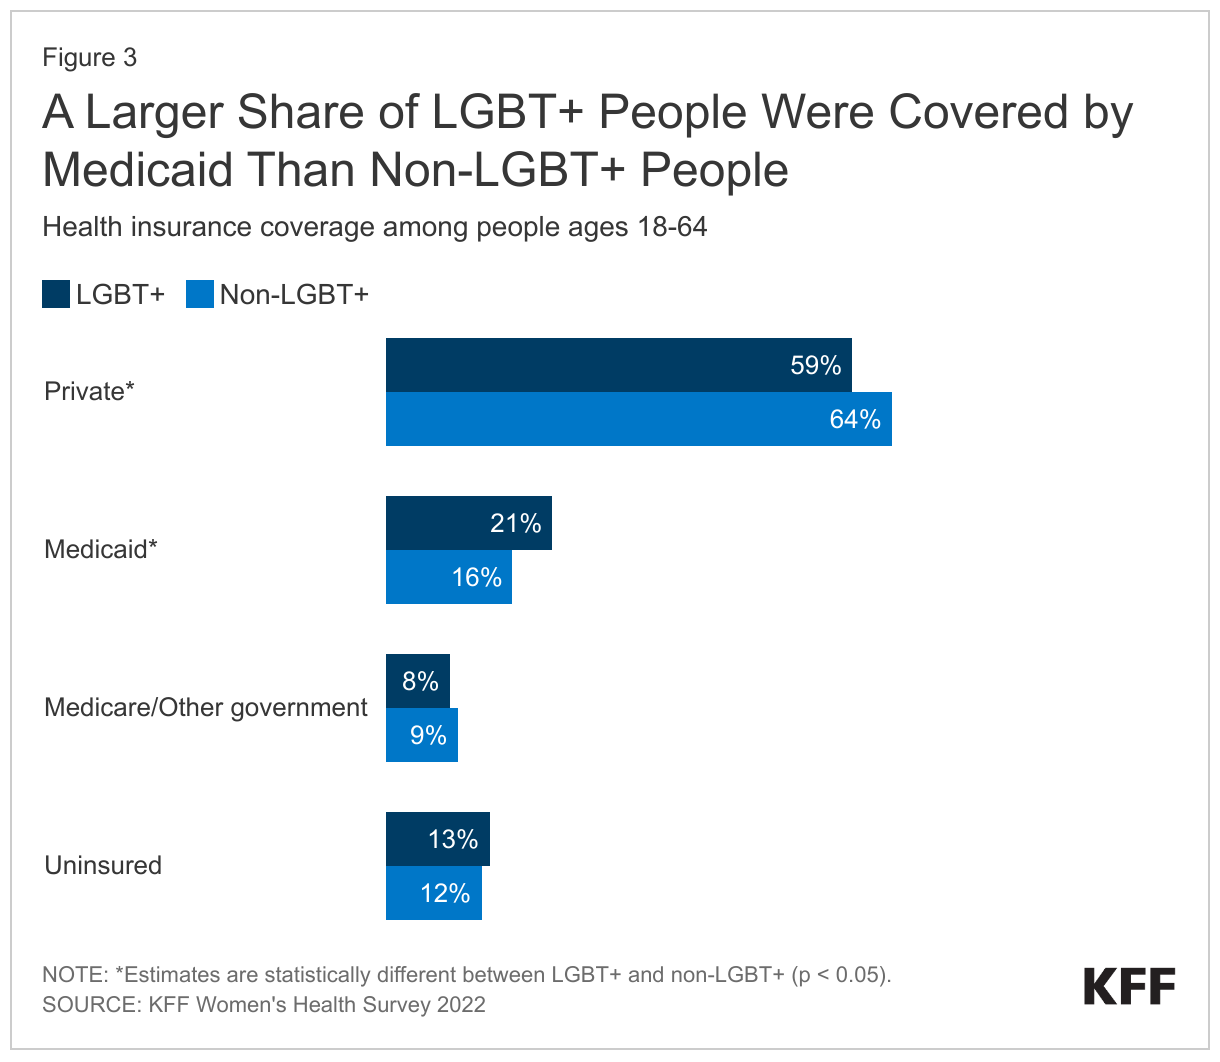
Individuals with LEP are about as likely as English proficient individuals to live in a household with a full-time worker, but they are more likely to have lower incomes and educational attainment levels. Approximately seven in ten of both LEP and English proficient individuals live in a household with at least one full-time worker (Figure 4). Workers with LEP are concentrated in manufacturing, food services and construction industries, which typically provide lower wages than professional or management positions.4 Reflecting disproportionate employment in these industries, individuals with LEP are more likely to be low-income—nearly one in five individuals with LEP have family income below 200% of the federal poverty level (FPL) compared to just over one in ten English proficient individuals (19% vs. 12%). Lower educational attainment is one factor likely driving these employment differences, as among those ages 19 and older, individuals with LEP are over five times as likely as English proficient adults to have less than a high school education (39% vs. 7%).

How does health coverage vary by English proficiency?
As of 2021, nonelderly individuals with LEP are more likely to be uninsured and more likely to be covered by Medicaid compared with English proficient individuals. Nonelderly individuals with LEP are over three times more likely to be uninsured (29% vs. 9%) as English proficient individuals (Figure 5). The higher uninsured rate among nonelderly individuals with LEP reflects lower rates of private coverage among this group. As noted, individuals with LEP are more likely to be employed in lower-wage jobs and industries that often do not offer employer-sponsored coverage and may have difficulty affording coverage even when it is offered. Medicaid helps to fill some of this gap in private coverage for people with LEP, but does not fully offset the difference, leaving people with LEP more likely to be uninsured. Although uninsured rates are lower among children compared to nonelderly adults, both children and nonelderly adults with LEP are more than three times as likely to be uninsured as their English proficient peers (17% vs. 5% for children and 31% vs. 10% for adults).

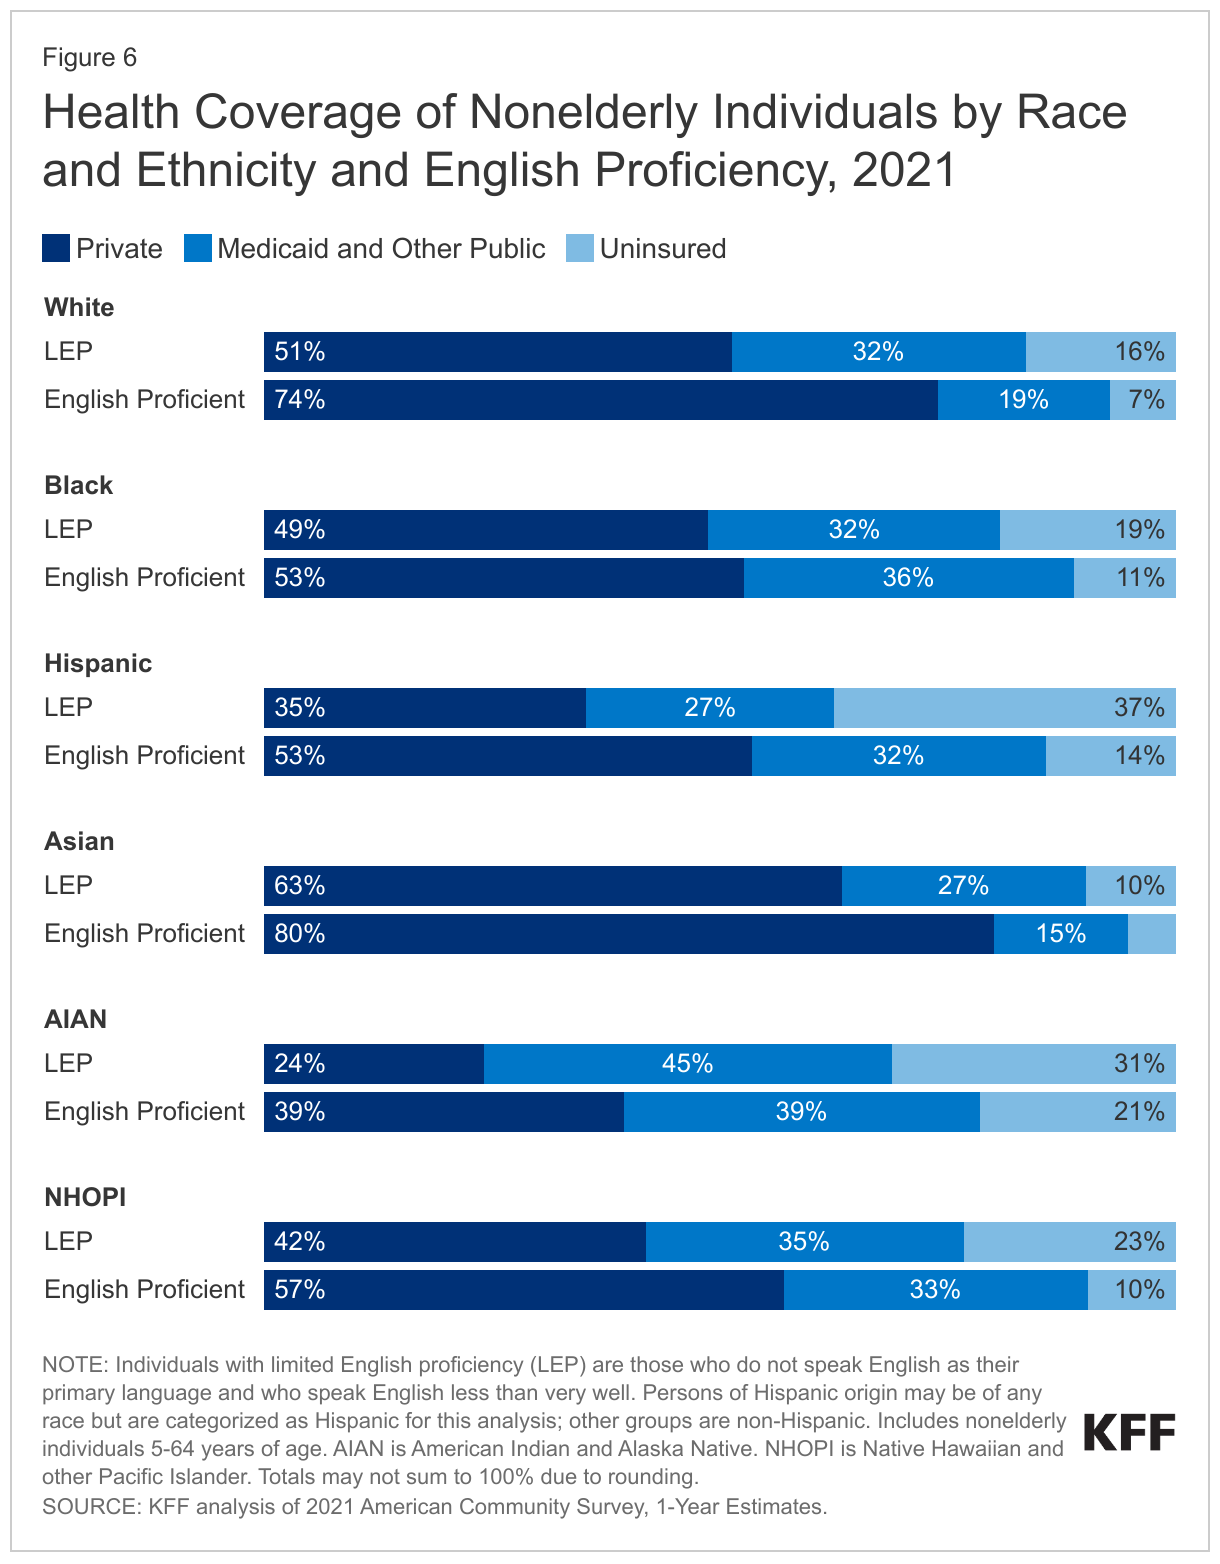
Differences in health coverage by English proficiency vary by race and ethnicity, with Hispanic nonelderly individuals with LEP having the highest uninsured rate. Across racial and ethnic groups, individuals with LEP are significantly more likely to be uninsured than English proficient people. For example, among nonelderly Hispanic people, those with LEP are over twice as likely to be uninsured as those who are English proficient (37% vs. 14%) (Figure 6). Similarly, nonelderly Asian people with LEP are twice as likely to be uninsured as Asian people who are English proficient (10% vs. 5%). However, uninsured rates among people with LEP vary widely across race and ethnicity groups. Among nonelderly people with LEP, Hispanic people have the highest uninsured rate at 37%, followed by almost one-third (31%) of AIAN people, and nearly a quarter (23%) of NHOPI people. Uninsured rates among Black and White people with LEP are lower at 19% and 16%, respectively, and lowest among Asian people with LEP at 10%, although uninsured rates among Asian people vary by ethnic subgroup.
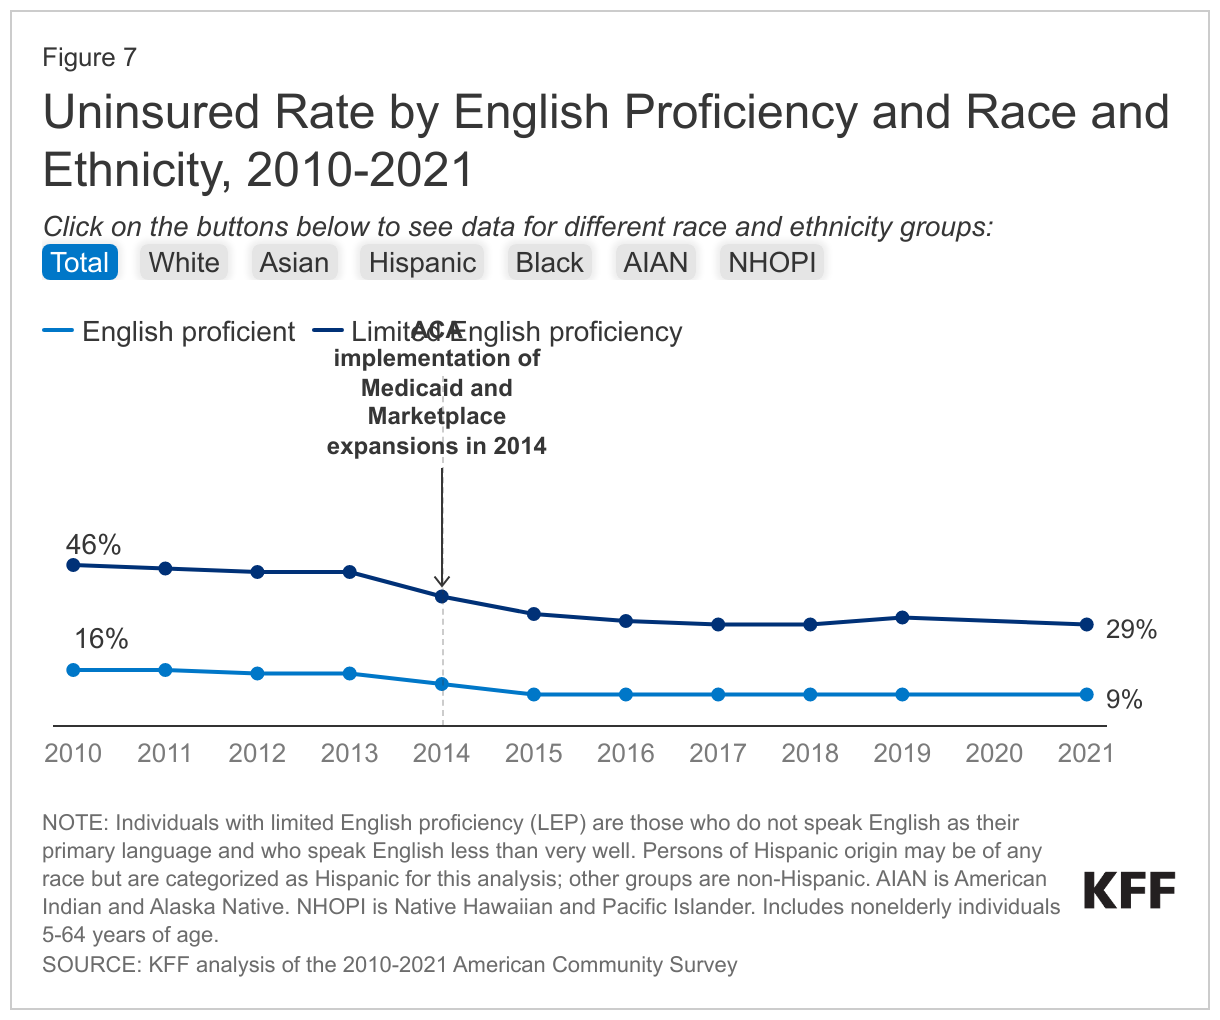
Nonelderly individuals with LEP have experienced large coverage gains since implementation of the ACA, which helped narrow but did not eliminate disparities in coverage. Prior to the enactment of the ACA in 2010, almost half (46%) of people with LEP were uninsured—nearly three times the uninsured rate of English proficient people (16%). Between 2010 and 2021, the uninsured rate among people with LEP fell from 46% to 29%, a 17 percentage-point drop, over twice as large as the 7 percentage-point drop for English proficient people from 16% to 9% (Figure 7). This coverage gain helped to narrow the absolute difference in uninsured rates between people with LEP and English proficient people, but people with LEP still remained over three times as likely as English proficient people to be uninsured as of 2021 (29% vs. 9%). Across most racial and ethnic groups, people with LEP had larger absolute gains in coverage than their English proficient counterparts, although there were no improvements in relative disparities. Hispanic people with LEP had the largest coverage gain, with their uninsured rate falling from 55% to 37%. Asian and Black people with LEP had gains of 17 percentage points (27% to 10%) and 16 percentage points (35% to 19%), respectively, while gains were smaller among other groups.
Many of these gains in coverage reflected the new coverage options for low- and moderate-income individuals created by the ACA, including the Medicaid and Marketplace expansions implemented in 2014. Following years of coverage gains after implementation of the ACA, uninsured rates increased for several years prior to the pandemic, and then declined slightly between 2019 and 2021. These recent coverage gains reflect policies implemented during the pandemic to stabilize and expand health coverage, including a requirement that Medicaid programs keep people continuously enrolled during the pandemic, which contributed to rises in enrollment.
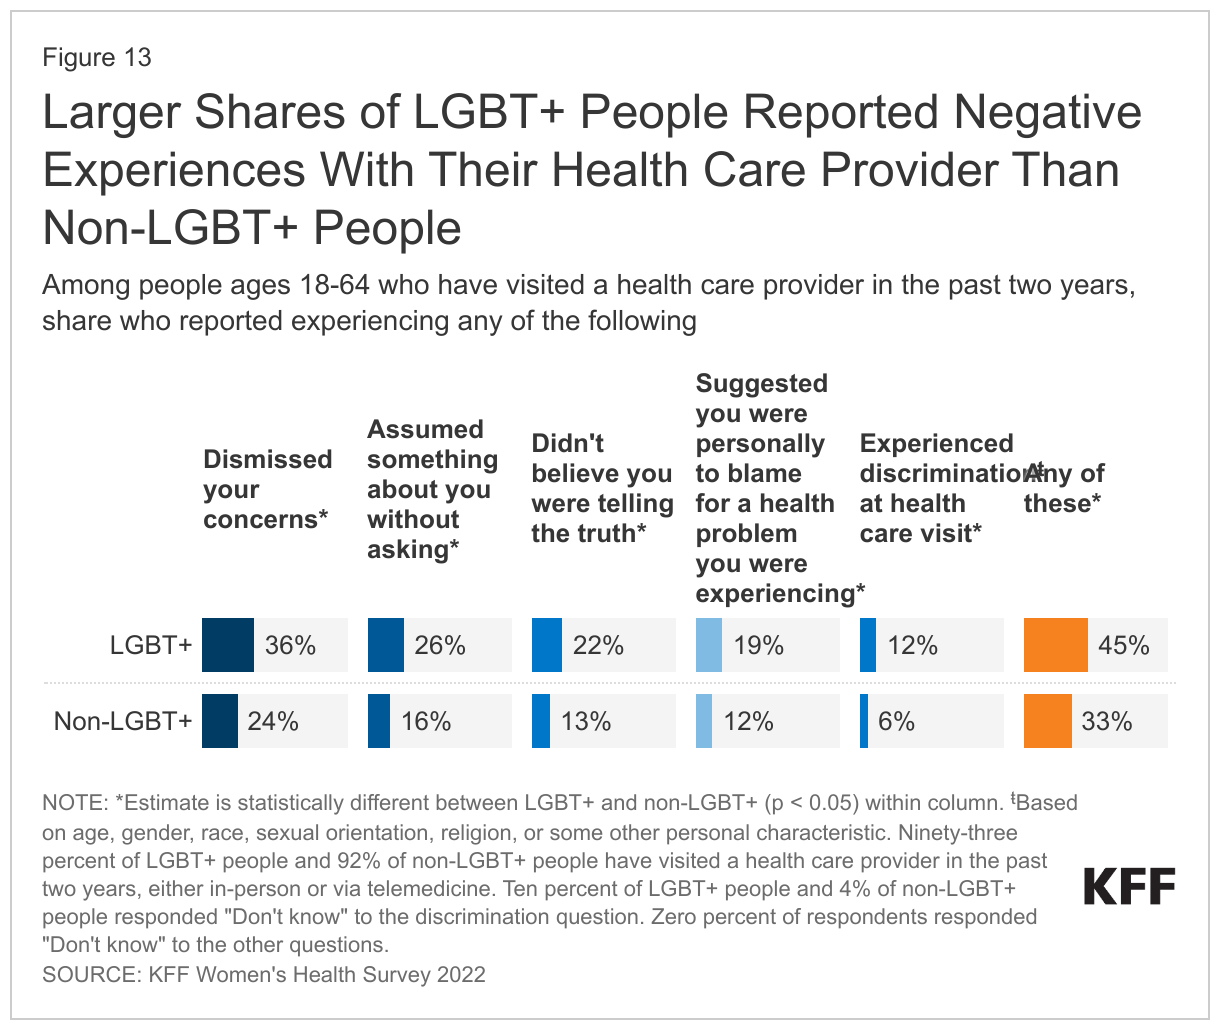
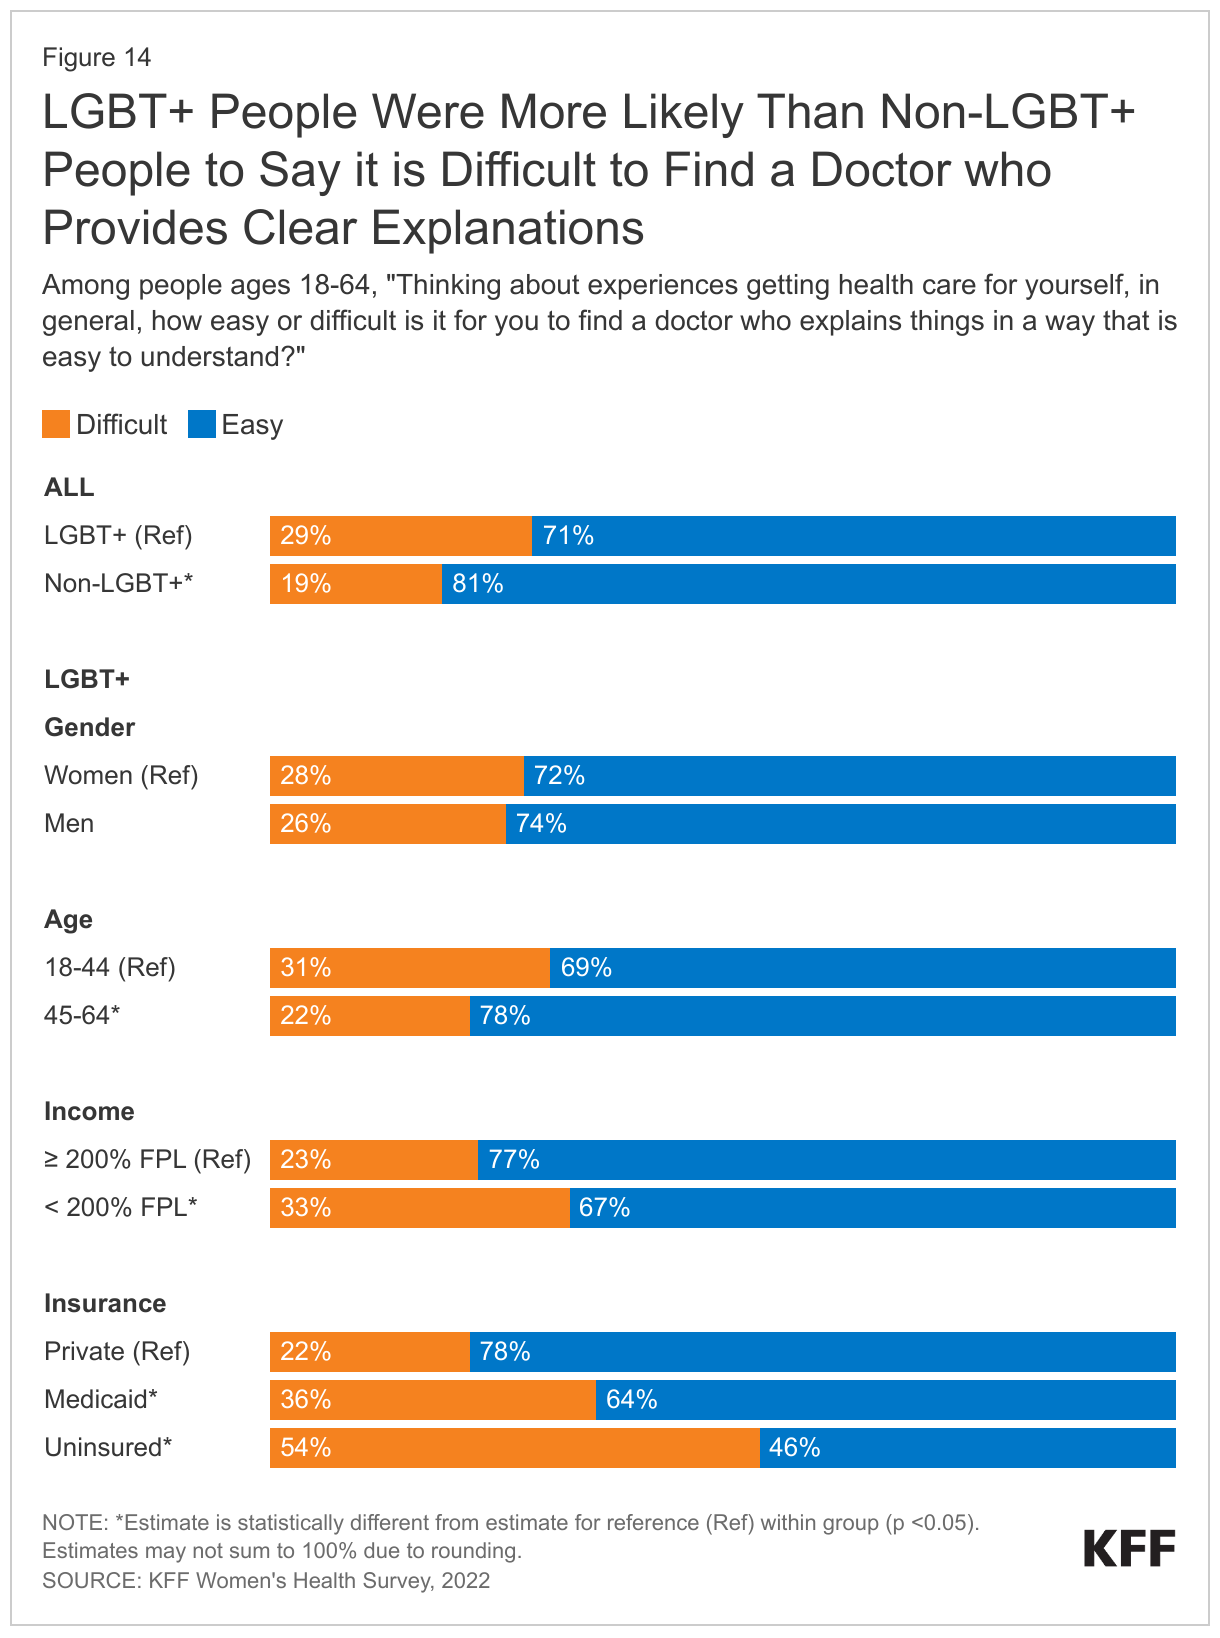
Beyond disparities in health coverage, people with LEP face other challenges and barriers to accessing high-quality health care. Studies have found that language barriers between providers and patients may result in decreased patient satisfaction with health care5 ; lack of comprehension of health care information, leading to increased adverse effects; 6 reduced medication adherence;7 excessive ordering of medical tests by providers;8 higher rates of medical errors;9 and decreased primary care utilization.10 ,11 ,12 Patients with LEP have longer hospital stays and are at higher risk of surgical delays and readmissions.13 Hispanic people with LEP report reduced access to care and fewer preventive services compared to English proficient Hispanic people.14 For Asian American people with LEP, language barriers are one of the most significant challenges to accessing care, particularly among older Asian Americans with LEP.15 A 2021 KFF survey found that, among Hispanic adults who completed the survey in Spanish, 35% said it is difficult to find a doctor who explains things in a way they can understand compared with 17% of those who completed the survey in English, and one-third (33%) said it was very or somewhat difficult to find a doctor who speaks their preferred language or provides an interpreter when needed. While LEP can be an independent contributor to inequities in health and health care, disparities based on race and ethnicity, citizenship status, and educational attainment and income levels may compound impacts.
Looking Ahead
Providing timely access to language assistance can help to address challenges LEP people face in accessing health coverage and care and improve the quality of care they receive. Language assistance includes oral interpretation, either in-person or remote via phone or video, and written translations.16 Research points to the importance of using qualified interpreters and translators, as the use of family members or untrained staff and machine translation tools can contribute to inaccuracies.17 ,18 ,19 ,20 Under Section 1557 of the ACA, state Medicaid agencies and health care providers must take reasonable steps to provide meaningful access to LEP individuals. The Trump Administration reduced some standards for providing meaningful access under Section 1557.21 However, the Biden Administration since proposed a rule that would restore the standards more closely to the original 2016 regulations.22 The National Standards for Culturally and Linguistically Appropriate Services (CLAS) in Health and Health Care provide action steps to guide organizations in implementing culturally and linguistically appropriate services.23 In October 2022, the Office of Minority Health announced more than $4 million in grants to develop and test methods of informing individuals with LEP about the availability of language access services in health care settings.24 HHS also convened its Language Access Steering Committee in October 2022, which is charged with implementing the language goals of the 2022 HHS Equity Action Plan and updating the 2013 HHS Language Access Plan.25
Although people with LEP have experienced large coverage gains since implementation of the ACA, they continue to face large disparities in coverage, which could grow as states unwind the Medicaid continuous enrollment provision. The Medicaid continuous enrollment provision, which had halted Medicaid disenrollments since March 2020, ended on March 31, 2023. As states unwind the continuous enrollment provision, they will redetermine eligibility for all Medicaid enrollees and disenroll those who are no longer eligible or who may remain eligible but are unable to complete the renewal process. Millions of people are expected to lose Medicaid coverage during this unwinding period, with disenrollments beginning in Spring and Summer 2023. Complex enrollment and renewal processes have historically been barriers to obtaining and maintaining Medicaid coverage. Enrollees with LEP are at particular risk for experiencing difficulties, as they may face added challenges understanding and completing tasks or forms due to language barriers, particularly if they are not provided translated materials.
Maintaining Medicaid coverage for people with LEP who remain eligible and facilitating smooth transitions to Marketplace or other coverage for those who are no longer eligible amid the unwinding of the Medicaid continuous enrollment provision can help to prevent widening of coverage disparities. In 2022, the Centers for Medicare and Medicaid Services (CMS) released guidance outlining specific steps states can take to maintain Medicaid coverage for people with LEP who remain eligible, including ensuring accessibility of forms and notices for people with LEP and reviewing communications strategies to ensure accessibility of information.26 In 2023, the Office of Civil Rights at HHS sent a letter to state Medicaid agencies reminding them of their obligations under federal civil rights laws to provide meaningful access for individuals with LEP and outlining best practices.27 These include adequately funding and staffing call centers to ensure they are accessible without prolonged delays, providing notices in the top 15 languages other than English spoken by people with LEP in the state, using plain language on forms and notices, informing individuals of the availability of free language assistance services, ensuring use of qualified interpreters and translators, and engaging with local communities and community- based organizations to provide outreach. Prior KFF analysis found significant variation in linguistic accessibility of state Medicaid websites and applications.
Navigators and other enrollment assistance programs can help Medicaid enrollees with LEP maintain or transition to other coverage. Marketplace consumer assistance programs conduct outreach and education and provide direct assistance to help people apply for and enroll in affordable coverage and renew existing coverage. This assistance is particularly important for people who may have increased difficulty navigating enrollment and renewal processes, such as people with LEP. A 2022 KFF survey of Assister programs found that nearly all reported helping at least some consumers who need language assistance. Community health centers can also play a role in supporting stable coverage among people with LEP. A 2021 KFF survey of health centers found that two-thirds (66%) of health centers were planning or taking actions to help their patients retain coverage during the unwinding of the Medicaid continuous enrollment provision.
- Office of Civil Rights. (2013, July 26). Guidance to Federal Financial Assistance Recipients Regarding Title VI Prohibition Against National Origin Discrimination Affecting Limited English Proficient Persons. United States Department of Health and Human Services. https://www.hhs.gov/civil-rights/for-individuals/special-topics/limited-english-proficiency/guidance-federal-financial-assistance-recipients-title-vi/index.html ↩︎
- Lu, Tianyi and Rebecca Meyerson. (2020). “Disparities in Health Insurance Coverage and Access to Care by English Language Proficiency in the USA, 2006–2016.” Journal of General Internal Medicine, 35(2), https://link.springer.com/article/10.1007/s11606-019-05609-z. ↩︎
- Proctor, Kimberly, Shondelle Wilson-Frederick and Samuel Haffer. (2018). “The Limited English Proficient Population: Describing Medicare, Medicaid, and Dual Beneficiaries.” Health Equity, 2(1), https://www.liebertpub.com/doi/10.1089/heq.2017.0036. ↩︎
- Wilson, Jill (2014). “Investing in English Skills: The Limited English Proficient Workforce in U.S. Metropolitan Areas,” Brookings Institution. https://www.brookings.edu/wp-content/uploads/2014/09/metro_20140924_investing_in_english_skils_report.pdf. ↩︎
- Shamsi, et al. (2020). “Implications of Language Barriers for Healthcare: A Systematic Review.” Oman Medical Journal, 35(2), doi: 10.5001/omj.2020.40. ↩︎
- Berdahl, Terceira and James B. Kirby (2019). “Patient-Provider Communication Disparities by Limited English Proficiency (LEP): Trends from the US Medical Expenditure Panel Survey, 2006–2015,” Journal of General Internal Medicine 34(8) https://doi.org/10.1001/jamahealthforum.2021.2724. ↩︎
- Kahler, Luke and Joseph LeMaster (2022). “Understanding Medication Adherence in Patients with Limited English Proficiency,” Kansas Medical Journal 15 doi: 10.17161/kjm.vol15.15912. ↩︎
- Silverberg, Melissa (2021). “Patients with Limited English More Likely To Be Referred For Imaging in EDs,” Radiological Society of North America Daily Bulletin, https://dailybulletin.rsna.org/db21/index.cfm?pg=21wed08. ↩︎
- “Limited English Proficiency and Health Care: How to Support Non-English Speakers,” George Washington University Milken Institute School of Public Health, https://onlinepublichealth.gwu.edu/resources/limited-english-proficiency-health-care-how-to-support/. ↩︎
- Berdahl, Terceira A. and James B. Kirby (2019). “Patient-Provider Communication Disparities by Limited English Proficiency (LEP): Trends from the US Medical Expenditure Panel Survey, 2006–2015,” Journal of General Internal Medicine 34(8) https://doi.org/10.1001/jamahealthforum.2021.2724. ↩︎
- Jang, Yuri and Miyong T. Kim (2018). “Limited English Proficiency and Health Service Use in Asian Americans,” Journal of Immigrant and Minority Health 21, https://doi.org/10.1007/s10903-018-0763-0. ↩︎
- Sifuentes, et al (2020). “The Role of Limited English Proficiency and Access to Health Insurance and Health Care in the Affordable Care Act Era,” Health Equity 4(1), https://doi.org/10.1089/heq.2020.0057 ↩︎
- U.S. Department of Health & Human Services., Agency for Healthcare Research & Quality, Executive Summary: Improving Patient Safety Systems for Patients with Limited English Proficiency (Sept. 2020), https://www.ahrq.gov/health-literacy/professional-training/lepguide/exec-summary.html#what. ↩︎
- Espinoza et al., “How Should Clinicians Respond to Language Barriers that Exacerbate Health Inequity?”, 23 a.m. Medical Association Journal of Ethics E109 (2021) (LEP patients and families in the U.S. “face barriers to health service access, experience lower quality care, and suffer worse health outcomes”), https://journalofethics.ama-assn.org/sites/journalofethics.ama-assn.org/files/2021-02/cscm3-2102.pdf. ↩︎
- Kim et al., “Barriers to Healthcare Among Asian Americans,” (2010). Social Work in Public Health 286, 289 (2010), https://doi.org/10.1080/19371910903240704. ↩︎
- U.S. Department of Health & Human Services., Centers for Medicare and Medicaid Services, Providing Language Services to Diverse Populations: Lessons from the Field (July 2022), https://www.cms.gov/About-CMS/Agency-Information/OMH/Downloads/Lessons-from-the-Field.pdf. ↩︎
- Espinoza et al., “How Should Clinicians Respond to Language Barriers that Exacerbate Health Inequity?”, 23 a.m. Medical Association Journal of Ethics E109 (2021) (LEP patients and families in the U.S. “face barriers to health service access, experience lower quality care, and suffer worse health outcomes”), https://journalofethics.ama-assn.org/sites/journalofethics.ama-assn.org/files/2021-02/cscm3-2102.pdf. ↩︎
- Dew et al., (2018). “Development of Machine Translation Technology for Assisting Health Communication: A Systematic Review,” Journal of Biomedical Informatics 85, https://doi.org/10.1016/j.jbi.2018.07.018 ↩︎
- Taira, et al. (2021). “A Pragmatic Assessment of Google Translate for Emergency Department Instructions.” Journal of General Internal Medicine, 36(11), 3361-3365. doi: 10.1007/s11606-021-06666-z. ↩︎
- Vieira et al., (2020). “Understanding the Societal Impacts of Machine Translation: A Critical Review of the Literature on Medical and Legal Use Cases.” Information, Communication and Society 24, https://www.tandfonline.com/doi/full/10.1080/1369118X.2020.1776370. ↩︎
- Nondiscrimination in Health and Health Education Programs or Activities, Delegation of Authority, 85 Fed. Reg. 37,160 (June 19, 2020) (to be codified at 42 CFR Parts 438, 440, and 460). ↩︎
- Ibid. ↩︎
- U.S. Department of Health & Human Services., Office of Minority Health, National Standards for Culturally and Linguistically Appropriate Services (CLAS) in Health and Health Care, https://thinkculturalhealth.hhs.gov/clas. ↩︎
- “HHS Takes Action to Break Language Barriers,” (October 6, 2022). U.S. Department of Health and Human Services. https://www.hhs.gov/about/news/2022/10/06/hhs-takes-action-break-language-barriers.html. ↩︎
- U.S. Department of Health & Human Services., Centers for Medicare and Medicaid Services, HHS Equity Action Plan (April 2022), https://www.hhs.gov/sites/default/files/hhs-equity-action-plan.pdf. ↩︎
- Centers for Medicare and Medicaid Services. (2022, March 3) Promoting Continuity of Coverage and Distributing Eligibility and Enrollment Workload in Medicaid, the Children’s Health Insurance Program (CHIP), and Basic Health Program (BHP) Upon Conclusion of the COVID-19 Public Health Emergency. https://www.medicaid.gov/federal-policy-guidance/downloads/sho22001.pdf. ↩︎
- Office of Civil Rights. (2023, April 4) Ensuring Language Access for Limited English Proficient (LEP) Individuals and Effective Communication for Individuals with Disabilities During the States’ Unwinding of the Medicaid Continuous Enrollment Condition. https://www.hhs.gov/sites/default/files/medicaid-unwinding-letter.pdf. ↩︎