Changes in Community Health Center Patients and Services During the COVID-19 Pandemic
Key Takeaways
Community health centers are a national network of safety-net primary care providers serving low-income and medically underserved communities, including communities of color and those in rural areas. Health centers also played a major role in national, state, and local responses to the coronavirus pandemic, particularly in hard-to-reach communities, and helped to meet growing demand for mental health and substance use disorder (SUD) services. Annual data reported by community health centers sheds light on how these safety-net providers and their patient populations have been impacted by the pandemic. Key findings from data reported for 2021 include:
- After dropping in 2020, the number of health center patients and visits rebounded in 2021. Health centers served more than 30 million patients in 2021, which was the largest number of patients ever recorded in a calendar year. As patients returned to in-person care in 2021, the increase in visits was supported by increased telehealth use compared to 2019—telehealth visits represented 21% of visits (26 million) in 2021 – compared to less than 1% of total visits in 2019.
- Medical, mental health, and SUD services exceeded pre-pandemic levels in 2021, while other services that were more difficult to provide virtually – such as dental and vision – were still below pre-pandemic utilization. Growth was particularly notable for mental health visits, which rose by 19% from 2019 to 2021.1 The increase in mental health and SUD services also followed a nationwide increase in demand for these services.
- The number of children served by health centers remained below pre-pandemic levels. From 2019 to 2021, the number of child patients decreased by 6% and the number of patients served at school-based health centers declined by 13%. Other research has shown decreased utilization among children during the pandemic, most commonly due to concerns about visiting a healthcare provider, limited appointment availability, and closed clinic locations. Overall, however, increases in nonelderly adult and senior health center patients more than offset the decline in child patients.
- Fewer health center patients were uninsured in 2021 compared to before the pandemic, reflecting national trends. The number of uninsured patients at health centers declined by 10% from 2019 to 2021.
As the nation looks beyond the pandemic, health centers and their patients face several uncertainties. Temporary policies put in place during pandemic that allowed greater telehealth access and ensured continuous enrollment in Medicaid as well as pandemic-related funding to providers are set to expire. At the same time, demand for health center services, particularly for mental health and SUD services, continues to increase. How health centers respond to these concurrent challenges will affect the ability of the nation’s primary care safety net to meet the needs of underserved communities.
Introduction
Community health centers are a national network of safety-net primary care providers serving low-income and medically underserved communities. Health centers served more than 30 million patients in 2021, including one-third of all people living in poverty in the U.S. and one in five rural residents. In addition to providing comprehensive primary care services, health centers have played a major role in national, state, and local responses to the coronavirus pandemic by offering a range of services designed to slow the spread and lessen the severity of COVID-19, especially in hard-to-reach, underserved communities. For example, health centers have administered over 22 million COVID-19 vaccinations2 as of December 2022, with 69% going to people of color.
Annual data reported by community health centers sheds light on how these safety-net providers and their patient populations have been impacted by the pandemic. Like other outpatient providers, health centers saw a dip in the number of patients and visits from 2019 to 2020. Given that health centers predominantly serve vulnerable and underserved populations, their experiences can provide valuable insights on how the pandemic has impacted these populations and how the nation’s primary care safety net is adapting to those needs.
This brief analyzes the changes in health center patients and services from 2019 (pre-pandemic) through 2021 using data from the Uniform Data System (UDS), to which all health centers are required to report annually. We also draw from previous national surveys of health centers to identify potential pitfalls for health centers as they begin recovering from the pandemic and going forward.
How have health center patients and services shifted during the pandemic?
Compared to before the pandemic, the number of health center patients and visits dipped in 2020 and began rebounding in 2021, with the increase in visits supported by increased telehealth use. Health centers served more than 30 million patients in 2021, which was the largest number of patients ever recorded in a calendar year and represented a 1.2% increase from 2019 (before the pandemic). Similarly, the number of health center visits reached a record 124 million in 2021 (Figure 1). Even as patients returned to in-person care, reliance on telehealth visits continued in 2021. Telehealth visits represented 21% of visits (26 million) in 2021 compared to less than 1% of total visits in 2019. While in-person visits increased relative to 2020, they remained below their pre-pandemic levels.

Medical and mental health services exceeded pre-pandemic levels in 2021, while other services that were more difficult to provide virtually – such as dental and vision – were still below pre-pandemic utilization. Some services, including medical, mental health, substance use disorder (SUD), and social supportive services, successfully shifted to telehealth to varying degrees, which more than offset the drops for in-person visits from 2019 to 2021 (Figure 2). Services that were largely provided in person, namely dental and vision, were still below the pre-pandemic baseline for visits in 2021 by 20% and 9%, respectively.
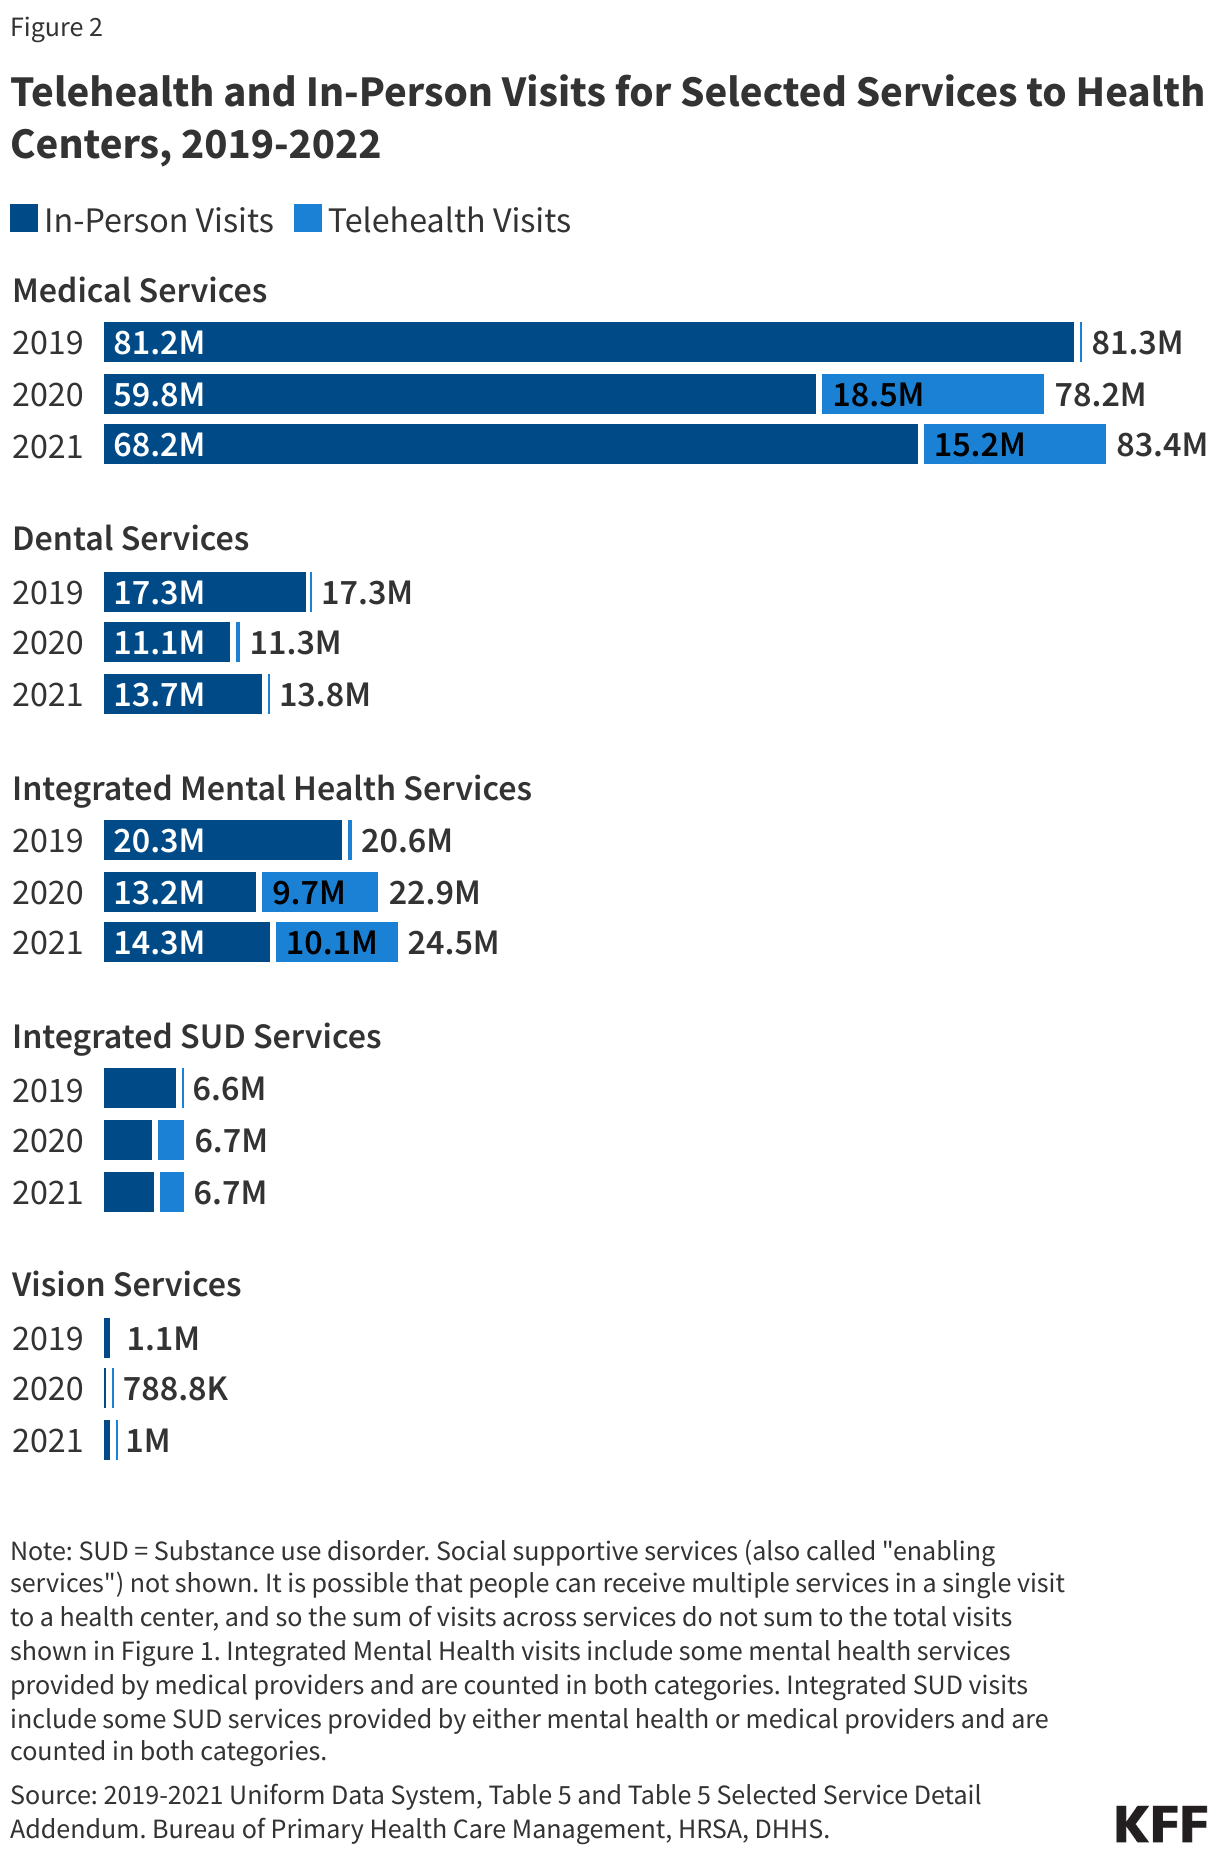
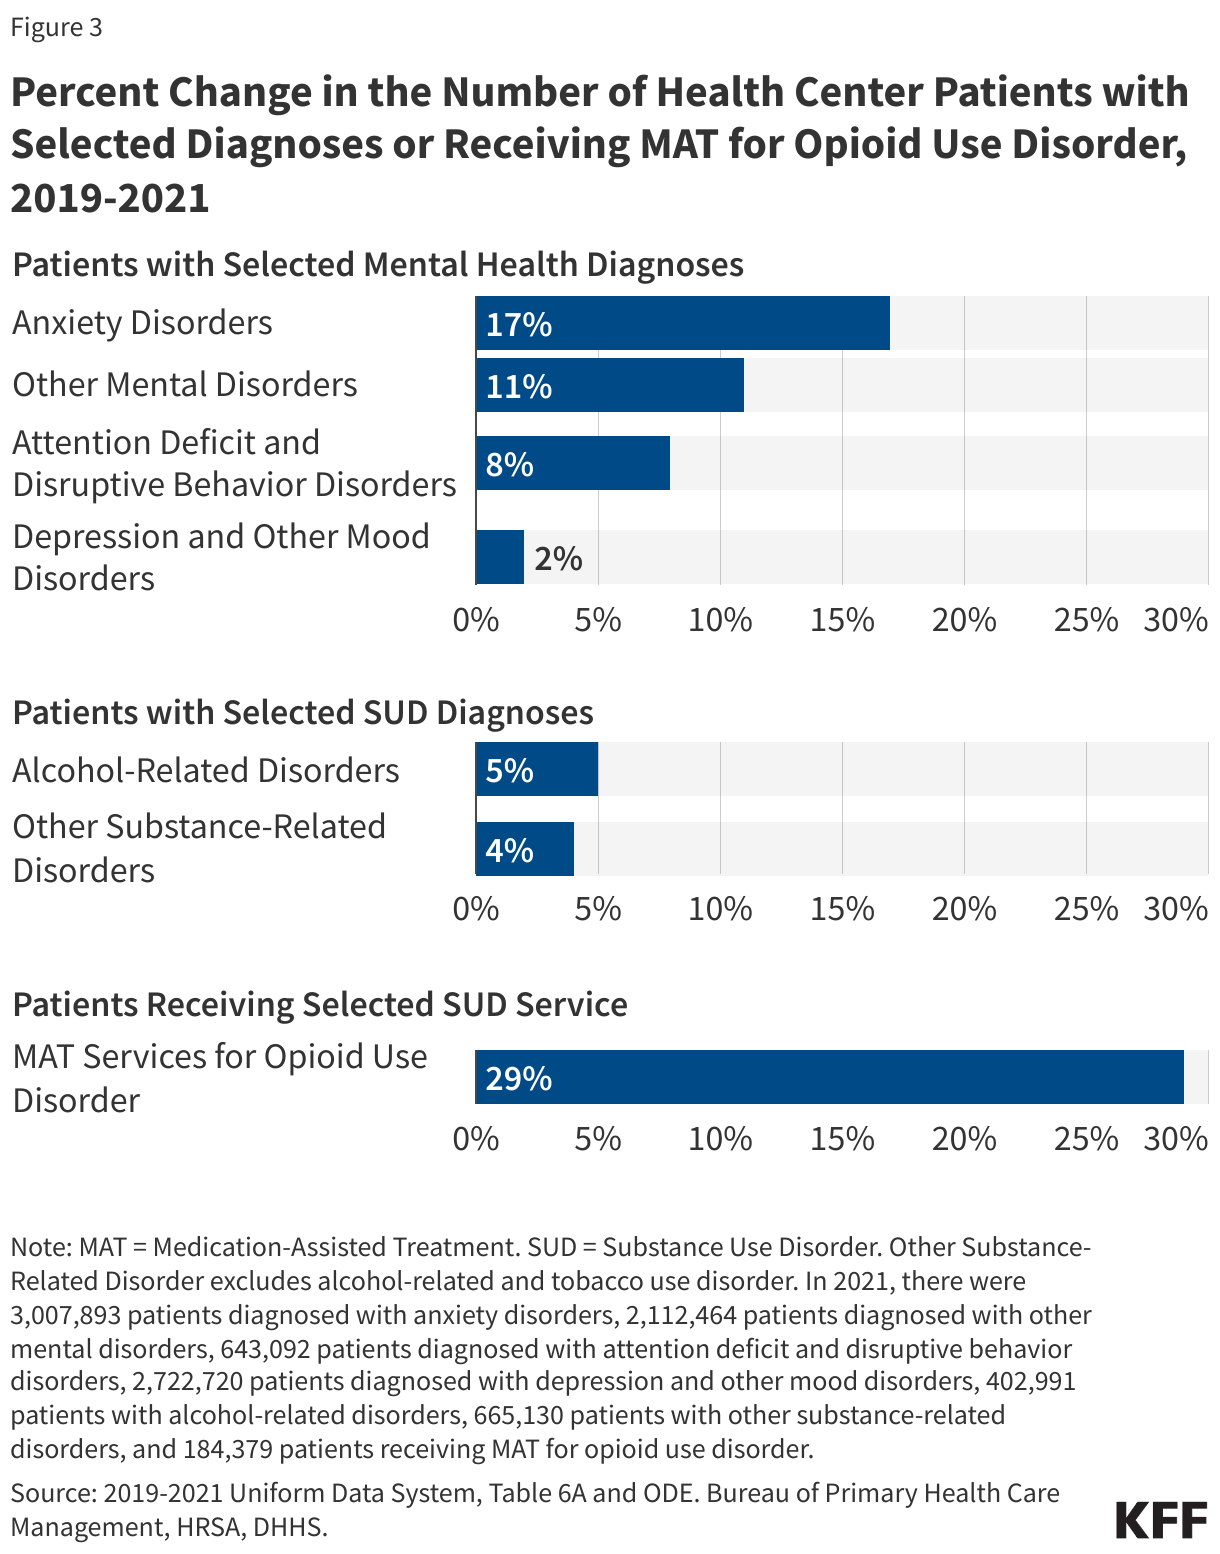
Health centers experienced increased demand for mental health and SUD services during the pandemic, mirroring national trends. Overall, the number of visits for mental health issues rose by 19% and visits for SUD services rose by 1% from 2019 to 2021.3 There was a particularly notable increase in the number of patients experiencing anxiety disorders; in 2021, three million patients, or 10% of all health center patients, had an anxiety disorder diagnosis, an increase of 17% from 2019. The number of patients receiving medication-assisted treatment (MAT) for opioid use disorder also increased substantially; in 2021, over 180,000 patients received MAT representing an increase 29% from pre-pandemic levels. In addition to growing demand during the pandemic, these increases also reflect growth in health centers’ capacity to provide mental health and SUD services. For example, a survey of health centers in late 2021 found that roughly two-thirds (64%) of health centers added a new mental health or SUD service, including services that health centers newly provided via telehealth.
At the same time, the number of children served by health centers remained below pre-pandemic levels. From 2019 to 2021, the number of child patients decreased by 6% (Figure 4) and the number of patients served at school-based health centers declined by 13%. This trend is consistent with recent research showing decreased health care utilization among children, most commonly due to concerns about visiting a healthcare provider, limited appointment availability, and closed clinic locations during the pandemic. Related to the drop in child patients, children accessed fewer preventive services at health centers in 2021 compared to 2019: the number of patients receiving selected immunizations4 dropped by 19%, the number receiving childhood lead screenings declined by 13%, and the number receiving a well child visit fell 5%. These findings are consistent with national data showing declines in lead screenings, child screenings, and vaccinations for Medicaid and Children’s Health Insurance Program (CHIP) enrollees during the pandemic. While the number of children served by health centers declined, the number of patients ages 65 and older increased by 425,000 or 15% and the number of non-elderly adults grew by 501,000 or 3% from 2019 to 2021.

Reflecting national trends, fewer health center patients were uninsured in 2021 compared to before the pandemic. The number of uninsured patients at health centers declined by 10% from 2019 to 2021 (Figure 5), consistent with national patterns. The drop in the national uninsured rate is largely attributable to temporary policies in place during the COVID-19 public health emergency to ensure continuous enrollment in Medicaid during the pandemic. As a result of the continuous enrollment policy, the number of Medicaid patients served by heath centers increased by 2% from 2019 to 2021, and Medicaid/CHIP remained the largest source of coverage for Health center patients. In 2021, nearly half (49%) of patients were covered by Medicaid/CHIP and 20% were uninsured.

Pandemic-related funding made up 7% of all health centers’ revenue in 2021, although Medicaid was the largest source of revenue (41%). In total, health centers received $2.8 billion in pandemic-related funding in 2021. This funding enabled health centers to respond to shifting patient needs, such as the growing need for telehealth and mental health services, and to continue building out pandemic-related services, such as vaccination drives and COVID-19 testing and treatments; however, these funding sources were temporary and have all since expired or will soon expire. For example, HRSA has distributed nearly all of the $7.6 billion provided to health centers in the American Rescue Plan Act (ARPA) in 2021 – the largest source of pandemic-related funding for health centers – with the remaining funds available to health centers through March 2023.5 While the temporary funding has been important to health centers during the pandemic, Medicaid, along with federal Section 330 grant funding, remains their primary source of funding.

What to Watch
Changes in who sought care at health centers, how they accessed care, and the services that they received in 2021 could represent longer-term shifts with implications for health center finances and operations. The number of children served by health centers declined and, while the number of nonelderly adult and senior patients increased to fill in the gap, the health care needs of these patient populations differ. At the same time, demand for health center services, particularly for mental health and SUD services, continued to increase. Additionally, changes that accelerated the use of telehealth during the pandemic could also reflect a more permanent shift in how health center patients access services. Although telehealth has become an important mechanism for delivering certain health center services, it is unclear whether the reliance on telehealth will continue in the absence of pandemic-era flexibilities that made it easier for health centers and other providers to offer telehealth services. Given that nearly half of health center patients are covered by Medicaid, state Medicaid agencies’ decisions about whether or how to phase out these policies will have an especially large impact on health centers and their patients.
The end of the Medicaid continuous enrollment requirement and pandemic-related funding for providers could also have major implications for health centers and their patients. In the months following the end of the continuous enrollment requirement, millions of people could lose Medicaid coverage. These Medicaid coverage losses could reverse the recent decline in the number of uninsured health center patients. Moreover, because Medicaid accounts for 41% of total health center revenue, any significant loss of Medicaid coverage among health center patients could substantially reduce overall health center revenue. These changes will coincide with the end of pandemic funding streams and could pose challenges for health centers, especially those lacking strong financial footing. How health centers respond to these concurrent challenges will affect the ability of the nation’s primary care safety net to continue to meet the needs of underserved communities.
Funding support for this brief was provided to the George Washington University by the RCHN Community Health Foundation. KFF maintains full editorial control over all of its policy analysis, polling, and journalism activities.
- For this analysis, we use the Selected Service Detail Addendum tables in UDS to define integrated mental health and SUD visits. Using this definition, mental health visits include those provided by mental health providers as well as mental health services provided by medical providers. Visits in the latter group are reported as both medical visits in Table 5 of UDS and mental health visits in the UDS’s Selected Service Detail Addendum tables. Similarly, SUD visits include visits provided by SUD providers and SUD services provided by either mental health or medical providers. Visits in the latter group are counted as either medical or mental health visits in Table 5 of UDS as well as SUD visits in the Selected Service Detail Addendum tables. ↩︎
- Health centers report the number of vaccinations received by health center patients in the HRSA Health Center COVID-19 Survey. The survey’s questionnaire asks health centers to report the total number of patients receiving a vaccine, and HRSA has clarified that this count includes health center patients receiving vaccinations anywhere, including in settings other than the health center. However, we expect that health centers delivered the vast majority of vaccinations reported in the survey, and the number of patients reported through the survey receiving their vaccinations elsewhere is likely minimal. ↩︎
- For this analysis, we use the Selected Service Detail Addendum tables in UDS to define integrated mental health and SUD visits. Using this definition, mental health visits include those provided by mental health providers as well as mental health services provided by medical providers. Visits in the latter group are reported as both medical visits in Table 5 of UDS and mental health visits in the UDS’s Selected Service Detail Addendum tables. Similarly, SUD visits include visits provided by SUD providers and SUD services provided by either mental health or medical providers. Visits in the latter group are counted as either medical or mental health visits in Table 5 of UDS as well as SUD visits in the Selected Service Detail Addendum tables. ↩︎
- The UDS data on selected immunizations aggregates several immunizations for patients of all ages, though most are provided to children. These immunizations are taken from Table 6A Line 24 of UDS: Selected immunizations: hepatitis A; haemophilus influenzae B (HiB); pneumococcal, diphtheria, tetanus, pertussis (DTaP) (DTP) (DT); measles, mumps, rubella (MMR); poliovirus; varicella; hepatitis B ↩︎
- Based on email exchange with staff from the Bureau of Primary Health Care, HRSA, DHHS (September 30, 2022). ↩︎