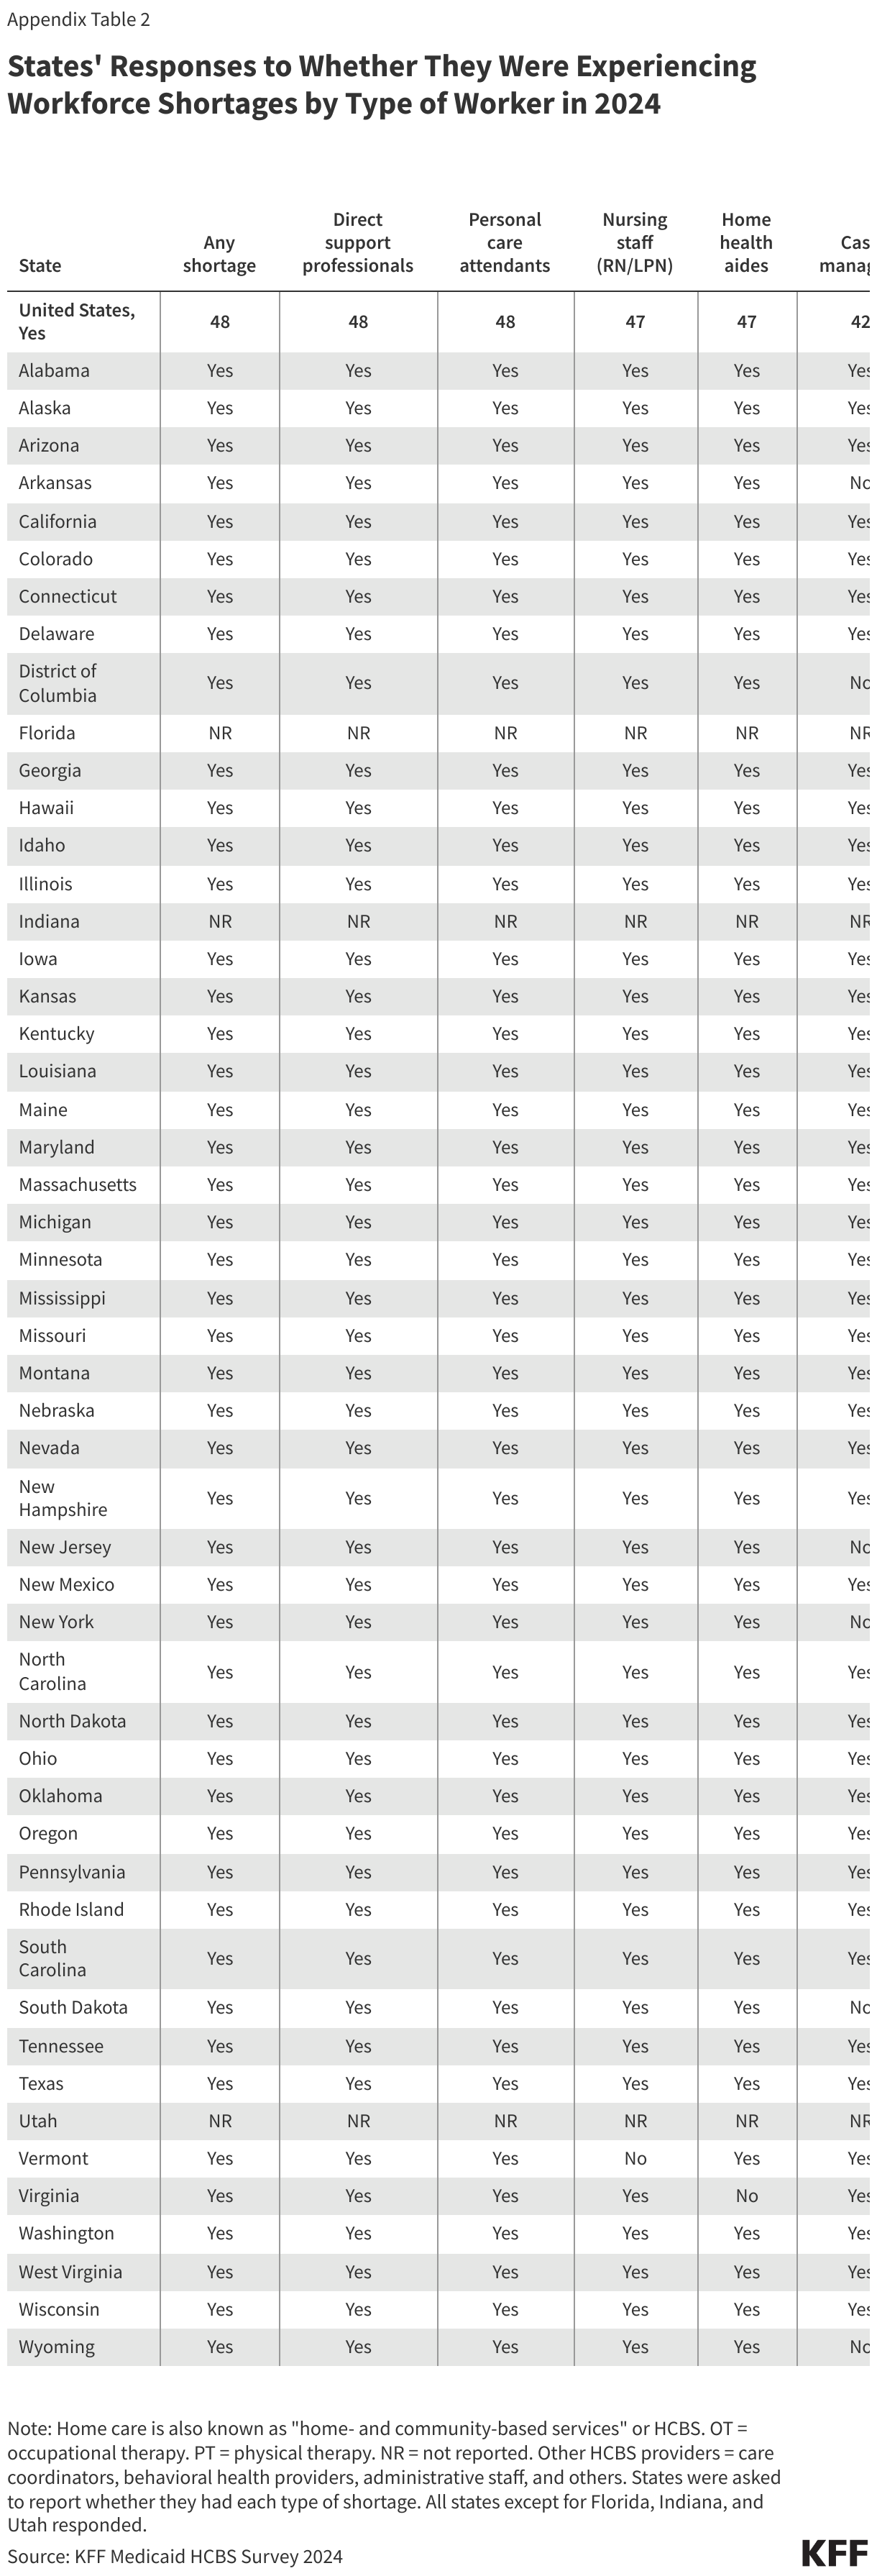
5 Key Facts About Immigrants and Medicaid

Published: Feb 19, 2025

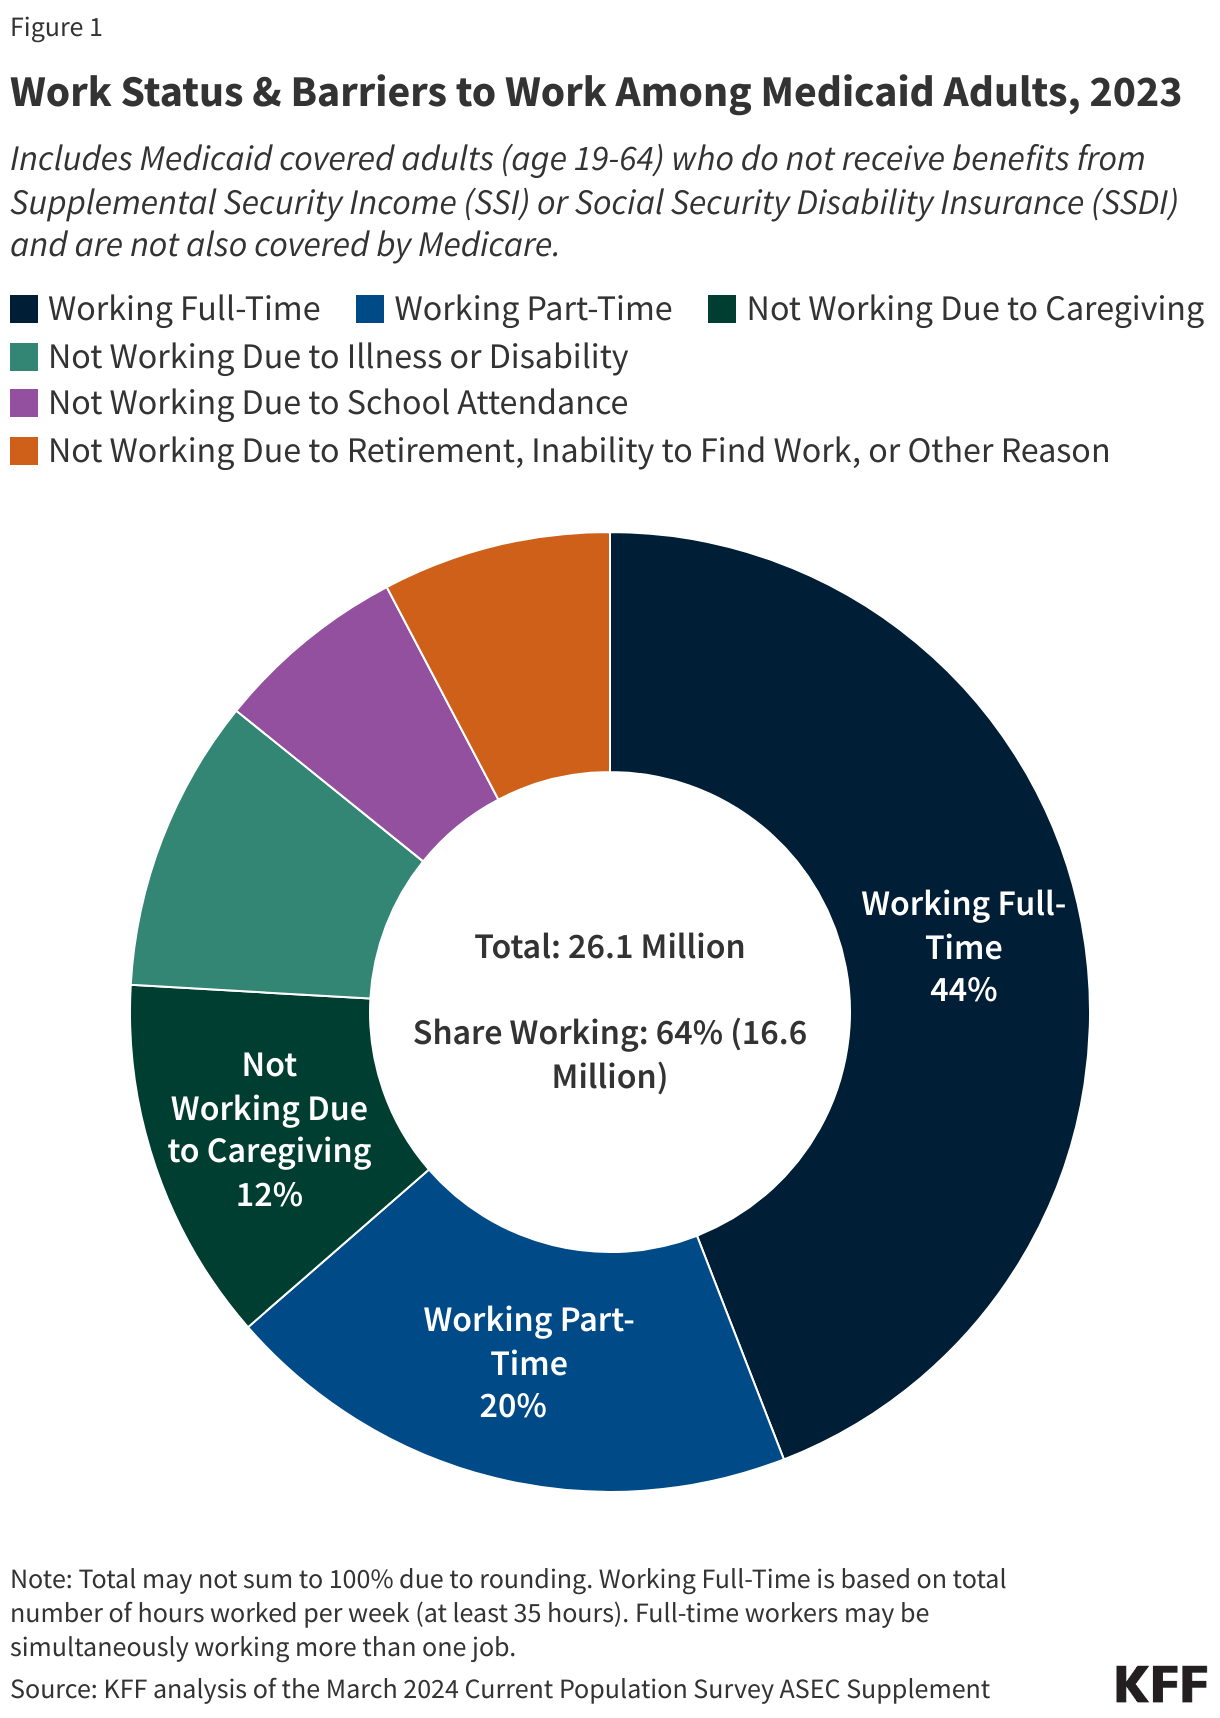
Confusion persists about immigrants’ eligibility for federal programs, with about half or more of U.S. adults and immigrants adults saying they are unsure or incorrectly believe that most immigrants to the U.S. are eligible to enroll in federal health insurance programs, including Medicaid, as soon as they arrive to the U.S. Eligibility for Medicaid and the Children’s Health Insurance Program (CHIP) is limited to citizens and certain lawfully present immigrants. Many citizens and lawfully present immigrants live in families with mixed immigration status, which may include undocumented immigrants. For example, 19 million or one in four children in the U.S. has an immigrant parent, including one in ten (12%) or 9 million who are citizen children with a noncitizen parent. Although most immigrant families have a full-time worker in the household, they tend to have lower incomes. As such, Medicaid and CHIP help keep uninsured rates for children in these families low and provide an affordable coverage option to eligible lawfully present immigrants. Despite having lower incomes, among those under age 65,  immigrants are less likely than U.S.-born citizens to have Medicaid or CHIP coverage (19% vs. 23%) and eligible noncitizen immigrants account for just 6% of Medicaid and CHIP enrollees.

The Congress is considering options to reduce federal Medicaid spending in order to offset the cost of tax cuts, including reinstating changes made to public charge immigration rules that were made under the first Trump administration and reducing federal funding for states that use state-only funds to expand coverage for immigrants. Proposals also suggest restricting eligibility for federal health programs to lawfully present immigrants, although this restriction is already in place. At the same time, the Trump administration has implemented an array of restrictive immigration policies that will likely increase fears among immigrant families about lawfully present immigrants and citizens accessing health coverage for which they are eligible. These changes may lead to disenrollment and coverage losses among lawfully present immigrants and citizens in immigrant families, which could have negative short and long-term effects on their health and reduce their productivity. The savings achieved from such changes are likely to be modest given that noncitizens account for a small share of Medicaid and CHIP enrollees. This brief provides five key facts on Medicaid and immigrants as context for understanding the potential impacts of the changes under consideration.

1. Undocumented immigrants are not eligible for Medicaid or CHIP, and only some lawfully present immigrants qualify subject to eligibility restrictions.

Undocumented immigrants are not eligible to enroll in federally funded coverage including Medicaid, CHIP, or Medicare or to purchase coverage through the ACA Marketplaces. Emergency Medicaid spending reimburses hospitals for emergency care they are obligated to provide to individuals who meet other Medicaid eligibility requirements (such as income) but who do not have an eligible immigration status, including undocumented immigrants and lawfully present immigrants who remain ineligible for Medicaid or CHIP.

Lawfully present immigrants may qualify for Medicaid or CHIP but are subject to eligibility restrictions. In general, in addition to meeting other eligibility requirements, lawfully present immigrants must have a “qualified” immigration status to be eligible for Medicaid or CHIP (Table 1), and many, including most lawful permanent residents or “green card” holders, must wait five years after obtaining qualified status before they may enroll. They may enroll in Marketplace coverage and receive subsidies during this five-year waiting period. Some immigrants with qualified status, such as refugees and asylees, as well as citizens of Compact of Free Association (COFA) nations, do not have to wait five years before enrolling. Some immigrants, such as those with temporary protected status, are lawfully present but do not have a qualified status and are not eligible to enroll regardless of their length of time in the country. Individuals with Deferred Action for Childhood Arrivals (DACA) status are not eligible for Medicaid or CHIP, and implementation of a Marketplace coverage expansion for them remains subject to ongoing litigation. States must verify citizenship and immigration status with the Social Security Administration and Department of Homeland Security to determine eligibility for coverage.

"Qualified" Immigration Statuses that Are Eligible for Medicaid/CHIP

2. Despite having lower household incomes, immigrants under age 65 are less likely to be covered by Medicaid than their U.S.-born citizen counterparts.

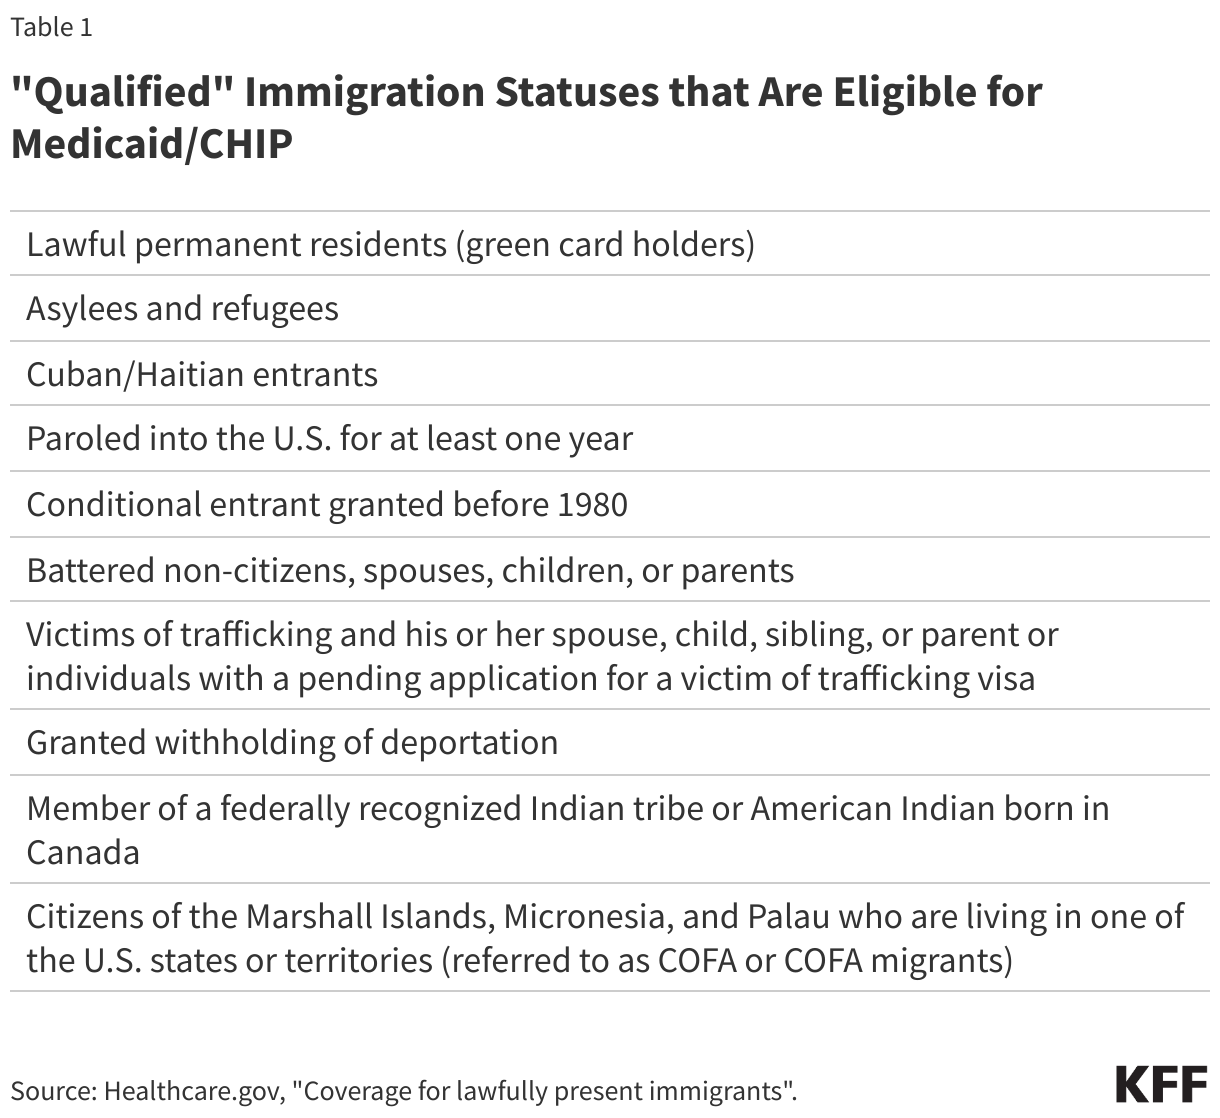
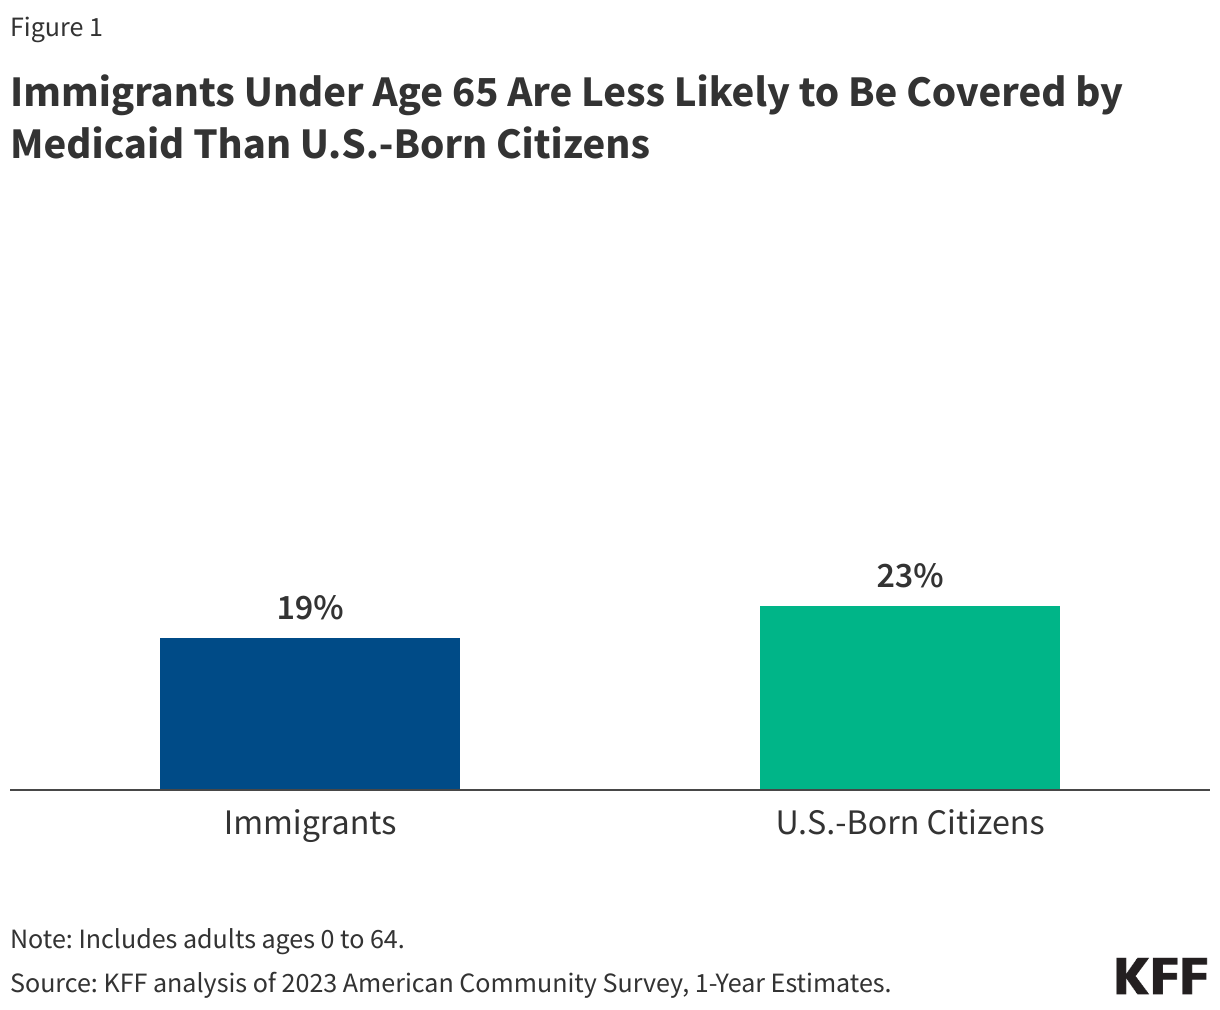
In 2023, 19% of immigrants under age 65 were covered by Medicaid compared to 23% of U.S.-born citizens (Figure 1). Eligible noncitizen immigrants represent a small share of people covered by Medicaid, comprising just 6% of individuals under age 65 with Medicaid. Immigrants are also not more likely than U.S.-born citizens to receive assistance with food or housing. Data from the 2023 KFF/LA Times Survey of Immigrants show that, overall, about a quarter (28%) of both immigrant adults and U.S.-born citizen adults say they received assistance with food, housing, or health care in the past 12 months.

Immigrants Under Age 65 Are Less Likely to Be Covered by Medicaid Than U.S. Citizens

Many families face barriers to enrolling eligible lawfully present immigrants and citizen children in assistance programs due to fear, confusion about eligibility policies, difficulty navigating the enrollment process, and language access challenges. Restrictive immigration policies, including increases in enforcement actions, being implemented by the Trump administration will likely increase fears of enrolling in coverage and accessing health care. Even prior to the Trump administration, in 2023, nearly one in ten (8%) immigrants said they avoided applying for food, housing, or health care assistance in the past year because they didn’t want to draw attention to their immigration status or the status of someone in their family.

3. Emergency Medicaid spending makes up less than 1% of total Medicaid spending.

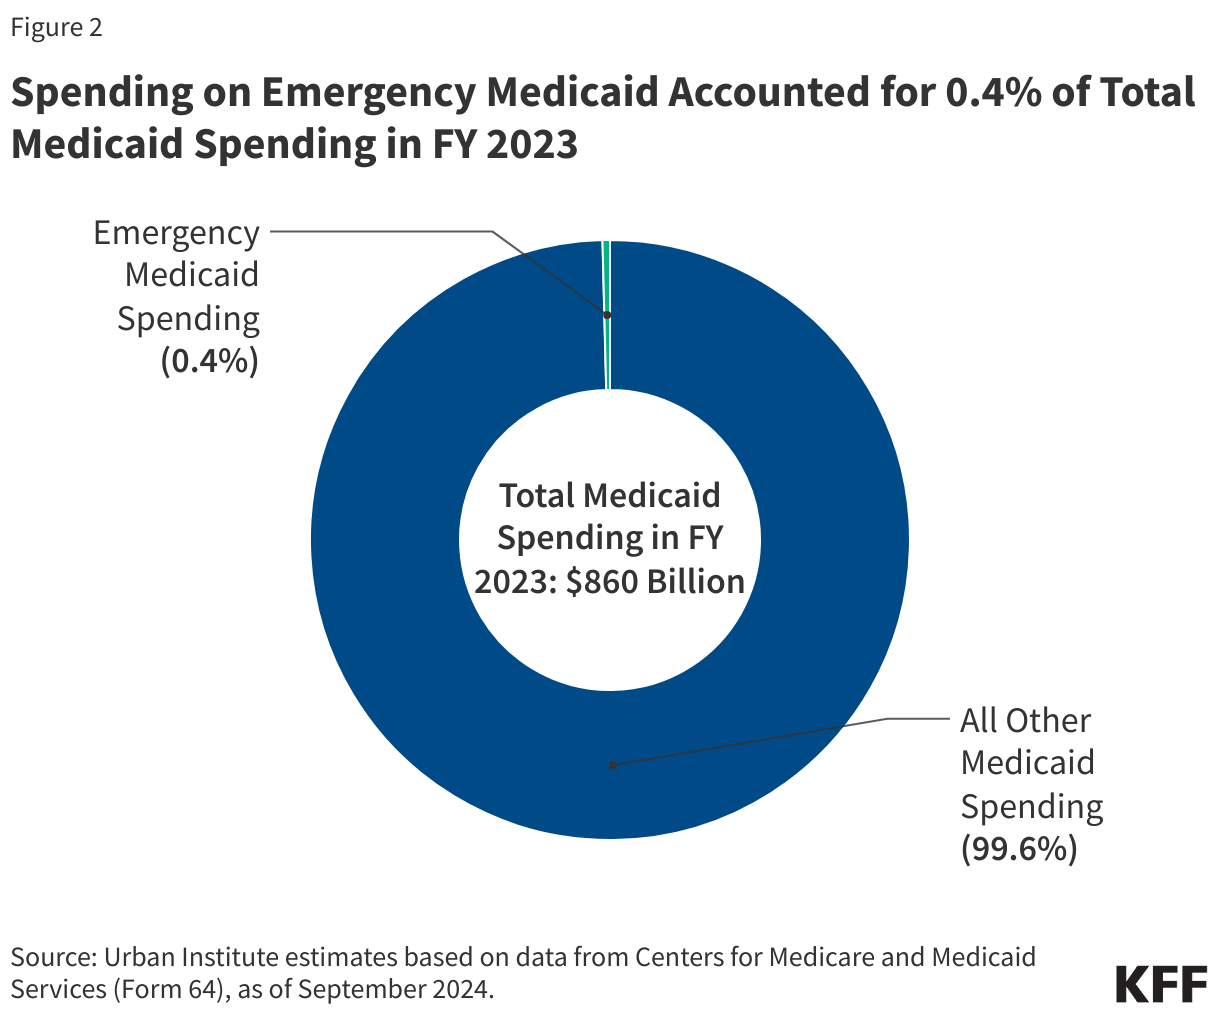
Emergency Medicaid spending represented less than 1% of overall Medicaid spending between fiscal years 2017 and 2023. Spending on Emergency Medicaid was $3.8 billion in FY 2023 and was 0.4% of total Medicaid spending that year (Figure 2). Emergency Medicaid spending reimburses hospitals for emergency care they are obligated to provide to individuals who meet other Medicaid eligibility requirements (such as income) but who do not have an eligible immigration status. These include lawfully present immigrants who are subject to a five-year waiting period for Medicaid or who remain ineligible for Medicaid and undocumented immigrants. Emergency services include those requiring immediate attention to prevent death, serious harm or disability, although states have some discretion to determine reimbursable services. Much of Emergency Medicaid spending goes toward labor and delivery costs. Without Emergency Medicaid, the costs of care would be shifted to hospitals that are required to treat individuals in emergency situations or fully to states.

Spending on Emergency Medicaid Accounted for 0.4% of Total Medicaid Spending in FY 2023

4. States have expanded Medicaid coverage for lawfully present immigrant children and pregnant people, and some have fully state-funded coverage for immigrants.

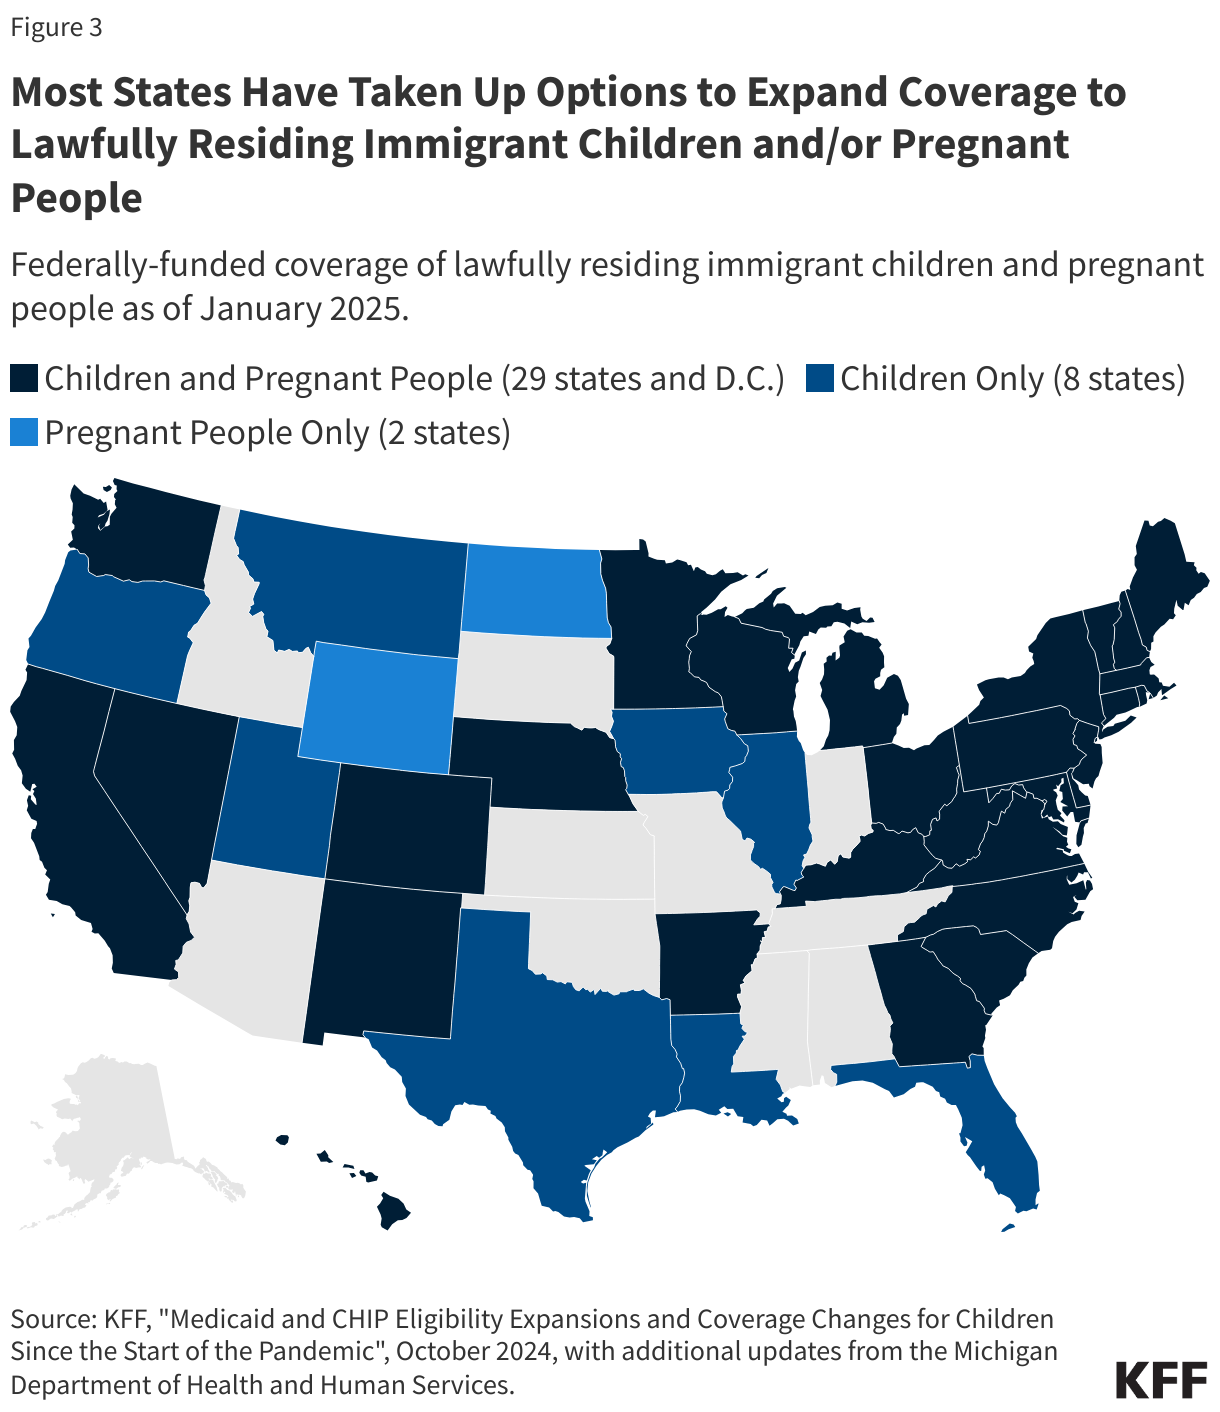
For children and pregnant people, states can eliminate the five-year waiting period for Medicaid and CHIP coverage. As of January 2025, 37 states plus D.C. have taken up this option for children, and 31 states plus D.C. have elected the option for pregnant individuals (Figure 3). Additionally, 23 states plus D.C. provide prenatal care and pregnancy-related benefits to low-income children beginning from conception to end-of-pregnancy regardless of their parent’s citizenship or immigration status under the CHIP From-Conception-to-End-of-Pregnancy option. Some states have fully state-funded health coverage programs for immigrants regardless of status, particularly children. Research suggests that state coverage expansions for immigrants lead to increases in coverage and improvements in health care access and use.

Most States Have Taken Up Options to Expand Coverage to Lawfully Residing Immigrant Children and/or Pregnant People

5. Immigrants use less health care and have lower health care costs than people born in the U.S.

Research shows that immigrants use less health care and have lower health care costs than U.S.-born citizens. Lower use of health care among immigrants likely reflects a combination of them being younger and healthier than their U.S.-born counterparts as well as them facing increased barriers to care, including language access challenges, confusion, and immigration-related fears. Prior KFF analysis found that Trump-era policies amplified these fears and contributed to greater reluctance to access care. Reflecting their lower use of health care, immigrants have lower health care expenditures than their U.S.-born counterparts. Consistent with other research, KFF analysis of 2021 medical expenditure data shows that, on average, annual per capita health care expenditures for immigrants are about two-thirds those of U.S.-born citizens ($4,875 vs. $7,277), with no significant difference in the average amount paid by Medicaid for immigrants ($854) and U.S.-born people ($830). Given the Medicaid eligibility restrictions for immigrants, it is likely that a greater share of Medicaid spending for immigrants goes toward pregnancy-related care and emergency care, which tend to be costly. In contrast, U.S.-born enrollees include a high share of children, who typically utilize lower cost care.

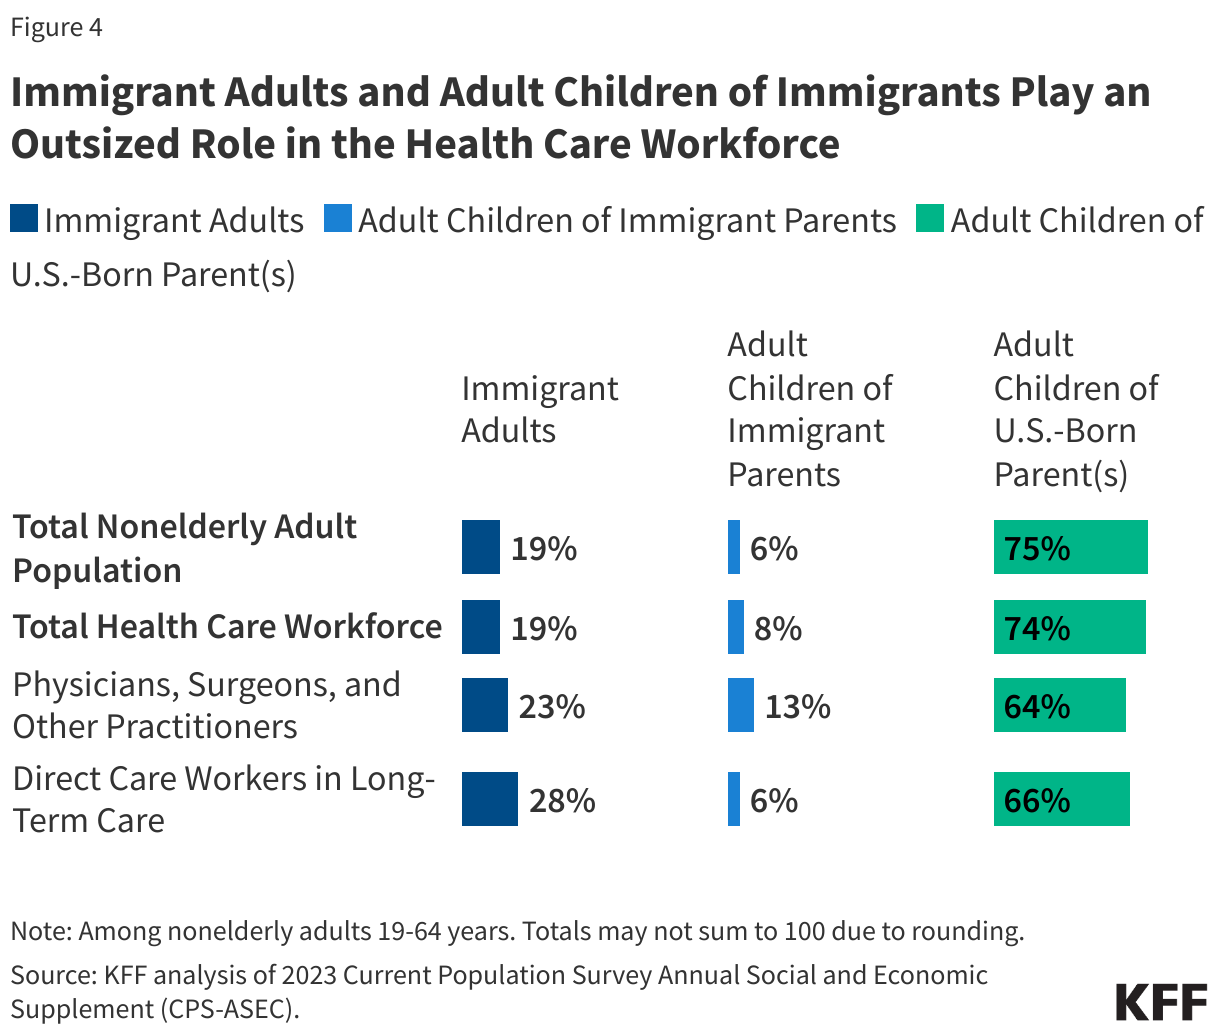
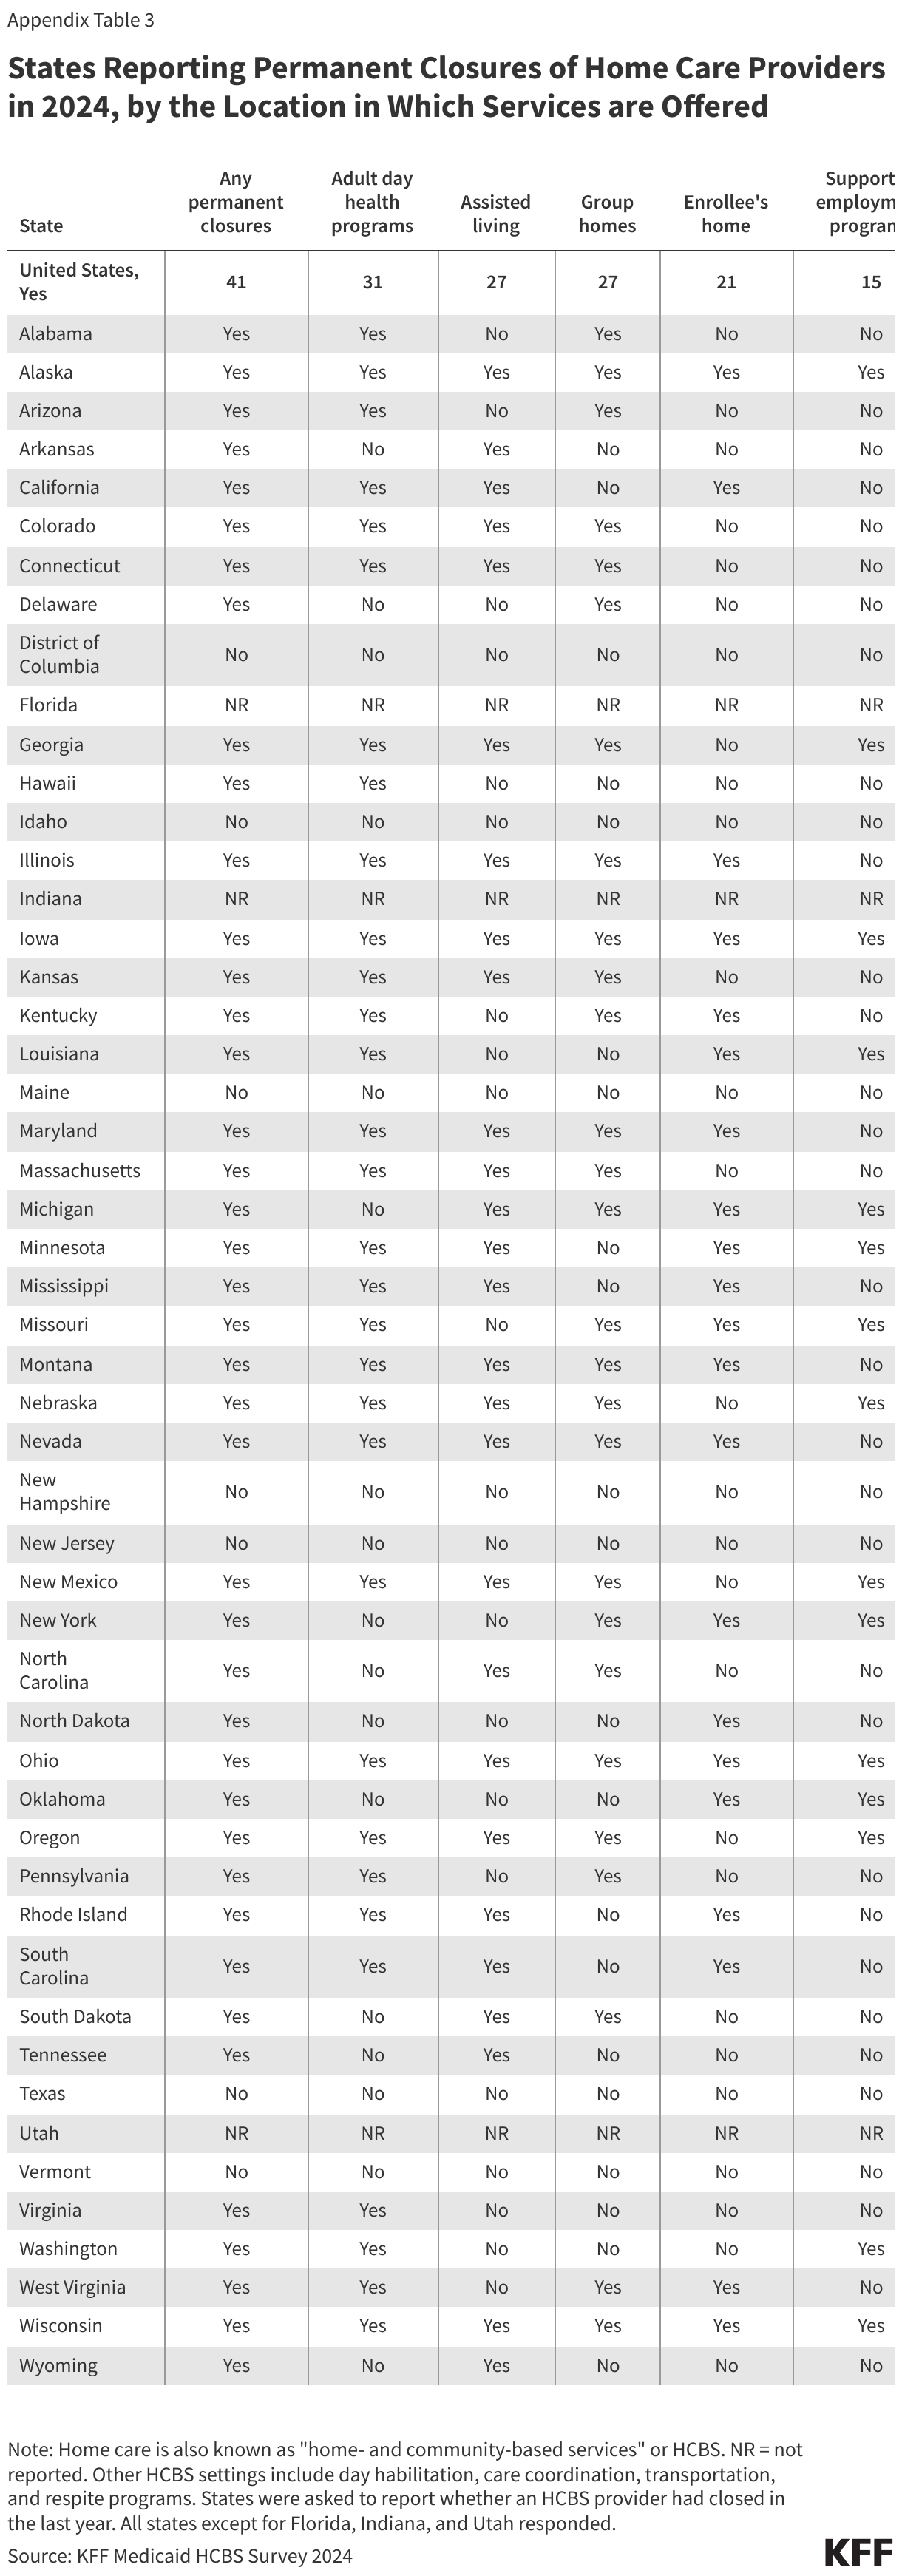
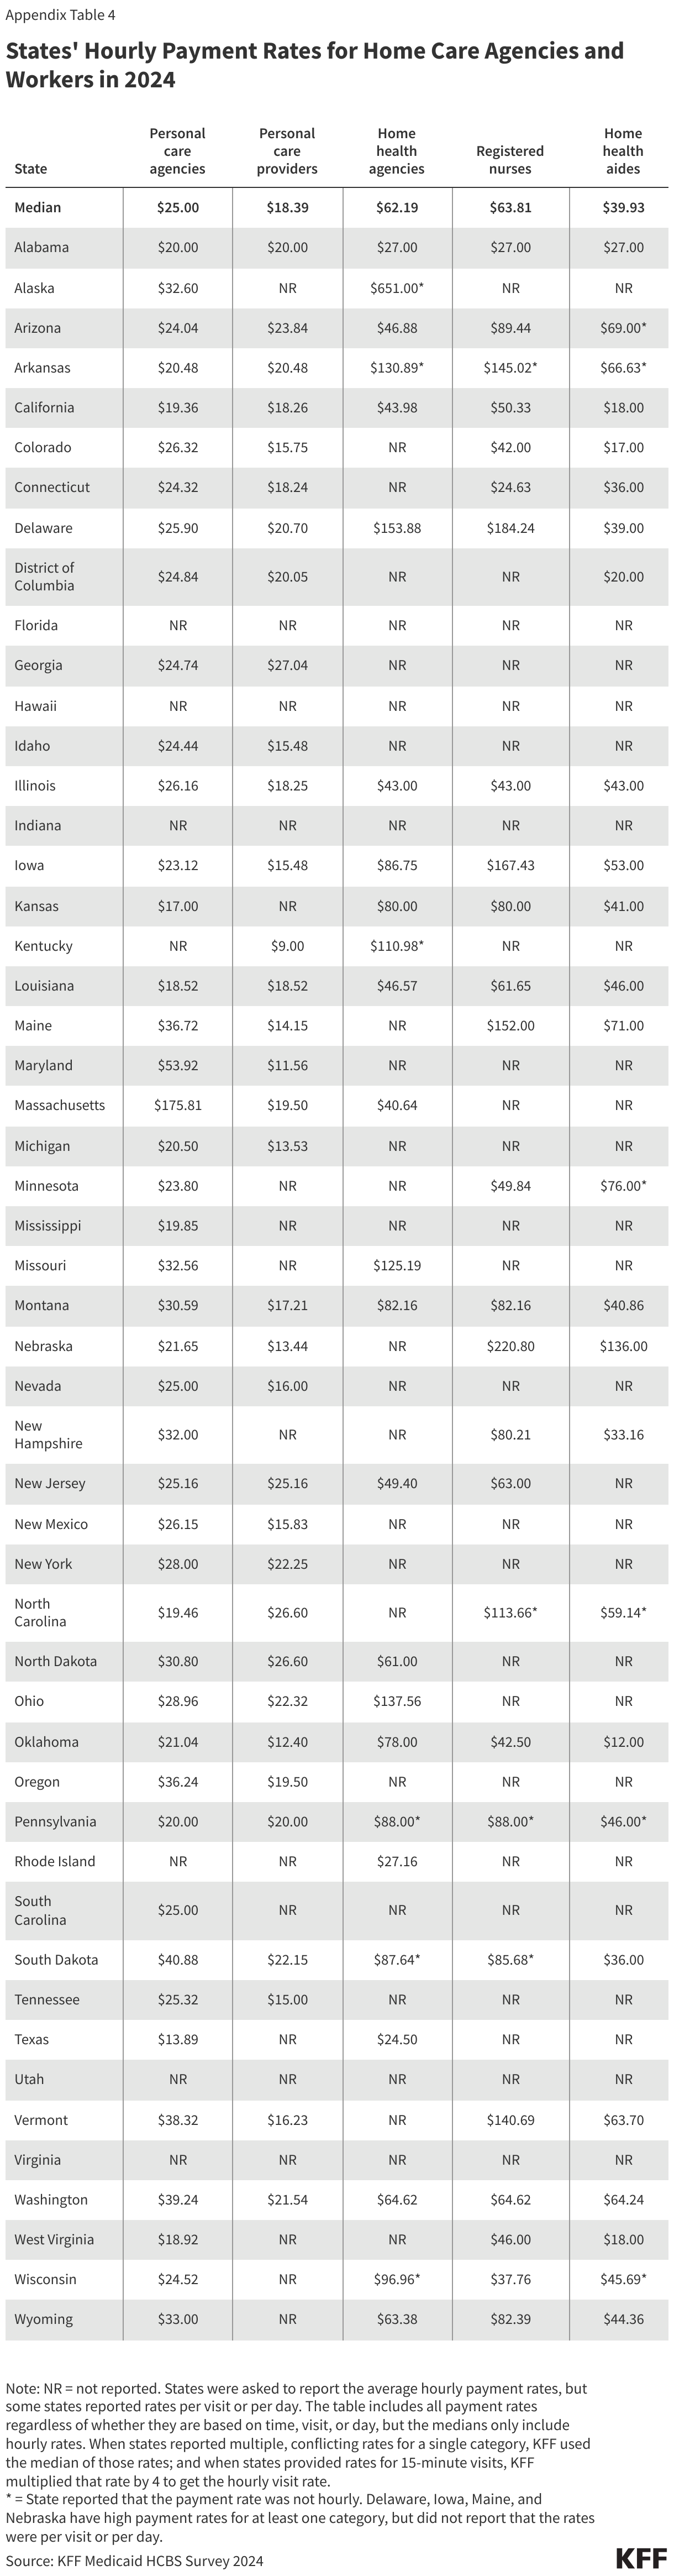
Immigrants contribute to the economy through their role in the workforce and tax payments, with research showing that they help subsidize health care for U.S.- born people and stabilize Medicare and Social Security. Immigrants support the nation’s workforce by filling unmet labor market needs, and research suggests that they do not take jobs away from U.S.-born people. They play a disproportionate role filling jobs in essential industries such as construction and agriculture. In addition, immigrants as well as the adult children of immigrants play outsized roles in the health care workforce as physicians, surgeons, nurses, and long-term care workers (Figure 4). They also play a particularly large role as direct care workers in home and community-based settings. As health care workforce shortages are projected to continue and the U.S. 65 and older population grows, immigrants could help mitigate these shortages. Analysis also shows that undocumented immigrants contribute billions in federal, state, and local taxes each year, and research shows that they pay more into the health care system through taxes and health insurance premiums than they utilize, helping to subsidize health care for U.S.-born citizens.

Immigrant Adults and Adult Children of Immigrants Play an Outsized Role in the Health Care Workforce

What is Medicaid Home Care (HCBS)?

Authors: Maiss Mohamed, Alice Burns, and Molly O’Malley Watts
Published: Feb 18, 2025

Issue Brief

Many older adults and people with disabilities require assistance with self-care such as bathing, dressing, and eating. Help with such services is known as “long-term care” and may be provided in institutional settings such as nursing facilities or in people’s homes and the community, including assisted living facilities. Four in ten adults incorrectly believe that Medicare is the primary source of coverage for low-income people who need nursing or home care, but Medicaid is the primary payer—covering two-thirds of all home care spending in the United States in 2022. With House Republicans considering $2.3 trillion in Medicaid cuts over 10 years—a nearly one-third reduction in Medicaid spending—the availability of home care could be affected in future years. This issue brief provides an overview of what Medicaid home care (also known as “home- and community-based services” or HCBS) is, who is covered, and what services were available in 2024. About 4.5 million people receive Medicaid covered home care services annually.

This brief is one of several describing data from the 22nd KFF survey of officials administering Medicaid home care programs in all 50 states and the District of Columbia (hereafter referred to as a state), which states completed between April and October 2024. Other issue briefs from the survey describe the number of people on waiting lists for home care, how home care programs support family caregivers, payment rates for home care providers, and how Medicaid covers people in assisted living facilities. The survey was sent to each state official responsible for overseeing home care benefits (including home health, personal care, and waiver services for specific populations such as people with physical disabilities). All states except Florida, Indiana, and Utah responded to the 2024 survey, but response rates for certain questions were lower. Where possible, KFF supplemented survey data with previously reported or publicly available data to provide information for the states that did not respond. Key takeaways include:

  • Nursing facility care is a required Medicaid benefit, but states can choose whether or not to provide most home care services. A key component of home care is personal care, which helps people who need assistance with self-care (such as bathing and dressing) and household activities (such as taking medications and preparing meals).
  • Medicaid home care can be offered through either the Medicaid state plan or as part of a specialized waiver. All states offer Medicaid home care through either 1915(c) waivers (47 states), 1115 waivers (14 states), personal care offered as a state plan benefit (34 states), or the Community First Choice option (10 states) (Figure 1).
  • Most states provide Medicaid home care through waivers that offer benefits specifically targeted to people with intellectual or developmental disabilities (48) and people ages 65 and older or who have physical disabilities (46).
  • Waivers’ coverage of different home care services, such as day services, supported employment, and home-based services, vary by the target populations they serve.

All States Offer Medicaid Home Care Through 1915(c) Waivers, 1115 Waivers, or Both

Proposed cuts to Medicaid spending may have broad implications for home care, including for the workforce, support for family caregivers, and states’ ability to cover various services. House Republicans’ proposals to reduce federal Medicaid spending by $2.3 trillion over 10 years—roughly one-third of Medicaid spending—could fundamentally change how Medicaid financing works, consequently impacting enrollees’ access to care. Cuts of this magnitude would put states at financial risk, forcing them to raise new revenues or reduce Medicaid spending by eliminating coverage for some people, covering fewer services, and (or) cutting rates paid to home care workers and other providers. Such difficult choices would have implications for home care because over half of Medicaid spending finances care for people ages 65 and older and those with disabilities, the enrollees most likely to use home care and related services.

What programs do states use to provide Medicaid home care?

Unlike institutional long-term care, nearly all home care is optional for states to provide under Medicaid. States are required to cover home health—which consists of part-time nursing services; home health aide services; and medical supplies, equipment, and appliances—but all other home care services are provided at the discretion of the states. States use various federal legal “authorities,” also known as programs, to offer home care, which are generally categorized as being part of the Medicaid state plan or part of a waiver. If services are provided through a state plan, they must be offered to all eligible individuals. In contrast, services provided under waivers, such as 1115s or 1915(c)s, may be restricted to specific groups based on geographic region, income, or type of disability. Waivers may include a wider range of service types than can be provided under state plans, but states may limit the number of people receiving waiver services. When the number of people seeking services exceeds the number of waiver slots available, states may use waiting lists to manage participation in the waiver.

All states have at least one home care program and many states have multiple programs. Home care is most frequently offered through 1915(c) waivers (47 states) and the personal care state plan benefit (34 states), and less frequently offered through 1115 waivers (14 states) or the Community First Choice option (10 states) (Figure 1). KFF estimates that 4.5 million people used Medicaid home care in 2021 compared with only 1.4 million people who used institutional long-term care.

All states offer people assistance with self-care and household activities under the personal care benefit, but they use different programs to do so. The primary home care benefit is personal care, which provides people with assistance with the activities of daily living (such as eating and dressing) and the instrumental activities of daily living (such as preparing meals and managing medication). States most commonly cover personal care through waivers (45 states), followed by the state plan (34 states).

How are people eligible for Medicaid home care?

Most people who are eligible for Medicaid home care qualify on the basis of having a disability or being ages 65 and older. Medicaid eligibility pathways in which eligibility is based on old age or disability are known as “non-MAGI” pathways because they do not use the Modified Adjusted Gross Income (MAGI) financial methodology that applies to children, pregnant individuals, parents, and other non-elderly adults with low incomes. In addition to considering income and age or disability status, non-MAGI eligibility pathways usually require people to demonstrate that they have limited savings and other financial resources (e.g., assets). Because nearly all non-MAGI pathways are optional, eligibility levels vary substantially across states.

Most states allow people with somewhat higher incomes to qualify for Medicaid home care, but income is capped at 300% of the supplemental security income limit ($2,901 per month in 2025) and assets are usually limited to $2,000 per person. Medicaid enrollees who use long-term care must also meet requirements related to their functional needs which are generally measured in terms of the ability to perform activities of daily living such as eating and bathing. Over half of people who use Medicaid home care are enrolled in Medicare as well; such people are also known as dual-eligible individuals.

In 2024, states operated over 300 different programs for Medicaid home care, many of which targeted a specific population. Most programs (258) were operated through 1915(c) waivers with 14 operated through 1115 waivers. (Waivers include those from all 51 states, not only the 48 states that responded to KFF’s survey.) The most common waiver programs target people with intellectual or developmental disabilities (48 states) and people who are ages 65 and older or have physical disabilities (46 states). Each year, some states’ waiver programs change: In 2024, Indiana added a new waiver for people who are ages 65 and older or have physical disabilities and North Dakota closed one. Also in 2024, Minnesota established a new program that is funded with state-only dollars to provide home care for people ages 65 and older who live in the community but require a nursing facility level of care. Unlike most Medicaid programs, Minnesota’s state-funded program requires participants to pay for a share of the total costs.

States are Most Likely to Offer Home Care to Eligible People with Intellectual/Developmental Disabilities

What services does Medicaid home care cover?

Besides personal care, Medicaid home care covers an array of services to help people with the activities of daily living and the instrumental activities of daily living. KFF asked states about what services they provide through Medicaid home care programs using the Centers for Medicare and Medicaid Services’ list of services, which are categorized in a comprehensive taxonomy. The taxonomy was developed to provide common language for describing home- and community-based services across waivers and state plans. Those services vary widely, including adult day care, supported employment, round-the-clock care, services to support unpaid family or friends who are caregivers, home-delivered meals, and non-medical transportation (Table 1).

All responding states cover supported employment (48), while nearly all (47) cover equipment, technology, and modifications, nursing services, home-based services, and day services in any home care program (Appendix Table 3). States often also offer other additional services for specific populations. For example, California offers specialized childcare and nutritional counseling through its waiver serving people with HIV/AIDS, Colorado offers virtual attendant services through its waivers serving people who are ages 65 and older or have disabilities and people with mental health conditions, and Minnesota offers respite, day support, and homemaker services through its waiver for children who are medically fragile or technology dependent. Among the categories defined by the Centers for Medicare & Medicaid Services, the least-frequently covered service was rent and food expenses for a live-in caregiver.

CMS Definitions of Medicaid Home Care Services

States use waivers that target specific populations to offer tailored benefits, and covered services differ among different types of waivers (Figure 3, Appendix Table 4). Some services, such as equipment, technology and modifications, home-based services, and day services, are covered by most states and in most waiver programs. However, other services are much more targeted to specific populations. Comparing services among the most commonly-offered waivers (those serving people with intellectual and developmental disabilities and people who are ages 65 and older or have physical disabilities), shows some services are widely covered by one type of waiver but not the other. For example, 45 states cover supported employment for people with intellectual or developmental disabilities, but only 13 cover the service for people who are ages 65 and older or have physical disabilities, a population less likely to be working. Alternatively, home-delivered meals are covered by 36 states under waivers serving people who are ages 65 and older or have physical disabilities, but only under 14 states’ waivers serving people with intellectual and developmental disabilities. By enabling states to cover, at times, different services per target population, waivers allow states to customize services to the needs of the specific populations they serve.

States' Coverage of Medicaid Home Care Services Vary by Target Population

How do states use managed care to provide home care?

All but 11 states use managed care to provide at least some home care (Figure 4). In managed care, states pay managed care plans a set fee—often called a capitation payment—for each person enrolled and the managed care plans are responsible for providing all services to enrollees. Use of managed care to provide home care has been growing over time, with states using managed care to make their Medicaid spending more predictable and to help coordinate the services enrollees use.

All but 11 States Provide Some Medicaid Home Care Through Managed Care Plans

Managed care is more commonly used for benefits provided through the state plan or 1115 waivers than for 1915(c) waivers (Figure 5, Appendix Table 5). Among the 14 states with 1115 waivers, 10 use managed care plans to provide at least some home care, over half of states use managed care plans to provide at least some home health through the state plan, and nearly half use managed care plans to provide some personal care, also through the state plan. Managed care was much less common under the 1915(c) waivers, particularly for waivers serving people with intellectual or developmental disabilities—of the 47 states with such waivers, only 8 provided any of the benefits through managed care.

All States Provide Optional Medicaid Home Care, Many Using Managed Care

This work was supported in part by Arnold Ventures. KFF maintains full editorial control over all of its policy analysis, polling, and journalism activities.

Appendix Tables

States Offering Medicaid Home Care Through Various Federal Programs

States Offer Medicaid Home Care for Several Target Populations

States Reporting Coverage of Each Medicaid Home Care Service Under Any Program

States' Coverage of Medicaid Home Care Services Vary by Target Population

All States Provide Optional Medicaid Home Care, Many Using Managed Care

Payment Rates for Medicaid Home Care: States’ Responses to Workforce Challenges

Authors: Alice Burns, Maiss Mohamed, Priya Chidambaram, Abby Wolk, and Molly O'Malley Watts
Published: Feb 18, 2025

Issue Brief

Long-standing workforce challenges in Medicaid home care (also known as home- and community-based services or HCBS) impact care for the over 4.5 million people who use these services and addressing them is a top priority for most states. Shortages and high turnover rates among the direct care workforce reflect demanding work and low wages, particularly among home care workers (who are direct care workers that provide HCBS). This issue brief describes states’ ongoing efforts to respond to shortages of home care workers and how they pay these workers, finding that increased payment rates are a key component of states’ efforts to address workforce shortages. However, those higher payment rates may be curtailed under House Republicans’ proposals to cut federal Medicaid spending by $2.3 trillion over 10 years. Cuts of that magnitude—a nearly one-third reduction in Medicaid spending—would force states to raise new revenues or reduce Medicaid spending, which would place downward pressure on payment rates. Efforts to reduce funding for Medicaid could have significant impacts on the direct care workforce, in particular, as nearly 70% of home care is paid for by Medicaid.

This issue brief is one of several reporting the data from the 22nd KFF survey of officials administering Medicaid home care programs in all 50 states and the District of Columbia (hereafter referred to as a state), which states completed between April and October 2024. The survey was sent to each state official responsible for overseeing home care benefits (including home health, personal care, and waiver services for specific populations such as people with physical disabilities). All states except Florida, Indiana, and Utah responded to the 2024 survey, but response rates for certain questions were lower. Key takeaways include:

  • All responding states reported taking actions to address workforce shortages, with most states raising payment rates (Figure 1).
  • All states reported shortages of home care workers, most frequently among direct support professionals, personal care attendants, nursing staff, and case managers.
  • Most (41) states reported permanent closures of home care providers within the last year.
  • Among the 34 states that reported time-based payment rates for personal care providers, more than half pay less than $20 per hour.
  • As enhanced federal funding through the American Rescue Plan Act (ARPA) for home care comes to an end, most states (30) are hoping to keep their increased payment rates for home care providers.

Increasing Provider Payment Rates Was States' Most Common Strategy to Increase Workers Providing Medicaid Home Care in 2024

Despite states’ efforts to address workforce challenges, cuts to Medicaid and changes in immigration policy under the new Trump Administration may exacerbate provider shortages and reduce payment rates for home care workers. All responding states (48) reported increasing provider payment rates to address staffing shortages, but with House Republicans proposing $2.3 trillion in cuts to Medicaid spending over 10 years, states may need to reduce provider payment rates. Additionally, over half of Medicaid spending is for Medicaid enrollees most likely to use home care and related services, so cuts will have implications on enrollees’ care. Proposed legislation by House Republicans could also delay or overturn the Biden Administration’s final rule on ensuring access to Medicaid services (see Box 1). Beyond reducing Medicaid resources, President Trump’s immigration policy changes, such as restricting and eliminating legal immigration pathways and deporting millions of immigrants, may further strain the long-term care workforce, which relies heavily on foreign-born workers.

How are States Addressing the Workforce Challenges in Home Care?

All responding states reported workforce shortages in 2024, with the most common shortages being among direct support professionals and personal care attendants (48 states each), followed by nursing staff and home health aides (47 states each) (Figure 2, Appendix Table 2). States were asked if they had shortages of each type of provider but were not provided with a definition of “shortage.” Most states also reported shortages in case managers (42 states), certified nurse aides (41 states), community-based mental health providers (37 states), and occupational, physical, and speech therapy providers (32 states). In some cases, states may not have reported a shortage of a particular type of provider because that type of service is not offered through their home care program.

All Responding States Reported Shortages of Home Care Workers in 2024

All states reported shortages for more than one type of provider and 46 states reported shortages among five or more provider types. Such shortages may reflect low compensation coupled with demanding working conditions. In the spring of 2024, home care providers participating in KFF focus groups reported that their jobs had high physical and mental demands that were often “overwhelming.” The groups described their wages as low, particularly given the demands of their jobs; and how staffing shortages made their jobs harder because they may not know if they would be able to leave work at the end of their shift. In survey responses, states attributed shortages to low reimbursement rates, lack of qualified providers, and high turnover rates.

Within the last year, 41 states reported permanent closures of home care providers, which were most common among adult day health programs (31 states), followed by assisted living facilities and group homes (27 states each) (Figure 3, Appendix Table 3). States were asked if there were any permanent closures of providers that offer services for Medicaid enrollees based on the location in which the providers deliver care. For a setting such as an assisted living facility or group home, a closure could reflect either the closure of an assisted living facility or the closure of a home care agency that sent workers into facilities and group homes. States were not asked to provide a reason for the closures. Some states reported closures of providers who work in enrollees’ homes (21 states), supported employment providers (15 states), and community mental health providers (11 states).

41 States Reported Permanent Closures of Medicaid Home Care Providers in 2024

Most states reported closures among more than one type of provider: 37 states reported closures among two or more provider types, and 28 states reported closures among three or more provider types. Some closures reflect provider shortages, while others reflect the fact that many companies have not recovered from the effects of the COVID-19 pandemic or have closed as a result of the home care settings rule. The settings rule, finalized in 2014 but first taking effect in 2023, established new requirements for home care settings, including full integration of individuals into the community and rights to privacy, dignity, respect, and freedom from coercion or restraint.

All responding states reported taking actions to address provider shortages, with 48 states increasing payment rates, 41 states developing or expanding worker education and training programs, and 38 states offering incentive payments to recruit or retain workers (Figure 1, Appendix Table 1). Less common initiatives included establishing or raising the state minimum wage (19 states) and offering paid sick leave for workers (18 states). States also reported other types of initiatives to strengthen the workforce, including initiatives allowing people to receive paid care from family members. For example, Illinois newly sought approval to allow legally responsible individuals to provide paid care for seniors participating in the home care waiver program.

All but 11 states use managed care to provide at least some home care, and in over half of the states with managed care, fee-for-service payment rates impact the payment rates that managed care plans pay home care providers. Out of the 37 states that use managed care to provide at least some home care, 22 states reported that the fee-for-service payment rates represent the minimum amount that plans must pay providers, one state, New Mexico, reported that the rate represents the maximum payment rate for managed care plans, 12 states reported that the fee-for-service rates do not affect payments by private plans, and 2 states responded that the answer was unknown or did not respond to the question.

How Much do States Pay for Medicaid Home Care?

KFF asked states to report their average hourly rate paid to two types of home care provider agencies (personal care agencies and home health agencies) and three types of specific home care providers (personal care providers, home health aides, and registered nurses), but many states were unable to report all rates (Appendix Table 4). The number of states that responded to the survey but did not provide payment rates or reported that payment rates were unknown was 4 for personal care agencies and 23 for home health agencies. Even more states did not provide payment rates for specific provider types: For registered nurses and home health aides, nearly half of states did not provide payment rate information or reported that payment rates were unknown.

Starting July 2026, states are required to report detailed payment rates for personal care, home health, and other services, per the provisions of the Biden Administration final Access rule (see Box 1). In addition to reporting payment rates for certain home care services, starting in 2030, states must demonstrate that at least 80% of the payments went to compensation for providers, also described as “direct care workers.” Meeting that requirement will require states to know both agency and provider payment rates. Among the states that were able to report payment rates, 38 could report payment rates for personal care agencies, home health agencies, personal care providers, and home health aides, all of which would be required under the rule. Those 38 states include states that reported a mix of hourly and non-hourly rates, which makes comparisons between provider and agency rates more complicated. These challenges highlight the difficulties states face as they implement the requirements in the new rule.

Box 1: Final Access Rule’s Provisions on Home Care

On May 10, 2024, the Biden Administration released a final rule aimed at helping to ensure access to Medicaid services, which has several notable provisions aimed at increasing transparency and improving access to Medicaid home care, increasing home care payment rates, and addressing home care workforce challenges. The rule cites workforce shortages as a major contributor to home care access barriers among Medicaid enrollees. To address those access barriers, the rule requires states to do the following.

  • Starting July 2026, states must report state hourly payment rates for personal care, homemaker services, home health aide services, and habilitation and publish that information on the state website. If state rates vary across provider types, geographies, or other factors, the states must report each of those rates.
  • For each type of payment rate, the disclosures must also include the number of Medicaid paid claims and the number of Medicaid enrollees who received the service within the calendar year.
  • States must establish an interested parties advisory group (IPAG) comprised of direct care workers, Medicaid enrollees and their representatives, and other interested parties. The IPAG will meet at least every two years to advise and consult on the sufficiency of current and proposed payment rates for personal care, homemaker services, home health aide services, and habilitation.
  • Starting July 2030, states must ensure that at least 80% of payments to Medicaid providers for designated home care go directly to compensation for direct care workers. Designated home care include personal care, homemaker services, home health aide services, and habilitation. States may adopt separate standards for small providers or exempt small providers that meet reasonable criteria.

Beyond payment rates, the Access rule includes other requirements aimed at increasing access to home care. Starting July 2027, states will be required to report the number of people on waiting lists for services and the average amount of time from when homemaker services, home health aide services, or personal care services are initially approved to when services begin and the percentage of authorized hours that are provided. The proposed rule also includes provisions that would strengthen requirements around person-centered planning and needs assessment, create new requirements around incident management, establish requirements for people to file grievances if they are receiving home care from the state Medicaid program, and require states to report on nationally-standardized quality measures.

The home care payment-related requirements are one component of a broader emphasis on addressing Medicaid payment rates. The Access rule also requires states to report all fee-for-service Medicaid payment rates on state websites, and to compare various service-specific rates to those of Medicare. A companion rule on Medicaid managed care requires states to submit an annual payment analysis comparing managed care plans’ payment rates to Medicare payment rates for selected services.

States reported many reasons why it was difficult to report payment rates, including the following.

Some states reported that services were bundled together in various ways and therefore, the payment rates were not distinguishable.

Among states with managed care, some states responded that they did not know the payment rates for agencies because the services were paid for by managed care plans and they did not have access to those payment rates.

Other states responded that they knew the payment rates for agencies but not what the agencies paid their home care workers. Multiple states reported that they do not “dictate” what agencies pay to providers or that individual providers negotiate their own payment rates with the agencies.

In addition to having difficulty reporting payment rates, many states reported different payment rates for personal care across different waivers and the waiver payment rates often differ from the payment rates for personal care provided through the state plan. When states reported multiple payment rates for personal care, KFF used the median of those payment rates in the analysis.

The payment rates to home care providers show considerable variation and are somewhat higher than those reported by other organizations on account of differences in reporting and provider categorization (Figure 4). KFF’s survey estimates that median payment rates to providers are $18 per hour for personal care providers, $40 for home health aides, and $64 for registered nurses. It is difficult to compare those numbers to other sources of data for the following reasons.

Other organizations group classes of providers together differently. PHI reports that in 2023, the median rate for home care workers was $16.13 per hour and $17.15 per hour for residential care aides. The Bureau of Labor Statistics reports $16.12 per hour for home health and personal care aides in 2023.

Other organizations include payment rates for workers regardless of the source of payment whereas KFF rates only reflect the Medicaid rates. Medicaid often covers more intensive personal care services than other payers, which may contribute to the higher rates.

Payment rates to home health agencies are generally larger than those to personal care agencies, but there is considerable variation in both (Figure 4). Among states reporting hourly rates, the rates for home health agencies range from $25 to $154 whereas those for personal care agencies range from $14 to $176. Those states reported that the median hourly payment to home health agencies was $62 and $25 for personal care agencies.

There is Considerable Variation in Payment Rates for Medicaid Home Care, Across States and Provider Types

Among states able to report any payment rate data, payments for personal care workers range from below $10 to over $20 per hour (Figure 5, Appendix Table 4). Rates for home health aides are somewhat higher than those of personal care workers, reflecting the additional training requirements for such workers. Among the states with payment rates for home health aides in the highest category, some states reported that the rates were per visit or per day (which is noted in Appendix Table 4). There were other states with particularly high payment rates that did not report providing rates per visit or per day, but the rates may still reflect a non-hourly payment basis.

Payment Rates for Home Care Vary Across States and Type of Provider

How Might the End of Enhanced Federal Funding Affect Payment Rates for Medicaid Home Care?

States received $37 billion in additional federal funding to expand Medicaid home care during COVID-19 though Section 9817 of the American Rescue Plan Act (ARPA). This provision increased the percentage of expenditures that the federal government paid by ten percentage points for spending on Medicaid home care between April 1, 2021 and March 31, 2022. States were required to use the new funding to enhance, expand, or strengthen their home care program. Most states will exhaust these funds by March 31, 2025, though some states have received extensions through September 2026. The number one use of the ARPA funds—accounting for more than $30 billion in new funding—was for workforce recruitment, retention, and training.

As enhanced federal funding comes to an end, most states are hoping to keep their increased payment rates for home care providers (Figure 6). The clear top priority for states is preserving provider payment rates (30 states). In comparison, far fewer states reported prioritizing other enhancements with 16 states reporting that a top priority was added or expanded services and 5 states (California, New Mexico, North Carolina, Oklahoma, and Texas) reporting that reducing or eliminating waiting lists for home care was a top priority. (Those five states account for 55% of people on waiting lists.) Arkansas, Delaware, and Washington reported providing family caregiver supports to be a priority to continue once funding depletes.

States' Top Priorities for Continuation After Federal Funds are Exhausted

While many states would like to maintain enhancements made using additional federal funds, five states reported plans to eliminate provider payment increases after federal funds are exhausted. Connecticut, Maryland, New Jersey, Washington, and Wyoming reported such plans, and Arizona, Maine, and Nebraska also noted that they would be eliminating some type of additional payments to providers, but did not categorize the payments as provider payments in the KFF survey.

Appendix Tables

States' Use of Strategies to Increase the Number of Medicaid Home Care Workers in 2024

States' Responses to Whether They Were Experiencing Workforce Shortages by Type of Worker in 2024

States Reporting Permanent Closures of Home Care Providers in 2024, by the Location in Which Services are Offered

States' Hourly Payment Rates for Home Care Agencies and Workers in 2024

5 Key Facts About Medicaid Work Requirements

Published: Feb 18, 2025

Work requirements in Medicaid have resurfaced as part of a broader legislative package of potential changes to Medicaid designed to significantly reduce federal Medicaid spending. Reductions could help offset the costs of extending expiring tax cuts. A draft bill introduced in the U.S. House of Representatives in February 2025 includes a minimum work requirement for certain adults enrolled in Medicaid as a condition of coverage. The idea of promoting “work” is popular, particularly among Republicans who view Medicaid as a form of welfare. As debate heats up about Medicaid work requirements, data show most Medicaid adults are working or face barriers to work. Many Medicaid adults who are working low-wage jobs are employed by small firms and in industries that have low employer-sponsored insurance offer rates.

If Congress does not include work requirements in federal legislation, some states will pursue Medicaid work requirements through Medicaid demonstration waivers. The first Trump administration encouraged and approved “Section 1115” demonstration waivers that conditioned Medicaid coverage on meeting work and reporting requirements, approving 13 state work requirement waivers. Only Arkansas implemented such requirements with consequences for noncompliance, which resulted in over 18,000 people losing coverage. These approvals were either rescinded by the Biden administration or withdrawn by states, and Georgia is the only state with a Medicaid work requirement waiver in place (following litigation over the Biden administration’s attempt to stop it). While work requirement waivers were the subject of litigation during the Trump and Biden administrations, the Supreme Court never ruled on the issue leaving it open for future administrations. This issue brief highlights five key facts about Medicaid work requirements, including what research shows about the impact of work requirements.

1. Most Medicaid adults under age 65 are working already, without a “work requirement.”

Among adults under age 65 with Medicaid who do not receive benefits from the Social Security disability programs, Supplemental Security Income (SSI) and Social Security Disability Insurance (SSDI), and who are not also covered by Medicare, 92% were working full or part-time (64%), or not working due to caregiving responsibilities (12%), illness or disability (10%), or school attendance (7%) (Figure 1). The remaining 8% of Medicaid adults reported that they are retired, unable to find work, or were not working for another reason. Those in better health, with more education, and without disabilities are more likely to be working. Many Medicaid adults who work are employed by small firms or in industries (e.g., agriculture, service) with historically low employer-sponsored health insurance rates; even if eligible for job-based insurance, some low-wage workers may not take up the offer because it is not affordable to them.

Work Status & Barriers to Work Among Medicaid Adults, 2023

2. CBO estimates of national work requirements show lower federal spending and an increase in the number of uninsured, but no increase in employment.

In April 2023, the U.S. House of Representatives passed a debt ceiling bill (HR 2811, the Limit, Save, Grow Act of 2023) that included a requirement for states to implement work requirements for certain Medicaid enrollees. While this bill never became law, the Congressional Budget Office (CBO) estimated (under this proposal) each year an average of 15 million enrollees would be subject to the requirements and 1.5 million would lose eligibility for federal funding, resulting in federal savings of $109 billion over a ten-year period (2023 – 2033). CBO analysis also showed the policy would increase the number of people without health insurance (by 600,000) but would not increase employment. CBO cited evidence of the effects of Medicaid work and reporting requirements implemented in Arkansas, the only state where a work requirement was established with disenrollment for noncompliance.

A 2022 CBO report notes high rates of employment among SNAP and Medicaid recipients leave little room to increase employment rates further. When people (who are not working) have conditions that make it difficult to find and keep employment (e.g., disabilities, caregiving responsibilities etc.), CBO indicates work requirements are less likely to lead to employment and more likely to reduce income/benefits. Targeted work supports (e.g., childcare, transportation, job training) can boost employment for some; however, CBO notes Medicaid and SNAP do not provide such supports.

3. In Arkansas, implementing Medicaid work requirements resulted in more than 18,000 people losing coverage.

Arkansas implemented Medicaid work and reporting requirements with consequences for noncompliance before a federal court deemed the work requirement unlawful. The requirements were in effect from June 2018 through March 2019. More than 18,000 people lost coverage, or about 25% of the population subject to the requirement, primarily due to failure to regularly report work status or document eligibility for an exemption. Researchers found work and reporting requirements in Arkansas were associated with losses in Medicaid coverage, an increase in the percentage of adults who were uninsured, and no significant change in employment—as nearly everyone targeted by the policy met the requirements already or qualified for an exemption. More recent research looking at two-year impacts of Arkansas’s work and reporting requirements found disenrollment was also associated with poorer medication adherence, delays in care, and medical debt.

Georgia has not expanded Medicaid under the ACA but expanded eligibility (under its “Pathways” waiver) to 100% of the federal poverty level (FPL) for parents and childless adults, with initial and continued enrollment conditioned on meeting work requirements. The current waiver does not include any exemptions (e.g., for caregiving). The waiver was implemented in July 2023 and as of January 2025, the state had only enrolled about 6,500 adults, considerably short of the state’s own estimates (25,000 adults in the first year and 64,000 over 5 years). In August 2024, Georgia’s governor announced a $10.7 million ad campaign aimed at boosting Pathways low enrollment. The Pathways waiver expires in September 2025. The state is seeking changes in its waiver renewal application including allowing parents / caretakers of children up to age 6 (in households at or below 100% FPL) to receive Medicaid without work requirements and eliminating the requirement to monthly report work activities (in exchange for annual reporting).

4. Evidence shows Medicaid work and reporting requirements are confusing to enrollees and complex and costly for states to implement.

In Arkansas, lack of awareness and confusion about the requirements were common. Despite robust outreach efforts, many enrollees were not successfully contacted. Lack of computer literacy and internet access were also barriers, as individuals were required to report on their work or exemption status monthly using an online portal. Providers reported the most vulnerable enrollees (e.g., people with disabilities, people experiencing homelessness) were the most likely to face barriers in complying with the requirements. (While proponents of Medicaid work requirements often describe these policies as applying to “able-bodied” adults, people with disabilities may be subject to the requirements—as many people with disabilities do not meet criteria to receive Supplemental Security Income (SSI) and therefore qualify for Medicaid based on income (vs. disability status).) Although Arkansas’s program included safeguards intended to protect coverage for people with disabilities and others who should not have been subject to the requirements from losing coverage, few people used these safeguard measures relative to the number who lost coverage.

For states, implementing work requirements involves complex systems changes (e.g., developing or adapting eligibility and enrollment systems), enrollee outreach and education, and staff training. GAO examined selected states’ estimates of the administrative costs to implement work requirements and found costs varied from under $10 million to over $270 million. States estimated that federal funds would cover most of these costs, largely due to higher matching rates of 75% and 90% percent of applicable IT costs. GAO found CMS did not consider administrative costs when approving Medicaid work requirement demonstrations. According to data obtained by KFF Health News, Georgia’s “Pathways” program cost the state and federal government more than $40 million (through June 2024), with nearly 80% of costs spent on program administration and consulting fees (vs. paying for health care).

5. Research shows access to affordable health insurance and care promotes individuals’ ability to obtain and maintain employment.

Research shows that being in poor health is associated with increased risk of job loss, while access to affordable health insurance has a positive effect on the ability to obtain and maintain employment. Many of the jobs held by people with low incomes involve walking, standing, lifting and carrying objects, repetitive motions, and other physical labor. Most Medicaid adults work in industries with low offer rates for employer-sponsored insurance, such as the agriculture and service industries. As a result, working does not replace the need for affordable coverage, including Medicaid coverage. Having access to regular preventive health care to manage chronic conditions, access medications, and address health issues before they worsen can help support work. In addition, an unmet need for mental health or addiction treatment results in greater difficulty with obtaining and maintaining employment, and Medicaid is an important source of coverage for mental health and addiction treatment services, such as opioid addiction.

10 Things to Know About Medicaid

Published: Feb 18, 2025

Medicaid is the primary program providing comprehensive coverage of health and long-term care to 83 million low-income people in the United States. Medicaid accounts for one-fifth of health care spending, more than half of spending for long-term care, and a large share of state budgets. Medicaid is jointly financed by states and the federal government but administered by states within broad federal rules. Because states have a degree of flexibility to determine what populations and services to cover, how to deliver care, and how much to reimburse providers, there is significant variation across states in program spending and the share of state residents covered by the program.

At the start of 2025, many issues are at play that will affect Medicaid coverage, financing, and access to care. While Medicaid was not discussed much on the campaign trail, Congress may consider big changes as part of tax and spending debates and the Trump administration may make changes to Medicaid through executive actions. Amid the potential changes, this brief highlights ten key things to know about Medicaid.

1. Nationally, one in five people have Medicaid, but this varies across the states.

The percentage of people who report having Medicaid is 21% nationally, but ranges from 11% in Utah to 34% in New Mexico (Figure 1). The percentage tends to be higher in the 41 states that expanded Medicaid under the Affordable Care Act (ACA), which includes 21 states that voted for Trump and 20 that voted for Harris. Rates of Medicaid coverage are also higher in states with lower average incomes and lower rates of health insurance offered through employers.

Nationally, One in Five People Have Medicaid, but This Varies Across States.

2. Medicaid is a key source of coverage for certain populations.

While Medicaid covers 1 in 5 people living in the United States, Medicaid is a key source of coverage for certain populations. In 2023, Medicaid covered nearly 4 in 10 children, over 8 in 10 children in poverty, 1 in 6 adults, and almost half of adults in poverty. Relative to White children and adults, Medicaid covers a higher share of Black, Hispanic, and American Indian or Alaska Native (AIAN) children and adults. Medicaid covers more than 1 in 4 adults ages 19-64 with disabilities, who are defined as having one or more difficulty related to hearing, vision, cognition, ambulation, self-care, or independent living (Figure 2).

Medicaid provides coverage for several special populations.  For example, Medicaid covers 41% of all births in the United States, nearly half of children with special health care needs, 5 in 8 nursing home residents, 29% of non-elderly adults with any mental illness, and 40% of non-elderly adults with HIV. Medicaid pays Medicare premiums and often provides wraparound coverage for services not covered by Medicare (like most long-term care) for nearly 1 in 5 Medicare beneficiaries (13 million).  Medicaid is a key source of coverage for individuals experiencing homelessness and those transitioning out of carceral settings, particularly in states that have adopted the Medicaid expansion.

Medicaid is a Key Source of Coverage for Certain Populations.

3. Medicaid is jointly financed by the federal government and states.

States are guaranteed federal matching dollars without a cap for qualified services provided to eligible enrollees. The match rate for most Medicaid enrollees is determined by a formula in the law that provides a match of at least 50% and provides a higher federal match rate for states with lower per capita income (Figure 2). States may receive a higher match rate for certain services and populations. The ACA expansion group is financed with a 90% federal match rate, so states pay 10%; however, the American Rescue Plan Act included an additional temporary fiscal incentive to states that newly adopt the Medicaid expansion. In FY 2023, Medicaid spending totaled $880 billion of which 69% was federal spending. Total Medicaid spending typically accelerates during economic downturns because people may lose income and enroll in the program. To help states manage increased costs, the federal government has temporarily increased the federal share of Medicaid. Most recently, states received an increase in the match rate between 2020 and 2024 to help manage increased enrollment and costs due to the pandemic related continuous enrollment provision.

Medicaid is Jointly Financed by the Federal Government and States.

4. Medicaid accounts for one fifth of all health care spending, and over half of spending on long-term care.

Medicaid provides a major source of funding for the U.S. health care system, covering 19% of all health care spending and 19% of hospital spending (Figure 4). In addition to covering the services required by federal Medicaid law, all states elect to cover optional benefits including prescription drugs and home care. Home care, also known as home- and community-based services or HCBS, is long-term care provided in non-institutional settings including homes, day care centers, and assisted living facilities. Other long-term care is provided in institutions such as nursing facilities. Medicaid is the primary payer for long-term care in the United States, covering 61% of total spending. Beyond long-term care, Medicaid provides other benefits not usually covered by health insurance including non-emergency medical transportation, which helps enrollees get to appointments, and comprehensive benefits for children, known as Early Periodic Screening Diagnosis and Treatment (EPSDT) services.

Medicaid Accounts for One Fifth of All Health Care Spending, and Over Half of Spending on Long-term Care.

5. People who qualify for Medicaid based on age or disability account for more than half of spending.

Overall, seniors and individuals with disabilities account for 23% of enrollment but 51% of spending whereas children account for 34% of enrollment, but 14% of spending (Figure 5). The disproportionate spending on certain eligibility groups stems from variation in spending per enrollee across the eligibility groups. Spending per enrollee was highest for enrollees ages 65 and older ($18,923) and eligible because of disability ($18,437). Seniors and people with disabilities often have higher health care costs than other enrollees due to more complex health care needs, higher rates of chronic conditions and being more likely to utilize long-term care. There is significant state variation in the percentage of Medicaid spending that pays for enrollees eligible because of a disability or being age 65 and older: In some states (Alaska, Nevada, Montana, Illinois, and Indiana), only a third of spending went to those populations, and in five states (Alabama, Florida, Kansas, Mississippi, and North Dakota), care for people eligible because of disabilities or being over age 64 accounted for at least two-thirds of spending.

People Who Qualify for Medicaid Based on Age or Disability Account for More than Half of Spending.

6. Flexibility to administer Medicaid results in variation in per enrollee costs across states.

Across the states, spending per full-benefit enrollee ranged from a low of $3,713 in Alabama to $10,229 in the District of Columbia in 2020 (Figure 6). Variation in spending across the states reflects considerable flexibility for states to design and administer their own programs – including what benefits are covered and how much providers are paid — and variation in the health and population characteristics of state residents as well as overall health care costs. Although all states are required to provide some Medicaid benefits, many others are optional, including prescription drugs (covered by all states), vision services, dental care and most home care. In recent years, states have expanded coverage of behavioral health services and benefits to help enrollees address social determinants of health (SDOH) like nutrition or housing.

Flexibility to Administer Medicaid Results in Variation in Per Enrollee Costs Across States.

7. Three-quarters of all Medicaid enrollees receive care through comprehensive, risk-based MCOs.

Overall, 75% of all Medicaid enrollees receive care through comprehensive, risk-based managed care organizations (MCOs) (Figure 7). Payments to MCOs accounted for more than half (52%) of Medicaid spending in FY 2023. As of July 2024, 42 states (including DC) contract with comprehensive MCOs. Medicaid MCOs provide comprehensive acute care (i.e., most physician and hospital services) and in some cases long-term care to Medicaid enrollees and are paid a set per member per month payment for these services. Medicaid MCOs represent a mix of private for-profit, private non-profit, and government plans. Five for-profit parent firms (Centene, Elevance (formerly Anthem), UnitedHealth Group, Molina, and CVS) account for 50% of all Medicaid MCO enrollment. States have increased their reliance on MCOs with the aim of improving access to certain services, enhancing care coordination and management, and making future costs more predictable. While the shift to MCOs has increased budget predictability for states, the evidence about the impact of managed care on access to care, costs, and outcomes is both limited and mixed.

In Most States With Comprehensive MCOs, at Least 75% of Beneficiaries Are Enrolled in One.

8. Medicaid coverage facilitates access to care, improves health outcomes, and provides financial protection from medical debt.

A large body of research shows that Medicaid beneficiaries have substantially better access to care than people who are uninsured (who are also primarily low-income) and are less likely to postpone or go without needed care due to cost, as federal rules generally limit out of pocket Medicaid costs. Key measures of access to care among Medicaid enrollees are generally comparable to rates for people with private insurance (Figure 8). Gaps in access to certain providers (e.g., psychiatrists and dentists) is an ongoing challenge in Medicaid that may reflect system-wide problems, but may be exacerbated by provider shortages in low-income communities, Medicaid’s lower physician payment rates, and lower Medicaid physician participation compared with private insurance.

Longstanding research shows that Medicaid eligibility during childhood is associated with positive effects on health (including reduced avoidable hospitalizations and mortality) and impacts beyond health, such as improved long-run educational attainment. Early and updated research findings show that state Medicaid expansions to low-income adults are associated with increased access to care, increased economic security, improved self-reported health status, and other outcomes including increased early-stage cancer diagnosis rates, lower mortality rates for certain conditions (e.g., cancer, cardiovascular disease, liver disease), decreased maternal mortality, improved treatment management for conditions (e.g., diabetes, HIV), and improved outcomes related to substance use disorders. Research conducted by NBER (National Bureau of Economic Research) suggests that the ACA Medicaid expansion had impacts beyond health care use, including on consumer financial outcomes – reducing unpaid bills and medical debt sent to collections.

People with Medicaid Report Similar Access to Care as People with Private Insurance and Much Better Access to Care than People who are Uninsured.

9. Section 1115 demonstration waivers reflect changing priorities across presidential administrations.

Section 1115 demonstration waivers offer states an avenue to test new approaches in Medicaid that differ from what is required by federal statute, if [in the HHS Secretary’s view] the approach is likely to “promote the objectives of the Medicaid program.” Waivers generally reflect priorities identified by states as well as changing priorities from one presidential administration to another (Figure 9). Waivers have been used to expand coverage or benefits, change policies for existing Medicaid populations (e.g., testing premiums or other eligibility requirements), modify delivery systems, restructure financing or authorize new payments (e.g., supplemental payments or incentive-based payments), as well as make other program changes. Waivers vary in size and scope. States can obtain “comprehensive” Section 1115 waivers that make broad program changes or narrow waivers focused on a specific population. Nearly all states have at least one active Section 1115 waiver and some states have multiple 1115 waivers.

Section 1115 Demonstration Waivers Reflect Changing Priorities Across Presidential Administrations.

10. The majority of the public holds favorable views of Medicaid.

In the most recent KFF tracking poll, more than three-fourths (77%) of Americans held favorable views of Medicaid, including six in ten Republicans (63%), and at least eight in ten independents (81%) and Democrats (87%) (Figure 10). Medicaid is also viewed favorably by a majority of voters who say they voted for President Trump in the 2024 election (62%). Nearly half of the public (46%) say the federal government doesn’t spend enough on the Medicaid program, with another third (33%) saying it spends “about the right amount,” and around one in five (19%) saying it spends “too much.” With possible changes to government health programs, seven in ten (72%) say they are worried about the level of benefits that will be available to people covered by Medicaid in the future

Majorities Across Partisanship, Race and Ethnicity, Vote Choice, and Income View Medicaid Favorably.

What Drives Differences in Life Expectancy between the U.S. and Comparable Countries?

Published: Feb 14, 2025

Americans’ life expectancy is significantly lower than the average for people in other large, wealthy countries.

This analysis compares 2021 data about deaths in the U.S. and 11 other large, wealthy countries by age and cause to understand the primary drivers of the longevity gap between the U.S. and the comparable countries. It finds that the primary reasons for the gap in 2021 were chronic disease, COVID-19 and substance use disorders.

The analysis is available through the Peterson-KFF Health System Tracker, an information hub dedicated to monitoring and assessing the performance of the U.S. health system.

Health Coverage by Race and Ethnicity, 2010-2023

Authors: Latoya Hill, Nambi Ndugga, Samantha Artiga, and Anthony Damico
Published: Feb 13, 2025

Summary

Health coverage plays a major role in enabling people to access health care and protecting families from high medical costs. There have been longstanding racial and ethnic disparities in health coverage that contribute to disparities in health. This brief examines trends in health coverage by race and ethnicity from 2010 through 2023 and discusses the implications for health disparities. All noted differences between groups and years described in the text are statistically significant at the p<0.05 level. It is based on KFF analysis of American Community Survey (ACS) data for people under age 65. Key takeaways include:

There were gains in coverage across most racial and ethnic groups between 2019 and 2023 after several years of rising uninsured rates during the first Trump administration. The coverage gains between 2019 and 2023 were largely driven by increases in Medicaid coverage, reflecting policies to stabilize and expand access to affordable coverage that were implemented during the COVID-19 pandemic. These policies included enhanced subsidies to purchase Marketplace coverage and a requirement that states keep Medicaid enrollees continuously enrolled during the public health emergency (PHE), which led to record high Medicaid enrollment. While Medicaid enrollment fell as the pandemic era protections were unwound, it has remained higher than in 2019. These coverage gains helped narrow differences in uninsured rates for Hispanic, Black, and American Indian or Alaska Native (AIAN) people compared with White people, but the gains may be at risk due to potential Medicaid cuts and the expiration of the enhanced Marketplace subsidies.

Despite these coverage gains, disparities in coverage persisted as of 2023. AIAN and Hispanic people under age 65 had the highest uninsured rates at 18.7% and 17.9%, respectively. Uninsured rates for Native Hawaiian or Pacific Islander (NHPI) (12.8%) and Black people (9.7%) under age 65 also were higher than the rate for their White counterparts (6.5%). Coverage disparities have persisted over time, and in some cases widened despite recent gains and earlier large gains in coverage under the Affordable Care Act (ACA). For example, between 2010 and 2023, the uninsured rate for AIAN people grew from 2.4 to 2.9 times higher than the uninsured rate for White people, the Hispanic uninsured rate grew from 2.5 to 2.7 times higher than the rate for White people, and Black people remained 1.5 times more likely to be uninsured than White people.

Uninsured rates in states that have not expanded Medicaid are higher than rates in expansion states across most racial and ethnic groups as of 2023. Further, the differences in coverage rates between Hispanic, Black and NHPI people compared with White people are larger in non-expansion states compared with expansion states. However, the relative risk of being uninsured for Black and Hispanic people compared to White people is similar in expansion and non-expansion states.

Going forward, racial and ethnic disparities in coverage could widen due to potential Medicaid cuts, expiration of the enhanced subsidies for Marketplace coverage, and immigration policy changes. The incoming Trump administration and Republican controlled Congress are signaling plans to make significant changes to Medicaid and the ACA. House Republicans appear to be considering large cuts to Medicaid, which could help offset the cost of extending expiring tax cuts but would shift a substantial amount of Medicaid spending from the federal government to states, and likely lead states to make reductions in eligibility and/or benefits. Further, if Congress does not take action to extend the enhanced ACA Marketplace subsidies, which are set to expire in 2025, premiums will rise, likely leading to an increase in the number of uninsured people. Additionally, the Trump administration’s changes to immigration policy, including increased enforcement, the rescission of protections from enforcement activity in sensitive locations including health care facilities, and potential changes to public charge policy, will likely lead to reduced enrollment in health coverage of lawfully present immigrants and citizen children in immigrant families. Medicaid and Marketplace coverage losses would likely lead to widening racial disparities in coverage given that disproportionately large shares of Hispanic, Black, AIAN, and NHPI people are covered through these sources, which, in turn, would likely contribute to widening disparities in health.

Prior to the enactment of the ACA in 2010, Hispanic, Black, Asian, AIAN, and NHPI people under age 65 were more likely to be uninsured compared to their White counterparts, with Hispanic and AIAN people at the highest risk of lacking coverage (Figure 1). Their higher uninsured rates reflected more limited access to affordable health coverage options. Although the majority of individuals have at least one full-time worker in the family across racial and ethnic groups, there are ongoing racial disparities in employment and income that result in some groups having more limited access to coverage offered by an employer or having greater difficulty affording private coverage when it is available. While Medicaid helped fill some of these gaps in private coverage, prior to the ACA, Medicaid eligibility for parents in most states was limited to those with very low incomes (often below 50% of the poverty level), and adults without dependent children—regardless of how poor—were ineligible under federal rules.

Uninsured Rate Among People Under Age 65 by Race and Ethnicity, 2010-2023

Between 2010 and 2016, there were large gains in coverage across racial and ethnic groups under the ACA, but racial and ethnic disparities in coverage persisted. The ACA created new coverage options for low- and moderate-income individuals. These included provisions to extend dependent coverage in the private market up to age 26 and prevent insurers from denying people coverage or charging them more due to health status that went into place. Further, beginning in 2014, the ACA expanded Medicaid coverage to nearly all adults with incomes at or below 138% of poverty in states that adopted the expansion and made tax credits available to people with incomes up to 400% of poverty to purchase coverage through a health insurance Marketplace. Following the ACA’s enactment in 2010 through 2016, coverage increased across all racial and ethnic groups, with the largest increases occurring after implementation of the Medicaid and Marketplace coverage expansions in 2014. Hispanic people under age 65 had the largest percentage point increase in coverage, and their uninsured rate falling from 32.6% to 19.1%. Black, Asian, and AIAN people also had larger percentage point increases in coverage compared to White people over that period. Despite these larger gains, Hispanic, Black, AIAN, and NHPI people under age 65 remained more likely than their White counterparts to be uninsured as of 2016.

Beginning in 2017, coverage gains began reversing, and the number of uninsured increased for three consecutive years. The uninsured rate for the total population under age 65 increased from 10.0% in 2016 to 10.9% in 2019. Among this age group, Hispanic people had the largest statistically significant increase in their uninsured rate over this period (from 19.1% to 20.0%). There were also small but statistically significant increases in the uninsured rates among White and Black people under age 65, which rose from 7.1% to 7.8% and 10.7% to 11.4%, respectively, between 2016 and 2019. Rates for AIAN, NHPI, and Asian people under age 65 did not have a significant change. These coverage losses likely reflected policy changes made by the first Trump administration after taking office in 2017. These changes included decreased funds for outreach and enrollment assistance, guidance encouraging states to seek waivers to add new eligibility requirements for Medicaid coverage as well as to increase the frequency of eligibility verifications, and changes to public charge immigration policy that made some immigrant families more reluctant to participate in Medicaid and the Children’s Health Insurance Program (CHIP) (which were later reversed by the Biden administration).

After increasing for several years prior to the pandemic, uninsured rates declined between 2019 and 2023. The number of people under age 65 with insurance increased by 3.6 million between 2019 and 2023 as the uninsured rate dropped from 10.9% to 9.6%. (Because of disruptions in data collection during the first year of the pandemic, the Census Bureau did not release 1-year ACS estimates in 2020.) AIAN people had the largest percentage point increase in coverage, with their uninsured rate falling from 21.7% in 2019 to 18.7% in 2023. There were also smaller but statistically significant declines in uninsured rates among Hispanic (from 20.0% to 17.9%), Black (from 11.4% to 9.7%), Asian (from 7.2% to 5.8%), and White people (from 7.8% to 6.5%) during this period. These coverage gains were primarily driven by increases in Medicaid coverage, which offset declines in employer-sponsored coverage over the period. NHPI people did not have statistically significant changes in coverage over this period.

The coverage gains observed between 2019 and 2023 largely reflect policies adopted during the pandemic to stabilize coverage in Medicaid and enhance subsidies to purchase Marketplace coverage. Coverage gains reflected provisions in the Families First Coronavirus Response Act (FFCRA), enacted at the start of the pandemic that prohibited states from disenrolling people from Medicaid during the Public Health Emergency in exchange for enhanced federal funding. While Medicaid enrollment fell as the pandemic era protections were unwound, it has remained higher than in 2019. In addition, gains reflected enhanced ACA Marketplace subsidies made available by the American Rescue Plan Act (ARPA) and renewed in the Inflation Reduction Act of 2022 (IRA), boosted outreach and enrollment efforts, and low Marketplace attrition. Further, in 2019, the Biden administration reversed changes the Trump administration previously made to public charge immigration policies that had increased reluctance among some immigrant families to enroll in public programs, including health coverage.

Coverage disparities have persisted, and in some cases widened, over time even with recent gains and the large earlier gains in coverage under the ACA. For example, in 2010, the uninsured rate for AIAN people was 2.4 times higher than the uninsured rate for White people; however, in 2023, the uninsured rate for AIAN people had increased to 2.9 times higher than the rate for White people. Similarly, the Hispanic uninsured rate grew from 2.5 to 2.8 times higher than the rate for White people from 2010 to 2023, while Black people remained 1.5 times more likely to be uninsured than White people.

Coverage by Race and Ethnicity as of 2023

While there were minimal changes in overall uninsured rates between 2022 and 2023, Hispanic, Black, AIAN, and NHPI people under the age of 65 years old remained more likely than their White counterparts to be uninsured (Figure 2). AIAN and Hispanic people had the highest uninsured rates at 18.7% and 17.9%, respectively, as of 2023. Uninsured rates for NHPI (12.8%) and Black people (9.7%) also were higher than the rate for their White counterparts (6.5%). These differences in uninsured rates are driven by lower rates of private coverage among these groups. Medicaid coverage helps to narrow these differences but does not fully offset them.

Medicaid and CHIP coverage help fill gaps in private coverage and reduce coverage disparities for children, but some disparities in children’s coverage remain (Figure 2). Medicaid and CHIP cover larger shares of children than adults, reflecting more expansive eligibility levels for children. This coverage helps fill gaps in private coverage, with over half of Hispanic, Black, AIAN, and NHPI children covered by Medicaid and CHIP. However, there remain some disparities in children’s coverage. For example, AIAN children are about three times as likely as their White counterparts to lack coverage (12.7% vs. 4.0%). Moreover, Hispanic children are more than twice as likely as White children to be uninsured (8.5% vs. 4.0%).

Health Coverage of People Under Age 65 by Race and Ethnicity, 2023

Among people under the age of 65, uninsured rates in states that have not expanded Medicaid are higher than rates in expansion states across most racial and ethnic groups as of 2023 (Figure 3). The differences in coverage rates between Black and Hispanic people compared with White people are larger in non-expansion states compared with expansion states. However, the relative risk of being uninsured for Black, Hispanic, and Asian people compared with White people is similar in expansion and non-expansion states. For example, Hispanic people under the age of 65 years old are roughly 2.6 times as likely as their White counterparts to lack coverage in both expansion and non-expansion states. Uninsured rates for AIAN people are similar in expansion and non-expansion states. Overall, the differences in coverage by expansion status are primarily driven by differences in coverage rates among adults ages 18-64. However, White, Hispanic, Black, Asian, and NHPI children in non-expansion states also are more likely to be uninsured than those in expansion states. For example, 13.5% of Hispanic children in non-expansion states are uninsured compared to 6.1% of Hispanic children in expansion states.

Health Coverage of People Under Age 65 by Race and Ethnicity and Medicaid Expansion Status, 2023

Eligibility for Coverage among the Uninsured as of 2023

There are opportunities to increase coverage by enrolling eligible people in Medicaid or Marketplace coverage, but eligibility varies across racial and ethnic groups, and many remain ineligible for assistance. Overall, six in ten people who were uninsured in 2023 were eligible for financial assistance either through Medicaid or through subsidized Marketplace coverage, while the remaining four in ten were not eligible because they fell in the Medicaid coverage gap in states that have not expanded Medicaid, they were deemed to have access to an affordable Marketplace plan or offer of employer coverage, or they were ineligible due to their immigration status. However, the share of the remaining uninsured eligible for assistance varied by race and ethnicity. For example, uninsured Black people under age 65 were more likely than their White counterparts to fall in the coverage gap in states that have not expanded Medicaid, and uninsured Hispanic and Asian people under age 65 were less likely than White people to be eligible for coverage options, in part, reflecting higher shares of noncitizens who face immigrant eligibility restrictions among these groups (Figure 4).

Eligibility for ACA Coverage Among Uninsured People Under Age 65 by Race and Ethnicity as of 2023

Uninsured Black people under age 65 are more likely than their White counterparts to fall in the Medicaid “coverage gap” because a greater share live in states that have not implemented the Medicaid expansion. As of November 2024, 10 states have not adopted the ACA provision to expand Medicaid to adults with incomes through 138% of poverty. Most of these states are in the South, where a higher share of the Black population resides (Figure 5). In these states, 1.4 million uninsured people with incomes under poverty fall into the “coverage gap” and do not qualify for either Medicaid or premium subsidies in the ACA Marketplace.

Share of Total Population Under Age 65 that is Black by State and Medicaid Expansion Status

Uninsured Asian, Black, Hispanic, and NHPI people under age 65 are less likely than their White counterparts to be eligible for coverage because they include larger shares of noncitizens who are subject to eligibility restrictions for Medicaid and Marketplace coverage (Figure 6). Lawfully present immigrants face eligibility restrictions for Medicaid coverage, with many having to wait five years after obtaining lawful status before they are eligible to enroll in Medicaid. Undocumented immigrants are not eligible to enroll in Medicaid and are prohibited from purchasing coverage through the Marketplaces.

Citizenship Status of Uninsured People Under Age 65 by Race and Ethnicity, 2023

Looking Ahead

Policies implemented amid the COVID-19 pandemic helped stabilize coverage and contributed to gains in coverage during this period. The coverage gains experienced during the COVID-19 pandemic were largely driven by an increase in Medicaid coverage, which offset declines in employer-sponsored coverage. As noted, temporary continuous enrollment provisions stabilized Medicaid coverage during the PHE, contributing to increases in enrollment. Additionally, the temporary enhanced subsidies for Marketplace coverage provided under ARPA, which were extended through 2025 under the IRA, also contributed to coverage gains. However, even with these gains, disparities in coverage remained.

Since the Medicaid continuous enrollment provision ended in March 2023, millions of people have been disenrolled. While there is limited data available on disenrollments by race and ethnicity, research suggests that Black and Hispanic people were two times more likely than White people to lose Medicaid due to being unable to complete the renewal process during the unwinding period. Many people who were disenrolled from Medicaid could find low-cost coverage on the ACA Marketplaces, including, in some cases, coverage with a zero (or near-zero) monthly premium requirement. However, others became uninsured. In focus groups, adults who were disenrolled from Medicaid reported losing coverage for a variety of reasons, including because they were no longer eligible; however, some believed they were still eligible and did not know why they were disenrolled. Many reported facing communication problems with their Medicaid agencies, and some who were disenrolled indicated that they faced gaps in coverage before reenrolling in Medicaid or became uninsured, which contributed to high out-of-pocket costs and difficulties accessing care that negatively impacted their health.

Going forward, racial and ethnic disparities in coverage could widen due to potential Medicaid cuts, expiration of the enhanced subsidies for Marketplace coverage, and immigration policy changes. The incoming Trump administration and Republican controlled Congress are signaling plans to make significant changes to Medicaid and the ACA. House Republicans appear to be considering large cuts to Medicaid, which could help offset the cost of extending expiring tax cuts but would shift a substantial amount of Medicaid spending from the federal government to states, and likely lead states to make reductions in eligibility and/or benefits. Further, if Congress does not take action to extend the enhanced ACA Marketplace subsidies, which are set to expire in 2025, premiums will rise, likely leading to an increase in the number of uninsured people. Additionally, the Trump administration’s changes to immigration policy, including increased enforcement, the rescission of protections from enforcement activity in sensitive locations including health care facilities, and potential changes to public charge policy, will likely lead to reduced enrollment in health coverage of lawfully present immigrants and citizen children in immigrant families. Medicaid and Marketplace coverage losses would likely lead to widening racial disparities in coverage given that disproportionately large shares of Hispanic, Black, AIAN, and NHPI people are covered through these sources, which, in turn, would likely contribute to widening disparities in health.

News Release

Eliminating the ACA Medicaid Expansion Match Could Reduce Total Medicaid Spending by Up To $1.9 Trillion Over 10 Years and End Coverage for 20 Million People 

Published: Feb 13, 2025

A new KFF analysis finds that a congressional proposal to significantly cut federal spending on the Affordable Care Act’s Medicaid expansion could reduce total Medicaid spending by up to nearly one-fifth, or $1.9 trillion, over a 10-year period, and end Medicaid coverage for as many as 20 million people.The impacts would be felt in both blue and red states and could effectively reverse and end the Medicaid expansion in most or all states that have adopted it.

Medicaid Watch

The analysis shows state-by-state estimates for two scenarios if Congress eliminates the ACA provision under which the federal government picks up 90% of the cost of covering the Medicaid expansion population and instead reimburses states at their traditional match rate, which ranges from 50% to 77%. 

  • The first scenario assumes that all states would maintain their Medicaid expansion by replacing lost federal dollars with increased state spending, meaning no enrollees would lose coverage.  That would result in a decrease in federal Medicaid spending of 10%, or $626 billion, across all states over a 10-year period, and a corresponding increase in collective state Medicaid spending of 17% (also $626 billion) over that time, according to the analysis.
  • The second assumes that states would not make up the funding shortfall resulting from federal spending reductions and drop the ACA Medicaid expansion. This would result in a 25% decrease in federal Medicaid spending, or $1.7 trillion, and a 5% decrease in state Medicaid spending, or $186 billion, across all states over a 10-year period. All told, total Medicaid spending would decline by nearly one-fifth, or $1.9 trillion, and 20 million people would lose coverage.

Only the 40 states and Washington D.C. that have adopted the Medicaid expansion would see any spending or enrollment impacts under the current proposal being considered by congressional Republicans. But as the analysis shows, the impacts in those states – which include 21 states that voted for President Donald Trump and 19 states plus D.C. that voted for former Vice President Kamala Harris – would vary considerably by state.

For instance, if states drop the Medicaid expansion, enrollment declines will range from 49% in Oregon to 19% in Massachusetts, Minnesota, North Carolina and South Dakota. In raw numbers, at the extremes, 5 million people in California could lose Medicaid coverage, compared to 24,000 in North Dakota and South Dakota.

Twelve states currently have “trigger” laws in place that would automatically end expansion or require changes if the federal match rate were to drop below 90%, but other states would also likely drop the expansion in response to the loss of federal funding. 

If states seek to preserve their Medicaid expansion, the lost federal funding that they would have to replace (over the 10-year period) would range from $129.4 billion in California to $953.4 million in South Dakota.  Other states that would see notable federal funding declines/increases in state spending include New York ($71.7 billion), Illinois ($40.9 billion), Pennsylvania ($27 billion), and Ohio ($20.1 billion) to name a few. (See the full list in Appendix Table 1.)

Eliminating the Medicaid expansion match is one of several options under consideration by Republicans in Congress to reduce Medicaid spending to help pay for an extension of the 2017 tax cuts. Medicaid provides health coverage to low-income Americans and accounts for nearly $1 out of every $5 spent on health care in the U.S. 

VOLUME 16

Federal Health Communications and ADHD Skepticism 

This is Irving Washington and Hagere Yilma. We direct KFF’s Health Information and Trust Initiative and on behalf of all our colleagues at KFF, we’re pleased to bring you this edition of our bi-weekly Monitor.


Summary

This volume examines the impact of recent executive actions on federal health communication, along with concerns and stigmas surrounding ADHD diagnoses and treatments, including skepticism about pharmaceutical influence on medication promotion. It also explores distrust in food regulations following the FDA’s ban on Red Dye No. 3.


Recent Developments

New Presidential Actions Limit the Scope of Health Communication from Federal Institutions

PM Images / Getty Images

Recent presidential actions have raised concerns about the federal government’s role in health communication, particularly its ability to regulate public health guidance and ensure access to certain health data. In response to several executive orders targeting diversity, equity, and inclusion (DEI) and gender, federal health agencies removed information and datasets related to topics like youth risk behaviors and HIV treatment guidance from their websites. The decision resulted in widespread criticism from health professionals, along with a lawsuit arguing that the data removals hinder medical research and patient care by creating a “dangerous gap in the scientific data.”

Early presidential actions also included an executive order limiting the federal government’s ability to address online misinformation, framing previous efforts as censorship and violations of constitutional rights. This move coincides with social media platforms scaling back fact-checking due to concerns about overreach and First Amendment rights. Together, these actions mark a shift in federal health communication, with increased political oversight and stricter limits on the federal government’s role in countering false or misleading health information.

Polling Insights:

KFF’s Health Misinformation Tracking Poll from March 2024 found that most adults (57%) say, “The U.S. government should require social media companies to take steps to restrict false health information, even if it limits people from freely publishing or accessing information,” while about four in ten (42%) say, “People’s freedom to publish and access health information should be protected, even if it means false information can also be published.” Partisans, however, are divided on this question: a majority of Democrats (73%) and independents (60%) are supportive of government intervention on this issue, while Republicans (38%) are much less likely to say the U.S. government should intervene in this way.

Majorities of Democrats and Independents Say the U.S. Government Should Require Social Media Companies To Restrict False Health Information, Six in Ten Republicans Prioritize the Freedom To Publish Information 

Social Media and Public Figures Influence Doubts About ADHD

ArLawKa AungTun / Getty Images

The increasing prevalence of attention-deficit hyperactivity disorder (ADHD) in the United States has fueled ongoing debate about whether behavioral differences are being overmedicalized. While ADHD is a well-documented neurodevelopmental disorder with established diagnostic criteria, some medical professionals have challenged existing self-report diagnostic tools and overdiagnosis in certain populations. Concerns about overdiagnosis often intertwine with doubts about pharmaceutical companies’ intentions for promoting ADHD medications, sometimes resulting in a misrepresentation of the condition itself.

Public concerns over ADHD medication are not new. In the 1970s, a Washington Post article incorrectly reported that five to ten percent of children in an Omaha, Nebraska, school district were receiving Ritalin or Dexedrine—two stimulant medications—to manage behavior. The article did not clearly explain that the percentage only reflected students in the school’s disability support program, generating panic that doctors were coercing parents to medicate their children. Tighter regulations on stimulant medications occurred around the same time, while some books linking hyperactivity to diet reinforced doubts about ADHD as a legitimate condition, even though research did not support this link.

Similar narratives exist today, where some claim that ADHD is an industry-driven diagnosis designed to expand medication sales. These doubts were reflected in social media discussions after a January 27th article by the Associated Press highlighted the growing number of people questioning whether they have ADHD. Some commenters accused the AP of contributing to a broader effort to normalize widespread medication use, with statements such as, “Whatever the case may be the solution is not to get everyone hooked on Meth,” and “seems like somebody wants us all medicated.” Similar doubts emerged after a recent U.K. study linked ADHD to a shorter life expectancy—while some viewed the study as evidence for the importance of treatment, others dismissed it as an attempt to justify increased stimulant prescriptions. 

Public figures have also contributed to this skepticism. During a recent episode of “Back to the People” with Nicole Shanahan, U.S. Senator Tommy Tuberville suggested that rising ADHD prescriptions, rather than firearms, could be responsible for school shootings. Similarly, during his Senate hearings as a nominee for Health and Human Services (HHS) Secretary, Robert F. Kennedy Jr. implied connections between mental health medications, such as antidepressants, and school shootings. Despite a lack of scientifically strong evidence supporting these claims, such narratives continue to spread on social media.

As conversations about ADHD treatment evolve, skepticism plays a role in shaping public perceptions, healthcare policies, and access to treatment options. Addressing these debates requires balancing concerns about overdiagnosis with recognition that ADHD treatment approaches, including but not limited to medication, can be beneficial for many.

FDA’s Red Dye No. 3 Ban Leads Some to Question the FDA’s Timeliness

Lighthouse Films / Getty Images

The public’s reaction to the FDA’s recent ban on FD&C Red No. 3 (Red Dye No. 3) highlights skepticism about the agency’s effectiveness as a food safety regulator amid concern over food dyes. The decision followed a 2022 petition citing studies that linked high doses of the dye to cancer in male rats. While the FDA notes that similar effects have not been found in other animals and there is no clear evidence of cancer risk in humans, the Delaney Clause prohibits additives linked to cancer in humans or animals. Despite these reassurances from the FDA, some see the ban as validating concerns about food dye risks and question why the FDA took so long to act. Others, while recognizing that the ban does not necessarily indicate harm at normal consumption levels, may still see it as reinforcing broader doubts about the agency’s ability to assess the safety of food and medications in the U.S.

Polling Insights:

KFF’s latest Health Tracking Poll shows bipartisan consensus among the public for prioritizing stricter limits on chemicals in food. About six in ten (58%) adults – including similar shares of Democrats, independents, and Republicans – say setting stricter limits on chemicals in the food supply should be a “top priority” for Congress and the Trump administration.

A Majority of Adults Across Partisans Say Setting Stricter Limits on Chemicals in the Food Supply Should be a Top Priority For Congress and Trump

Research Insights

Flagging Misinformation Influences Online Engagement

Jacques Julien / Getty Images

A study in Nature examined the impact of labeling online content as misinformation on subsequent engagement with information. Using data from Twitter (now X), researchers found that when a single person publicly responds to a post with a fact-check or correction, the original poster is likely to retreat into an information bubble, resulting in limited exposure to diverse content. In contrast, systems where multiple users review and approve a fact-check before it is shown to the original poster, such as Twitter’s Community Notes, do not have the same impact on information engagement. This may be because individual tags tend to be short and emotionally charged, while collective tags are more deliberative and neutral. The study suggests that while both methods address misinformation, collective tagging may better support long-term engagement with diverse information sources.

Source: Kim, J., Wang, Z., Shi, H., Ling, H. K., & Evans, J. (2025). Differential impact from individual versus collective misinformation tagging on the diversity of Twitter (X) information engagement and mobility. Nature Communications16(1), 973.

Low-Quality Health Information About Semaglutides in Spanish-Language TikTok Videos

Carolina Rudah / Getty Images

A study in Social Science & Medicine analyzed Spanish-language TikTok videos on semaglutide, a type 2 diabetes and weight loss medication, and found that most provided low-quality health information and promoted harmful social norms. The videos often depicted obesity as an individual issue and normalized semaglutide use without discussing associated risks or the need for professional healthcare consultation. Many videos also ignored lifestyle changes and emphasized pharmaceutical solutions. The researchers suggested stronger digital literacy programs and regulation of health-related content on social media, including more transparency from influencers and healthcare professionals to improve informed decision-making around these medications.

Source: Campos-Rivera, P. A., Alfaro-Ponce, B., Ramírez-Pérez, M., Bernal-Serrano, D., Contreras-Loya, D., & Wirtz, V. J. (2025). Quality of information and social norms in Spanish-speaking TikTok videos as levers of commercial practices: The case of semaglutide. Social Science & Medicine366, 117646.


AI & Emerging Technology

Addressing Inflated Sense of Proficiency and Bias Recognition as a Part of AI Literacy

sankai / Getty Images

AI literacy plays a large role in shaping how individuals perceive and interact with generative technologies like ChatGPT. This form of literacy enables individuals to make informed decisions and engage with AI responsibly by improving their understanding, use, and evaluation of AI technologies. However, as a study published in New Media & Society found, perceptions of AI proficiency can be skewed, with individuals often overestimating their own abilities compared to others. This self-other perceptual gap, driven by subjective rather than objective knowledge, can significantly influence attitudes towards AI and its regulation. For instance, those who perceive themselves as highly proficient in AI may be more confident in their ability to use such technologies, but this confidence can create challenges when it comes to accurately evaluating AI outputs or recognizing biases inherent in these systems. To address this gap, one proposed framework for AI literacy suggests there is a need for individuals to not only enhance their technical knowledge of AI systems but also develop a more robust perspective on how AI operates and how biases may be embedded within these systems. This more robust understanding of AI systems may help mitigate inflated perceptions of proficiency and encourage more informed, balanced interactions with AI technology.

About The Health Information and Trust Initiative: the Health Information and Trust Initiative is a KFF program aimed at tracking health misinformation in the U.S., analyzing its impact on the American people, and mobilizing media to address the problem. Our goal is to be of service to everyone working on health misinformation, strengthen efforts to counter misinformation, and build trust. 


View all KFF Monitors

The Monitor is a report from KFF’s Health Information and Trust initiative that focuses on recent developments in health information. It’s free and published twice a month.

Sign up to receive KFF Monitor
email updates


Support for the Health Information and Trust initiative is provided by the Robert Wood Johnson Foundation (RWJF). The views expressed do not necessarily reflect the views of RWJF and KFF maintains full editorial control over all of its policy analysis, polling, and journalism activities. The Public Good Projects (PGP) provides media monitoring data KFF uses in producing the Monitor.

Eliminating the Medicaid Expansion Federal Match Rate: State-by-State Estimates

Published: Feb 13, 2025

There are several options under consideration in Congress to significantly reduce Medicaid spending to help pay for an extension of expiring tax cuts. Medicaid is the primary program providing comprehensive health and long-term care to one in five people living in the U.S. and accounts for nearly $1 out of every $5 spent on health care. Medicaid is administered by states within broad federal rules and jointly funded by states and the federal government, meaning restrictions in federal Medicaid spending could leave states with tough choices about how to offset reductions. This analysis examines the potential impacts on states and Medicaid enrollees of one prominent proposal, which would eliminate the 90% federal match rate for the Affordable Care Act (ACA) expansion, which currently covers over 20 million people. Key takeaways include:

  • This analysis explores the impact of eliminating the ACA expansion match rate under two scenarios. The first assumes that states maintain Medicaid expansion coverage and pick up new expansion costs, resulting in a decrease of 10% (or $626 billion) in federal Medicaid spending and an increase of 17% (or $626 billion) in state Medicaid spending across all states over a 10-year period.
  • The second scenario assumes that states drop the ACA Medicaid expansion in response to the elimination of the 90% federal match rate. This would result in a 25% (or $1.7 trillion) decrease in federal Medicaid spending and a 5% (or $186 billion) decrease in state Medicaid spending across all states over a 10-year period. This would also cut total Medicaid spending by nearly one-fifth (or $1.9 trillion), and nearly a quarter of all Medicaid enrollees (20 million people) would lose coverage.
  • Only states that have adopted the Medicaid expansion would see any spending or enrollment impacts under this policy proposal, though changes vary by state.

What is the proposed policy change?

States that have implemented the ACA Medicaid expansion currently receive a 90% federal match rate or “FMAP” for adults covered through the expansion, meaning the federal government pays 90% of the costs for expansion enrollees. The ACA expanded Medicaid coverage to nearly all adults with incomes up to 138% of the Federal Poverty Level ($21,597 for an individual in 2025). However, a Supreme Court ruling effectively made the decision to implement the Medicaid expansion an option for states. Forty-one states (including DC) have since adopted Medicaid expansion, and Medicaid expansion enrollees represent nearly a quarter of Medicaid enrollment (as of March 2024) and one-fifth of total Medicaid spending (as of FY 2023). The FMAP for services used by people eligible through traditional Medicaid is determined by a formula set in statute. The formula is designed so that the federal government provides a match rate of at least 50% and provides a higher match rate for states with lower average per capita income. For FY 2026, the traditional FMAP will range from 50% to 77%.

This analysis estimates the impact of eliminating the enhanced FMAP for adults in the Medicaid expansion. The analysis assumes that, starting in FY 2026, expenditures for people eligible in the Medicaid expansion would be matched at each state’s traditional 2026 FMAP rate. Details regarding the design of this policy change have yet to be released, and the details of proposed legislation may differ from the assumptions made to complete this analysis. This is also only one of the various Medicaid policy changes that have been suggested and estimates would change if multiple policies were considered together.

What are the potential impacts on Medicaid spending and enrollment?

This analysis does not make assumptions about specific state behavioral responses and instead examines the impact of eliminating the ACA expansion match rate under two scenarios. These scenarios are designed to illustrate the range of potential policy change effects; in practice, each state may respond to the policy change differently. While some states may choose to continue ACA Medicaid expansion coverage with substantially reduced federal funding, many likely would not given the extra spending that would be required. The analysis also excludes secondary effects such as people who lose coverage through the Medicaid expansion enrolling in Medicaid under other eligibility pathways or enrolling in private health coverage. The estimates presented here are not directly comparable to the estimates of federal savings from the Congressional Budget Office (CBO) because CBO’s estimates account for assumptions about state behavioral responses and other secondary effects.

  • Scenario 1: All expansion states pick up new expansion costs. Expansion enrollment and total spending would remain constant while costs shift from the federal government to the states.
  • Scenario 2: All states drop the ACA Medicaid expansion, resulting in changes to enrollment as well as total, federal, and state spending.

Eliminating the enhanced FMAP for adults in the Medicaid expansion could reduce Medicaid spending by nearly one-fifth ($1.9 trillion) over a 10-year period and up to nearly a quarter of all Medicaid enrollees (20 million people) could lose coverage. Under scenario 1, federal Medicaid spending would decrease by $626 billion or 10% across all states over the 10-year period, with the federal government providing matching funds at the standard rate rather than 90%. If all states picked up those costs and retained the Medicaid expansion, that would mean an additional $626 billion in state spending or a 17% increase in state spending across all states over the 10-year period. Under scenario 2, all state and federal financial support for Medicaid expansion is withdrawn, resulting in a $1.7 trillion dollar or 25% cut to federal Medicaid spending and a $186 billion dollar or 5% cut to state Medicaid spending across all states, including non-expansion. Combined, Medicaid spending would decrease by 18% or $1.9 trillion over the 10-year period. The cuts are even larger when looking among expansion states alone, resulting in a 31% decline in federal spending, a 6% decline in state spending, and a 22% decline in total spending. Under this scenario, an estimated 20 million Medicaid enrollees eligible through expansion would lose coverage, decreasing total Medicaid enrollment by 24% (by year 10).

Eliminating the ACA Expansion Match Rate Could Reduce Total Medicaid Spending by Nearly One-Fifth Over 10-Year Period

Only states that have adopted the Medicaid expansion would see any spending or enrollment impacts under this policy proposal, though changes vary by state (Figure 2 and Appendix Table 1). The 10 states, primarily in the South, that have not expanded Medicaid under the ACA would see no change. Enrollment under scenario 1 would not change from baseline projections with states picking up the extra cost, but enrollment declines under scenario 2 vary by state, ranging from a decrease in estimated total Medicaid enrollment by year 10 of 19% in Massachusetts, Minnesota, North Carolina, and South Dakota to 49% in Oregon. The number of enrollees that could lose coverage ranges from 5 million in California to 24 thousand in North Dakota and South Dakota. (This analysis includes all states that had expanded Medicaid as of February 2025. In practice, there could also be effects in states that expand Medicaid in the years after 2025. In its baseline projections of Medicaid enrollment and spending, CBO assumes some states will continue to expand Medicaid but does not specify which states those are.)

Eliminating the ACA Expansion Match Rate Could Reduce Total Medicaid Enrollment By 19% to 49% Across Expansion States

What are other implications to consider?

Twelve states currently have “trigger” laws in place that would automatically end expansion or require changes if the federal match rate were to drop, but coverage would be at risk in other states given the substantial loss of federal funding. Not all trigger laws would immediately end the Medicaid expansion, but enrollees in states with trigger laws are at greater risk of losing coverage. States are actively debating their Medicaid expansion trigger laws, with some states working to remove and others working to establish the automatic termination of Medicaid expansion coverage if federal support declines.

If states maintained their Medicaid expansion coverage in the wake of this policy change, they would need to find ways to offset the loss of federal funding. This could include increasing state tax revenues or decreasing spending on non-Medicaid services such as education, which is the largest source of expenditures from state funds. States could alternatively decrease Medicaid coverage for other groups, eliminate coverage of optional benefits such as prescription drugs and home care, or reduce provider payment rates. Given the size of the federal funding cut, states would face significant challenges in efforts to replace the loss of federal funds, which would be exacerbated if paired with other reductions in federal funding for Medicaid or in other areas such as education.

If states are unable to maintain Medicaid expansion coverage (or terminate expansion due to a trigger law), the number of uninsured would increase and could reverse gains in financial security, access to care, and health outcomes associated with Medicaid expansion. In all states, some of the people who lose expansion eligibility may qualify for Medicaid under a different eligibility pathway, for example based on a disability, but some of those people may only qualify for partial Medicaid benefits such as coverage of family planning services or breast and cervical cancer screening and prevention. Other enrollees with incomes between 100% and 138% of poverty could be eligible for coverage through the ACA marketplaces, but ACA coverage will soon become more costly for enrollees if the enhanced subsidies expire at the end of 2025.  Enrollees with incomes below poverty could fall into the coverage gap. Research shows that after losing Medicaid, many people become uninsured. Increasing numbers of uninsured people could lead to loss of revenues and increased uncompensated care costs for providers. A large body of prior research shows that Medicaid expansion has helped to reduce the uninsured rate and improve health care access, affordability, and financial security among the low-income population. More recent research shows improvements in health outcomes and continues to show positive effects for providers (particularly rural hospitals) and for sexual and reproductive health. Because of the widespread adoption of the Medicaid expansion across states, the financial and coverage impacts will fall on states that voted for President Trump and those that voted for former Vice President Harris.

Appendix

Changes in Medicaid Spending and Enrollment Due to Eliminating the ACA Expansion Match Rate by State

Methods


Data: To project Medicaid enrollment, spending, and spending per enrollee by state and eligibility group, this analysis uses the Medicaid CMS-64 new adult group expenditure data collected through MBES for FY 2023 (downloaded in December 2024), Medicaid new adult group enrollment data collected through MBES for June 2024 (downloaded in December 2024), the 2019-2021 T-MSIS Research Identifiable Demographic-Eligibility and Claims Files, and the June 2024 Congressional Budget Office (CBO) baseline.

Overview of Approach:

  • Develop baseline projections of Medicaid enrollment, spending, and spending per enrollee by state and eligibility group from FY 2025 through FY 2034 (a 10-year period). This model estimates Medicaid enrollment and spending under the status quo with no policy changes.
  • Estimate Medicaid enrollment, spending, and spending per enrollee by state and eligibility group over the same 10-year period after accounting for the effects of proposed policy changes.
  • Calculate differences in Medicaid enrollment, spending (including federal, state, and total spending), and spending per enrollee in the policy change scenario relative to the baseline projections.
  • The estimates do not predict states’ responses to federal policy changes, but we examine differences in Medicaid enrollment, spending, and spending per enrollee under different scenarios to reflect the range of outcomes depending on state responses.

Definitions and Limitations:

  • At the time of publishing, CBO had released their January 2025 baseline. However, this analysis uses CBO’s June 2024 baseline because it was the most recent baseline with spending projections by Medicaid eligibility group.
  • The estimates assume that all states experience the same growth rates for Medicaid enrollment and spending; and that total spending grows at the same rate as federal spending.
  • FMAP calculations do not account for the other services that are matched at a higher rate, which include family planning, services received through an Indian Health Services facility, expenditures for Medicare beneficiaries enrolled in the “Qualifying Individuals” program, and health home services that are matched at a 90% rate. For this reason, the model may underestimate the federal share of spending in some states.
  • Estimates of total spending include all spending that is matched as medical assistance but exclude states’ administrative costs which are matched at a separate rate. Federal payments for administrative costs are less than 4% of total federal spending, according to the CBO June 2024 baseline.
  • The analysis does not account for secondary effects or people’s behavioral responses.
  • The analysis does not include policy effects for states that had not expanded Medicaid under the ACA as of February 2025 but would have done so in the absence of the policy change.
  • We implement the policy change scenarios in FY 2026 and assume they take effect immediately.

We provide more details about the baseline model below.

  1. Estimate initial Medicaid spending and enrollment by eligibility group using the most recent years’ data available (FY 2023 for spending data and FY 2024 for enrollment data).
  •  First, we pull the quarterly Medicaid CMS-64 new adult group expenditure data collected through MBES for FY 2023 and aggregate total spending by state for enrollees in the ACA expansion group and for all other Medicaid enrollees. Spending reflects an accrual basis of accounting.
  • We exclude spending on DSH by calculating the share of spending on DSH from the FY 2023 CMS-64 Financial Management Report and reducing medical assistance among non-expansion enrollees by that share.
  • Separately, we pull the Medicaid new adult group enrollment data collected through MBES for June 2024. This data includes enrollment by state and is broken into ACA expansion group enrollees and all other Medicaid enrollees. MBES enrollment includes individuals enrolled in limited benefit plans and only includes individuals whose coverage is funded through Medicaid (not CHIP).
  • To obtain spending and enrollment estimates across the remaining eligibility groups (seniors, individuals with disabilities, children, and other adults), we apply the distribution of spending and enrollment across the groups and by state from T-MSIS to the FY 2023 spending data and June 2024 enrollment data. We use the average distribution from 2019 to 2021 to mitigate the impact of the continuous enrollment provision (data in states denoted as “unusable” for a given year by the DQ atlas were excluded from the averages).
  1. Calculate initial spending per enrollee in FY 2024.
  • We grow Medicaid spending in FY 2023 by CBO’s growth rates for federal benefit payments by eligibility group to get Medicaid spending in FY 2024. The June 2024 enrollment data is used as our FY 2024 enrollment.
  • We divide Medicaid spending in FY 2024 by Medicaid enrollment in FY 2024 (for each state and eligibility group) to get Medicaid spending per enrollee in FY 2024.
  1. Project total spending and spending per enrollee for fiscal years 2025 through 2034 using CBO growth rates and use those estimates to calculate future years’ enrollment.
  • Starting with spending data for FY 2024, we apply the CBO growth rates to estimate Medicaid spending in FY 2025 through FY 2034.
  • Starting with per enrollee spending in FY 2024, we apply the CBO growth rates for average federal spending on benefit payments per enrollee to estimate Medicaid spending in FY 2025 through FY 2034.
  • We calculate enrollment growth in FY 2025 through FY 2034 by dividing estimated Medicaid spending by estimated spending per enrollee.
  1. Split total Medicaid spending over the 10-year period into federal and state spending.
  • We calculate federal and state spending by using a 90% match rate for the ACA expansion group and the traditional state FMAPs for the remaining eligibility groups. We use the FY 2025 FMAPs for FY 2025 and FY 2026 FMAPs for FY 2026 and beyond.

We provide more details about the policy change scenarios below.

  1. Calculate spending and enrollment under scenario 1 (ACA expansion states pick up new expansion costs) by state.
  • Assume expansion enrollment and total spending remain the same as the baseline model over the 10-year period.
  • Split total Medicaid spending (from baseline) into federal and state spending.  We assume the policy change takes effect in FY 2026, so FY 2025 federal and state spending is the same as baseline.
  • Starting in FY 2026, we apply the 2026 traditional state FMAPs to the expansion group spending instead of the 90% rate to split total spending into the federal and state share. For the expansion group, spending shifts from the federal to state governments. Spending for all other eligibility groups remains unchanged.
  1. Calculate spending and enrollment under scenario 2 (all states drop the ACA Medicaid expansion) by state.
  • Expansion enrollment is reduced to zero for FY 2026 – FY 2034, leading to zero total spending for expansion enrollees for FY 2026 – FY 2034.
  • Spending and enrollment for all other eligibility groups remains unchanged.
  1. Calculate differences in Medicaid enrollment and spending (including federal, state, and total spending) relative to the baseline projections.