Forthcoming Policy Changes to Medicaid State Directed Payments
The 2025 reconciliation law reduced federal Medicaid spending by an estimated $911 billion from 2025 through 2034, some of which stems from new restrictions on Medicaid state directed payments (SDPs) for hospital and other health care services. While states are generally prohibited from directing how managed care organizations (MCOs) pay for care, states can implement SDPs that require MCOs to increase rates or set minimum rates for specified Medicaid services. In authorizing SDPs, the Centers for Medicare and Medicaid Services (CMS) aimed to help states improve access to care and provider participation. Many states that contract with MCOs use SDPs to make uniform rate increases that function like supplemental payments in fee-for-service (FFS) Medicaid.
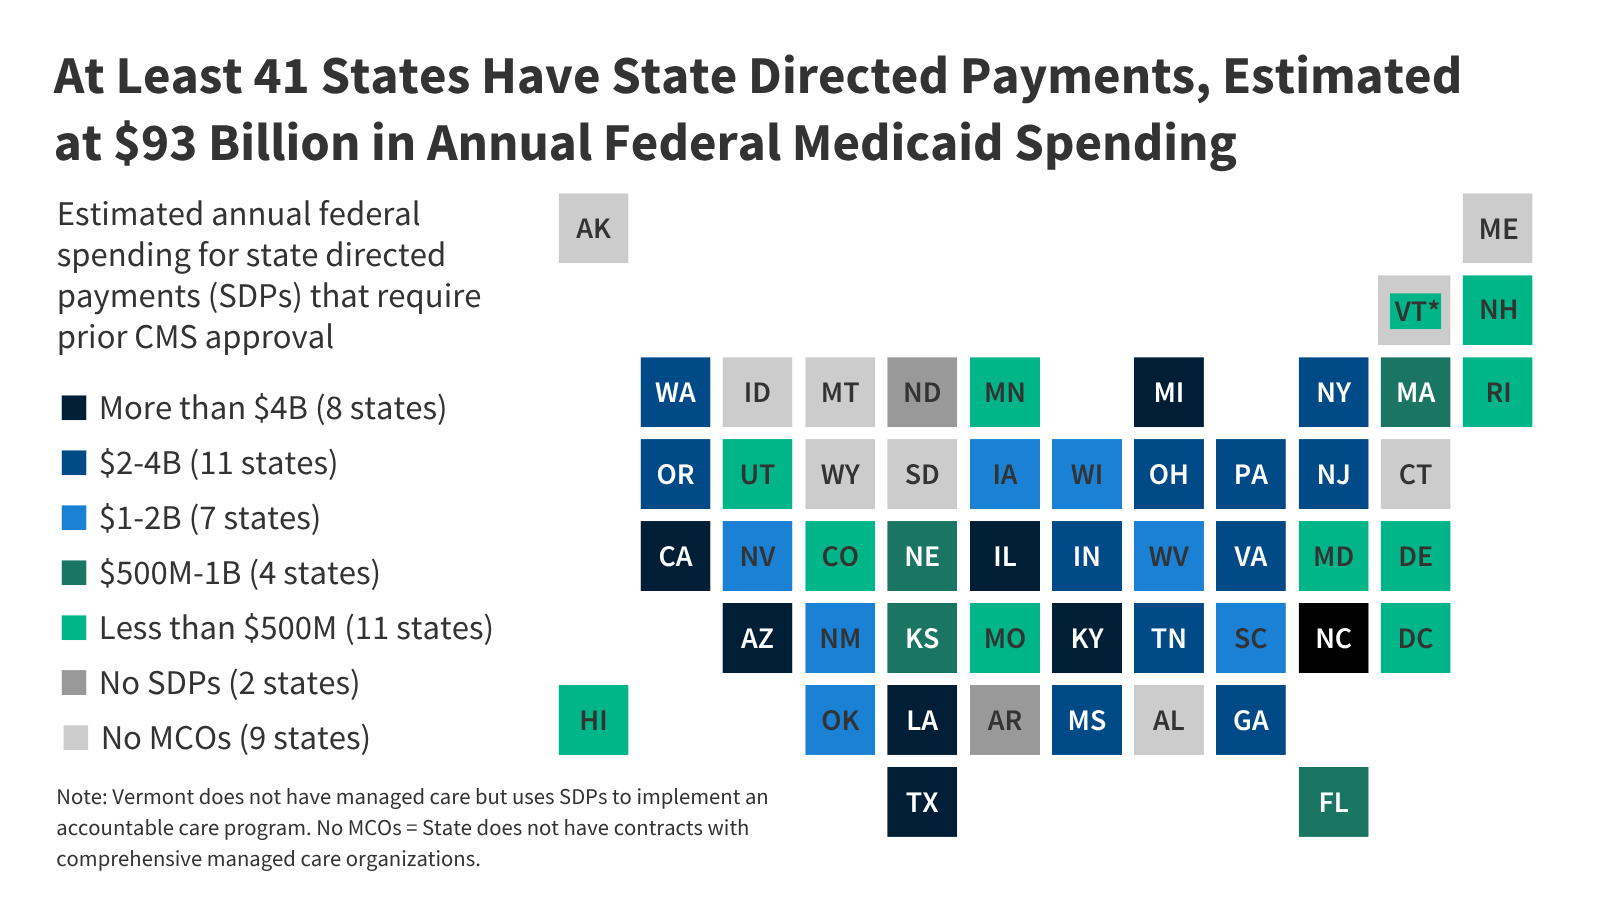
This issue brief describes SDPs and forthcoming policy changes stemming from the 2025 reconciliation law and the proposed regulation to implement those requirements and make other changes. A companion issue brief describes states’ current spending on SDPs before those policy changes take effect. Key takeaways include:
- In 2016, CMS established SDPs and their use has grown since, contributing to higher federal Medicaid spending.
- A 2024 rule on Medicaid managed care spurred additional spending on SDPs but also established new restrictions on how states could pay MCOs to implement them.
- The 2025 reconciliation law established new limits on SDPs, capping them at or near Medicare rates.
- CMS released a proposed rule in May 2026 to implement the SDP provisions in the law and included several provisions that would expand the scope of new limits on SDPs, estimating that implementing the changes would reduce federal spending by $510 billion between 2026 and 2034.
- CMS’ estimated reductions in federal spending exceed those of the Congressional Budget Office (CBO) that accompanied the 2025 reconciliation law, but differences reflect variation in data and timing in addition to provisions that would expand the scope of SDP limits.
It is unknown how states and providers will respond to the new limits on SDPs and FFS Medicaid in the reconciliation law and accompanying rule. States may try to offset reductions in SDPs with increases in base payment rates, but offsetting reductions may be challenging due to other Medicaid financing changes (like limits on provider taxes) and more tenuous fiscal conditions. Some financially vulnerable providers could be forced to close or curtail services with less revenue from Medicaid, particularly if there are revenue losses from increases in the number of people without health insurance coming from Medicaid work requirements and reductions to Affordable Care Act premium subsidies. Other providers may be able to absorb reduced payments without changes to quality or access because research—including by KFF—suggests that average commercial rates are much higher than Medicare, reflecting consolidation in provider markets and constrained Medicare rates. However, providers that serve primarily Medicaid enrollees often have lower operating margins and may be more financially vulnerable than other providers, suggesting that safety net providers may be especially affected by the reduced revenues.
What are state directed payments (SDPs)?
The Centers for Medicare and Medicaid Services (CMS) established SDPs in 2016, allowing states to put in place requirements governing MCO payments to providers. States may use SDPs to require MCOs to adopt minimum or maximum payment rates for providers, provide uniform dollar or percentage increases to providers that supplement base payment rates, or implement value-based payment arrangements. The most common type of SDPs requires uniform rate increases that function similarly to supplemental payments in FFS Medicaid. Uniform rate increases instruct MCOs to make payments on top of their regular payment rates. They, along with SDPs that establish minimum or maximum fee schedules, require the state to specify a “benchmark.” Benchmarks are standardized rates to measure MCO rates relative to other payment rates such as Medicaid FFS, Medicare FFS, or average commercial rates. Since they were introduced in 2016, SDPs have become a core component of provider reimbursement in Medicaid (see Appendix for a timeline of SDP history).
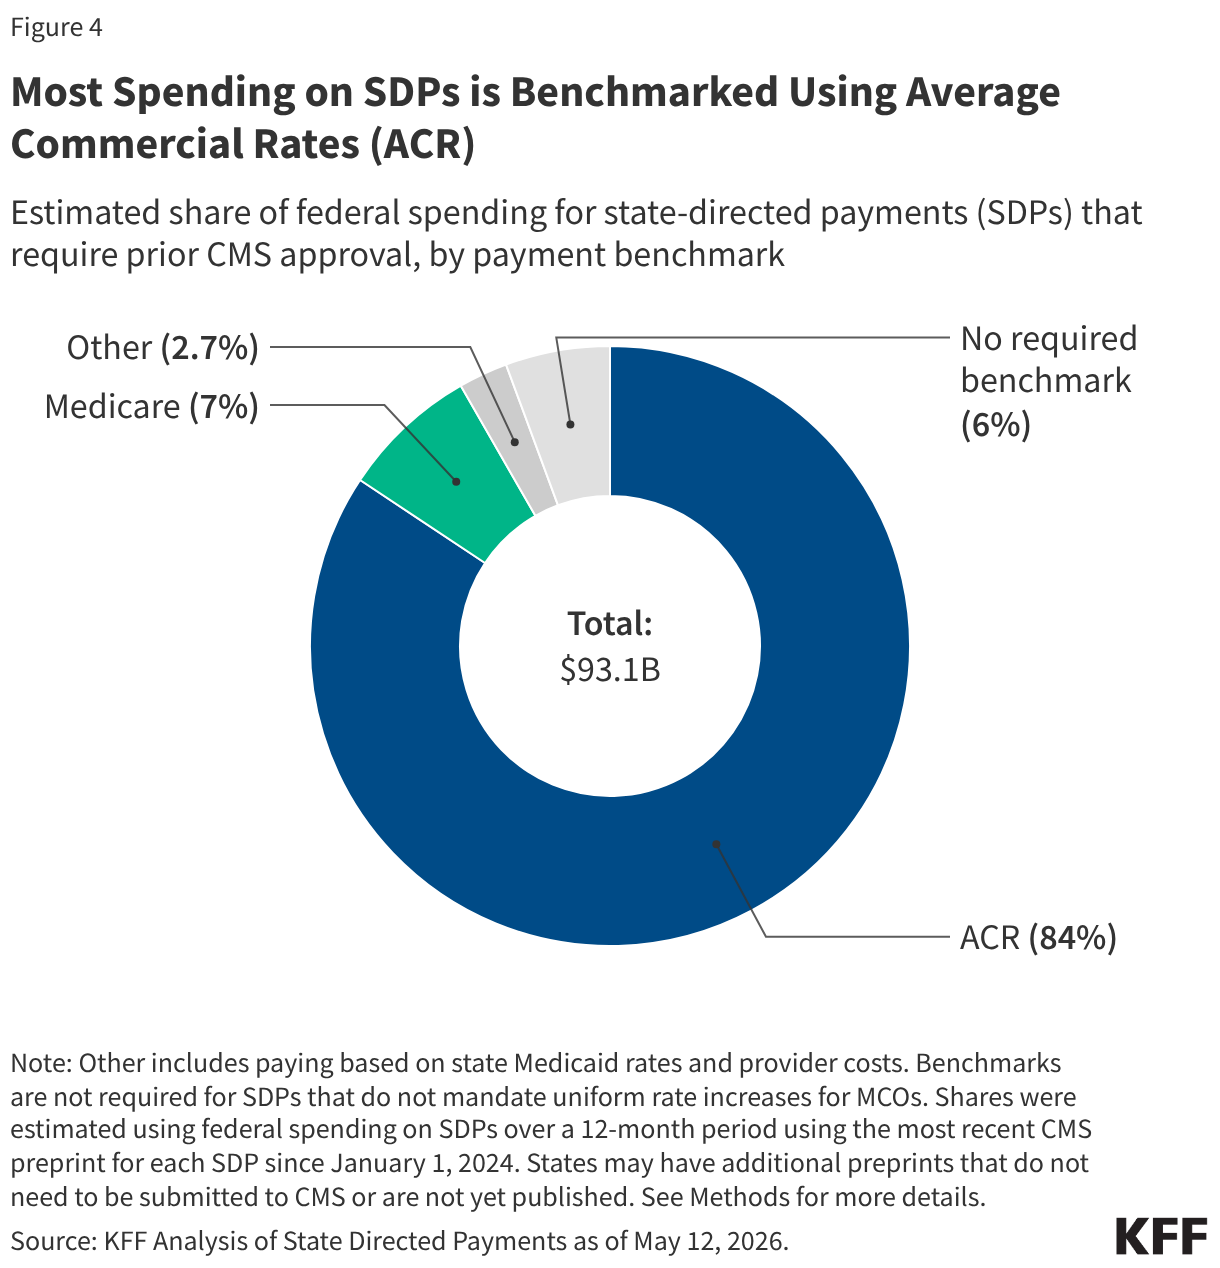
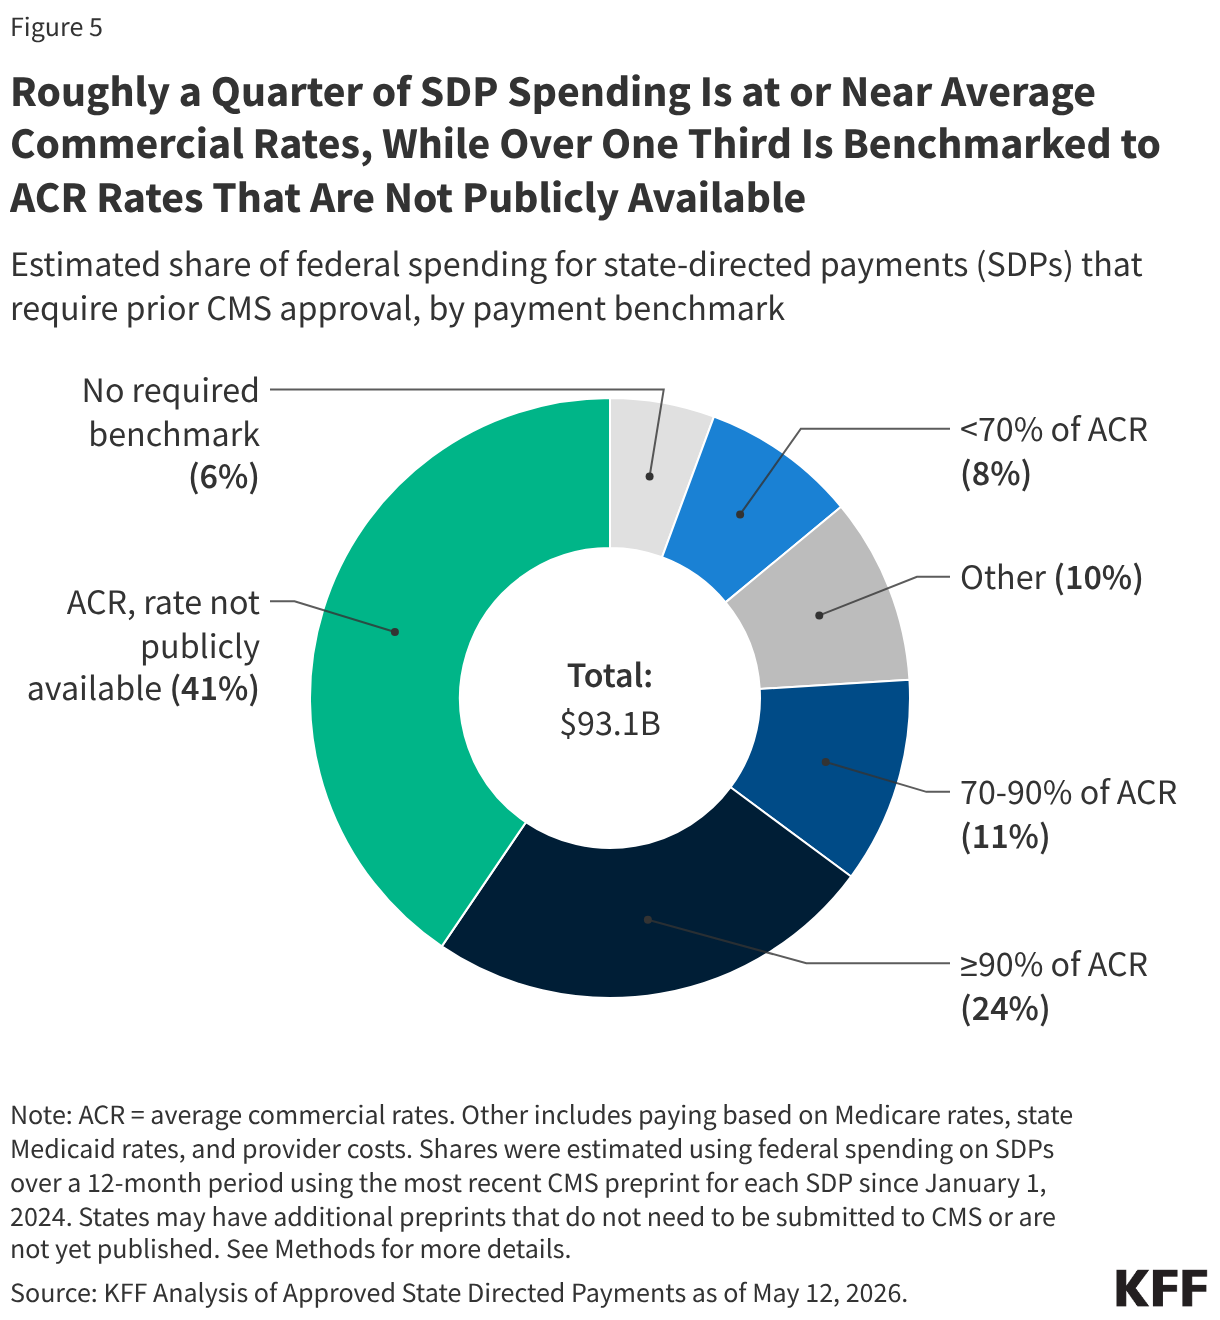
A 2024 rule on Medicaid managed care spurred changes in SDP policy and higher federal spending on SDPs. Before 2024, there was no official cap on the total payment rate that accounted for base rates and SDPs, but CMS noted in the May 2026 proposed rule that it determined to use average commercial rates as the unofficial payment limit starting in 2018. The 2024 rule on Medicaid managed care codified the average commercial rate limit for hospital services, nursing facility services, and professional services at academic medical centers. CMS also indicated that it would continue applying the average commercial rate limit to other providers. Formalizing the payment limit for SDPs at average commercial rates likely increased states’ awareness of the limit and their confidence that SDPs at that level would be permitted to continue moving forward. As a result, the number of SDPs pegged to average commercial rates, and spending on those SDPs, increased after CMS released the final rule.
The 2024 rule also required states to incorporate all SDPs into their capitation rates (e.g., premium payments to MCOs) instead of using separate payment terms, which provide additional payments outside of the capitation rates. The change moves these payments from predictable, separate payments to more complex, risk-based arrangements, which may reduce states’ ability to target reimbursement for specific provider types. CMS eliminated separate payment terms due to concerns that the separate payments undermine the risk-based nature of managed care and are frequently driven by the financing of the non-federal share. MACPAC analysis found that over half of SDP arrangements approved between February 2023 and August 2024 were incorporated through separate payment terms.
Use of SDPs that paid providers with average commercial rates had been growing prior to the 2024 final rule and continued after CMS’ informal practice was codified. Tying payments to average commercial rates—which are substantially higher than the Medicare payment ceiling used for other Medicaid FFS supplemental payments—aimed to help Medicaid attract a broader network of providers and to ensure robust access to care for Medicaid enrollees. However, the new payments to health care providers resulted in higher Medicaid spending. In June 2024, the Congressional Budget Office (CBO) updated its Medicaid spending projections for 2025-2034 to reflect a 4% (or $267 billion) increase, with half of the increase attributed to expected growth in SDPs (driven in part by CMS’ projections in the final rule).
What changes to SDPs were included in the 2025 reconciliation law and CMS’ proposed regulations?
The 2025 reconciliation law created new payment limits for SDPs for four services, capping them at or near Medicare rates instead of average commercial rates. The law specified that the new limits would apply to inpatient and outpatient hospital services, nursing facility services, and professional services at academic medical centers. Under the limits, the total payment amount under the SDP may not exceed 100% of the Medicare payment rate in states that have adopted the Affordable Care Act (ACA) Medicaid expansion (“expansion states”) and 110% of the Medicare payment rate for non-expansion states. Payment rates for services without an applicable Medicare payment rate are limited to Medicaid fee-for-service rates. Certain SDPs are initially grandfathered (e.g., allowed to continue) but the total spending amount will be reduced by 10 percentage points each year (starting January 1, 2028) until they reach the allowable Medicare-related payment limit. At the time the bill was passed, the CBO estimated that revising the payment limit for SDPs would reduce federal Medicaid spending by $149 billion between 2025 and 2034.
CMS released a proposed rule in May 2026 to implement the SDP provisions in the law and included several provisions that would expand the scope of new limits on SDPs. The list below highlights some of the key provisions governing SDPs included in the proposed rule:
- Expanded scope of services. The 2025 reconciliation law specified that new limits applied to hospital services, professional services at academic medical centers, and nursing facility services. The proposed rule would apply the new payment limits to all services.
- Applicable in territories. The 2025 reconciliation law only applied to the 50 states and D.C., but the proposed rule would also apply to the territories. In FY 2025, Puerto Rico had four SDPs approved, which were projected to account for $131 million in federal Medicaid spending.
- Eliminates uniform rate increases. The 2025 reconciliation law established new ceilings on SDP payment limits but did not prohibit certain types of SDPs from being used. The proposed rule would eliminate uniform rate increases in future years, the most common type of SDP. It is unclear whether it will be possible for states to transition uniform rate increases to other types of SDPs, such as minimum or maximum fee schedules. When combined with the elimination of separate payment terms from the 2024 rule, this change effectively precludes states from using SDPs to provide supplemental payments in managed care that parallel arrangements in FFS.
- Phase-down of grandfathered SDPs. Starting with the first rating period after January 1, 2028, the proposed rule would reduce the total approved payment amount in grandfathered SDPs by 10% each year until they comply with the new limits in the 2025 reconciliation law. For example, if an SDP was approved at $1 billion, the first year’s decrease would be at least $100 million (unless the Medicare limit is reached in year 1 with a decrease of less than $100 million). This will cause some SDPs (particularly benchmarked to higher payment rates) to come into compliance somewhat earlier than if the SDP payment rate had been reduced by 10 percentage points (relative to Medicare rates) each year.
Beyond expanding the scope of new limits on SDPs, CMS’ proposed rule makes parallel changes for FFS payments that target specific providers. The proposed rule aims to align payment requirements across delivery systems by applying the Medicare-based payment limits for SDPs to some FFS payments (which govern all provider payments, not only supplemental payments). The new limits would apply to payments that target specific providers such as physicians, dentists, emergency and non-emergency medical transportation providers, and other licensed professionals. The new limits would not apply to payments that are already governed by other limits (e.g., upper payment limit rules). Those requirements would take effect for the first state fiscal year beginning on or after January 1, 2029.
The proposed rule also specifies the basis for new payment limits in SDPs and in FFS Medicaid payments that target specific providers. Both types of payment limits would apply on a per-service (or per-discharge) basis, rather than being calculated in aggregate using an upper payment limit-like approach. Where possible, states would be required to use the published Medicare payment rates, drawing from the Medicare physician fee schedule, the hospital inpatient and outpatient prospective payment systems, and the skilled nursing facility prospective payment system. For providers who are paid based on their costs, such as critical access hospitals, cancer hospitals, and freestanding hospitals; states are instructed to use the Medicare cost reports as Medicare does.
Although most of the limits would be calculated similarly in SDPs and in targeted FFS Medicaid payments, there are some small differences. The most notable difference occurs when there are no Medicare payment rates available, as occurs for services that Medicaid covers but Medicare does not. In such instances, SDP payments would be limited to Medicaid FFS rates, which include rates established by 1115 waivers but exclude any supplemental payments. For FFS payments targeting specific providers, states would be required to develop methods for identifying reasonably comparable Medicare rates, which would then be the basis for the payment limit.
How might forthcoming changes affect federal spending on SDPs in the future?
In its May 2026 proposed rule, CMS estimates that SDP changes would reduce federal Medicaid spending by $510 billion between 2026 and 2035. Several factors contribute to the differences between CMS estimates and CBO’s estimate of limiting SDPs in the 2025 reconciliation law (which was $149 billion through 2034).
- The CMS estimates account for SDPs in preprints available through December 31, 2025. During the 2025 calendar year, many states submitted new SDP proposals (some of which were submitted during deliberations on the reconciliation bill in anticipation of future restrictions). CMS posted many newly approved SDPs after the reconciliation law was enacted, some of which were posted 6 to 12 months after their start date. As a result, there are more SDPs in place than was known during deliberations over the 2025 reconciliation law.
- The CMS estimates are through 2035. Most of the estimated reductions in federal spending on SDPs do not start until FY 2028. As a result, the period between 2026 and 2035 will have an additional year of substantive changes in SDP spending relative to earlier estimates. In CMS’ year-by-year analysis, the estimated cuts to federal Medicaid spending from limiting SDPs are $81 billion in the year 2035, which would not have been included in the CBO analysis.
Beyond using different data and covering a different period, CMS provides estimates for some but not all specific provisions and policy decisions included in the rule. It is unknown how much the new provisions contribute to the cost difference because CMS did not itemize the effects of all decisions in the proposed rule. For example, one of the most significant decisions was to eliminate the option for states to use uniform rate increases in SDPs after the new limits are fully implemented. When combined with other policies (including the 2024 prohibition on separate payment terms), this change effectively eliminates the option for states to use SDPs to make supplemental payments in Medicaid managed care. The effects of this change interact with other policy changes (including changes to provider taxes) so it’s difficult to quantify how much this affected CMS’ estimates.
In some cases, the proposed rule describes how much certain decisions affected estimated spending reductions:
- The biggest single change in dollar terms is the acceleration of grandfathering requirements which will bring SDPs into compliance with the new Medicare-related limits more quickly (estimated to increase the spending reduction by $17 billion over 10 years).
- CMS estimated that extending the new limits on SDPs to services other than the four enumerated in the law would increase spending reductions by $3.5 billion over 10 years.
New limits on FFS payment rates could reduce federal spending by $1.5 billion over 10 years. CMS estimates that 25 states would have to amend state plans to come into compliance, and that the change would reduce federal Medicaid spending by $1.5 billion over 10 years. Although $1.5 billion seems small compared to the total reduction in federal Medicaid spending, the affected providers account for much smaller shares of overall Medicaid spending. As a result, there could be major implications for affected services in affected states.
This work was supported in part by Arnold Ventures. KFF maintains full editorial control over all of its policy analysis, polling, and journalism activities.