How Medicare Advantage Rebates Disadvantage Medicare’s Stand-Alone Drug Plan Market
Medicare Advantage Rebates Undermine Competition with Stand-Alone Drug Plans by Lowering Medicare Advantage Drug Plan Premiums
The Medicare Part D prescription drug benefit was designed to offer Medicare beneficiaries the choice of drug coverage from either stand-alone prescription drug plans (PDPs) for people in traditional Medicare or Medicare Advantage prescription drug plans (MA-PDs) that offer both medical and drug benefits, with plans competing on premiums, coverage, and cost sharing. Increasingly, however, PDPs and MA-PDs are competing on uneven terms, in part because the payment system for Medicare Advantage plans enables MA-PDs to lower Part D premiums or reduce Part D cost sharing, making drug coverage from Medicare Advantage plans appear considerably cheaper, or even premium-free, to the beneficiary. The payment advantage for MA-PD sponsors makes it harder for PDP sponsors to compete on premiums, which may be especially challenging when all Part D plan sponsors are facing more cost pressures associated with a redesigned Part D benefit that shifted more costs onto plans and the loss of rebates for selected drugs under the Medicare Drug Price Negotiation program.
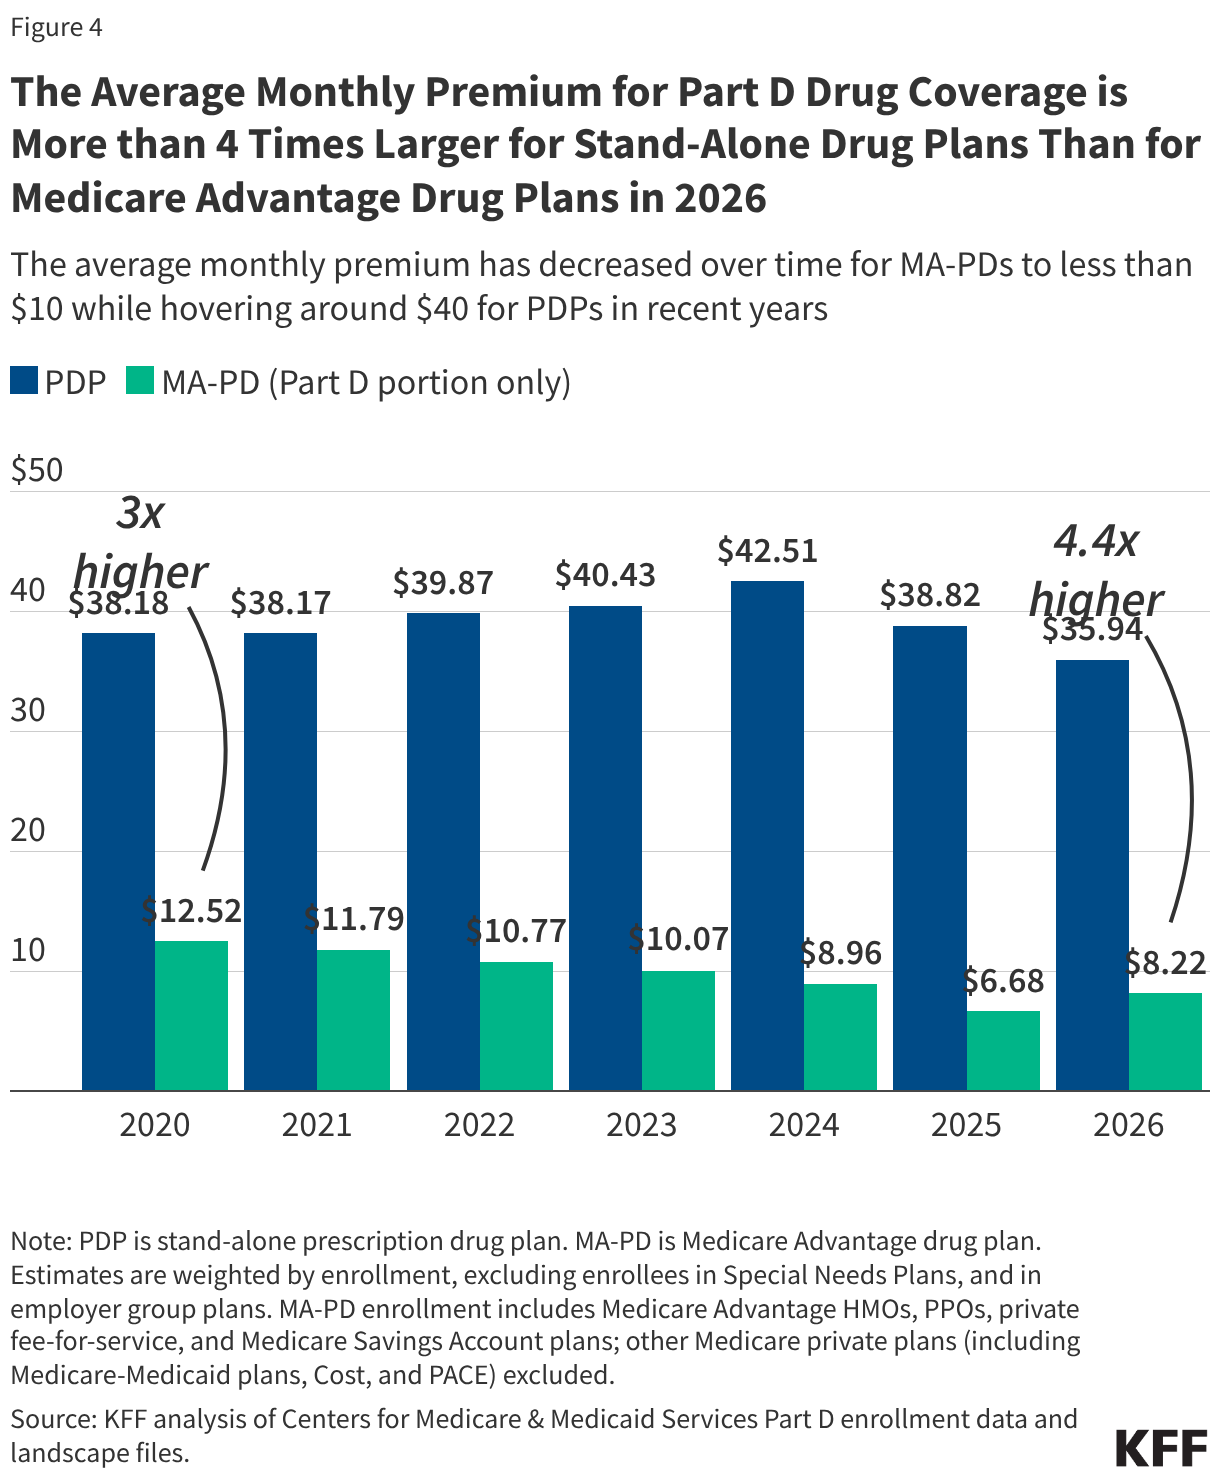
The federal government has recently taken steps to mitigate premium increases for Part D coverage, through both a provision in law capping annual growth in the base beneficiary premium to 6% for PDPs and MA-PDs and a temporary premium stabilization demonstration solely for PDPs. While these efforts have helped prevent an increase in the overall average PDP premium, the average premium for drug coverage remains significantly higher for PDPs than for MA-PDs. Recent years have also seen a decline in the average number of PDPs available to beneficiaries, which might make plan comparisons easier but might also make it harder to find an affordable plan that meets an individual’s unique needs. This reduction in the number of PDPs stands in sharp contrast to the MA-PD market where plan offerings have generally been increasing, though they have declined slightly over the past couple of years.
This brief discusses the growing instability of the Part D stand-alone drug plan market and how the Medicare Advantage payment system makes it harder to maintain competitive and affordable options in the PDP market.
Takeaways
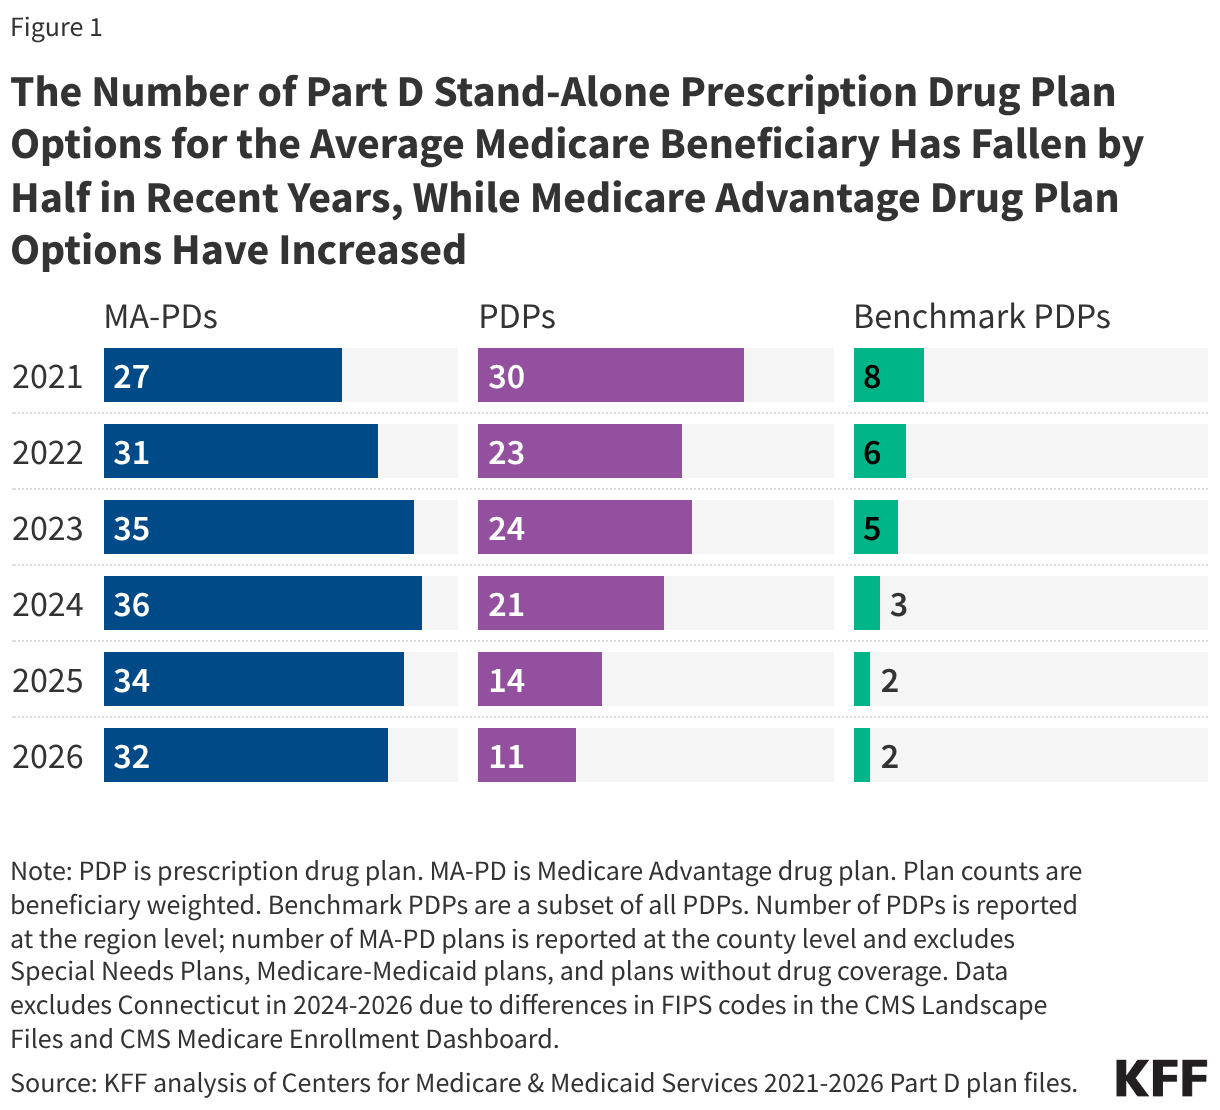
- Reflecting shifts in Part D plan availability in recent years, the average Medicare beneficiary now has nearly three times more options for Part D coverage from MA-PDs than from PDPs (32 vs. 11), a substantial change from five years ago when the average beneficiary had 30 PDP options and 27 MA-PD options.
- In 2026, MA-PD sponsors allocated over $600 in rebates per individual Medicare Advantage plan enrollee, or more than $50 per member per month, for Part D benefit enhancements and premium reductions. Due to rebate-financed Part D premium buydowns, most MA-PD enrollees are in plans charging no premium, including for drug coverage, in 2026.
- PDP sponsors are also receiving additional temporary premium subsidies through the PDP Premium Stabilization Demonstration, established to prevent substantial PDP premium increases as a result of the Part D benefit redesign. The federal government is providing around $190 in annual premium subsidies per PDP enrollee under the stabilization demonstration in 2026, based on a projected $16 per member per month premium reduction.
- Under a provision of the Inflation Reduction Act capping annual growth in the Part D base beneficiary premium to 6%, the federal government is providing a higher direct subsidy payment to both PDP and MA-PD plan sponsors to cover their basic Part D benefit costs, relative to what they would have received absent the 6% base premium cap, which helps absorb cost increases under the IRA’s Part D benefit redesign and mitigates premium increases for both PDP and MA-PD enrollees. The 6% base premium cap is projected to reduce the average premium by a similar amount in both markets in 2026.
- On a per member per month basis, the amount of rebates used by Medicare Advantage plans to buy down MA-PD Part D premiums in 2026 is projected to be over three times greater than the amount of premium subsidies to PDPs under the temporary premium stabilization demonstration—$53 for MA-PDs vs. $16 for PDPs. (These projections are based on 2025 Part D enrollment, not taking into account plan switching or new enrollment for 2026.)
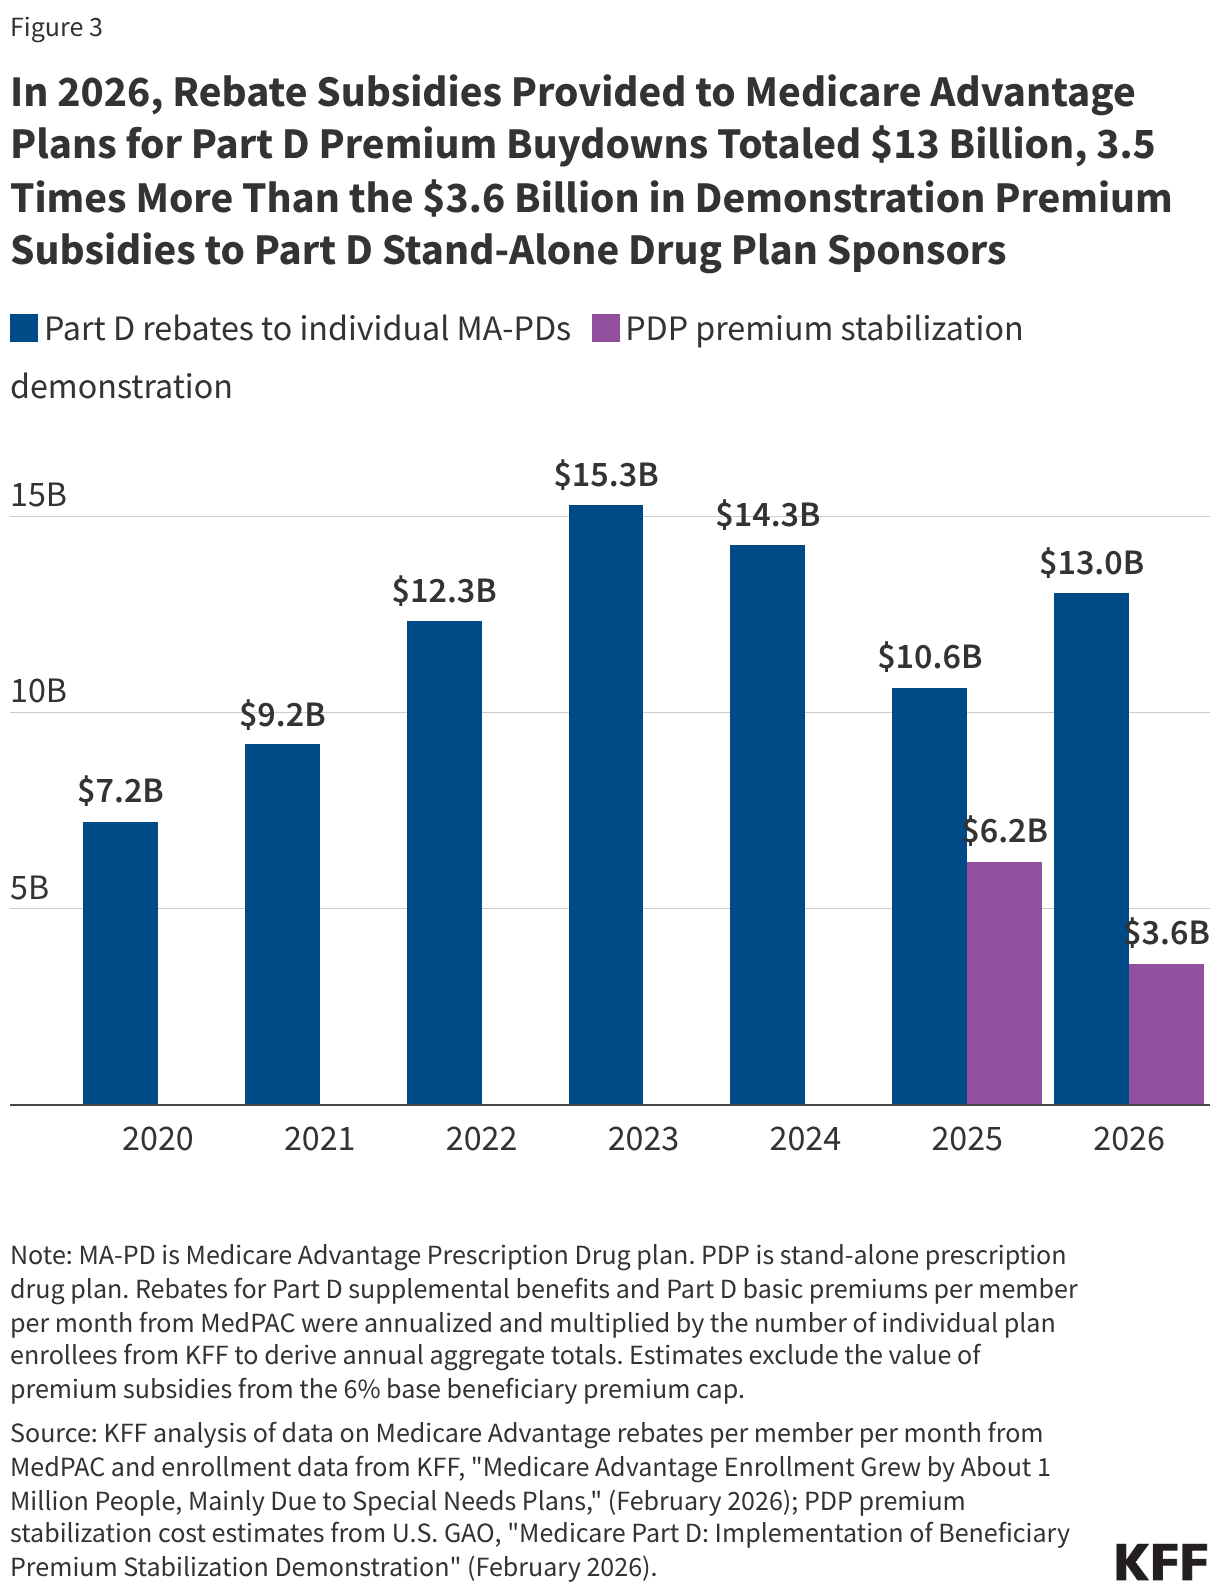
- The total cost to the federal government of rebates to Medicare Advantage plans used for Part D premium buydowns is 3.5 times more than the amount of subsidies to PDP sponsors under the premium stabilization demonstration in 2026 ($13 billion versus $3.6 billion).
The PDP Market Has Been Shrinking in Recent Years
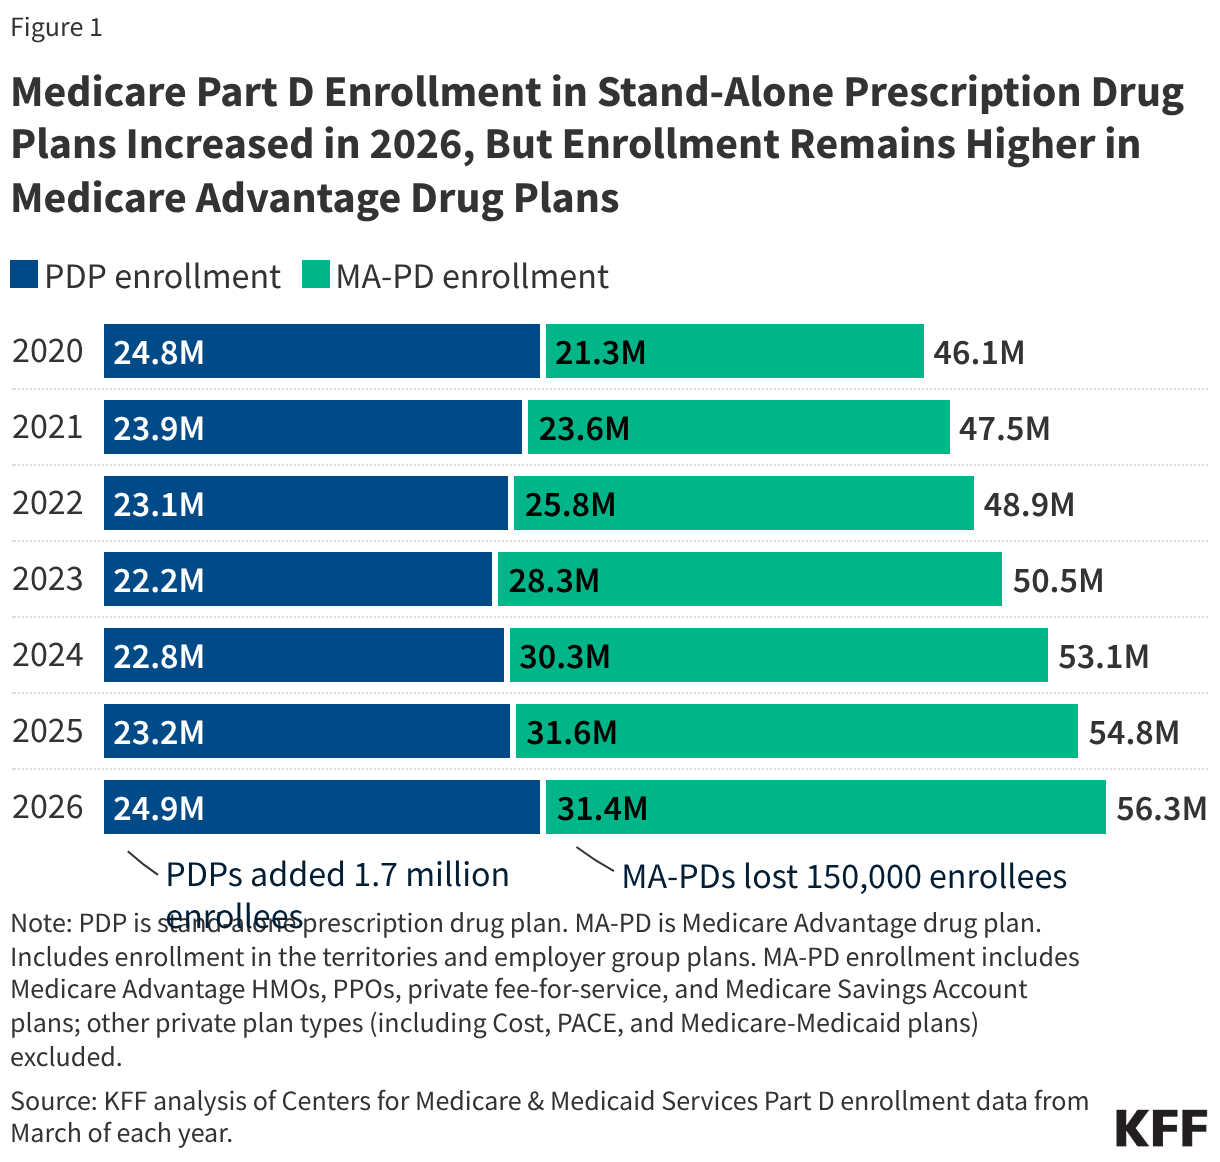
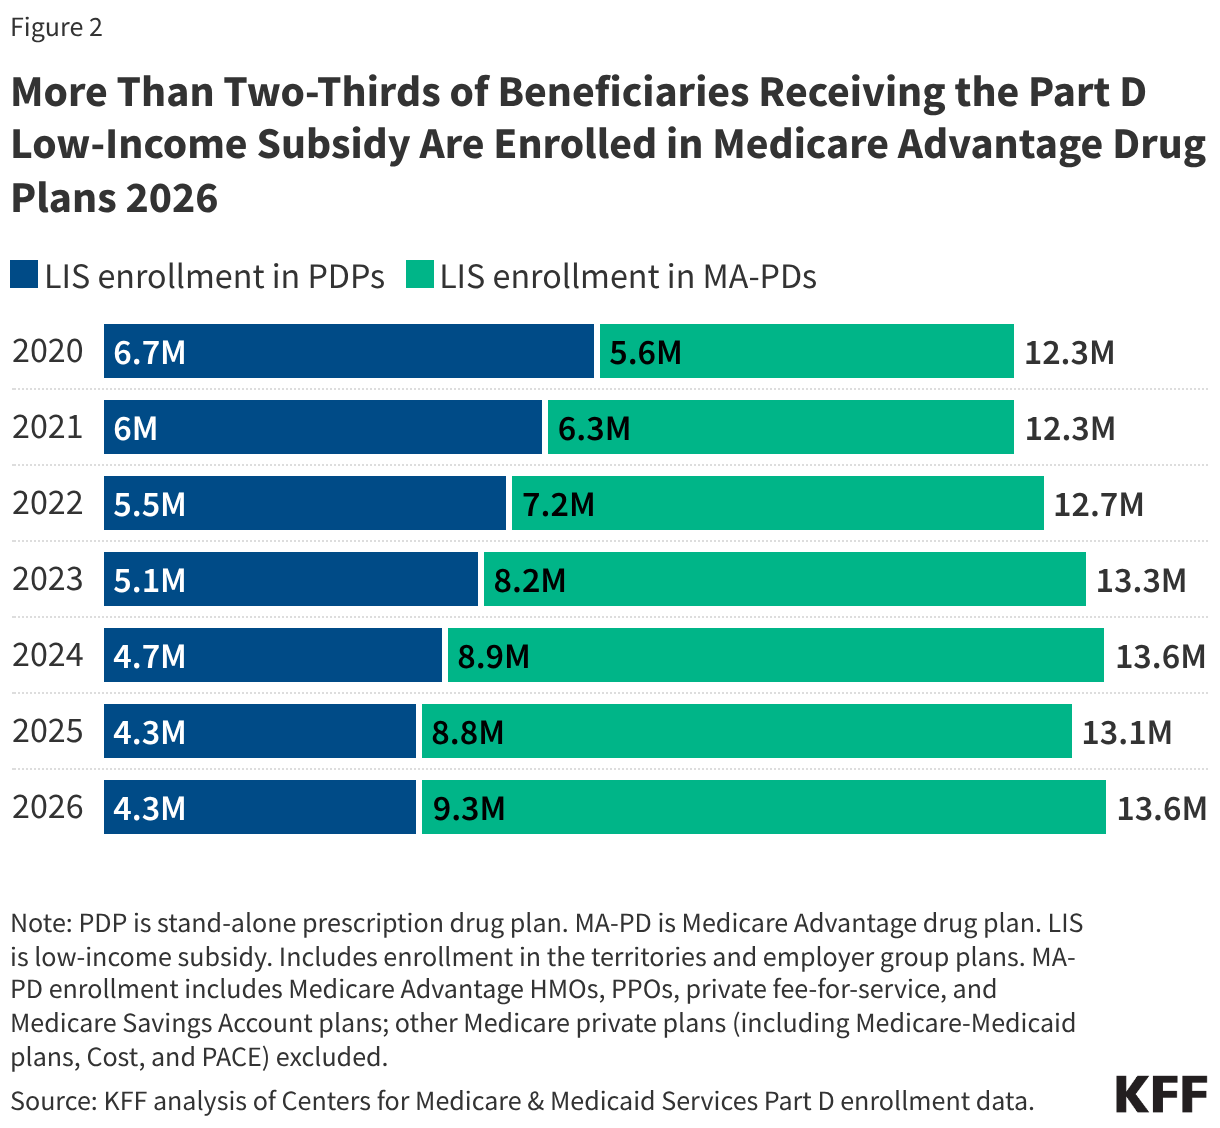
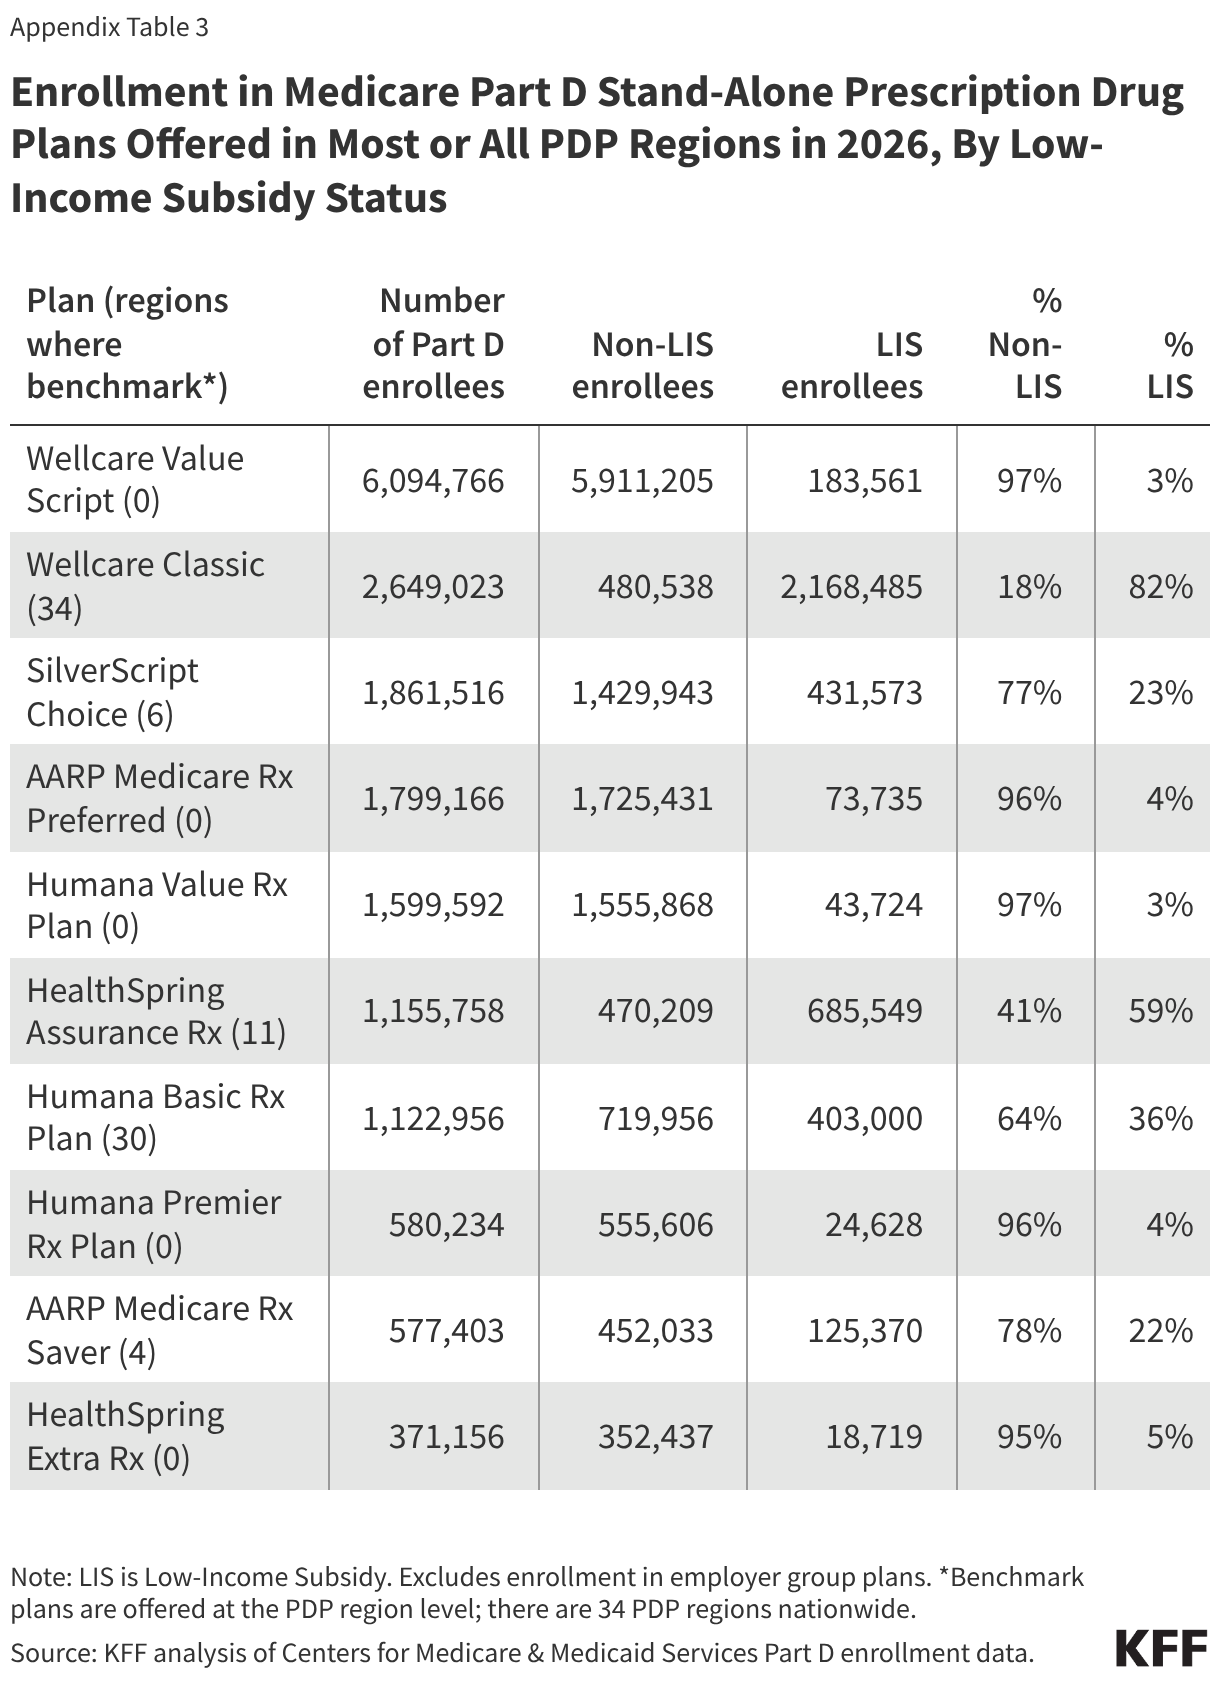
For Medicare beneficiaries who are enrolled in traditional Medicare, which is somewhat less than half of all people with Medicare, getting Medicare Part D prescription drug coverage means enrolling in a stand-alone PDP, a market that has been shrinking in recent years. Over the last five years, the number of PDPs available to the average beneficiary has decreased from 30 in 2021 to 11 in 2026, reflecting a decline in the total number of PDPs available around the country (Figure 1). By comparison, over this same period, the average number of Medicare Advantage drug plans (MA-PDs) increased from 27 to 32. The number of premium-free (“benchmark”) PDPs available to the average Medicare beneficiary who qualifies for the Part D Low-Income Subsidy (LIS) is even lower, decreasing from 8 benchmark PDPs in 2021 to 2 in 2026. This matters because for low-income Medicare beneficiaries who are eligible for the LIS, enrolling in certain PDPs provides the only guaranteed option for premium-free drug coverage and reduced cost sharing.
The Medicare Advantage Payment System Gives MA-PDs a Premium Advantage Compared to PDPs
One factor that has made the PDP market less competitive relative to MA-PDs is a payment system that gives sponsors of MA-PDs a clear advantage in terms of premiums. The Medicare Advantage payment system allows private insurers to retain a portion of the difference between their estimated costs for providing Medicare Part A and Part B services and the maximum Medicare Advantage payment rate. This portion of the federal payment to Medicare Advantage plans is called the “rebate” and it must be used by insurers to reduce the costs of benefits provided under the plan. In the absence of these payments, Medicare Advantage enrollees would face higher costs, including for Part D coverage. To the extent rebates are used to buy down Part D premiums or enhance Part D benefits, they provide a subsidy for Part D coverage to Medicare Advantage enrollees.
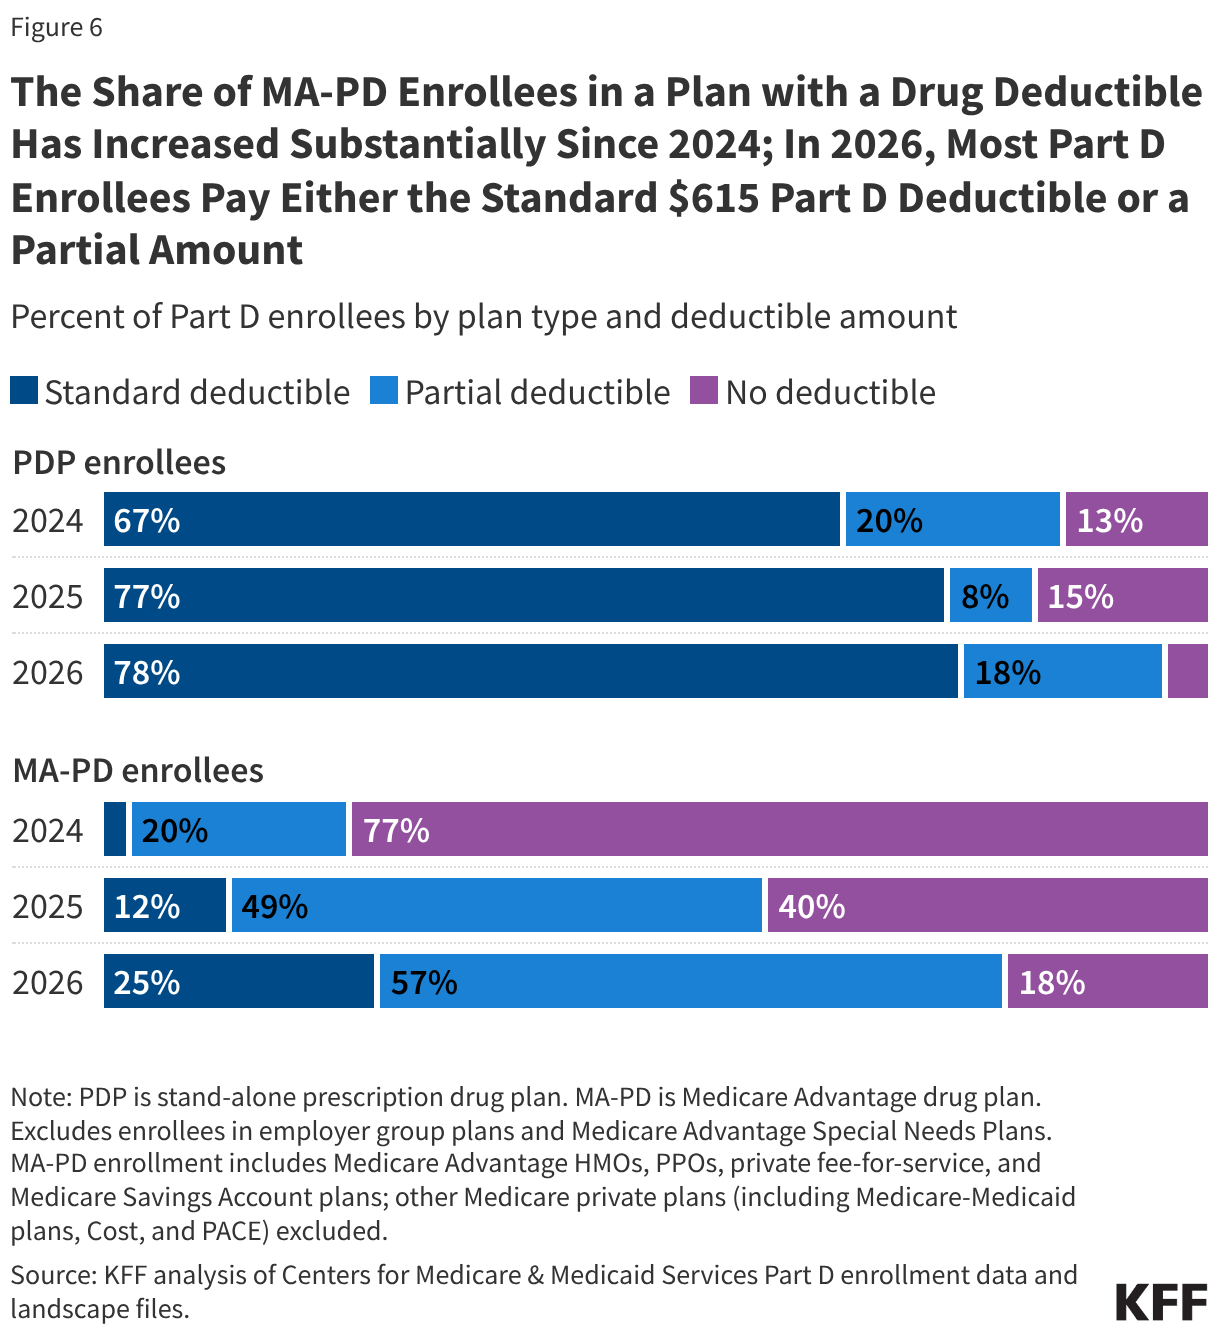
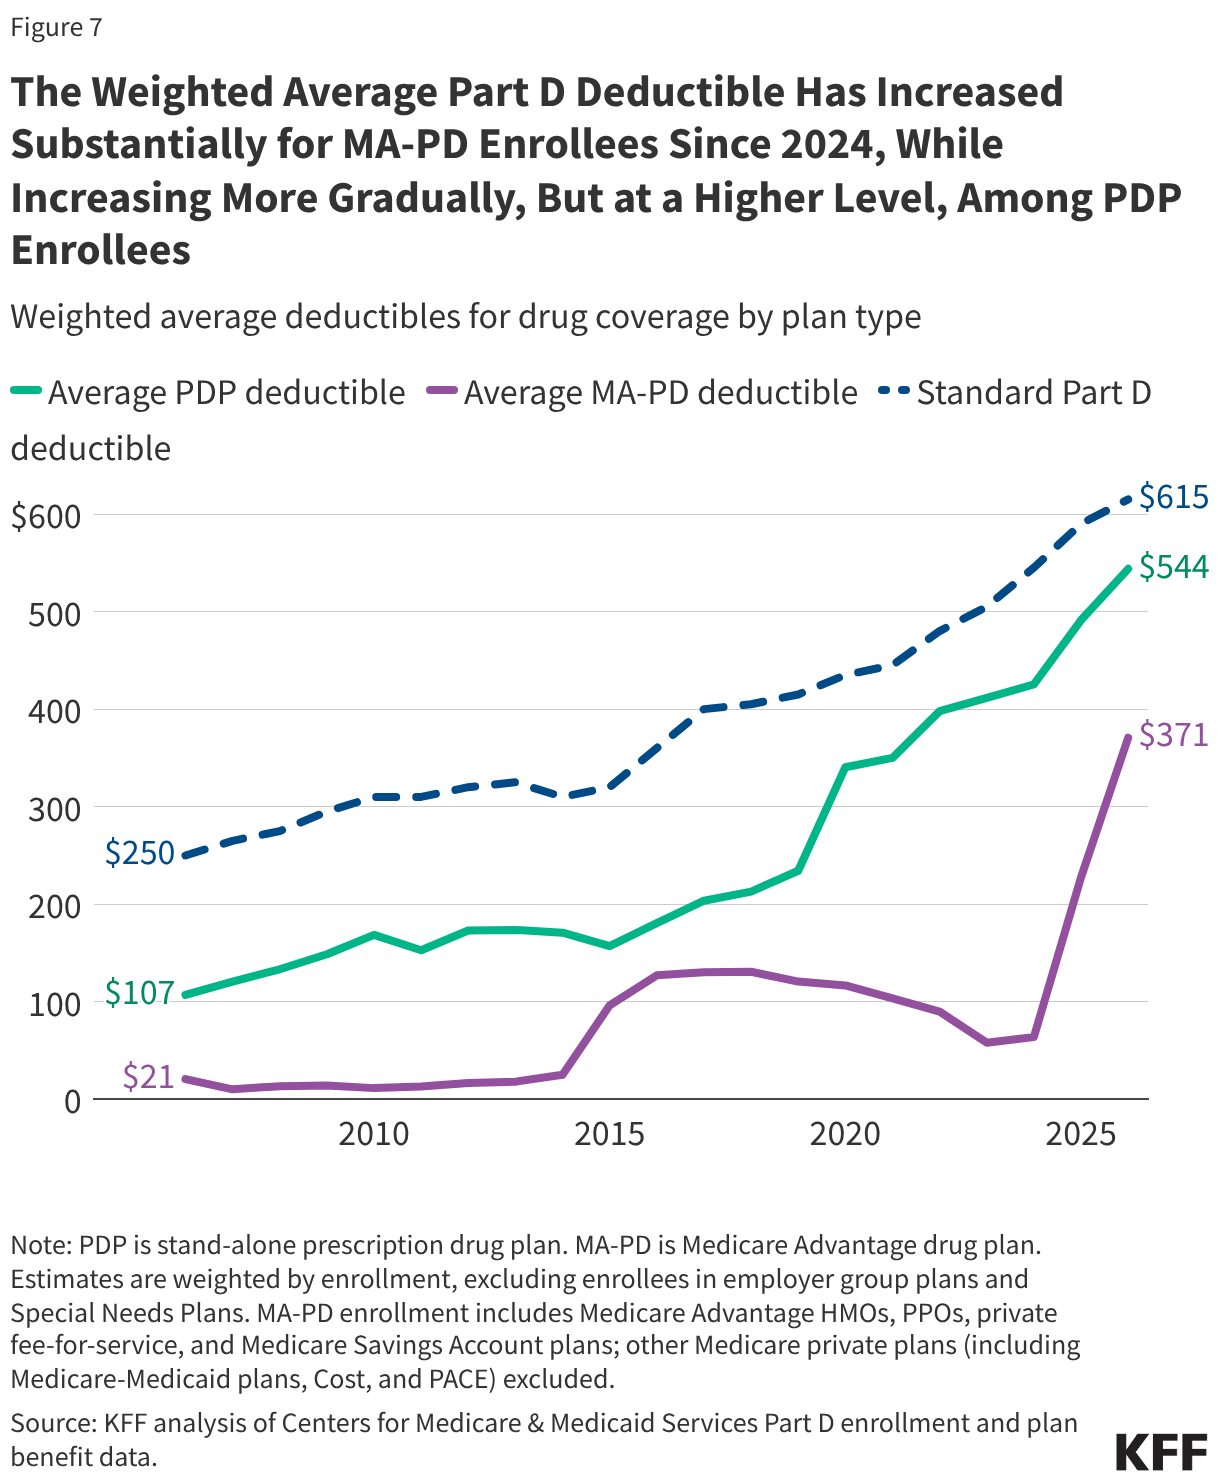
In 2026, Medicare Advantage plan sponsors are projected to allocate more than $600 in rebates per enrollee toward enhanced Part D coverage in individual MA-PDs, or just over $50 per member per month. Sponsors of individual MA-PDs use these federal rebates to subsidize Part D coverage by lowering or eliminating their Part D premiums and offering Part D supplemental benefits, including lower or no deductibles for drug coverage and lower cost sharing. Based on the 21 million enrollees in individual MA-PDs, the total amount of rebates from the federal government used for Part D buydowns is $13 billion in 2026.
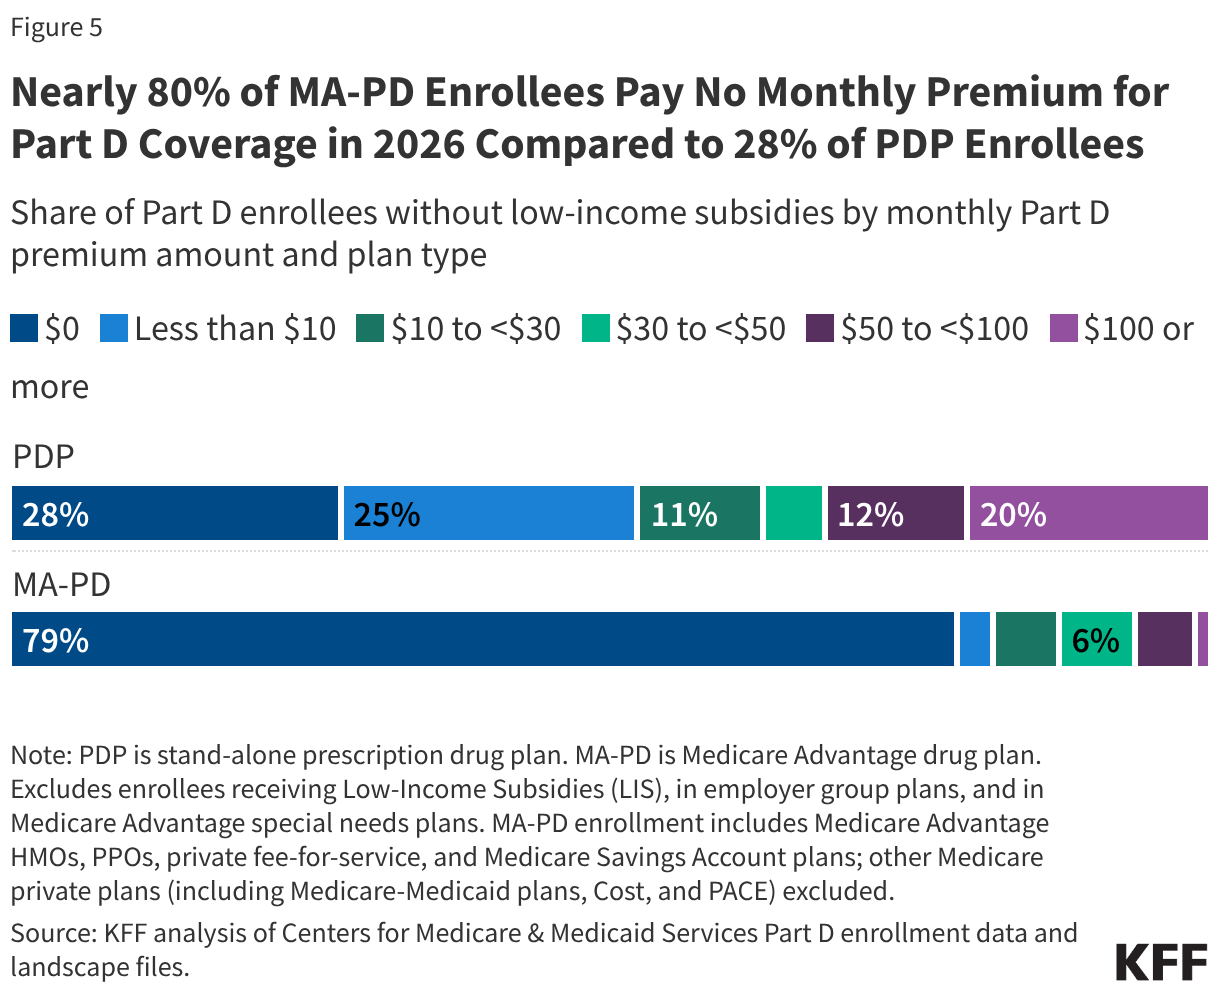
These rebate subsidies are unavailable to Part D sponsors for PDPs, which means that beneficiaries in traditional Medicare who get Medicare Part D coverage through a PDP typically face higher premiums for their drug coverage than MA-PD enrollees and have far fewer zero-premium options in the PDP market. In 2026, nearly 8 in 10 (79%) MA-PD enrollees in individual plans without low-income subsidies pay no monthly premium for Part D coverage compared to around 3 in 10 (28%) PDP enrollees. For the average Medicare beneficiary in 2026, 21 out of their 32 MA-PD options charge no premium for drug coverage, while 2 out of their 11 PDP options charge no premium.
PDP Sponsors Are Receiving Additional Temporary Premium Subsidies Through the PDP Premium Stabilization Demonstration
The voluntary PDP Premium Stabilization Demonstration, established in 2024 under the federal government’s Section 402 demonstration authority and intended to run for three years, provides additional premium subsidies to sponsors of PDPs to prevent substantial premium increases associated with the Part D benefit redesign. Under the Inflation Reduction Act, the Part D benefit was redesigned to include a new out-of-pocket drug spending cap for Part D enrollees and other changes that significantly shifted costs under the drug benefit from the federal government to Part D plan sponsors, with sponsors paying a larger share of costs above the out-of-pocket spending cap and potentially passing those higher costs along to beneficiaries through higher premiums. The premium stabilization demonstration was targeted to PDP sponsors only, because CMS reported large increases and greater variation in the bids submitted by Part D plan sponsors of PDPs than MA-PDs for drug coverage in 2025, indicating greater variability in the expected impact on basic benefit costs and premiums in the PDP market associated with benefit redesign and other drug pricing cost pressures. In 2026, the federal government is providing around $190 in annual premium subsidies per PDP enrollee under the demonstration, based on MedPAC’s projection of $16 in premium subsidies per member per month in 2026, for a total cost of $3.6 billion.
Both PDP and MA-PD Plan Sponsors Are Receiving Higher Direct Subsidy Payments for Part D Benefit Costs, Which Help Mitigate Premium Increases
The federal government is providing a higher direct subsidy payment to Part D plan sponsors resulting from a provision of the Inflation Reduction Act capping annual growth in the base beneficiary premium to 6%, which helps absorb cost increases under the Part D benefit redesign and also mitigates premium increases. Along with changes to the Part D benefit design and other drug pricing provisions, the IRA capped the increase in the Part D base beneficiary premium to 6%. The base premium is calculated as a share of average plan bids for basic Part D benefits submitted by both PDPs and MA-PDs. As a result of the 6% base premium cap, the federal government is providing a larger direct subsidy payment to both PDP and MA-PD sponsors to cover their basic Part D benefit costs, relative to the level of direct subsidies they would have received without the 6% cap. The cap also has the effect of reducing Part D premiums paid by both PDP and MA-PD enrollees relative to what they would have paid in the absence of the cap (although this 6% cap doesn’t apply to the individual premiums that plans charge). According to MedPAC, the 6% base premium cap is projected to reduce the average premium by a similar amount in both markets in 2026 (as described further below).
The Part D Premium Reduction from Rebates Used by MA-PD Plans is Projected to be Over Three Times Greater Than from the PDP Premium Stabilization Demonstration on a per Member per Month Basis in 2026—$53 vs. $16
Data from MedPAC shows the differential premium impact of the various subsidies provided by the federal government to PDP and MA-PD plan sponsors, with MA-PD premiums substantially lower than PDP premiums as a result. On a per member per month basis, the amount of rebates used by Medicare Advantage plans for Part D premium buydowns in 2026 is projected to be more than three times greater than the amount of subsidies provided to PDPs under the temporary stabilization demonstration—$53 for MA-PDs vs. $16 for PDPs. (MedPAC’s estimates are projections for average monthly premiums per member per month in 2026, based on 2025 enrollment and not accounting for plan switching or new enrollees for 2026.)
After premium subsidies from the 6% base beneficiary premium cap and rebates, the average monthly Part D premium for individual MA-PDs is projected to be $9 per month, compared to an average monthly premium of $44 per month for PDPs, after accounting for the 6% cap and the PDP premium stabilization subsidies (Figure 3). MedPAC’s estimates show that without these extra subsidies, average monthly premiums for MA-PDs and PDPs would be on par with each other in 2026 (with or without the 6% base beneficiary premium cap). (These estimates are MedPAC’s projections for average monthly premiums per member per month in 2026, based on 2025 enrollment and not accounting for new plans, plan changes during open enrollment, or new enrollees for 2026, and therefore differ from other estimates published recently in a separate KFF brief, which are based on March 2026 enrollment and take into account new plans, plan switching, and new enrollees for 2026.)
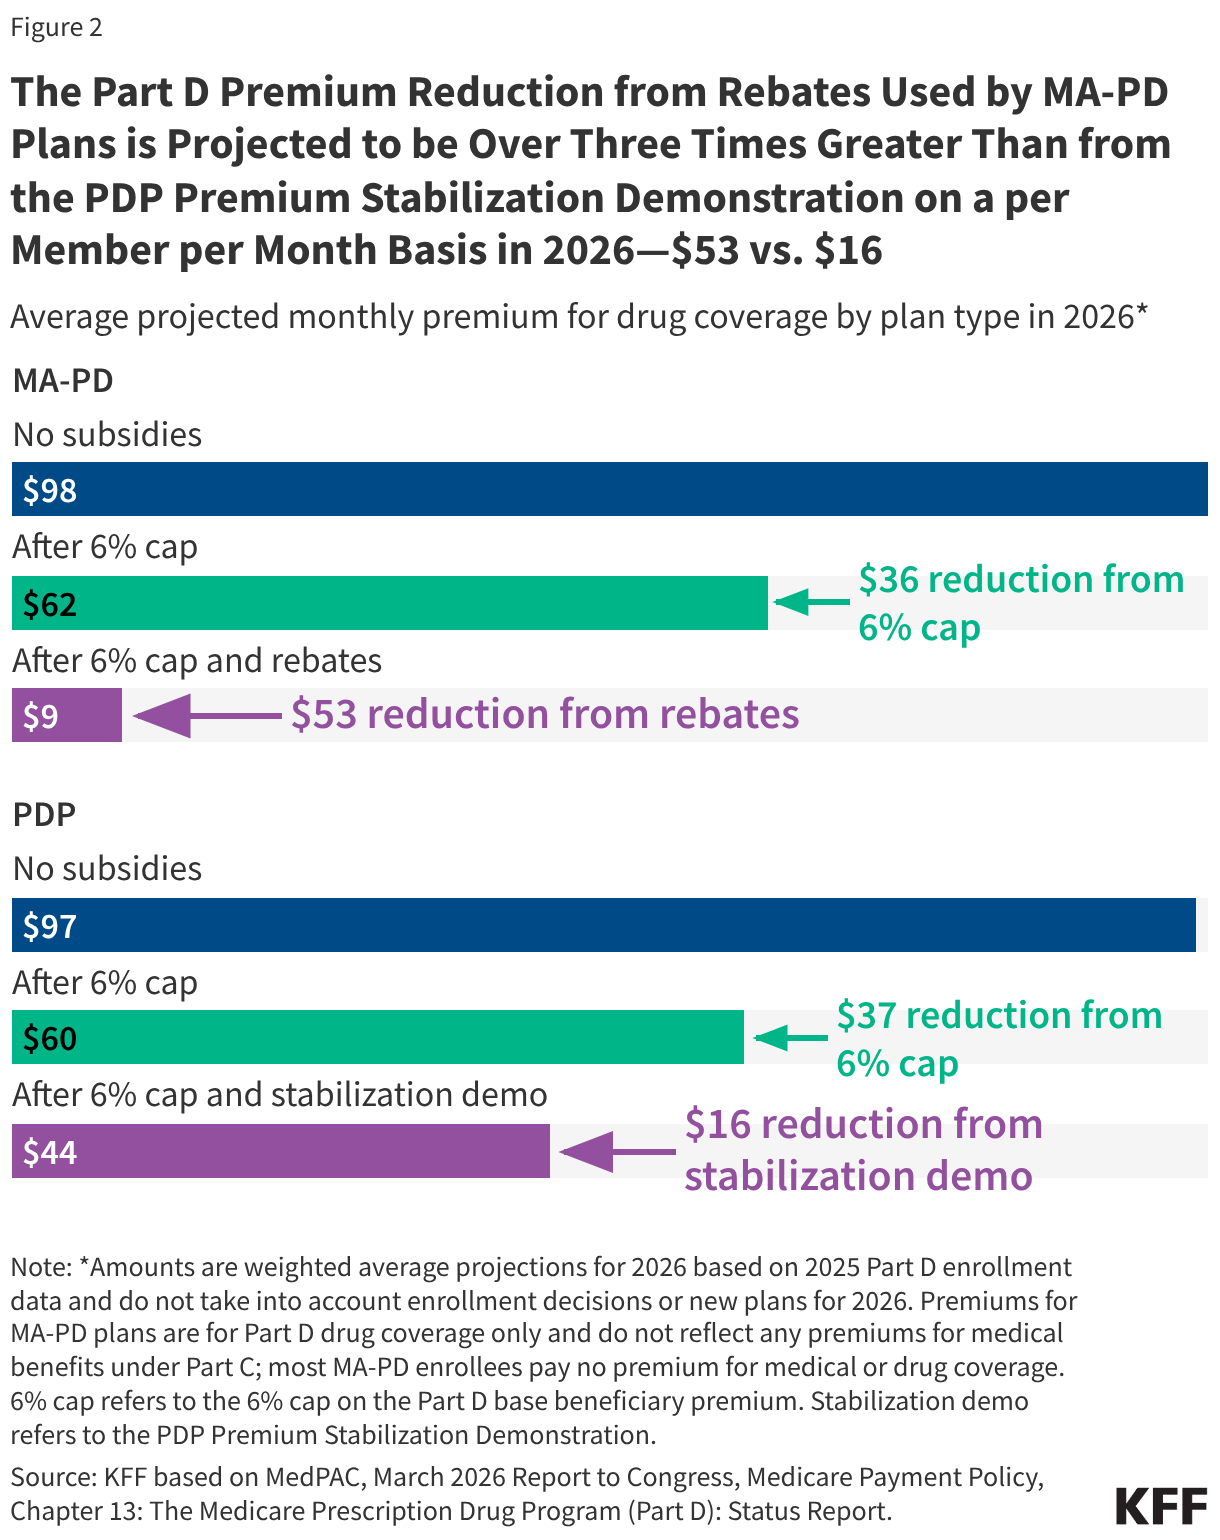
For individual MA-PDs, the average monthly premium is projected to be $89 lower in 2026 than it would have been without the subsidies—from $98 per month to $9 per month. Rebate subsidies for Part D premium buydowns account for $53 of the premium reduction and subsidies from the 6% cap account for $36 of the reduction.
For PDPs, the average monthly premium is projected to be $53 lower in 2026 than it would have been without the additional subsidies—from $97 per month to $44 per month. Subsidies from the premium stabilization demonstration account for $16 of the premium reduction, while subsidies from the 6% cap account for $37 of the reduction.
The Total Amount of Medicare Advantage Rebates Used for Part D Premium Buydowns in 2026 is 3.5 Times Greater than Subsidies Provided Through the PDP Premium Stabilization Demonstration
The $13 billion in rebates provided by the federal government to individual Medicare Advantage plans used to buy down MA-PD Part D premiums in 2026 is 3.5 times larger than the $3.6 billion in premium subsidies to PDPs under the premium stabilization demonstration (Figure 2). According to GAO,the cost of the PDP premium stabilization demonstration for the first and second years of operation totaled $9.8 billion ($6.2 billion in 2025 and $3.6 billion in 2026). The cost of the demonstration was lower in 2026 than in 2025 because the Trump administration reduced the level of the premium subsidies provided to PDP sponsors in the second year of the demonstration. By comparison, rebates provided to individual Medicare Advantage plans used for Part D premium buydowns totaled $23.7 billion in 2025 and 2026 ($10.6 billion in 2025 and $13.0 billion in 2026). Between 2020 and 2026, rebates to Medicare Advantage plans to offer enhanced Part D benefits, including premium buydowns, totaled $82.2 billion. (These estimates exclude the aggregate cost of extra direct subsidies provided under the 6% base beneficiary premium cap, but this subsidy is applied equally across all plans.)
Recent Trends in the PDP Market Could Make It Harder for Traditional Medicare Beneficiaries to Find Affordable Drug Coverage that Meets Their Needs
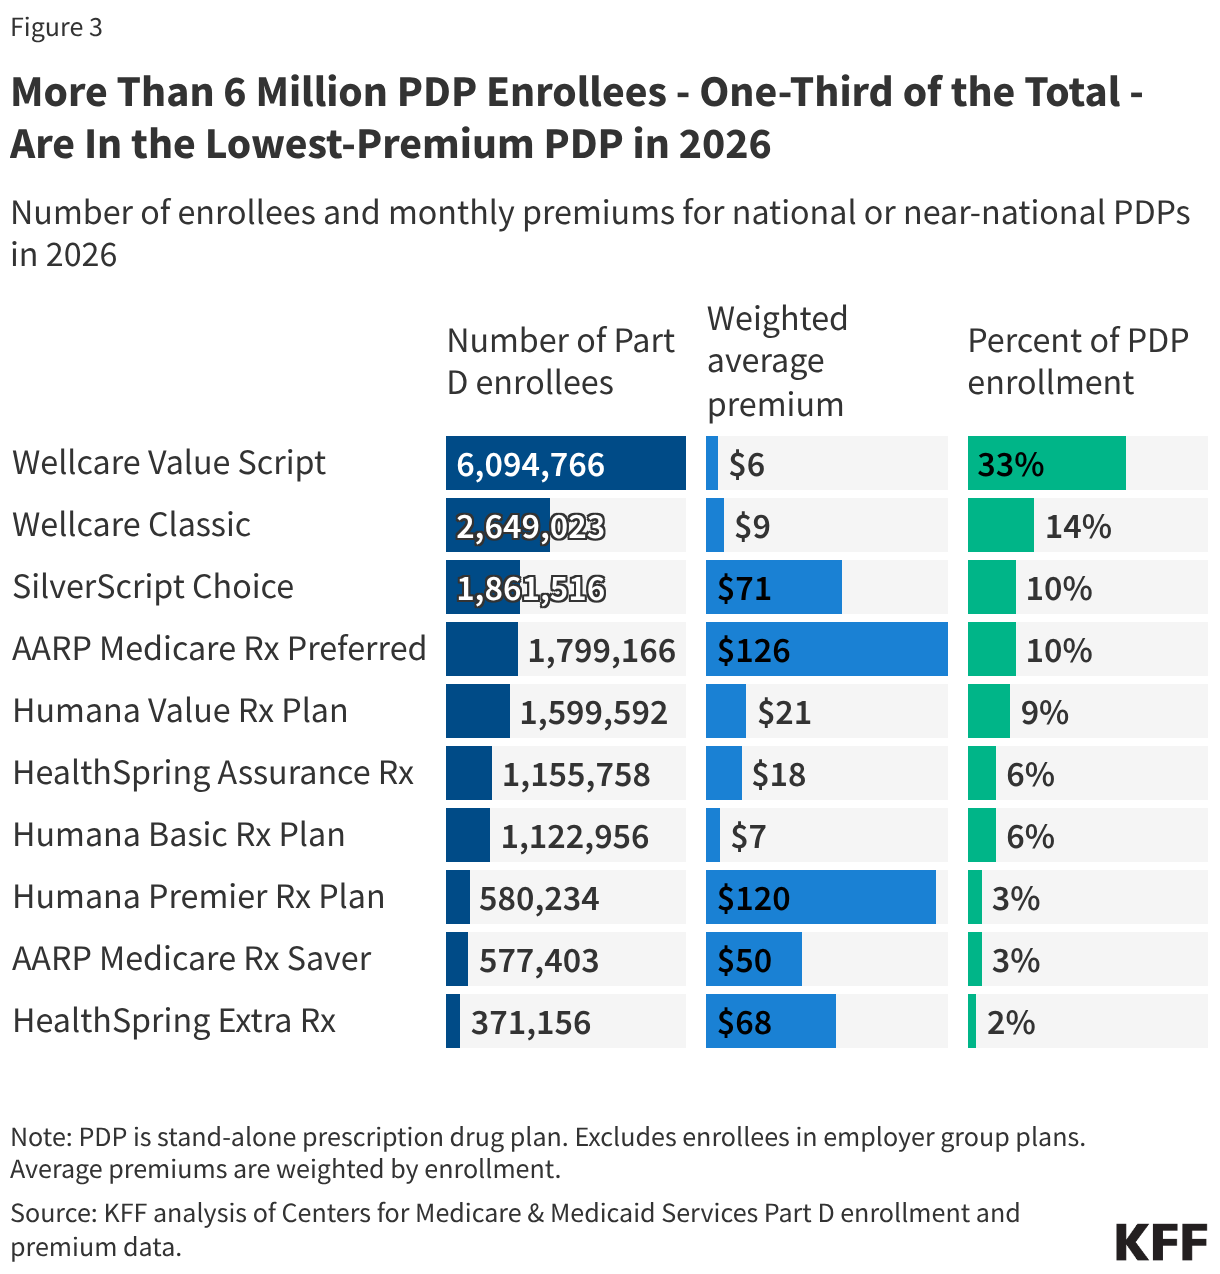
A continuation of recent trends in the Part D market—fewer PDPs coupled with higher average premiums for PDPs than MA-PDs—could diminish the ability of Medicare beneficiaries in traditional Medicare to find PDPs at a comparatively affordable price, especially for those with modest incomes, which could make enrollment in Medicare Advantage more likely. Although there are some low-premium PDP options in 2026, roughly half of PDP enrollees are in plans charging $10 or more per month and 20% are paying $100 per month or more in 2026. The choice to enroll in a PDP versus an MA-PD plan comes with tradeoffs that extend beyond prescription drug coverage. While Medicare Advantage plans typically charge zero premium beyond the standard Part B premium and offer extra benefits beyond what is covered under traditional Medicare, they also have more limited provider networks and greater use of prior authorization than in traditional Medicare. Greater financial pressure on Part D plan sponsors that results in additional PDP withdrawals could also further reduce premium-free benchmark PDP options for low-income Medicare beneficiaries. Overall, instability in the PDP market has larger implications for the viability of traditional Medicare as an option for beneficiaries nationwide, but especially for beneficiaries who live in rural areas, who are more likely to be enrolled in traditional Medicare and rely more on drug coverage from PDPs than Medicare Advantage plans.
This work was supported in part by Arnold Ventures. KFF maintains full editorial control over all of its policy analysis, polling, and journalism activities.