Medicaid Expansion Enrollment and Spending Leading up to the COVID-19 Pandemic
| Key Takeaways |
Medicaid enrollment has increased during the coronavirus pandemic, a trend that likely reflects adverse economic effects of the pandemic (including increased job and income loss) as well as continuous coverage requirements from the Families First Coronavirus Response Act. This issue brief analyzes enrollment and spending trends related to the Affordable Care Act’s Medicaid expansion ahead of the pandemic and examines potential consequences of recent enrollment increases. Key findings include:
Given that the recent economic downturn has caused many adults to lose employment and/or income, Medicaid expansion enrollment and spending are likely to grow at a fast pace during the pandemic. Estimates suggest that expansion enrollment growth has outpaced overall Medicaid enrollment growth from February to August 2020. This analysis sheds light on the potential federal and state obligations for that spending and relative cost to Medicaid programs. Looking ahead, uncertainty remains regarding the future course of the pandemic, the scope and length of federal fiscal relief efforts, and potential state and federal policy actions to expand coverage. |
Introduction
The coronavirus pandemic has generated both a public health crisis and an economic crisis, with major implications for Medicaid enrollment, particularly among the expansion population. Many people who lose their jobs and health coverage during the pandemic will qualify for Medicaid if their income falls below eligibility limits, and low-income adults living in states which have expanded Medicaid under the ACA will have more coverage options than those in states that have not expanded. These states provide coverage to the Medicaid expansion group, which includes adults under age 65 with incomes at or below 138% of the federal poverty level (FPL). (Medicaid enrollees who do not qualify for coverage under the expansion are referred to as the “traditional Medicaid” group throughout this brief; see Box 1 for more details.) Medicaid enrollment has increased by more than five million individuals during the pandemic from February to August 2020. Data from a subset of states suggests that enrollment through the expansion has outpaced growth overall since the start of the pandemic.
Increased Medicaid enrollment has implications for both federal and state spending. For traditional Medicaid enrollees, states receive their regular match rate (“FMAP”) plus additional federal support through a 6.2 percentage point increase in the federal Medicaid match rate for traditional Medicaid spending. The federal government continues to pay a larger share (90%) of the costs for those already or newly enrolled in the expansion group. New expansion group enrollment is likely to compose a large share of increased overall Medicaid enrollment during the pandemic; however, the 6.2 percentage point FMAP increase does not apply to spending for the expansion group.
This issue brief analyzes pre-pandemic trends for enrollment in and spending on the expansion group and examines potential consequences of recent enrollment increases during the pandemic. Enrollment and expenditure data are from the Medicaid Budget and Expenditure System (MBES). As of writing, enrollment data for the fourth quarter of FY 2019 have not been released, and our FY 2019 enrollment figures are drawn from annualized enrollment totals from the data available. Additionally, two states, Maine and Virginia, implemented Medicaid expansion later in FY 2019, so expansion spending in these two states reflect only the months that the expansion has been in effect. States which have or plan to implement the expansion after FY 2019 (Idaho, Utah, Nebraska, Oklahoma, and Missouri) are considered non-expansion states for all years of this analysis. Enrollment and expenditure data for New York have been adjusted due to what appear to be reporting anomalies for the traditional Medicaid group and expansion group, which affected national totals. We did not make adjustments for any other states. See the Methods section for more information.
| Box 1: Defining the Medicaid Expansion Group vs. the Traditional Medicaid Group |
| The Medicaid expansion group includes individuals who are enrolled in the Medicaid expansion under the ACA. In states that have implemented the Medicaid expansion (which was made effectively optional by the Supreme Court ruling on the ACA’s constitutionality), nearly all adults under age 65 and with incomes at or below 138% of the FPL ($17,609 per year for an individual in 2020) are eligible for Medicaid. States receive an enhanced federal match rate for spending on expansion adults, although there was a different federal match rate for adults who became newly eligible under the ACA (“newly eligible enrollees”) versus adults were enrolled through state waivers prior to passage of the law in 2009 (“not newly eligible enrollees”). As of January 2020, the federal match rate for all Medicaid expansion group spending is 90%, where it will remain going forward.
The traditional Medicaid group includes all other Medicaid enrollees not enrolled through the Medicaid expansion. Beyond federally mandated eligibility groups, states have discretion in which groups are eligible for Medicaid coverage, but these often include qualifying children, persons with disabilities, pregnant women, elderly individuals, people dually enrolled in Medicaid and Medicare, and low-income parents with eligibility levels at pre-ACA limits (the pre-ACA median eligibility limit for parents across all states was 64% of the FPL). The federal match rate for this group is based on states’ lagged relative per capita income and, in FY 2019, ranged from a floor of 50% to a high of 76%. |
Medicaid Expansion Enrollment
In FY 2019, the expansion group represented 20% of all Medicaid enrollment and 28% of enrollment in expansion states (Figure 1, Appendix Table 1). In total, Medicaid enrollment for FY 2019 was 75.2 million individuals across all 50 states and DC, with 15.3 million adults enrolled in the expansion group. Within the expansion group, most (81%, 12.5 million) were newly eligible enrollees covered through Medicaid expansion, while a smaller share (19%, 2.9 million) were not newly eligible enrollees (childless adults who were enrolled through state waivers prior to passage of the ACA). The majority of Medicaid enrollment overall (80%, 59.8 million) was within the traditional Medicaid group, which is composed of several different eligibility groups (see Box 1 above for more information). These groups are subject to varying eligibility levels across states, with children and pregnant women generally covered at much higher eligibility levels compared to non-expansion parents and seniors and people with disabilities.

Figure 1: The expansion group represented one out of every five Medicaid enrollees in FY 2019.
The share of Medicaid enrollment represented by the expansion group varies across expansion states in FY 2019 (Figure 2). Expansion enrollment ranged from a high of 48% of total enrollment in Oregon to a low of 11% in Maine, which implemented Medicaid expansion coverage in the second quarter of FY 2019 (January 2019), although Maine allowed for retroactive enrollment as early as July 2018. The variation across expansion states likely reflects several factors, including different poverty distributions and economic conditions across states (particularly, the state share of the population with income at or below 138% of the FPL) as well as variation in state Medicaid eligibility levels for expansion and traditional groups. For example, the District of Columbia covers expansion adults above the minimum threshold of 138% FPL, with a threshold of 221% FPL for parents and 215% FPL for other adults.
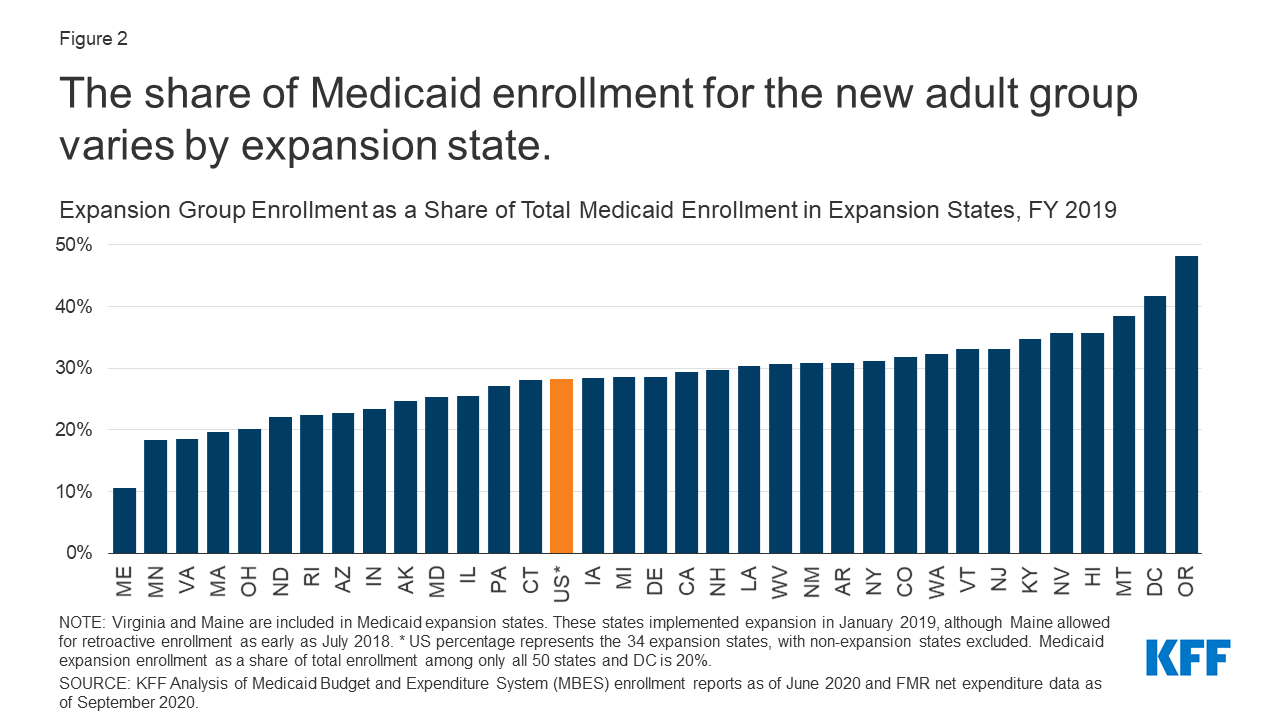
Figure 2: The share of Medicaid enrollment for the new adult group varies by expansion state.
Expansion group enrollment peaked in FY 2017 and FY 2018 but declined in FY 2019, despite two states (Maine and Virginia) that newly implemented Medicaid expansion that year (Figure 3). Expansion enrollment grew from 13.6 million enrollees in FY 2015 (the first full fiscal year of Medicaid expansion following its implementation beginning January 2014), when 30 states had implemented expansion, and peaked at roughly 15.6 million expansion enrollees in FY 2017 and FY 2018, when 32 states had implemented expansion. Expansion enrollment declined to 15.3 million in FY 2019, despite the addition of two more states implementing expansion that year (34 in all). Traditional Medicaid enrollment showed a different trend, declining from a high of 63.2 million in FY 2015 to 59.8 million in FY 2019, with annual declines in all years except FY 2018. Trends in overall (traditional plus expansion) Medicaid enrollment were similar to those for traditional Medicaid enrollment, with annual declines in every year except for FY 2018. Several factors could have contributed to recent declining enrollment for expansion and traditional enrollees, such as improving economic conditions, barriers to maintaining or renewing coverage, and federal funding cuts to outreach and enrollment programs that assist eligible individuals enrolling in Medicaid or marketplace coverage.
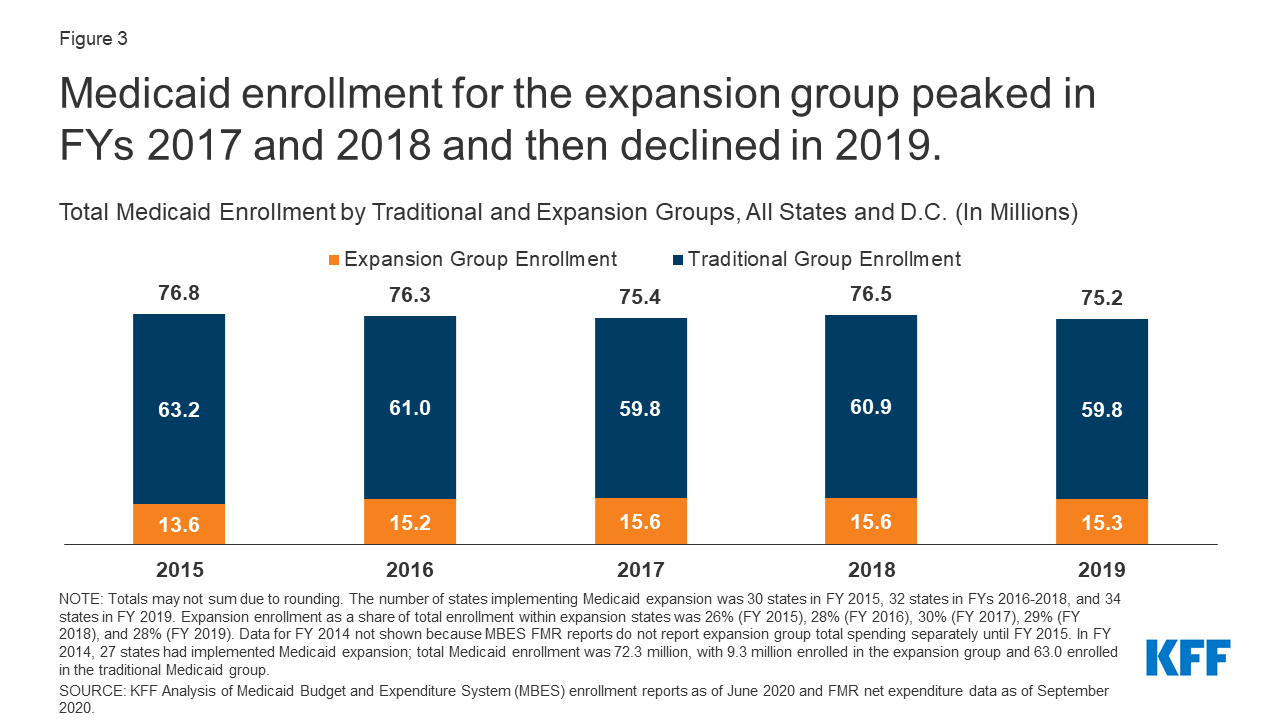
Figure 3: Medicaid enrollment for the expansion group peaked in FYs 2017 and 2018 and then declined in 2019.
Medicaid Expansion Spending
In FY 2019, spending on the expansion group represented 16% of all Medicaid spending and 21% of spending in expansion states (Figure 4, Appendix Table 2). Medicaid spending totaled $594.6 billion across all 50 states and DC. Across the 34 states that implemented expansion before or during FY 2019, spending on the expansion group totaled $93.8 billion that year. Spending on the traditional Medicaid population was much higher: $347.6 billion in expansion states (79% of total spending) and $500.8 billion across all states (84% of total spending). This difference in spending is partially explained by the greater number of traditional enrollees compared to expansion enrollees. Further, the traditional Medicaid group is composed of many different eligibility groups, including groups with smaller enrollment levels but higher per-enrollee spending such as seniors and people with disabilities (for more details, see Per Capita Spending section below). Thus, the proportion of spending represented by the expansion group is lower than its share of enrollment (21% vs. 28% in expansion states).
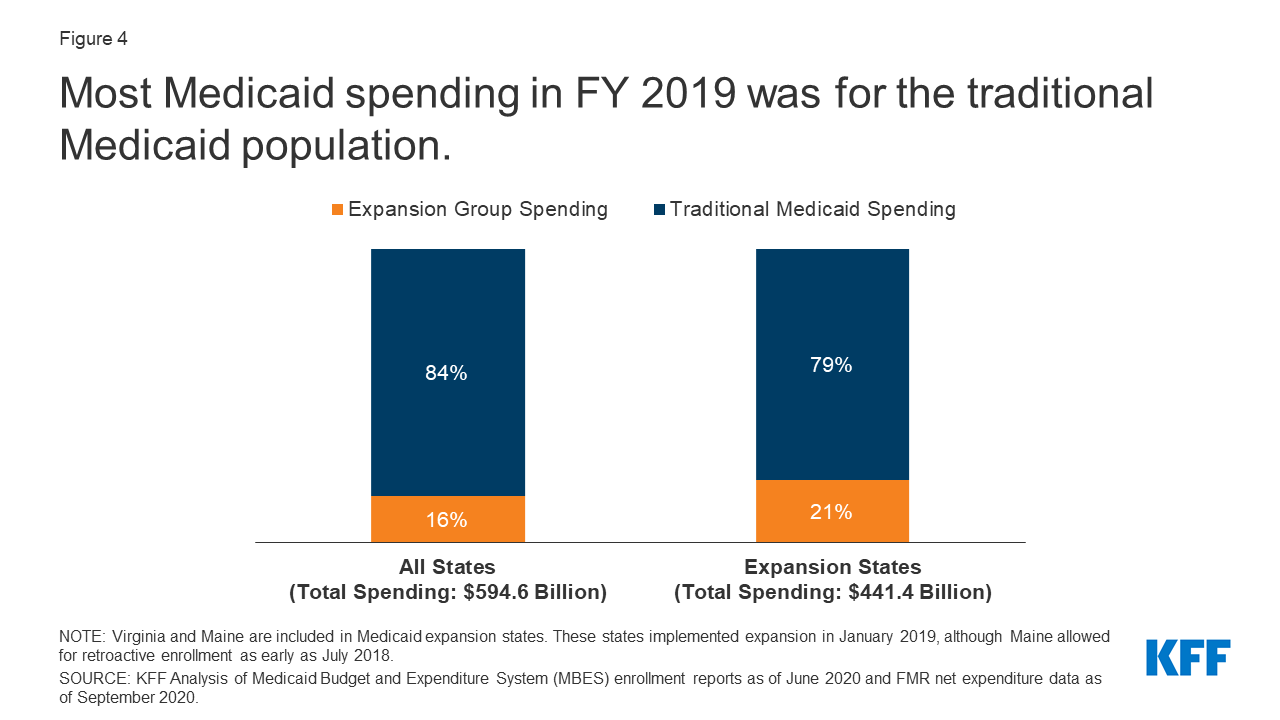
Figure 4: Most Medicaid spending in FY 2019 was for the traditional Medicaid population.
The share of Medicaid spending represented by expansion spending varied across expansion states in FY 2019 and was less than 40% of total spending in all these states (Figure 5). The share of spending on the expansion group ranged from 4% in Maine to 39% in Montana. (Virginia and Maine implemented expansion in the second quarter of FY 2019 and do not represent a full year of spending.) Much like enrollment, several factors likely contribute to this variation. These include demographic differences across states (such as age and income level of the population), variation in benefit packages and payment levels, and state variation in eligibility limits for other, non-expansion groups (such as seniors and people with disabilities and parents with income at or below pre-ACA eligibility limits).
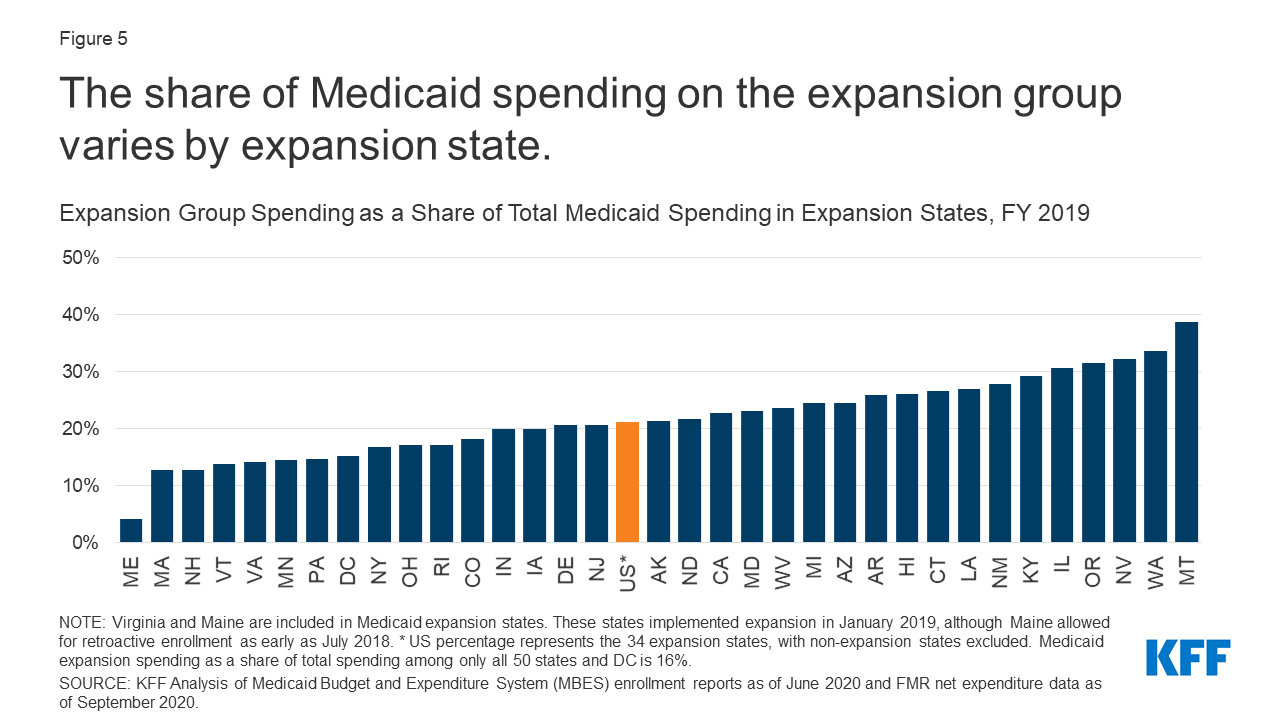
Figure 5: The share of Medicaid spending on the expansion group varies by expansion state.
Medicaid expansion spending is primarily federal funds, with state spending on the expansion group representing just 1% of overall Medicaid spending in FY 2019 (Figure 6). The ACA initially provided 100% federal financing for expansion costs in 2014; this match rate gradually fell to 93% in 2019 then to 90% in 2020 and beyond.1 In FY 2019, expansion spending totaled $93.8 million, $84.9 billion of which was paid for by the federal government with the remaining $8.9 billion paid for by states. In contrast, states contributed a larger proportion of traditional Medicaid spending, attributable to the lower federal match rate for the traditional population, which in FY 2019 ranged from 50% to 76% based on a statutory formula that accounts for each state’s average per capita income relative to the national average.
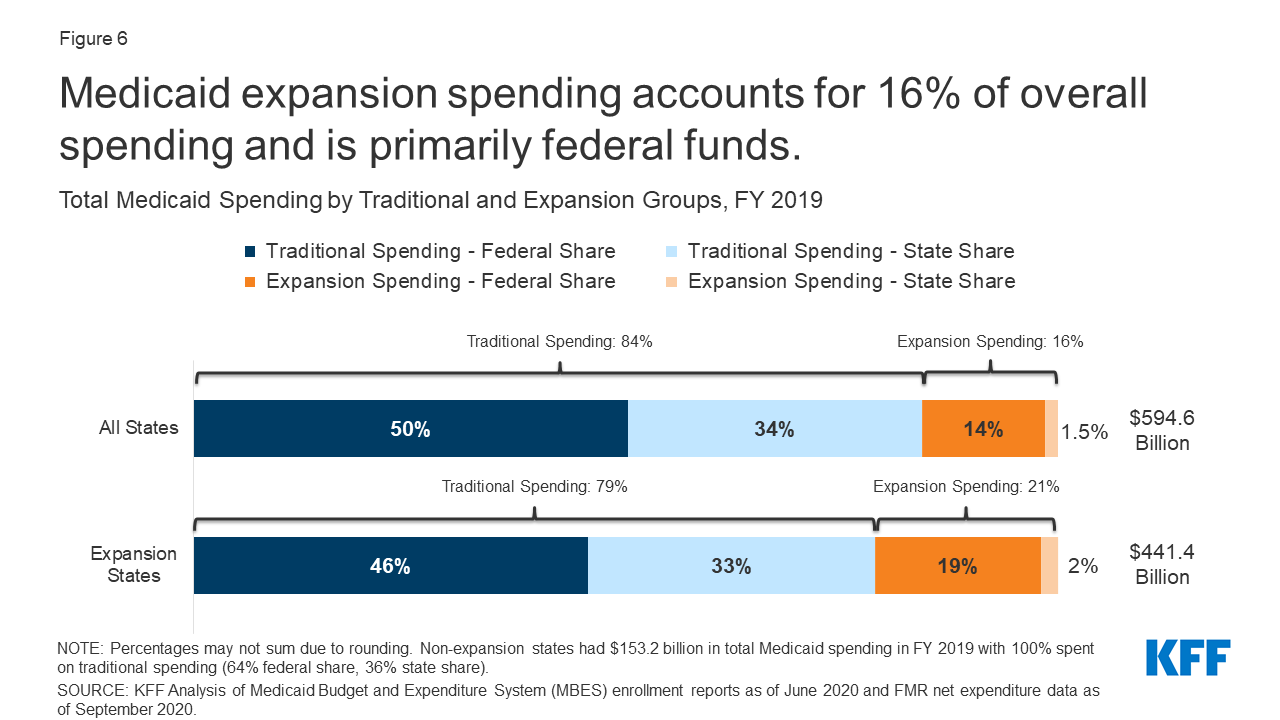
Figure 6: Medicaid expansion spending accounts for 16% of overall spending and is primarily federal funds.
As total Medicaid spending has increased in the years since FY 2015, the share of spending represented by the expansion group has remained nearly constant (Figure 7). The share of Medicaid spending on the expansion group has remained between 20% and 22% of total Medicaid spending in expansion states for every year from FY 2015 through FY 2019, suggesting that increases in total Medicaid spending over these years have been proportionately driven by the expansion and traditional populations. The share of total spending represented by expansion spending has remained similarly constant across all states as well (between 14% and 16%). Notably, while total spending increased in FY 2019 for both the expansion and traditional Medicaid groups, enrollment declined that year. Not accounting for the initial increase in spending immediately following implementation, expansion states and non-expansion states experienced similar total spending growth from FY 2015 to FY 2019: 12% growth for both the 30 states that expanded Medicaid by FY 2015 (excluding Louisiana, Maine, Montana, and Virginia, which implemented expansion between FY 2015 and FY 2019) as well as for the 17 non-expansion states. Several factors may explain growing Medicaid costs aside from enrollment, including changes to the makeup of the Medicaid population, service utilization, and rising costs. In FY 2019, states identified increasing costs for prescription drugs, provider rate increases, pressures from an aging population, and a higher acuity case-mix as key upward pressures on total Medicaid spending.
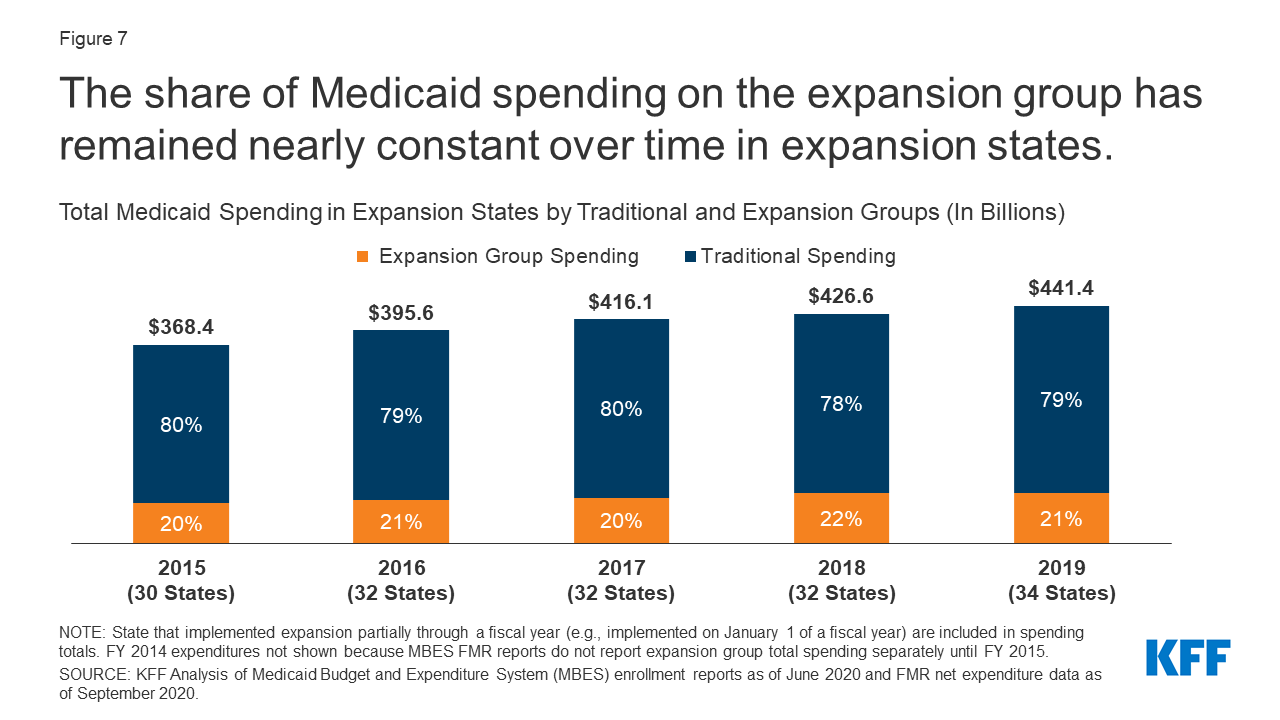
Figure 7: The share of Medicaid spending on the expansion group has remained nearly constant over time in expansion states.
Per Capita Spending
Medicaid spending per enrollee is lower for the expansion group than for other groups (Figure 8, Appendix Table 3). While overall spending per enrollee was $7,910 in FY 2019, spending per expansion enrollee was just $6,110 and spending per traditional enrollee was $8,370 (spending per expansion enrollee may be slightly underreported due to Maine and Virginia implementing expansion later in this fiscal year). This difference is in line with earlier data finding lower spending per enrollee for adults and children as compared to other groups. In contrast, the elderly and beneficiaries with disabilities account for a disproportionate share of Medicaid spending, largely attributable to greater need for acute care and long-term care.

Figure 8: Medicaid spending per enrollee is lower for the expansion group compared to total spending per enrollee.
Spending per expansion enrollee varies across expansion states (Figure 9). In FY 2019, spending per expansion enrollee ranged from $3,950 in Vermont to $12,330 in North Dakota (Virginia and Maine implemented expansion in the second quarter of FY 2019, so spending per expansion enrollee may be slightly underreported in these figures). Spending per expansion enrollee was lower than per capita spending for other groups in nearly all expansion states, and states with higher total spending per enrollee generally also had higher spending per expansion enrollee. Factors that may contribute to variation in per capita spending across states include differences in health care costs and utilization and the relative health status of the underlying populations.
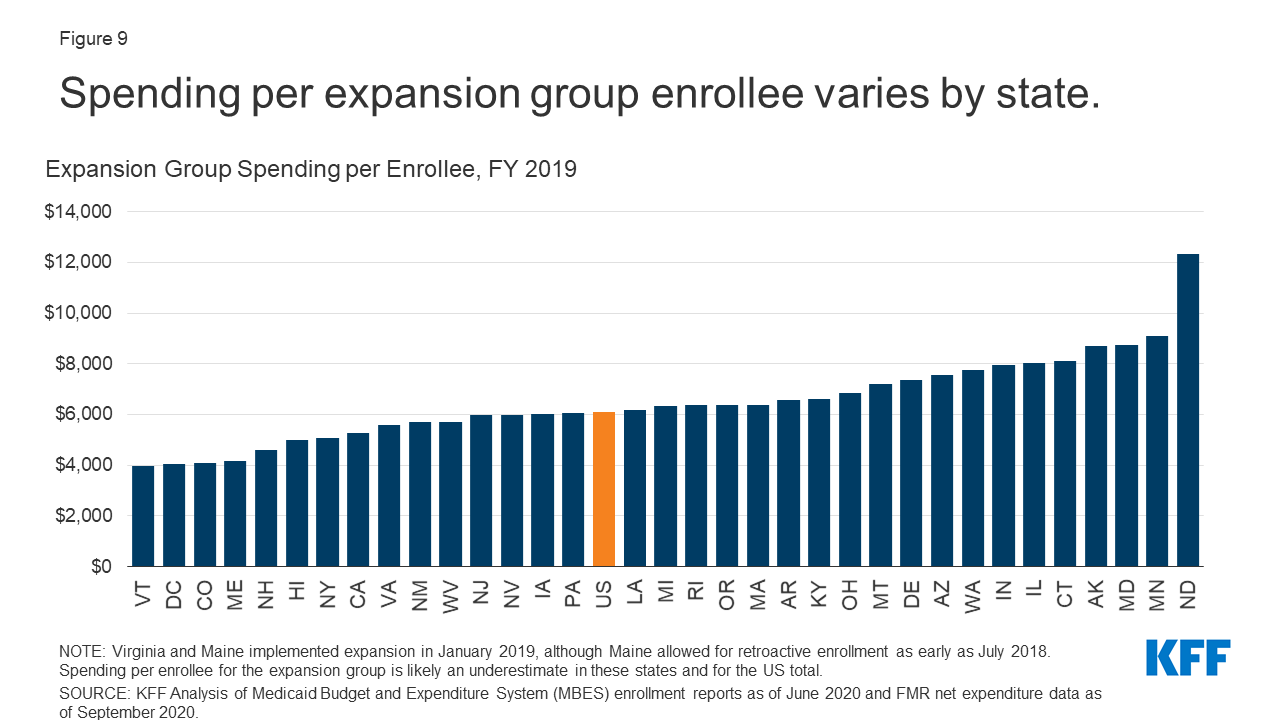
Figure 9: Spending per expansion group enrollee varies by state.
Looking Ahead
Medicaid expansion enrollment has grown at a fast rate during the pandemic. In a reversal of prior trends, recent data shows that total enrollment is increasing during the pandemic, reflecting changes in the economy (as more people experience income and job loss and become eligible and enroll in Medicaid coverage) and provisions in the Families First Coronavirus Response Act (FFCRA) that require states to ensure continuous coverage for current Medicaid enrollees and meet other maintenance of eligibility (MOE) conditions to access a temporary increase in the Medicaid federal match rate. Current Medicaid and CHIP enrollment data show that total enrollment increased by over 5 million (7.4%) from February to August 2020, with non-expansion states experiencing slightly faster growth over this time period as compared to expansion states (8.4% growth vs. 7.1% growth). However, enrollment data collected from a subset of state websites for specific eligibility groups show that Medicaid expansion enrollment is growing at a faster rate than enrollment overall, which would lead to a commensurate increase in expansion spending. Non-expansion states are more likely to see increases in the uninsured population as adults who lose employer-sponsored insurance during the pandemic have fewer coverage options in these states.
Although federal dollars will pay for the majority of increased Medicaid spending during the pandemic, states still face economic pressure and may look to cost cutting measures. The federal government pays 90% of costs for the expansion group, which is substantially higher than the regular match rate in all states. Additionally, research showing positive economic outcomes from the Medicaid expansion suggests that expansion states could be better positioned to cope with the economic fallout of the pandemic. The federal government also continues to contribute a higher portion of non-expansion spending to offset costs during the pandemic: under the FFCRA, states that meet MOE conditions receive an additional 6.2 percentage point increase in the federal match rate for traditional spending through the quarter in which the national public health emergency declaration ends. Despite substantial increases in federal dollars going to states for Medicaid during the pandemic, budgetary pressures may cause some states to look to Medicaid program cuts. Because of the federal match for Medicaid spending, programmatic cuts must be substantial to generate state savings, especially for the expansion population. For example, a $100 reduction in expansion spending would yield only $10 in state savings.
Looking ahead, uncertainty remains regarding the future course of the pandemic, the scope and length of federal fiscal relief efforts, and potential state and federal policy actions to expand coverage. As people continue to lose jobs and income during the pandemic, non-expansion states may consider adopting Medicaid expansion to increase coverage. While any new adoption of expansion would increase federal dollars going to states due to the 90% federal match, states may have difficulty covering the remaining 10% of expansion spending amid adverse state budgetary impacts during the pandemic. At the federal level, President-elect Joe Biden has supported a new federal public health insurance option which would be available to individuals in non-expansion states who would otherwise be eligible had their states adopted Medicaid expansion; however, this plan may face challenges to passage in a closely divided Senate. Policymakers may consider more narrow options, such as proposals to make 100% federal financing available to states that newly expand. Additionally, President-elect Joe Biden could implement a number of administrative actions that could increase Medicaid coverage in expansion and non-expansion states
| Methods |
| This analysis uses data from the Medicaid Budget and Expenditure System (MBES) from the Centers for Medicare and Medicaid Services (CMS). MBES enrollment data may differ from other Medicaid enrollment counts, such as the Medicaid and CHIP Performance Indicator Project. MBES enrollment data are reported monthly and based on an unduplicated count of individuals enrolled in Medicaid at any time in the month. Additionally, enrollment data include individuals enrolled in limited benefit plans. Enrollment data for the fourth quarter of FY 2019 have not been released as of writing, and enrollment figures presented in this brief for FY 2019 are based on annualized measures of the first three quarters of the 2019 fiscal year, described immediately below. MBES expenditure data for FY 2019 are complete for the full fiscal year.
Fiscal Year Enrollment: Annual enrollment totals used in this report are based on the maximum monthly enrollment for the fiscal year in each state. While this measure is used to estimate the total number of enrollees over the entire fiscal year, it is likely an undercount of the number of enrollees served throughout the year. Total Medicaid enrollment is calculated from the maximum monthly total enrollment. Medicaid expansion group enrollment is calculated as the sum of the maximum newly eligible expansion Group VIII enrollment and the maximum not newly eligible Group VIII enrollment reported in MBES, in line with a previous KFF analysis (Group VIII is synonymous with the expansion group defined in this report). Traditional Medicaid enrollment is calculated as the difference between the maximum monthly total enrollment for a fiscal year and the Medicaid expansion group total. Traditional Medicaid enrollment and expansion group enrollment sum to total enrollment for each fiscal year. National totals are the sum of states’ enrollment totals. Fiscal Year Expenditures: Expenditure totals for states are extracted from annual Financial Management Reports (FMR). National totals represent the sum of state totals. Expansion States: States with Group VIII enrollment of at least one enrollee in a fiscal year are considered expansion states in that year for this analysis. In FY 2019, this includes all states which had implemented the expansion by September 30, 2019 and excludes states which have implemented or plan to implement the expansion after this date (Idaho, Utah, Nebraska, Oklahoma, and Missouri). Coverage under the ACA’s Medicaid expansion became effective January 1, 2014 (partway through FY 2015) in most states, with additional states implementing expansion after this date. State expansion implementation dates may not align with federal fiscal years, and we did not adjust our calculations for expansion enrollment or expenditures for states that implemented expansion later in the fiscal year. In 2019, this only affected Maine and Virginia, which both implemented expansion on January 1, 2020, with Maine allowing retroactive enrollment through July 2018. Adjusting expansion enrollment to reflect three-quarters of the fiscal year in these two states did not make a large difference for national totals. Expansion spending in these two states reflect only the months that the expansion was in effect. Adjustments: Due to what appear to be data reporting anomalies in expenditures for the traditional Medicaid group and the expansion group (potentially reflecting adjustments and recategorizations) that affected national totals, New York expenditures for FY 2017 through FY 2019 were adjusted by applying the spending distribution for these groups from FY 2016. Total Medicaid spending for New York was not adjusted. We also excluded enrollment data from the third and fourth quarters of FY 2017 for New York, due to anomalous, large shifts in enrollment between the traditional Medicaid group and the expansion groups. Total enrollment was consistent through FY 2017, indicating that no large changes in enrollment for either traditional or expansion groups likely occurred in the quarters that we excluded. |