Medicaid Expansion Spending and Enrollment in Context: An Early Look at CMS Claims Data for 2014
Issue Brief
There have been long-standing questions about the effect the Medicaid expansion would have on spending and enrollment. Preliminary data from the Medicaid Budget and Expenditure System (MBES) released by the Centers for Medicare and Medicaid Services (CMS) may provide some early insights into these questions. CMS released preliminary spending and enrollment data from the MBES that covers the period from January 2014 through December 2014. This period is of particular interest because these are the first quarters that the Medicaid expansion was in effect. During this period, 27 states including DC, had implemented the Medicaid expansion; all but two of these states – Michigan (April 1, 2014) and New Hampshire (August 15, 2014) – implemented the Medicaid expansion January 1, 2014.
The MBES provides monthly Medicaid enrollment and quarterly Medicaid expenditure data with specific information about enrollment and spending for the new adult eligibility group, also referred to as the “Group VIII.” The new adult group includes both those newly eligible under the Medicaid expansion (eligible for 100% federal match through December 2016) and those previously eligible (that were matched at traditional match rates but now receive a higher federal match.) While all states have reported expenditure data for the January – December 2014 period, California and North Dakota have not reported enrollment data for that same period.1 This brief examines the MBES data to be able to put the spending and enrollment for the expansion into the context of total Medicaid spending and enrollment. Key findings from this data show:
- The new adult group represented a relatively small share (10%) of total Medicaid spending across all states in CY 2014. Looking at just expansion states, spending for the new adult group made up a slightly larger share (16%) total spending. The vast majority of spending for the new adult group is federal dollars (94%). This is driven by the 100% federal match available for those newly eligible adults, which make up three-quarters of enrollment in the new adult group.
- Looking at current enrollment data available, the new adult group made up a relatively small share (13%) of total enrollment. The new adult group made up a larger share of total enrollment in expansion states. However, data are preliminary and enrollment data for large states like California are missing.
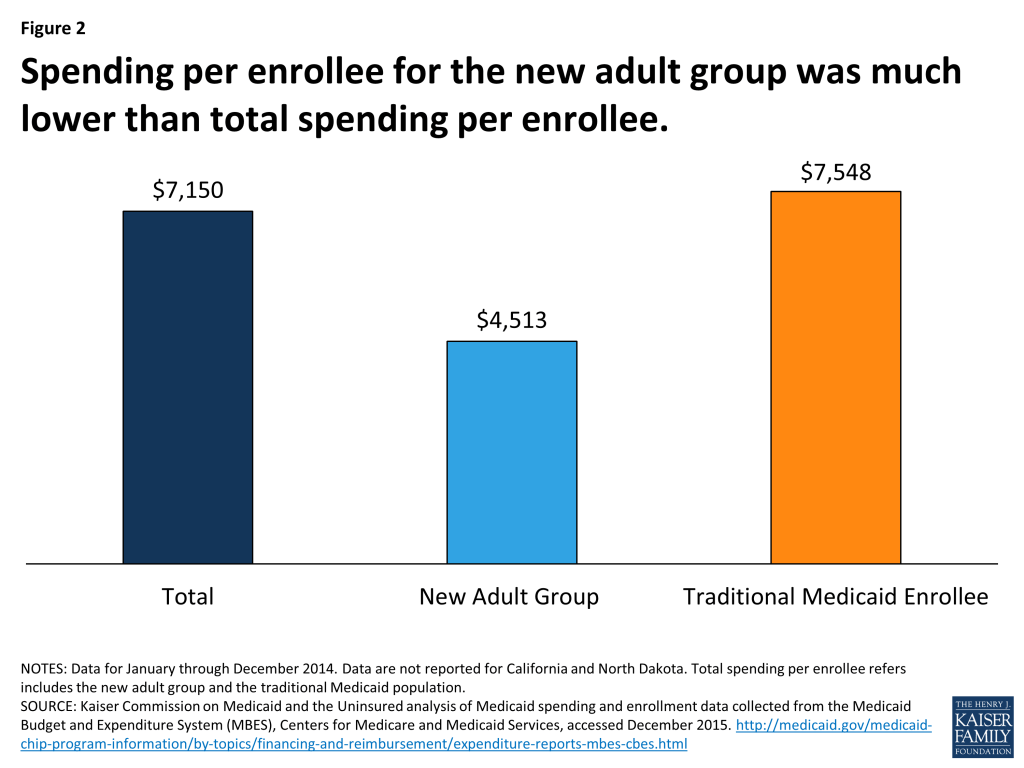
- Spending per enrollee for the new adult group is notably lower than spending per enrollee across all groups ($4,513 vs. $7,150.)
Since this data claiming and reporting process is new, ensuring that the data are comparable and accurate across states may take time. This analysis is preliminary and will continue to be updated as data from missing states are added and data continue to be revised and updated.
Background
Data from the Medicaid Budget and Expenditure System (MBES) released by the Centers for Medicare and Medicaid Services (CMS) provides monthly enrollment and quarterly expenditure data with specific information about enrollment and spending on the new adult group (Group VIII). Historically, states have reported only expenditure data through the MBES, not enrollment data. However, to enable states to claim the enhanced funding available for adults made newly eligible by the ACA, CMS revised the form to require states to report claims separately by eligibility group, including separate reporting of claims for the new adult eligibility group, also referred to as the “Group VIII.” Group VIII or the new adult group consists of those who are newly eligible as well as some other adults described in the box below. Those that do not qualify under the new adult group are referred to as “traditional Medicaid” for this analysis, which includes individuals with disabilities, the elderly, children, pregnant women and some low-income parents. Since this data claiming and reporting process is new, ensuring that the data are comparable and accurate across states may take time. Additionally, the enrollment data reported through the MBES differ in important ways from other enrollment data reported by CMS through the Performance Indicator process (see Appendix A for more details.)
Data included in this analysis looks at enrollment and expenditure data for January 1, 2014 through December 31, 2014, the first calendar year that the Medicaid expansion was in effect. During this period, 27 states including DC, had implemented the Medicaid expansion; all but two of these states – Michigan (April 1, 2014) and New Hampshire (August 15, 2014) – implemented the Medicaid expansion January 1, 2014. States that expanded after December 31, 2014 (Pennsylvania, Indiana, Alaska and Montana) are treated as non-expansion states in this analysis.
While all states have reported expenditure data for the January – December 2014 period, California and North Dakota have not reported enrollment data for that same period; other states had reported some but not all quarters.2 This brief examines the MBES data to be able to put the spending and enrollment for the expansion into the context of total spending and enrollment.
Who is eligible under the New Adult Group (Group VIII)
Newly-Eligible Adults. Beginning in 2014, newly eligible adults consist of non-elderly, non-disabled adults with incomes up to 138% FPL who would not be eligible for Medicaid under the rules that a state had in place on December 1, 2009. The ACA provides 100% federal financing for those made newly eligible for Medicaid by the law; the federal match rate falls to 95% in 2017, 94% in 2018, 93% in 2019, and then 90% in 2020 and beyond.
Other Group VIII Adults. Other Group VIII Adults include some childless adults in early expansion states as well as those who may be subject to technical adjustments. Some states already provided coverage at the traditional match rate to parents and adults without dependent children up to at least 100% FPL statewide as of March 23, 2010, when the ACA was enacted. The law provides additional federal funding to these states through the “expansion state match rate” for adults without dependent children under age 65; this “expansion state match rate” is higher than the traditional match rate.3 A few states were able to make adjustments to account for individuals who would not have been eligible because of asset test requirements in place on December 1, 2009, enrollment caps in effect for waiver populations receiving full benefits as of December 1, 2009, and other special circumstances. These adjustments may result in some adults being enrolled in the expansion category who do not qualify for the 100% federal match for newly eligible adults.4
Trends across All States
During calendar year 2014, Medicaid expenditures totaled $486.1 billion dollars. This includes Medicaid spending for all groups – the new adult group as well as the traditional Medicaid population (individuals with disabilities, the elderly, children, etc.) (Appendix Table 2) Spending for the new adult group represented only 10 percent of all Medicaid spending – the vast majority of Medicaid spending was for the traditional population, funded at the regular matching rate. (Figure 1) Across all states and all groups, federal dollars made up nearly 62 percent of Medicaid spending – reflecting both the regular matching rates for the traditional Medicaid population as well as the enhanced funds for the new adult group. The share of federal dollars funding Medicaid spending has increased; historically the federal share has been lower (57%.)
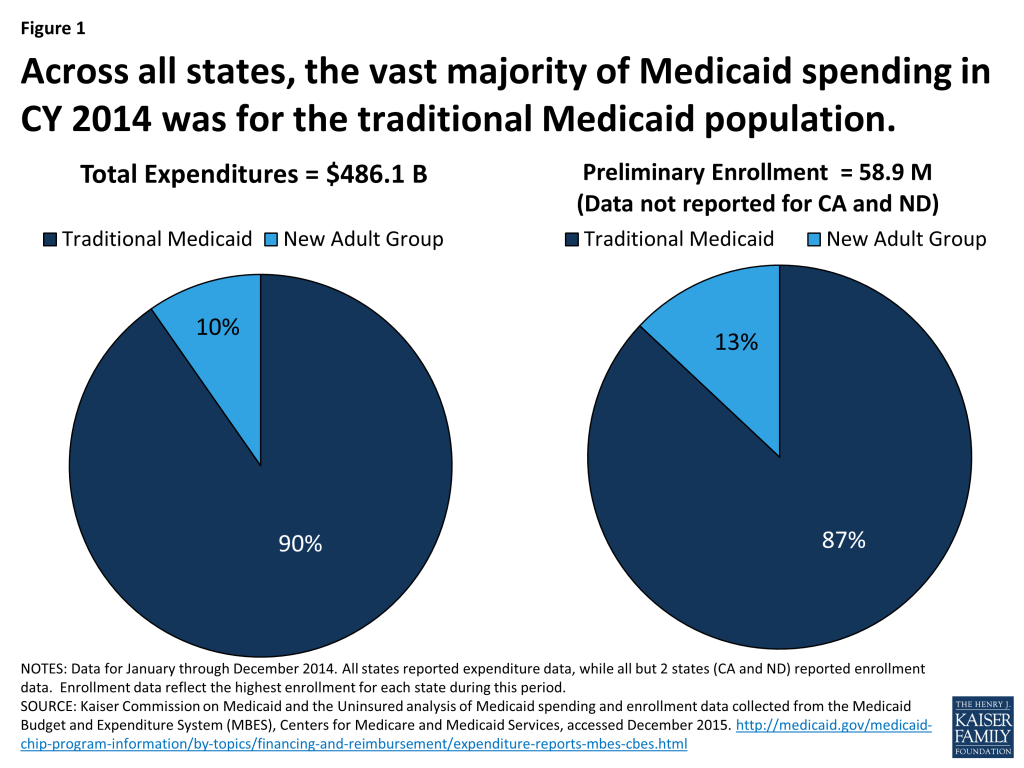
Over calendar year 2014, at least 58.9 million individuals were enrolled in Medicaid for at least some part of the year across the states that reported data. (Appendix Table 3) The inclusion of enrollment data as part of the MBES reporting process was new in 2014. While all states reported data for expenditures, not all states were able to report enrollment data, including large states like California. As revised data are published, this figure is expected to increase. Just as with spending, the new adult group made up a relatively small share (13%) of total Medicaid enrollment. (Figure 1) Among those states reporting both spending and enrollment data, spending per enrollee for the new adult group was much lower than total spending per enrollee across all groups (traditional Medicaid and the new adult group) – $4,513 vs. $7,150. (Figure 2)
Trends in Expansion States
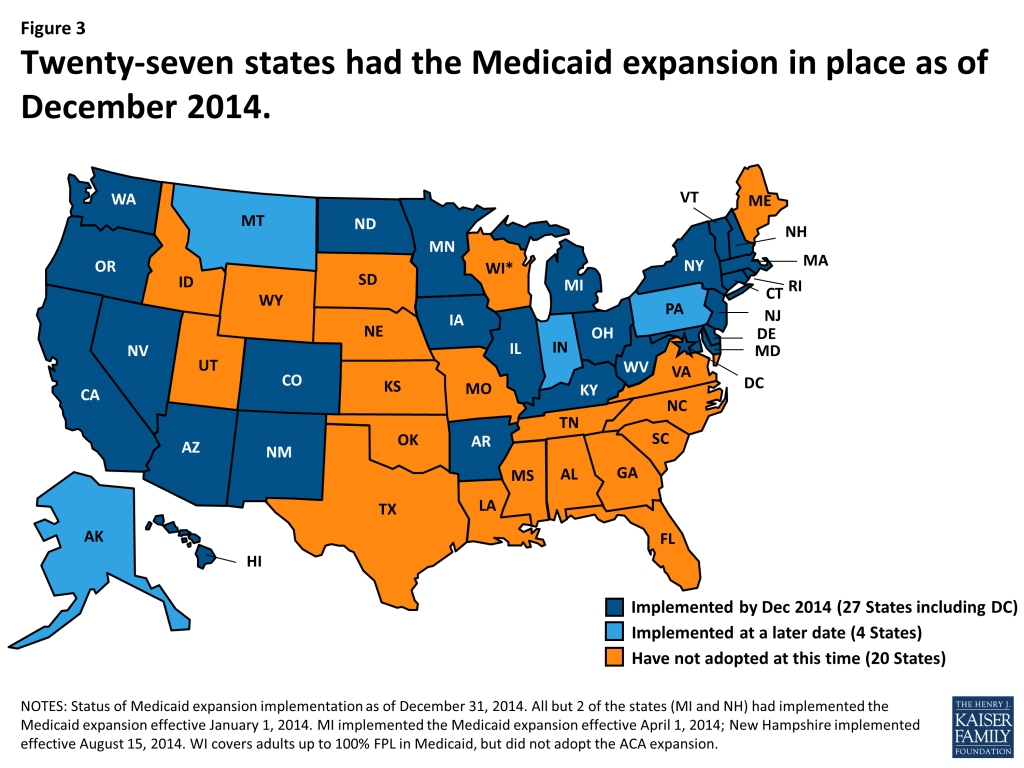
One of the major changes in the Affordable Care Act was the Medicaid expansion – establishing a new eligibility floor for non-elderly, non-disabled groups at 138 percent FPL and eliminating the long-standing exclusion of childless adults. The June 2012 Supreme Court decisions effectively made this optional for states. As of December 31, 2014, there were 27 states that had implemented the Medicaid expansion; states that expanded later (Pennsylvania, Indiana, Alaska and Montana) are treated as non-expansion states in this analysis. (Figure 3) The remainder of this analysis focuses on spending and enrollment trends in the 27 expansion states only.
Total and New Adult Group Spending
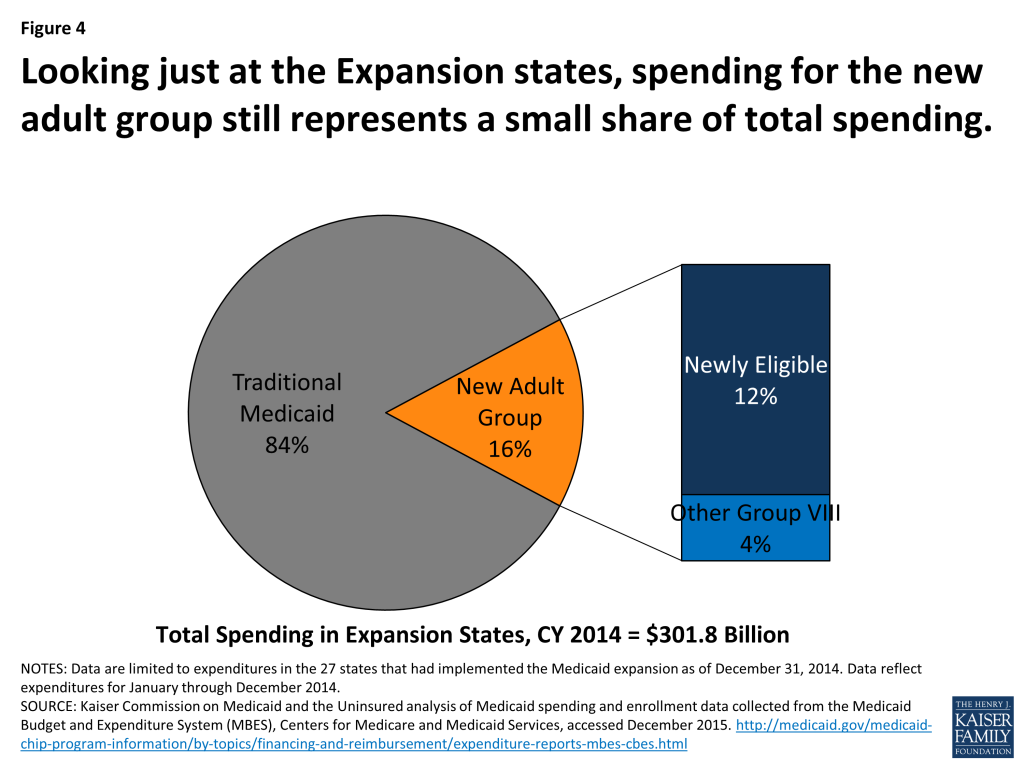
Across the 27 states that implemented the expansion during calendar year 2014, spending for the new adult group totaled $47.2 billion, representing 16 percent of total Medicaid spending across these states. (Figure 4) The vast majority of this spending (78%) was for those newly eligible adults whose expenditures qualify for the 100 percent federal match. The remaining share of spending for the new adult group was for those adults that were previously eligible at traditional match rates or subject to technical adjustments (see Box 1 for more details); expenditures for these adults are still matched at a higher rate than the traditional match rate, but not the 100 percent federal match.
Spending for the new adult group as a share of total Medicaid spending for this period varies across expansion states, ranging from more than 25 percent in Washington, Oregon and Kentucky to less than 10 percent in Illinois and New Hampshire (New Hampshire implemented the Medicaid expansion later – August 15, 2014.) (Figure 5)

Federal and State Spending Distribution of Spending
Across all expansion states, the federal share for all Medicaid spending in calendar year 2014 was 61 percent and the state share of spending was 39 percent (virtually the same as at the national level.) (Figure 6) However, there were large differences in these shares for the traditional Medicaid program and the new adult group.
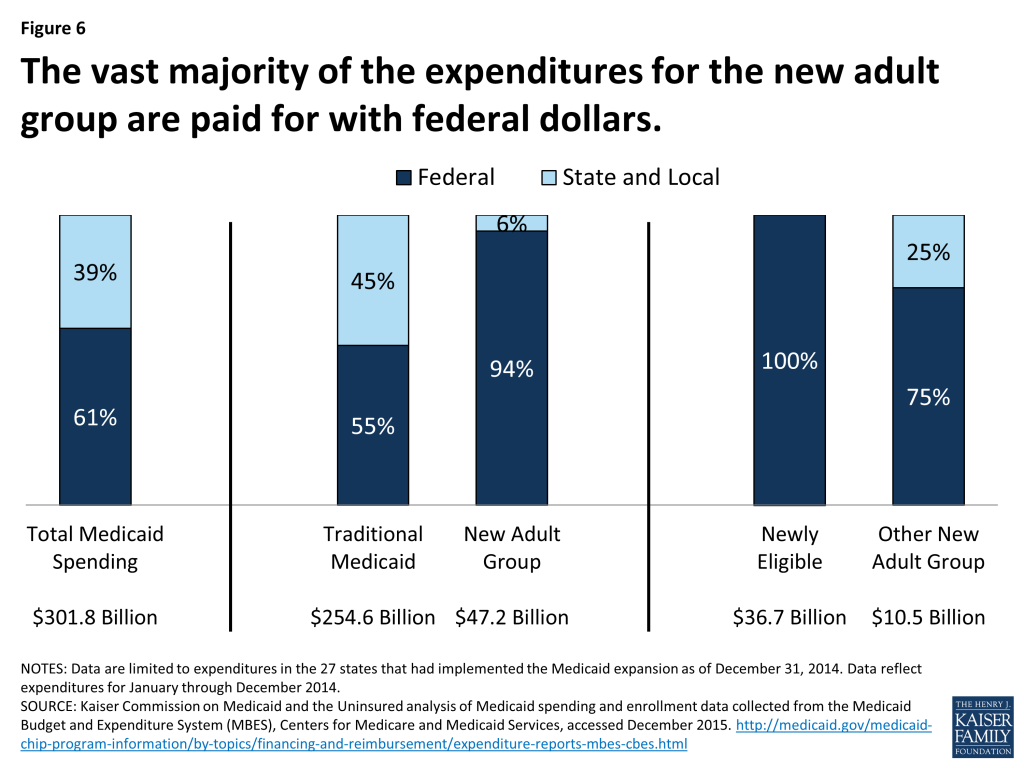
The federal government paid more than half of the costs for the traditional Medicaid population in expansion states (55%). This share varies by state according to the traditional FMAP. For the new adult group, virtually all of the expenditures (94%) were paid for with federal dollars. As noted earlier, the new adult group consists of spending for those newly eligible (which are paid for with 100% federal dollars) as well as some other adults that qualify for the new adult group but are not newly eligible. The newly eligible group accounted for more than 3 out of 4 dollars spent on the new adult group ($36.7 billion of the $47.2 billion in new adult group spending). While the other new adult enrollees are not eligible for the 100 percent federal match, the federal share for this group is still well above the traditional match rates that had previously applied to expenditures for these adults.
Distribution of Spending for the New Adult Group by State
In calendar year 2014, states claimed $47.2 billion in total Medicaid spending for the new adult group. Looking at the distribution across states, it is not surprising that larger expansion states had a higher share of expenditures for this group. Expenditures for the new adult group in California represent one quarter (26%) of all the expenditures for the new adult group during this period, followed by New York (14%), Washington (7%), Kentucky (5%) and Oregon (4%). Focusing just on expenditures for the newly eligible (which are 100% federally funded,) California reported one-third of all of these expenditures during this period, followed by Washington (9%), Kentucky, Oregon and New Jersey (all at 6%.) (Figure 7) Some large states, such as New York, Massachusetts and Arizona, which had expanded coverage prior to the ACA, reported larger shares of new adult group spending for other new adult group enrollees whose expenditures don’t qualify for the 100 percent federal match. However, even in these states the vast majority of expenditures for the new adult group were federal, as the expenditures for the other new adult group enrollees still received a higher federal match than the traditional match rate available before.

Total and Group VIII Enrollment
The MBES data have historically not included information about enrollment or spending by eligibility group. To account for the newly eligible federal match rate, CMS has revised the CMS-64 form to require states to report claims separately by eligibility group, including separate reporting for newly eligible adults, as well as to report enrollment by eligibility group. Since this data reporting process is new, ensuring that the data are comparable and accurate across states may take time. Moreover, because these initial data are preliminary, states may continue to provide updates to the enrollment data over time, so the numbers will change. Not all states were able to report enrollment data; enrollment data are not reported for California and North Dakota for all three quarters.
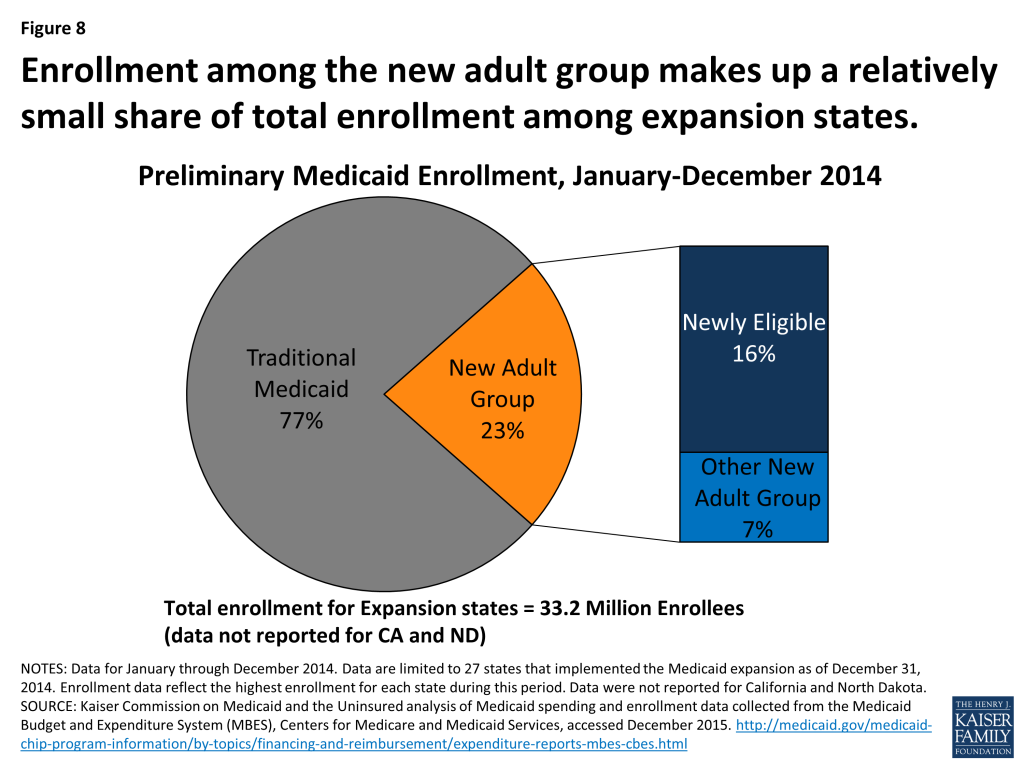
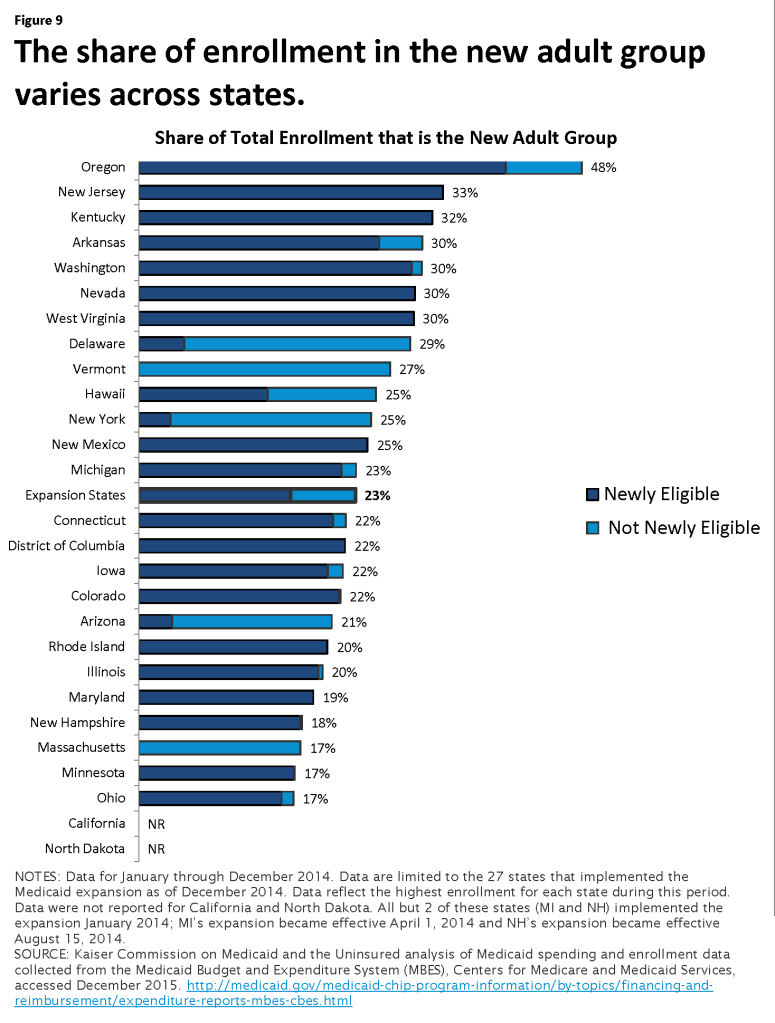
In the expansion states that reported enrollment data, approximately 23 percent of Medicaid enrollment was for the new adult group. (Figure 8) The remaining 77 percent of Medicaid enrollment was for those eligible under the “traditional” Medicaid program (e.g. children, pregnant women, elderly and individuals with disabilities.) However, this varies across expansion states. Enrollment in the new adult group made up nearly half of total enrollment in Oregon (48%) ranging down to 17 percent in Ohio, Minnesota and Massachusetts. (Figure 9)
The make-up of the new adult group (newly eligible vs. other) differs across expansion states. Across all expansion states, over two-thirds of enrollment in the new adult group were newly eligible (those whose expenditures are eligible for 100% federal match through December 2016.) While newly eligible adults made up the vast majority of new adult enrollment in many of the expansion states, there were a handful that saw the majority of enrollment in the new adult group among those not newly eligible (Arizona, Delaware, New York and Massachusetts.) (Figure 9) These states had expanded coverage to adults prior to the ACA.
Among the expansion states that reported enrollment data, the largest share of new adult enrollment was in New York (19% or nearly 1.5 million adults) followed by Illinois (8%), New Jersey, Washington and Michigan (7% each). These five states reported nearly half (47%) of all enrollment among the new adult group. However, the distribution of enrollment among newly eligible adults (those whose expenditures are eligible for 100% federal match through December 2016) differs slightly. Illinois accounted for the highest share of newly eligible adults (11%) followed by New Jersey (10%), Washington (9%), Michigan (9%) and Ohio (8%). As mentioned earlier, New York had expanded coverage to adults prior to the ACA so nearly 9 out of 10 adults eligible under the new adult group in New York are not newly eligible.
Spending per enrollee
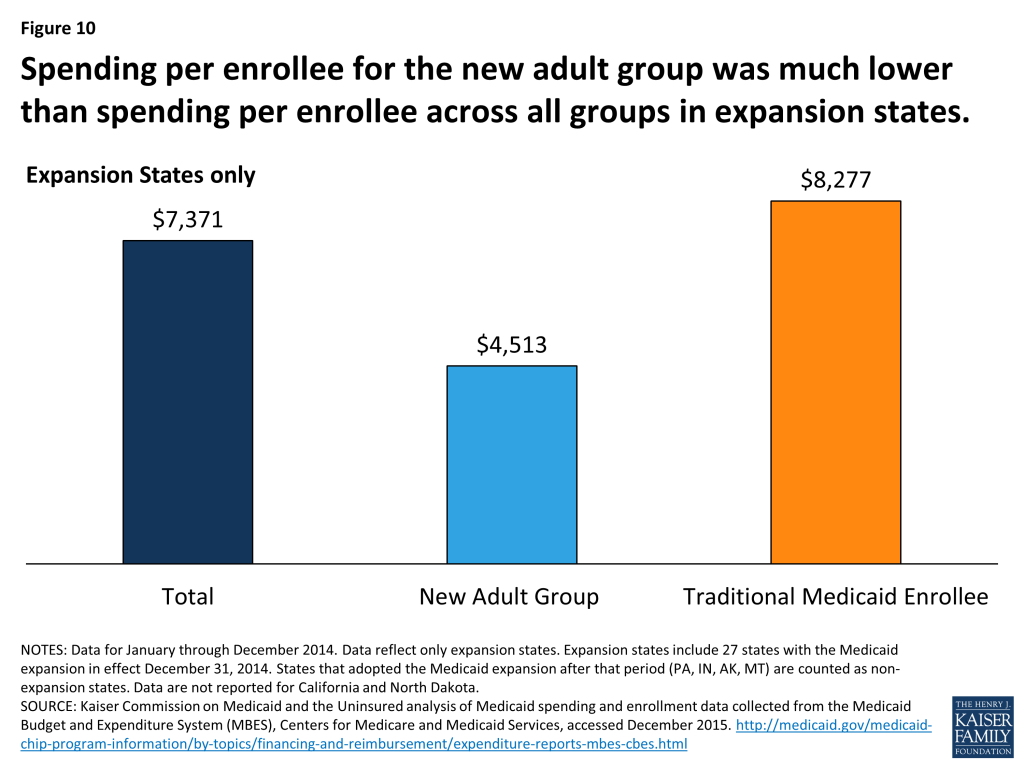
Because childless adults were historically excluded from the Medicaid program prior to the ACA, there was limited data and experience to draw on for determining what utilization and expenditures for this group would be. While the data are preliminary and missing large states such as California, the MBES data provides a window into what spending per enrollee for the new adult group looks like and how it compares to the rest of the Medicaid population. Spending per enrollee for the new adult group is notably lower than spending per enrollee across all groups in expansion states; average spending per enrollee for the new adult group was $4,513 compared to $7,371 per enrollee (new adult group and traditional Medicaid population). (Figure 10) This is in line with historical data on adult spending per enrollee, which has been roughly 60 percent of total spending per enrollee figures.
Spending per enrollee for those in the new adult group varied widely across states; spending per new adult group enrollee ranged from $8,461 in Rhode Island to $1,706 in New Hampshire (which implemented the Medicaid expansion later). (Appendix Table 4) This level of variation mirrors in large part variation in total spending per enrollee seen across these states as well as patterns in historic spending per enrollee data for adults. There are a number of factors that can lead to this wide dispersion in spending per enrollee figures including differences in health care costs across states and the relative health status of the underlying populations.
Looking Ahead
Data from the MBES released by the CMS provide monthly enrollment and quarterly expenditure data with specific information about enrollment and spending for the new adult eligibility group, also referred to as the “Group VIII.” This new MBES data on spending and enrollment provide further insight into the early effects of the Medicaid expansion on Medicaid spending and enrollment. However, the data are preliminary and this is the first time enrollment data have been collected as part of the claiming process. It also is incomplete with enrollment data missing from some states (California and North Dakota.) With additional updates and data from missing states, additional analyses can be conducted to understand differences across expansion states as well as difference across expansion and non-expansion states in terms of spending and enrollment patterns.
Methodology
Data from the Medicaid Budget and Expenditure System (MBES) released by the Centers for Medicare and Medicaid Services (CMS) provides monthly enrollment and quarterly expenditure data with specific information about enrollment and spending for the new adult eligibility group, also referred to as the “Group VIII.” States began reporting enrollment data for the quarter beginning January 1, 2014 and more recently began reporting expenditure data for the new adult group on the Form CMS-64.
Spending data made public reflect the first full year that the Medicaid expansion was in effect: the last three quarters of FFY 2014 (January – September 2014) and the first quarter of FFY 2015 (October – December 2014.) During this period, 27 states including DC, had implemented the Medicaid expansion; all but two of these states – Michigan (April 1, 2014) and New Hampshire (August 15, 2014) – implemented the Medicaid expansion January 1, 2014.
Expenditure data reported in this brief were summed across the four quarters. Data reflect all Title XIX expenditures reported by states; data do not include expenditures under Title XXI (CHIP).
Enrollment data reported are based on the maximum enrollment level reported across the four quarters in each state for Title XIX only (enrollment for under Title XXI or CHIP are excluded.) While this measure is used to try to capture the total number of enrollees over the entire period, it is likely an undercount of the number of enrollees ever on the program; more detailed forthcoming data sources on enrollment (such as the T-MSIS) will yield more accurate (and likely higher) enrollment data. Because different states saw higher levels of enrollment among the newly eligible and the not newly eligible in the new adult group (Group VIII) the Group VIII enrollment reported for states reflects the sum of the maximum newly eligible and the maximum of the not newly eligible. Traditional Medicaid figures are calculated taking the maximum total enrollment figure and subtracting the maximum Group VIII enrollment figure. National numbers for total, traditional Medicaid, Group VIII, newly eligible and not newly eligible enrollment all reflect summations of state maximums and therefore will not match data as reported by CMS. While all states have reported expenditure data for the January – December 2014 period, California and North Dakota have not reported enrollment data for that same period; DC, Colorado, Nevada New Jersey and Washington had reported some but not all months.
Spending per enrollee data are calculated taking the sum of expenditure data over the 4 quarters over the maximum enrollment level. Expenditure data from California and North Dakota were excluded from national calculations since these states did not report enrollment data. The maximum enrollment figure is intended to better capture all people touched by the program over the calendar year examined; however this figure is likely low and is expected increase over time as data are updated and missing data from states like California are added.
Appendices: Appendix A: Comparison To Other Available Data Sources
Spending. States have historically reported expenditure data through the MBES for claiming purposes; this is sometimes referred to as CMS-64 data. However, the expenditure data in this report may differ from other data reported from the MBES due to differences in timing as well as adjustments made to the data. For example, expenditure data from the MBES is commonly reported on a Federal Fiscal Year (FFY) basis (October 1 – September 30) whereas the data in this report reflect the calendar year (January 1 – December 31).
Enrollment Data. Since December 2013, CMS has been providing another source of monthly enrollment data for Medicaid and CHIP as part of its Medicaid and CHIP Performance Indicator Project. There are important differences between the Performance Indicator and MBES enrollment data that limit the ability to make comparisons between the two datasets, as discussed below and highlighted in Appendix Table 1:
- The data vary in their intended purpose. The MBES enrollment data are collected as part of the claiming process for federal Medicaid matching funds only, not CHIP. The Performance Indicator data are intended to provide timely insight into Medicaid and CHIP eligibility and enrollment trends to support program management and oversight.
- There are key differences in who is included in the enrollment data. The MBES enrollment data include all enrollees whose spending is eligible for Medicaid matching funds (including limited benefit waiver enrollees and Medicare enrollees that receive cost-sharing and premium assistance from Medicaid). In contrast, the Performance Indicator enrollment data only include enrollees that receive full benefit coverage. Moreover, the MBES enrollment data only include enrollment in Medicaid and not CHIP; the claiming process for CHIP, which has different matching rates, is done separately. The Performance Indicator data include enrollment for both Medicaid and CHIP.
- There are differences in the timing of the data. The MBES data include individuals enrolled in the state’s Medicaid program at any time during the month of the reporting period. In contrast, the Performance Indicator data are a point-in-time count based on the number of individuals enrolled as of the last day of the month. The MBES enrollment data cover the period between January and June 2015 (though only data through December 2014 is used in this analysis), while the most recent monthly Performance Indicator report included data through October 2015.
| Appendix Table 1: Differences Between CMS MBES and Performance Indicator Enrollment Data | ||
| MBES Data | Performance Indicator Data | |
| Eligibility Groups included | All Medicaid enrollees, including those receiving limited benefits (e.g., limited benefit waiver enrollees and Medicare enrollees receiving cost-sharing and premium assistance from Medicaid). Does not include CHIP enrollees. | Includes enrollees in Medicaid and CHIP enrollment. Does not include enrollees receiving limited benefits. |
| Enrollment data period | Total number of enrollees ever enrolled during the month. (Data are reported on a quarterly basis.) | Total number of enrollees as of the last day of the month. |
| Frequency of reporting | Quarterly | Monthly |
| Most recent data available as of December 2015 | June 2015 (only data through Dec 2014 are used in this analysis) | October 2015 |
| Data purpose | Collected as part of the claiming process for federal Medicaid matching funds. | Collected as part of new Medicaid and CHIP Performance Indicator Project to inform program management and oversight. |
Appendices: Appendix Table 2: Total Medicaid Expenditures, Cy 2014
| Appendix Table 2: Total Medicaid Expenditures, CY 2014 | ||||
| State | Total | New Adult Group | Newly Eligible | Not Newly Eligible |
| Alabama | $5,309,736,744 | N/A | N/A | N/A |
| Alaska | $1,618,158,522 | N/A | N/A | N/A |
| Arizona | $9,460,028,885 | $1,727,768,395 | $145,541,925 | $1,582,226,470 |
| Arkansas | $5,226,774,523 | $967,920,039 | $967,920,039 | N/A |
| California | $64,055,189,072 | $12,199,943,279 | $12,199,943,279 | N/A |
| Colorado | $6,368,524,285 | $992,468,785 | $968,850,624 | $23,618,161 |
| Connecticut | $7,494,388,273 | $1,200,936,868 | $1,181,124,042 | $19,812,826 |
| Delaware | $1,760,894,949 | $379,235,466 | $32,930,545 | $346,304,921 |
| DC | $2,334,112,770 | $297,107,909 | $282,271,893 | $14,836,016 |
| Florida | $21,336,121,602 | N/A | N/A | N/A |
| Georgia | $9,613,091,392 | N/A | N/A | N/A |
| Hawaii | $1,975,301,415 | $373,037,821 | $242,011,231 | $131,026,590 |
| Idaho | $1,683,668,434 | N/A | N/A | N/A |
| Illinois | $16,084,380,996 | $1,085,547,824 | $1,072,644,820 | $12,903,004 |
| Indiana | $9,317,184,653 | N/A | N/A | N/A |
| Iowa | $4,216,928,813 | $556,162,683 | $531,449,280 | $24,713,403 |
| Kansas | $2,842,501,614 | N/A | N/A | N/A |
| Kentucky | $8,595,156,527 | $2,176,007,998 | $2,176,007,998 | N/A |
| Louisiana | $7,031,732,700 | N/A | N/A | N/A |
| Maine | $2,497,790,662 | N/A | N/A | N/A |
| Maryland | $9,725,772,438 | $1,612,599,592 | $1,612,599,592 | N/A |
| Massachusetts | $15,033,457,934 | $1,554,743,109 | N/A | $1,554,743,109 |
| Michigan | $14,116,055,764 | $1,503,736,391 | $1,444,562,564 | $59,173,827 |
| Minnesota | $10,638,087,779 | $1,433,646,514 | $1,427,247,012 | $6,399,502 |
| Mississippi | $4,973,795,953 | N/A | N/A | N/A |
| Missouri | $9,034,749,004 | N/A | N/A | N/A |
| Montana | $1,105,703,601 | N/A | N/A | N/A |
| Nebraska | $1,831,650,567 | N/A | N/A | N/A |
| Nevada | $2,538,887,096 | $557,912,077 | $557,912,077 | N/A |
| New Hampshire | $1,437,357,944 | $50,174,127 | $49,928,108 | $246,019 |
| New Jersey | $13,422,100,485 | $2,077,884,888 | $2,077,884,888 | N/A |
| New Mexico | $4,488,133,924 | $1,015,477,316 | $1,015,477,316 | N/A |
| New York | $55,839,970,423 | $6,717,924,807 | $446,736,046 | $6,271,188,761 |
| North Carolina | $12,049,566,135 | N/A | N/A | N/A |
| North Dakota | $995,053,014 | $128,096,920 | $125,595,143 | $2,501,777 |
| Ohio | $19,867,991,538 | $1,955,996,607 | $1,842,525,912 | $113,470,695 |
| Oklahoma | $5,045,035,311 | N/A | N/A | N/A |
| Oregon | $7,279,593,596 | $2,107,572,240 | $2,107,572,240 | N/A |
| Pennsylvania | $22,961,627,929 | N/A | N/A | N/A |
| Rhode Island | $2,522,983,052 | $457,942,487 | $457,942,487 | N/A |
| South Carolina | $5,646,426,012 | N/A | N/A | N/A |
| South Dakota | $781,309,878 | N/A | N/A | N/A |
| Tennessee | $8,763,278,224 | N/A | N/A | N/A |
| Texas | $33,027,788,301 | N/A | N/A | N/A |
| Utah | $2,110,973,692 | N/A | N/A | N/A |
| Vermont | $1,561,688,259 | $211,439,523 | N/A | $211,439,523 |
| Virginia | $7,633,684,545 | N/A | N/A | N/A |
| Washington | $11,262,917,875 | $3,437,117,412 | $3,267,848,402 | $169,269,010 |
| West Virginia | $3,500,885,440 | $420,573,988 | $420,573,988 | N/A |
| Wisconsin | $7,547,033,281 | N/A | N/A | N/A |
| Wyoming | $540,533,820 | N/A | N/A | N/A |
| United States | $486,105,759,645 | $47,198,975,065 | $36,655,101,451 | $10,543,873,614 |
| NOTES: Data reflect expenditures for January through December 2014. See Methodology for more details.SOURCE: KCMU analysis of Medicaid spending and enrollment data collected from the MBES, CMS, accessed December 2015 | ||||
Appendices: Appendix Table 3: Preliminary Medicaid Enrollment, Cy 2014
| Appendix Table 3: Preliminary Medicaid Enrollment, CY 2014 | ||||
| State | Total | New Adult Group | Newly Eligible | Not Newly Eligible |
| Alabama | 1,050,254 | N/A | N/A | N/A |
| Alaska | 121,405 | N/A | N/A | N/A |
| Arizona | 1,732,726 | 359,093 | 61,709 | 297,384 |
| Arkansas | 871,098 | 265,032 | 224,870 | 40,162 |
| California | Data Not Reported | |||
| Colorado | 976,972 | 211,389 | 210,013 | 1,376 |
| Connecticut | 851,013 | 188,969 | 177,393 | 11,576 |
| Delaware | 205,356 | 59,841 | 9,961 | 49,880 |
| DC | 243,852 | 53,954 | 53,954 | – |
| Florida | 3,954,371 | N/A | N/A | N/A |
| Georgia | 1,793,252 | N/A | N/A | N/A |
| Hawaii | 333,090 | 84,838 | 46,061 | 38,777 |
| Idaho | 290,376 | N/A | N/A | N/A |
| Illinois | 2,992,947 | 590,415 | 577,455 | 12,960 |
| Indiana | 1,096,804 | N/A | N/A | N/A |
| Iowa | 553,661 | 121,275 | 112,326 | 8,949 |
| Kansas | 369,784 | N/A | N/A | N/A |
| Kentucky | 1,200,615 | 378,364 | 378,364 | – |
| Louisiana | 1,351,281 | N/A | N/A | N/A |
| Maine | 300,720 | N/A | N/A | N/A |
| Maryland | 1,160,217 | 217,282 | 217,282 | – |
| Massachusetts | 1,981,413 | 343,836 | – | 343,836 |
| Michigan | 2,162,402 | 504,430 | 470,828 | 33,602 |
| Minnesota | 1,105,285 | 185,011 | 183,824 | 1,187 |
| Mississippi | 736,517 | N/A | N/A | N/A |
| Missouri | 840,679 | N/A | N/A | N/A |
| Montana | 152,200 | N/A | N/A | N/A |
| Nebraska | 237,519 | N/A | N/A | N/A |
| Nevada | 556,116 | 164,906 | 164,906 | – |
| New Hampshire | 167,988 | 29,406 | 29,124 | 282 |
| New Jersey | 1,652,548 | 539,902 | 539,902 | – |
| New Mexico | 753,184 | 184,942 | 184,942 | – |
| New York | 5,992,264 | 1,494,419 | 202,684 | 1,291,735 |
| North Carolina | 1,935,493 | N/A | N/A | N/A |
| North Dakota | Data Not Reported | |||
| Ohio | 2,924,123 | 485,312 | 448,378 | 36,934 |
| Oklahoma | 765,374 | N/A | N/A | N/A |
| Oregon | 1,035,570 | 492,687 | 407,990 | 84,697 |
| Pennsylvania | 2,110,761 | N/A | N/A | N/A |
| Rhode Island | 267,327 | 54,126 | 54,126 | – |
| South Carolina | 1,193,222 | N/A | N/A | N/A |
| South Dakota | 108,302 | N/A | N/A | N/A |
| Tennessee | 1,504,276 | N/A | N/A | N/A |
| Texas | 4,330,364 | N/A | N/A | N/A |
| Utah | 323,730 | N/A | N/A | N/A |
| Vermont | 192,515 | 51,911 | – | 51,911 |
| Virginia | 931,238 | N/A | N/A | N/A |
| Washington | 1,678,876 | 510,155 | 492,358 | 17,797 |
| West Virginia | 527,194 | 155,636 | 155,636 | – |
| Wisconsin | 1,201,672 | N/A | N/A | N/A |
| Wyoming | 73,744 | N/A | N/A | N/A |
| United States | 58,891,690 | 7,727,131 | 5,404,086 | 2,323,045 |
| NOTES: Data reflect preliminary maximum enrollment in calendar year 2014. See Methodology for more details.SOURCE: KCMU analysis of Medicaid spending and enrollment data collected from the MBES, CMS, accessed December 2015. | ||||
Appendices: Appendix Table 4: Spending Per Enrollee In Expansion States, Cy 2014
| Appendix Table 4: Spending per Enrollee in Expansion States, CY 2014 | ||
| State | Spending per enrollee forthe new adult group (Group VIII) | Spending per enrollee across all groups(Traditional and Group VIII) |
| Arizona | $4,811 | $5,460 |
| Arkansas | $3,652 | $6,000 |
| California | ||
| Colorado | $4,695 | $6,519 |
| Connecticut | $6,355 | $8,806 |
| Delaware | $6,337 | $8,575 |
| District of Columbia | $5,507 | $9,572 |
| Hawaii | $4,397 | $5,930 |
| Illinois | $1,839 | $5,374 |
| Iowa | $4,586 | $7,616 |
| Kentucky | $5,751 | $7,159 |
| Maryland | $7,422 | $8,383 |
| Massachusetts | $4,522 | $7,587 |
| Michigan | $2,981 | $6,528 |
| Minnesota | $7,749 | $9,625 |
| Nevada | $3,383 | $4,565 |
| New Hampshire | $1,706 | $8,556 |
| New Jersey | $3,849 | $8,122 |
| New Mexico | $5,491 | $5,959 |
| New York | $4,495 | $9,319 |
| North Dakota | ||
| Ohio | $4,030 | $6,795 |
| Oregon | $4,278 | $7,030 |
| Rhode Island | $8,461 | $9,438 |
| Vermont | $4,073 | $8,112 |
| Washington | $6,737 | $6,709 |
| West Virginia | $2,702 | $6,641 |
| Expansion State Average | $4,513 | $7,371 |
| NOTES: Data for January through December 2014. Data are limited to the 27 states that had implemented the Medicaid expansion effective December 2014. Data reflect spending per enrollee for each state during this period using expenditures summed across the 4 quarters and the highest level of enrollment reported. Data were not reported for California and North Dakota. All but 2 of these states (MI and NH) implemented the expansion January 2014; MI’s expansion became effective April 1, 2014 and NH’s expansion became effective August 15, 2014.SOURCE: Kaiser Commission on Medicaid and the Uninsured analysis of Medicaid spending and enrollment data collected from the Medicaid Budget and Expenditure System (MBES), Centers for Medicare and Medicaid Services, accessed December 2015. http://medicaid.gov/medicaid-chip-program-information/by-topics/financing-and-reimbursement/expenditure-reports-mbes-cbes.html | ||
Endnotes
- Additionally, not all states reported enrollment data for all periods. The District of Columbia reported enrollment data for all but the first quarter (January – March 2014). Colorado reported enrollment data for only the first quarter (January – March 2014). Hawaii reported enrollment data for all but the last quarter (October – December 2014). Nevada, New Jersey and Washington reported enrollment data in each quarter, they did not report enrollment data for each month in the 4th quarter of 2014 (data were reported for December only). ↩︎
- Additionally, not all states reported enrollment data for all periods. The District of Columbia reported enrollment data for all but the first quarter (January – March 2014). Colorado reported enrollment data for only the first quarter (January – March 2014). Hawaii reported enrollment data for all but the last quarter (October – December 2014). Nevada, New Jersey and Washington reported enrollment data in each quarter, they did not report enrollment data for each month in the 4th quarter of 2014 (data were reported for December only). ↩︎
- Expansion states that do not have any newly-eligible Medicaid beneficiaries because they already covered people up to 138% FPL or higher (e.g. Massachusetts) also receive a temporary (January 1, 2014 through December 31, 2015) 2.2 percentage point increase in their federal matching rate for all populations. ↩︎
- Robin Rudowitz, “Understanding How States Access the ACA Enhanced Medicaid Match Rates”, Kaiser Family Foundation, September 2014. https://modern.kff.org/medicaid/issue-brief/understanding-how-states-access-the-aca-enhanced-medicaid-match-rates/ ↩︎