Premium Payments if Enhanced Premium Tax Credits Expire

Published: Sep 19, 2025

Enhanced premium tax credits (ePTCs), first introduced as part of the American Rescue Plan Act in 2021, have made ACA Marketplace coverage more affordable for the millions of enrollees that receive them. Enhanced tax credits have lowered the share of household income ACA Marketplace enrollees are expected to contribute out-of-pocket toward the premium payment for a benchmark silver plan. For those already eligible for premium subsidies, ePTCs have increased the total amount of tax credits the enrollee receives, while middle-income enrollees making above 400% of poverty ($62,600 for an individual enrolled in coverage for plan year 2026) have become newly eligible for the tax credits. The ePTCs were extended until the end of 2025 by the Inflation Reduction Act.

This data note compares how the out-of-pocket portion of premiums would differ if the ePTCs expire, or become extended, for select scenarios. (To produce your own estimate of how premium payments would differ compared to if the enhanced tax credits become unavailable, KFF provides an interactive tool where users are able to input their desired geography, income, and family size).  

Premium Payments Would Increase for Subsidized Marketplace Enrollees Without Enhanced Premium Tax Credits (ePTC)

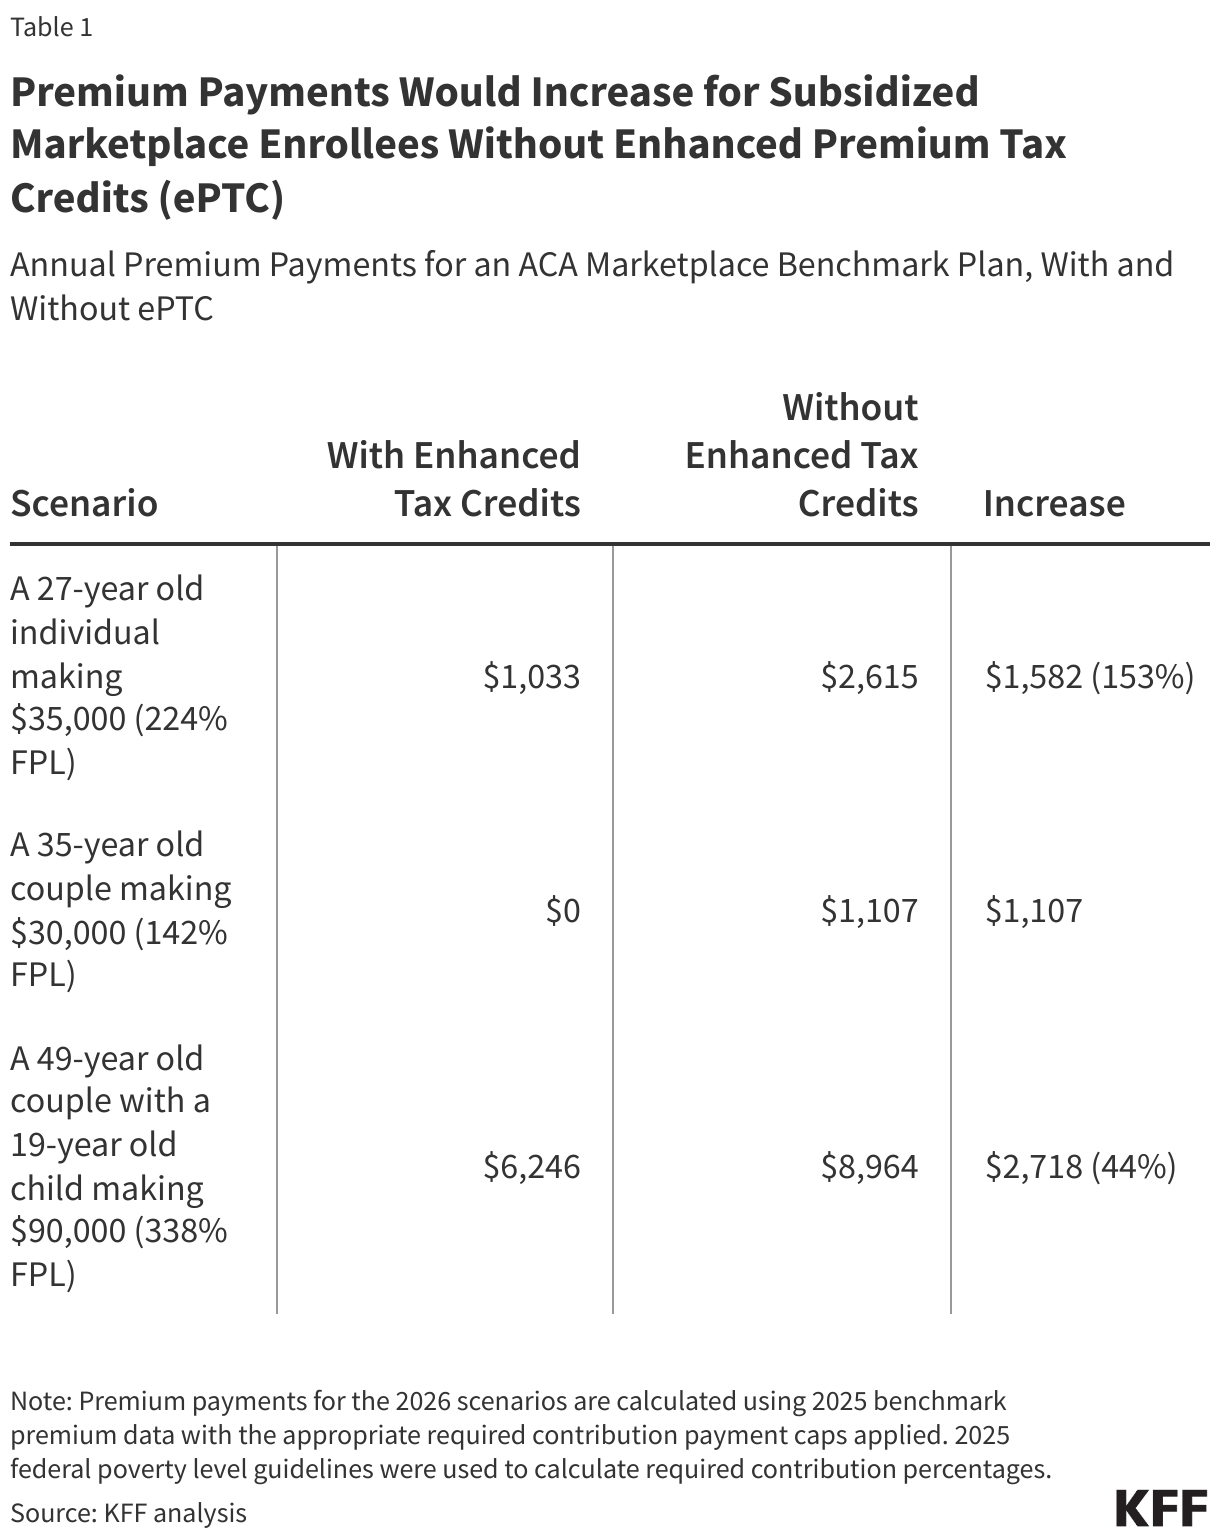
If enhanced premium tax credits expire, subsidized ACA Marketplace enrollees can expect their out-of-pocket premium payments to rise substantially. For example, a 27-year-old making $35,000 (224% of poverty) would pay $1,033 annually for a benchmark silver plan in 2026 with the ePTCs. Without the enhanced tax credits, however, they will pay $2,615 – a $1,582 (153%) increase.

With the enhanced tax credits in place, Marketplace enrollees making between 100%-150% of the federal poverty level are eligible for a fully subsidized benchmark plan. Prior to the availability of the ePTCs, enrollees making just above the poverty level were expected to contribute about 2% of their household income towards a benchmark plan. If the enhanced tax credits expire, low-income enrollees who are currently paying $0 for a benchmark plan will have to start paying for coverage again. For example, a 35-year-old couple earning $30,000 can expect to start paying $1,107 annually for a Marketplace benchmark plan.

What happens if premiums rise substantially in 2026?

There are two ways of thinking about premiums in the ACA Marketplaces. First, there is the net premium, which is what the enrollee pays out-of-pocket after taking into account their tax credit. Second, there is the gross premium, which is the amount the insurance company charges (part of which is paid by the federal government and part of which is paid by the enrollee). The expiration of the enhanced premium tax credits will affect the net premium directly (as enrollees receive less financial assistance) and it will also indirectly affect the gross premium insurers charge.

A KFF analysis of rates (gross premiums) proposed by Marketplace insurers for the 2026 plan year found that insurers are requesting a median increase of 18% in their rates. Insurers cited several reasons for these rate increases, including that they anticipate that some healthier members will leave the ACA Marketplaces once their net (or, out-of-pocket) premium payments increase if the ePTCs expire. This results in an enrollee base that is less healthy and more expensive, on average. Insurers say that rates are rising by about 4 percentage points more than they otherwise would, due to the expiration of the enhanced premium tax credit.

If enhanced premium tax credits expire, enrollees with incomes between the poverty level and four times the poverty level will continue to be eligible for financial assistance – they will just receive a smaller tax credit than they currently do. As shown in the examples above, these enrollees will pay significantly more for their monthly premium, but they will still pay a certain percent of their income for the benchmark silver plan. In other words, the increase in their monthly premium will primarily be a result of a smaller tax credit — the amount subsidized enrollees pay is largely shielded from increases in the amount insurance companies charge.

However, if enhanced premium tax credits expire, people with incomes over four times the poverty level will no longer be eligible for any financial assistance. Because their monthly payments will no longer be tied to a certain percentage of their income, these enrollees will not only lose financial assistance but will also be exposed to any increase in underlying gross premiums. With the enhanced tax credits, middle-income enrollees making above 400% of poverty currently have their out-of-pocket premium payments for a benchmark plan capped at 8.5% of their income. However, if the ePTCs are not renewed, these enrollees will experience a “double whammy” – losing their eligibility for Marketplace premium tax credits and facing the annual increases in the cost of a Marketplace plan.

Enrollees Making Above 400% of Poverty Will Lose All Financial Assistance Without Enhanced Premium Tax Credits

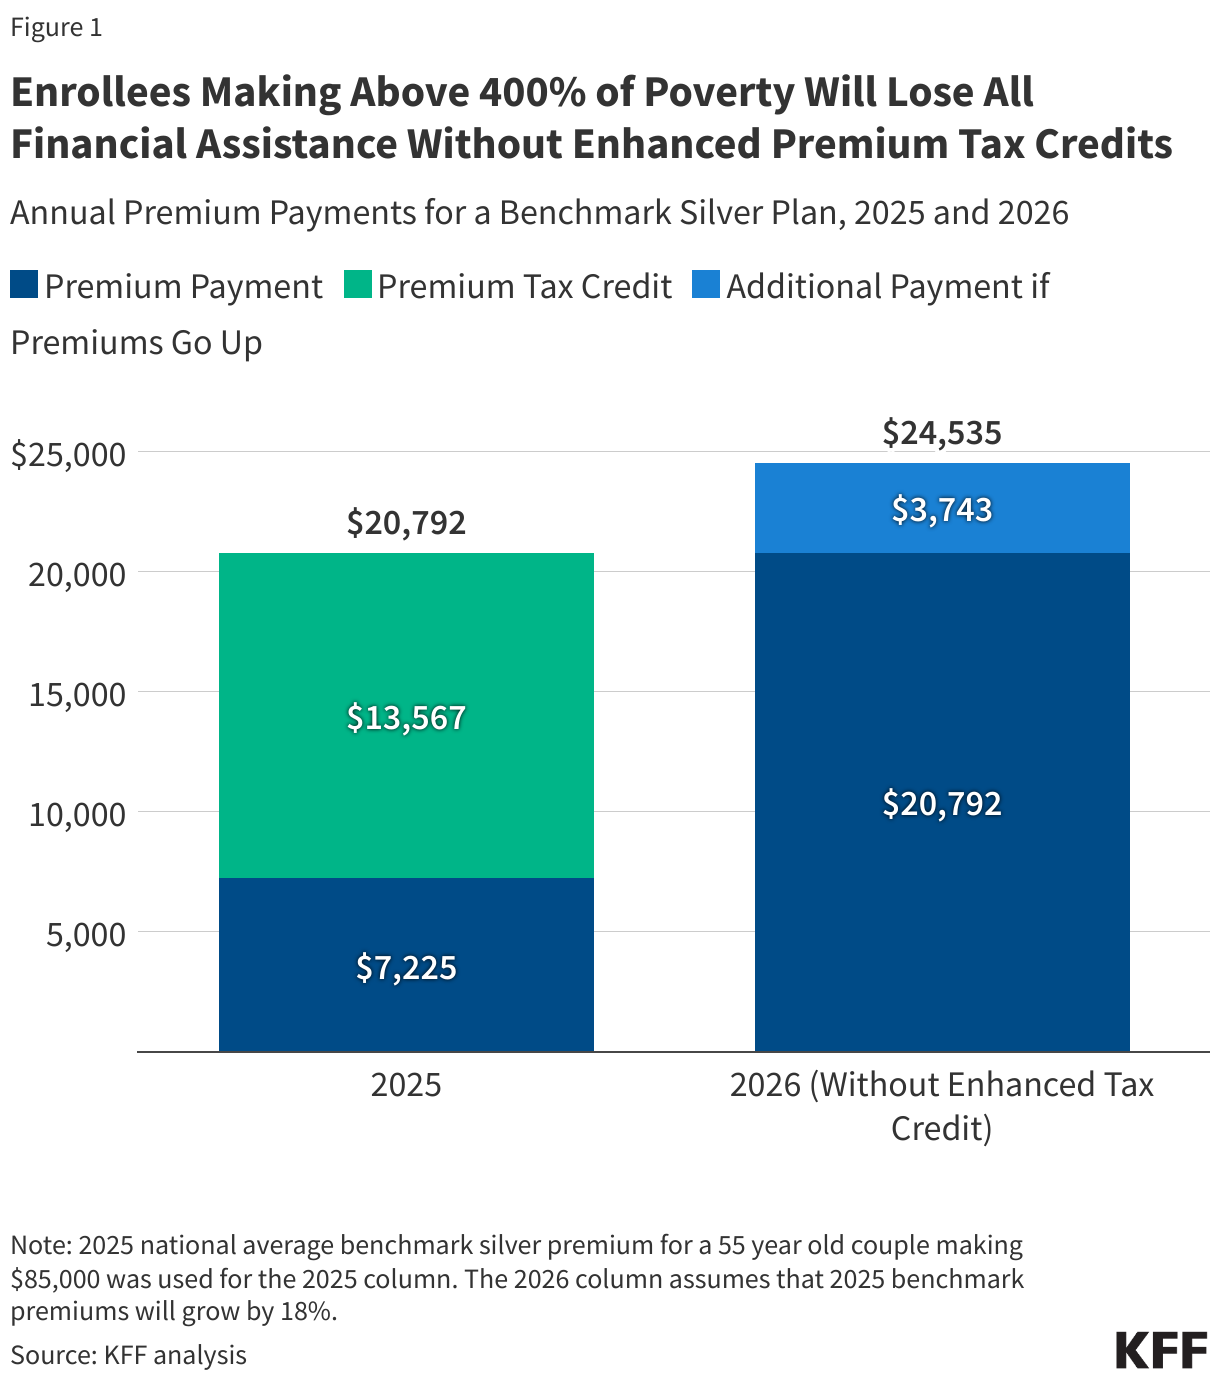
On average, a 55-year-old couple making $85,000 is currently receiving $13,567 in premium tax credits annually, covering 65% of the total cost of a benchmark plan. If the ePTCs expire, this couple would lose financial assistance and pay the full annual cost of $20,792, assuming premiums stay the same. However, if the gross premium grows at a rate of 18% into 2026, the 55-year-old couple can expect their net (out-of-pocket) premium payments to more than triple if ePTCs expire, increasing by $17,310 (240%), from $7,225 to $24,535 annually for the same plan.

How do Trump Administration Regulations Affect Premium Payments?

The maximum household required contribution for a benchmark ACA Marketplace plan is indexed annually to adjust for growth in premiums relative to income. Since the introduction of enhanced premium tax credits, new (and more generous) required contribution levels for premiums were implemented without annual adjustment.

As the ePTCs are set to expire, the IRS has released the required contributions for 2026. The Trump administration introduced changes in the calculation of required contribution through the Marketplace Integrity and Affordability rule earlier this year. Compared to the indexing methodology in place previously, the maximum out-of-pocket contribution for benchmark premiums for those that receive premium tax credits has increased as a share of income.

Prior estimates indicated that in 2024, out-of-pocket premium payments among subsidized enrollees would have been over 75% higher without the enhanced tax credits. Enrollees could expect to pay even more in 2026, on average, due to annual increases in the average costs of premium and IRS changes to the contribution requirements.

Methods

Premium data for 2025 is used in table 1 as rates for 2026 have not yet been finalized. Premium data for 2025 were obtained from Centers for Medicare and Medicaid Services (CMS), insurer rate filings, and information directly received or collected by KFF researchers from state exchanges or insurance departments. To isolate the effect on premiums without enhanced tax credits in table 1, the maximum required contribution was calculated using the federal poverty threshold for 2025, comparing the applicable percentage under the IRA to what is expected for 2026. In figure 1, the 2025 scenario reports values using required contribution and poverty guidelines in place for plan year 2025. An additional 18%  increase is applied in the 2026 (without enhanced tax credit) scenario to model annual increases in premiums.

News Release

Dave A. Chokshi Joins KFF Board of Trustees

Published: Sep 18, 2025

San Francisco – KFF announced today that Dr. Dave Ashok Chokshi, a practicing physician and health leader, has joined KFF’s Board of Trustees.

 Dr. Chokshi is a physician at Bellevue Hospital as well as Sternberg Family Professor of Leadership at the City College of New York. From 2020 to 2022, he served as the 43rd Health Commissioner of New York City, where he led the city’s response to the COVID-19 pandemic, including its historic campaign to vaccinate over six million New Yorkers. 

“Dr. Chokshi is a tremendous addition to KFF and our board as we confront new and unprecedented challenges in health policy and public health,” said Dr. Drew Altman, KFF’s President and CEO.

 “There could not be a more vital moment for the work of KFF,” said Dr. Chokshi. “I have long admired KFF’s focus on how policy affects people, and its unwavering pursuit of truth through data, research, and journalism. I am honored to join the Board and excited to contribute to this essential mission.” 

 Dr. Chokshi also serves as chair of the Common Health Coalition, a nonpartisan, not-for-profit organization dedicated to strengthening partnership across healthcare and public health. He is also co-chair of the Health and Political Economy Project.

Dr. Chokshi’s prior experience includes appointment as the inaugural Chief Population Health Officer at NYC Health + Hospitals (H+H), the largest public healthcare system in the nation, where he also served as CEO of the H+H Accountable Care Organization. Dr. Chokshi has practiced primary care internal medicine at Bellevue Hospital since 2014, and his current clinical practice focuses on people experiencing homelessness.

 In addition to KFF, he is currently a board member for Community Solutions, Rock Health, and Yuvo Health.

KFF’s Board of Trustees is chaired by former U.S. Senator Olympia Snowe and its 13 members have deep backgrounds in public service, academia, nonprofit organizations, health care, and the media.
Board members serve up to two five-year terms. Additional information about KFF’s board can be found here.

Key Global Health Positions and Officials in the U.S. Government

Published: Sep 18, 2025

This tracker is updated periodically and currently reflects major positions known to be filled or likely to be retained thus far in the second Trump administration (other key roles will be added as filled). Some of the officials noted in this tracker may be on administrative leave and not performing the duties of their roles under direction from the Trump administration.

PositionOfficial
WHITE HOUSE/EXECUTIVE OFFICE OF THE PRESIDENT
National Security Advisor/Assistant to the President for National Security Affairs, National Security Council (NSC)Marco Rubio
Director, Office of National AIDS Policy (ONAP)Vacant
Director, Office of Management and Budget (OMB)Russ Vought
U.S. Trade Representative, Office of the United States Trade Representative (USTR)Jamieson Greer
Director, Office of Science and Technology Policy (OSTP)Michael Kratsios
Director, Office of Pandemic Preparedness and Response Policy (OPPR)Vacant
DEPARTMENT OF STATE
Secretary of StateMarco Rubio
Permanent U.S. Representative to the United Nations, U.S. Mission to the United NationsMike Waltz (Designate)
Dorothy Shea
Senior Official, Under Secretary for Foreign Assistance, Humanitarian Affairs and Religious FreedomJeremy Lewin
Senior Bureau Official and Acting Global AIDS Coordinator, Bureau of Global Health Security and DiplomacyJeffrey Graham
Principal Deputy Coordinator for PEPFAR, Bureau of Global Health Security and DiplomacyRebecca Bunnell
Senior Advisor for Global Health Security and Diplomacy, Bureau of Global Health Security and DiplomacyBrad Smith
Senior Bureau Official, Bureau of Democracy, Human Rights, and LaborJacob McGee
Senior Bureau Official, Bureau of Population, Refugees, and MigrationSpencer Chretien
Principal Deputy Director, Office of Global Women’s IssuesKatrina Fotovat
Senior Bureau Official, Bureau of International Organization AffairsMcCoy Pitt
Assistant Secretary of State for Oceans and International Environmental and Scientific Affairs (OES)John Thompson
DEPARTMENT OF HEALTH AND HUMAN SERVICES (HHS)
SecretaryRobert F. Kennedy Jr. 
Assistant Secretary for Global Affairs, Office of Global Affairs (OGA)Vacant
Assistant Secretary for HealthDorothy Fink
Surgeon GeneralCasey Means (Designate)
Principal Deputy Assistant Secretary for Preparedness and Response, Office of the Assistant Secretary for Preparedness and Response (ASPR)John Knox
Director, Center for the Biomedical Advanced Research and Development Authority (BARDA), ASPRGary Disbrow
HHS/CENTERS FOR DISEASE CONTROL AND PREVENTION (CDC)
DirectorJim O’Neill
Director, Office of Readiness and ResponseHenry Walke
Director, Washington OfficeJeff Reczek
Director, Global Health Center (GHC)Paige Alexandra Armstrong
Director, Division of Global Health Protection, GHCBenjamin Park
Director, Division of Global HIV and TB, GHCHank Tomlinson
Director, Global Immunization Division, GHCJohn Vertefeuille
Director, Division of Parasitic Diseases and Malaria, National Center for Emerging and Zoonotic Infectious Diseases (NCEZID)Simon Agolory
Director, Influenza Division, National Center for Immunization and Respiratory Diseases (NCIRD)Vivien Dugan
HHS/NATIONAL INSTITUTES OF HEALTH (NIH)
DirectorJay Bhattacharya
Director, National Institute of Allergy and Infectious Diseases (NIAID)Jeffrey Taubenberger
Director, Office of Global Research, NIAIDJoyelle Dominique
Director, Division of AIDS, NIAIDCarl Dieffenbach
Director, Division of Microbiology and Infectious Diseases (DMID), NIAIDJohn Beigel
Director, Vaccine Research Center, NIAIDTed Pierson
Director, Office of AIDS Research (OAR); NIH Associate Director for AIDS ResearchGeri Donenberg
Director, Fogarty International Center (FIC); NIH Associate Director for International ResearchPeter Kilmarx
Director, Center for Global Health, Office of the Director, National Cancer InstituteSatish Gopal
Director, Office of Global Health, Office of the Director, National Institute of Child Health and Human DevelopmentVesna Kutlesic
Director, Center for Global Mental Health Research, National Institute of Mental HealthLeonardo Cubillos
HHS/FOOD & DRUG ADMINISTRATION (FDA)
CommissionerMarty Makary
Deputy Commissioner for Policy, Legislation, and International AffairsGrace Graham
Associate Commissioner for Global Policy and StrategyMark Abdoo
HHS/HEALTH RESOURCES AND SERVICES ADMINISTRATION (HRSA)
AdministratorThomas Engels
Associate Administrator, Bureau of HIV/AIDSHeather Hauck
Director, Office of Global Health, Office of Special Health InitiativesMelissa Ryan Kemburu
DEPARTMENT OF DEFENSE (DoD)
SecretaryPete Hegseth
Assistant Secretary of Defense for Health Affairs, Personnel and Readiness (P&R)Keith Bass (Designate)
Steve Ferrara
Commander, Naval Medical Research Command (NMRC)Eric Welsh
Director, DoD HIV/AIDS Prevention Program (DHAPP)Brad Hale
Commander, Walter Reed Army Institute of Research (WRAIR)Brianna Perata
Director, U.S. Military HIV Research Program (MHRP)Julie Ake
Chief, Armed Forces Health Surveillance Division (AFHSD)Richard Langton
Chief, Global Emerging Infections Surveillance (GEIS), AFHSDVacant
OTHER AGENCIES AND DEPARTMENTS
Peace Corps*: DirectorPaul Shea
Council of the Inspectors General on Integrity and Efficiency*: Chair, Pandemic Response Accountability CommitteeMichael Horowitz
Council of the Inspectors General on Integrity and Efficiency*: Executive Director, Pandemic Response Accountability CommitteeKenneth Dieffenbach
Department of Agriculture (USDA): SecretaryBrooke Rollins
Environmental Protection Agency (EPA)*: Assistant Administrator for International and Tribal AffairsVacant
Department of Homeland Security (DHS): Chief Medical OfficerDev Jani
Notes: Acting officials in italics. Officials who the White House has signaled it intends to nominate or who are formally awaiting Senate confirmation are noted as “Designate.” tbd means to be determined. As of September 5, 2025. Also see NIH/FIC, Global Health Initiatives at NIH, available at: https://www.fic.nih.gov/Global/Global-Health-NIH/Pages/institute-center-ics-global-health.aspx.

What Could the Health-Related Provisions in the Reconciliation Law Mean for Older Adults?

Published: Sep 17, 2025

Editorial Note: This brief was updated on September 17, 2025 to reflect language in the final bill enacted July 4, 2025.

On July 4, President Trump signed into law the budget reconciliation bill, previously known as “One Big Beautiful Bill Act.” The law includes several policy changes that could have significant implications for the health and health coverage of older Americans ages 50 and older, including those who are covered by Medicare.

The reconciliation law as enacted includes an estimated $911 billion in federal Medicaid spending cuts over the next 10 years, including several provisions expected to increase costs or eliminate coverage for Medicaid beneficiaries. Collectively, these provisions could affect the 22 million people ages 50 and older with coverage under the Medicaid program by reducing the number of people with Medicaid and reducing access to health and long-term care services for people who remain enrolled in the program. The reconciliation bill also includes changes that are expected to reduce the number of people with ACA Marketplace coverage, including among individuals between the ages of 50 and 64.

According to KFF’s Health Tracking Poll conducted in July of 2025 less than half (42%) of older adults have a favorable view of the just-passed tax and budget law, including 39% of people ages 50-64 and 44% of adults ages 65 and older, with far stronger support among older adults who are Republicans (83%) than those who are independents (25%) or Democrats (3%). (See Figure 1 below).

Opinions About the GOP's So-Called "One Big Beautiful Bill" Recently Signed Into Law Are Highly Partisan Among Older Adults

Below are seven health-related provisions to watch as provisions of the 2025 budget reconciliation law are implemented.

1. New Medicaid Work Requirements. The largest source of federal Medicaid spending cuts will come from new work requirements that will be imposed on the Medicaid expansion population. The Congressional Budget Office (CBO) estimates that the work requirements would reduce Medicaid spending by $326 billion and cause nearly 5 million people to become uninsured.

The new law requires adults ages 50-64 to meet new work and reporting requirements if they are enrolled through the ACA expansion. Most Medicaid enrollees ages 50-64 are working or could be exempt from the work requirements because of a disability or caregiving responsibility, but they will still need to comply with reporting requirements, putting them at risk of risk losing Medicaid coverage. According to a new KFF analysis, fewer than half of adults ages 50-64 would meet the work requirements through either employment or school, compared with 72% of adults ages 19-27 and 66% of adults ages 27-49.

2. Changes to ACA Marketplaces. An estimated 5.5 million adults ages 55 to 64 get health insurance from ACA Marketplaces in 2025. The law makes changes to the ACA Marketplaces that will increase the number of people who are uninsured, including older people ages 50-64. Combined with the Trump administration Marketplace integrity rules, the law will shorten the open enrollment period, impose new documentation and pre-enrollment verification of eligibility requirements, and make other changes that would affect enrollment. Overall, the outcome will be loss of health insurance coverage for as many as 3 million people by 2034, including older adults.

Further, because the law does not extend enhanced ACA premium tax credits for Marketplace coverage that are set to expire at the end of 2025, an additional 4.2 million people (including older adults) are estimated to lose coverage by 2034. Without enhanced premium tax credits, Marketplace enrollees with incomes over four times poverty will lose subsidy eligibility and those with incomes between 100% and 400% of poverty will receive a smaller tax credit.

Over half of individual market enrollees with incomes above four-times the poverty threshold are between the ages of 50 and 64, which means that older adults will be disproportionately affected if the premium tax credits are not extended beyond this year. Furthermore, the loss of premium tax credits for those over 400% of poverty means that group will bear the full cost of any premium increases on top of the loss of financial assistance. Premiums are expected to increase by about 18% in 2026.

Health insurance premiums are higher for people in their 50s and early 60s than for younger adults choosing the same plan in the same area. If the enhanced premium tax credits expire, Marketplace enrollees currently receiving a subsidy could face higher costs to enroll, particularly if their incomes are about or above 400% of poverty. For example, according to the KFF calculator, a 59-year-old single widow living in Jackson, Missouri earning $63,000 (just above 400% of the poverty level) would pay $5,355 for her silver Marketplace plan in 2026 if Congress acts to extend the enhanced premium tax credits before the end of this year. But if Congress does not extend the enhanced premium tax credits, she could pay more than twice the amount—$14,213 in premiums a year—or 22.9% of her income for the same health insurance policy. It’s not hard to see why she and others like her might give up their Marketplace plans, given the cost relative to their income.

3. Placing a Moratorium on Implementation of the Medicare Savings Program and Medicaid Eligibility and Enrollment Rules. Older adults are also at risk of losing coverage due to provisions in the law that impose a moratorium on implementation of most provisions in two Biden-era rules that were intended to streamline the enrollment process for Medicaid, especially for older adults and people with disabilities. The fourth largest source of federal reductions in Medicaid spending stems from these two provisions, which are collectively estimated to reduce federal Medicaid spending by $122 billion.

Both rules aimed to reduce barriers to enrolling in and maintaining Medicaid coverage. They were expected to disproportionately affect enrollment among older adults and people with disabilities because they included specific requirements related to streamlining Medicaid enrollment among Medicare beneficiaries, and to facilitating smoother enrollment for people who are eligible for Medicaid because they have a disability, are ages 65 and older, or use long-term care.

Earlier CBO analysis showed that delaying implementation of these rules would mean that 1.3 million fewer Medicare beneficiaries would also have Medicaid coverage in 2034. That number may be lower under the law as enacted based on the Senate’s changes to the legislation, because CBO’s estimates of the savings associated with the provisions decreased from $167 billion prior to those changes to $122 billion for the law as enacted. A separate KFF analysis shows that the loss of these Medicaid benefits would result in a someone with an income of $967 per month paying $185 per month in Medicare premiums, or about 20% of income, without accounting for other non-trivial out-of-pocket costs, including Medicare cost-sharing requirements and the loss of Medicaid benefits.

4. Reducing Spending for Long-Term Care Services.The reconciliation law could also reduce federal funds for nursing facilities and would likely lead to reductions in spending for other long-term care services. The law will reduce federal Medicaid spending by $23 billion over 10 years by prohibiting implementation of a Biden Administration rule on nursing facility staffing. The rule had aimed to help address long-standing concerns about inadequate staffing and the quality of care, but the law locks into place a federal judge’s ruling to overturn key elements of the rule.

The reconciliation law could also reduce Medicaid funds available to nursing facilities through a moratorium on provider taxes (in place for nursing facilities in 46 states) and new limits on some payments to nursing facilities (known as state-directed payments). Savings from provisions affecting provider taxes and state-directed payments account for $340 billion in reduced federal Medicaid spending over 10 years, although they would also affect hospitals and other providers. KFF estimates that at least 29 states would have to reduce existing state-directed payments to hospitals or nursing facilities under the enacted legislation.

If experience from the past is a guide, substantial cuts to federal Medicaid spending could lead to reduced spending on home care, which includes long-term care provided in people’s homes and the community (and is sometimes referred to as home- and community-based services or HCBS). During the last major reduction in federal spending, all states reduced spending on home care by serving fewer people (40 states) or by benefits or cutting payment rates (for long-term care providers) (47 states). As a significant source of Medicaid spending comprised of optional services for which there are already waiting lists, home care may be especially vulnerable.

5. Ending Medicare Eligibility for Previously Eligible People with Lawful Immigrant Status. Under current law, undocumented immigrants are not eligible for Medicare. Medicare coverage is restricted to people who are citizens or permanent legal residents. The 2025 budget reconciliation law prevents defined groups of individuals who are lawfully present in the U.S. from becoming eligible for Medicare benefits and terminates Medicare coverage for currently eligible beneficiaries who are not U.S. citizens, green card holders, certain Cuban-Haitian entrants, and people residing under the Compacts of Free Association no less than 18 months from enactment. Individuals affected by this provision and their employers would continue to be required to pay Medicare payroll taxes. This is the first time that Congress has eliminated Medicare coverage from previously eligible legally residing individuals. According to CBO, the provision will save $5.1 billion over 10 years, and result in 0.1 million Medicare beneficiaries losing their Medicare coverage as of 2034.

6. Adding Work Requirements and Cutting Federal Spending for Supplemental Nutritional Assistance Program (SNAP). The reconciliation law reduces federal spending for SNAP by about $186 billion. Reductions of this magnitude, coupled with work requirements, are likely to affect the health of older adults, particularly given the strong ties between health and nutrition. As noted above, work requirements, even with exemptions, pose administrative hurdles for older adults that put them at risk for losing SNAP benefits. An estimated 9.2 million Medicare beneficiaries received SNAP benefits to help cover the costs of food and groceries in 2022, according to a KFF analysis. The SNAP work requirements may particularly exacerbate financial challenges for older Medicaid enrollees ages 50 and older who are two and a half times more likely to experience food insecurity than other older adults not enrolled in Medicaid (28% compared to 10%).

7. Modifying the Medicare Drug Price Negotiation Program to Delay or Exempt Certain High-Spending Drugs from Negotiation. Under the Medicare Drug Price Negotiation Program, the federal government is required to negotiate with drug companies for the price of some high-spending drugs that have been on the market for several years without competition, with the goal of lowering Medicare drug spending and helping to reduce out-of-pocket costs for people with Medicare. The law that created the negotiation program exempted drugs from negotiation if they were designated and approved for only one rare disease or condition (known as orphan drugs).

The reconciliation law exempts orphan drugs from Medicare drug price negotiation if they are approved for two or more rare diseases or conditions, not just a single rare disease. It also delays the timeframe for Medicare price negotiations for orphan drugs that are subsequently approved for non-orphan indications. These changes have the effect of delaying the negotiating process for some drugs, while exempting others from negotiations altogether, which is projected to diminish savings to Medicare from the negotiation program.

The changes are expected to have an immediate impact on which drugs are selected for Medicare price negotiation in 2026, including, for example, likely delaying the selection of the cancer drug Keytruda by a year. In 2023, Medicare and the 70,000 beneficiaries who used Keytruda spent a total of $5.6 billion on this drug alone, with annual out-of-pocket liability averaging around $15,000. By exempting or delaying price negotiation for Keytruda and other orphan drugs, the reconciliation law is likely to lead to higher out-of-pocket costs for beneficiaries who take these drugs relative to what they would have paid if a lower, Medicare-negotiated price was available.

This work was supported in part by the John A. Hartford Foundation. KFF maintains full editorial control over all of its policy analysis, polling, and journalism activities.

Which PEPFAR Investments Drive HIV Outcomes? Informing PEPFAR Transition and Scale-Down

Authors: Moaven Razavi, Collins Gaba, Jennifer Kates, and Allyala Nandakumar
Published: Sep 17, 2025

Overview

As PEPFAR faces increased pressure to transition and scale down, understanding which of its investments most effectively drive HIV outcomes can help inform future directions. This analysis examines PEPFAR spending and HIV viral suppression rates in 22 countries from 2018–2023, looking at spending in three areas: (1) core-services; (2) targeted/stand-alone programs; and (3) non-service delivery/institutional strengthening. Overall, it finds that targeted program spending, which accounts for the smallest share of PEPFAR spending, was associated with the biggest improvement in viral suppression, followed by spending on core-services. Further, targeted programs appear to be most important for “last-mile” gains (in countries closer to sustained epidemic control) while core-services appear to be most important in countries where HIV outcomes remain below optimal levels and are lower income. By contrast, spending on non-service delivery was negatively associated with viral suppression, suggesting diminishing returns at this point in PEPFAR’s trajectory. These findings provide new information about how future PEPFAR investments could best be tailored to support transition while maintaining HIV outcomes. Additional research on the relationship between specific activities within each spending category and HIV outcomes could further aid these efforts. Finally, it is important to note that despite the strength of the analytic model, it is possible that other factors may be contributing to the results.

Introduction

The Trump administration’s foreign aid review and related actions have resulted in significant changes to PEPFAR, the U.S. global HIV/AIDS program. These actions have included reductions in PEPFAR programming and steps to accelerate the scale-down of the program at a more rapid pace. Although PEPFAR had been working to develop transition plans, Congress and other stakeholders had been increasingly encouraging the program to develop more ambitious timelines for transitioning responsibility to countries. Still, how such planning is pursued, including which services are transitioned and when, can affect HIV outcomes and the sustainability of the HIV response. To help inform current discussions, this analysis examines the relationship between bilateral PEPFAR spending and HIV viral suppression rates in 22 PEPFAR countries between 2018 and 2023. The outcome measure – the share of people with HIV on treatment who are virally suppressed (to undetectable levels) – is used because viral suppression supports individual health and those who are virally suppressed cannot transmit HIV to their partner. The analysis looks at the association between viral suppression by country and year and PEPFAR spending in three areas (also see Table 1):

(1) core-services (e.g., commodities, supplies, health care work force);

(2) targeted/stand-alone programs (e.g., for key and vulnerable populations, including the DREAMS program and services for orphans and vulnerable children, and community-based testing); and

(3) non-service delivery/institutional strengthening (e.g., technical assistance, training, data collection)

It further stratifies countries into lower and higher achievement groups (based on a composite measure of the share of people with HIV who know their status, the share who know their status and are on treatment, and the share on treatment who are virally suppressed) and lower and higher income groups (based on GDP per capita) to better understand where different types of investments may be most needed. The first stratification reflects countries’ current performance and potential to improve HIV outcomes, while the second highlights their financial capacity to sustain HIV efforts independently.  Importantly, findings here represent PEPFAR’s 2018-2023 period and may not reflect the relationship between investments and HIV outcomes earlier on in the program. They also may not be directly applicable to the current period, given the pause in activities and terminations of many PEPFAR projects as part of the administration’s foreign aid review. Still, they can serve to provide an indication of where future investments could promote stronger outcomes.

Findings

  • The share of people with HIV on treatment who were virally suppressed increased in all but two countries over the period. Viral suppression went up, on average, by 8 percentage points and increased in 20 of the 22 countries between 2018 and 2023. Increases ranged between 2 and 23 percentage points, depending on the country. Decreases occurred in Ethiopia (-1 percentage point) and the Dominican Republic (-6). See Appendix Table.
  • Across the 22 countries analyzed, bilateral PEPFAR spending averaged $3.7 billion per year, during the 2018 to 2023 period.  Spending fluctuated somewhat and was highest in 2019 and lowest in 2020. It was $275 million lower in 2023 compared to 2018 and spending declined in 14 of the 22 countries. See Figure 1.
  • Spending on non-service delivery accounted for the largest category of PEPFAR spending, followed by core-services and then targeted programs. Spending on non-service delivery averaged $1.76 billion per year in the 22 countries and accounted for 47% of spending over the period. Core-services averaged $1.40 billion per year (38%). Targeted programs accounted for the smallest share of spending (15%), averaging $560.7 million per year. See Figure 2.
  • Declines in spending between 2018 and 2023 were driven entirely by non-service delivery. Non-service delivery spending declined by $714 million overall and fell in 19 of the 22 countries. By contrast, spending on core-services and targeted programs increased between the two periods (by $250.3 million and $188.8 million, respectively) and in most countries (17 and 19, respectively). See Appendix Table.    
  • The results of the model indicate that despite accounting for just 15% of PEPFAR spending, targeted programs were associated with the greatest improvement in viral suppression. Between 2018 and 2023, viral suppression increased by 0.11 percentage points, on average, for every $1 million spent on targeted programs. This translates into a one percentage point increase in viral suppression for every $9.3 million spent in a country.
  • This association was strongest in countries closer to epidemic control, suggesting their importance for “last mile” gains. Targeted spending was associated with twice the gain in viral suppression (a 0.21 percentage point increase) in the high achieving country group (those closer to sustained epidemic control), compared to .011 percentage points for all countries. There was no significant association in the lower achieving country group. Significant improvement was found in both lower (0.19) and higher (0.17) income country groups. These findings suggest that targeted investments may be most important for “last mile” gains (those needed to fully reach and sustain epidemic control), regardless of country income. See Table 2.
  • Core-services spending was also associated with improvement in viral suppression, although of a lesser magnitude. Overall, core-services spending was associated with a .05 percentage point increase in viral suppression, on average, for every $1 million spent. This translates into a 1 percentage point increase in viral suppression for every $20 million spent in a country.
  • In addition, spending on core-services was only associated with viral suppression improvement in lower achieving and lower income country groups. Viral suppression increased in both lower achieving (0.08) and lower income (0.09) country groups. There was no significant association in higher achieving and higher income countries. This suggests that core-services investments yield the biggest returns in countries still needing to make more progress towards sustained epidemic control and those more likely to be in need of external financial assistance.
  • By contrast, spending on non-service delivery, the largest category of spending, was associated with a reduction in viral suppression. Every $1 million spent on non-service delivery was associated with a .06 percentage point decrease in viral suppression. This was true regardless of country progress toward epidemic control or income. This finding suggests that spending in this area, which likely contributed to scale-up earlier on in PEPFAR’s evolution, may now have diminishing returns when it comes to HIV outcomes. While some spending on non-service delivery (such as for surveillance and other monitoring efforts) may aid in transitioning PEPFAR programming to country governments, this analysis suggests that reductions can be made without sacrificing program outcomes.

Implications

These findings support prior analyses that point to the importance of tailoring transition efforts to country-specific factors, including epidemiology and income. Approaches that are responsive to these factors are likely to be more effective than uniform strategies. More specifically, the findings suggest that targeted, stand-alone investments – those focused on specific populations – are associated with the strongest improvement in viral suppression, particularly for “last mile” gains, those needed to fully reach and sustain epidemic control. For example, spending an additional $9.3 million on targeted programs is predicted to increase the share of people with HIV on treatment who are virally suppressed by one percentage point; spending $100 million would increase viral suppression by 11 percentage points. On the other hand, a $100 million cut would decrease viral suppression by the same magnitude. Targeted programs, which represent a relatively small share of PEPFAR spending, are also those least likely to be assumed by country governments, highlighting the potential ongoing role for PEPFAR in this area. Core-services investments were associated with somewhat smaller improvements, and these were concentrated in lower-income countries and those further away from sustained epidemic control.  By contrast, non-core investments appear to have diminishing returns at this point in PEPFAR’s trajectory. This suggests opportunities to adjust spending in this area, while recognizing that some non-core activities, such as monitoring and support for transition processes, may still be useful in the near term.

There are some limitations to these findings. The results reflect average effects across countries and do not capture within-country variation. Additional country-level analyses could provide a more nuanced approach to transition, as could further disaggregation of activities within each spending category to provide a more complete picture of the specific types of investments most closely associated with improvements in HIV outcomes. It is also the case that PEPFAR investments in all three categories are not necessarily independent of one another. For example, the success of targeted program investments is also likely predicated on delivery of core services, particularly commodities for HIV treatment and prevention. In addition, despite the strength of the analytic model, which included controls for country income and health service coverage (a proxy for the strength of a health system strength), it is possible that other factors may be contributing to the results. It is also possible that these findings may not be directly applicable to the current PEPFAR environment given the pause in activities and terminations of many PEPFAR projects as part of the foreign aid review.  Despite these limitations, the findings contribute to the evidence base on how different types of PEPFAR spending align with progress toward epidemic control and may help inform decisions about future allocation, including potential re-allocations, and transition planning.

Methods

We obtained data on bilateral PEPFAR expenditures by country over the 2018-2023 time period from PEPFAR’s program expenditure database which includes data for 33 operating units (26 countries and 7 regions). We excluded four countries (Cameroon, India, South Sudan and Vietnam) due to poor data availability across HIV outcome indicators and excluded the 7 regions. Our final dataset included 22 countries (Angola, Botswana, Burundi, Côte d’Ivoire, DRC, Dominican Republic, Eswatini, Ethiopia, Haiti, Kenya, Lesotho, Malawi, Mozambique, Namibia, Nigeria, Rwanda, South Africa, Tanzania, Uganda, Ukraine, Zambia, and Zimbabwe) containing 132 country/year observations over the period.

Spending was divided into three, broad categories (see Table 1 for further details):
(1) core-services (e.g., commodities, supplies, health care work force);
(2) targeted/stand-alone programs (e.g., for key and vulnerable populations, including the DREAMS program and services for orphans and vulnerable children, and community-based testing); and
(3) non-service delivery/institutional strengthening (e.g., technical assistance, training, data collection)

Our main outcome of interest was the share of people living with HIV who were on HIV treatment and were virally suppressed. These data were obtained from UNAIDS. While this was the dependent variable we modeled, we used other HIV outcome data from UNAIDS to generate composite scores to allow us to create country strata based on progress toward sustained epidemic control for further analysis. The composite scores included the share of people living with HIV who were aware of their HIV status, the share on treatment, and the share virally suppressed. The score was generated by giving equal weight to each of the three outcomes and was based solely on data from the latest year, 2023. Countries below the median were assigned to the lower achievement stratum, while countries above the median were assigned to the higher achievement stratum.  We also divided countries into two strata based on income, using GDP per capita (current international $) for the most recent year, 2023. Countries below the median were categorized as lower-income and those above the median as higher-income. For observations with a few missing outcome values, the missing data were generated using linear interpolation.

We ran five models with PEPFAR financial data expressed in USD millions and the dependent variable expressed as a percentage. Model 1 included all 22 countries over the 2018-2023 period (for a total of 132 observations). Models 2 and 3 divided countries into two strata based on composite scores of the three HIV outcomes (resulting in 11 countries in each stratum, each with 66 observations). Models 4 and 5 divided countries into the two economic group strata based on GDP per capita. Our models included controls for GDP per capita, PPP (current international $) and the WHO Service Coverage Index, which measures coverage of essential health services and serves as a proxy for health system strength, for the median year (2021).

To analyze the panel data, we tested both fixed and random effects models. Fixed effects models control for all time-invariant differences between countries. Random effects models control for unobserved heterogeneity. The Hausman test was used to determine that the random effects model was the preferred specification for the data.

PEPFAR Spending Category Definitions
Estimated Percentage Point Change in Viral Suppression by PEPFAR Spending Category, 2018-2023 (standard errors in parentheses)
Estimate Additional Spending Needed to Raise Viral Suppression by 1 Percentage Point (in USD millions)
PEPFAR Spending by Category, 2018-2023 (in USD billions)
Share of PEPFAR Spending by Category, 2018-2023

Appendix

Appendix Table # 1
PEPFAR Spending by Category and Percent Virally Suppressed, 2018 and 2023
CountryTargetedCoreNon-CoreTotalTargetedCoreNon-CoreTotal% Virally Suppressed
 2018202320182023
Angola$3,841,633$478,898$8,471,700$12,792,231$438,279$0$3,765,634$4,203,91355.078.0
Botswana$9,188,688$12,759,114$24,870,282$46,818,084$17,646,565$5,389,744$22,789,597$45,825,90797.099.0
Burundi$1,801,767$1,874,579$11,335,090$15,011,436$3,600,810$6,158,745$10,631,531$20,391,08687.389.0
Cote d’Ivoire$17,303,080$22,024,735$71,241,076$110,568,891$26,935,252$28,148,513$28,998,007$84,081,77277.088.0
DRC$10,523,645$15,373,773$29,605,903$55,503,321$9,611,968$45,223,754$31,965,084$86,800,80573.389.0
Dominican Republic$3,656,850$786,187$5,196,748$9,639,785$4,501,686$4,829,020$9,829,188$19,159,89493.087.0
Eswatini$11,172,727$11,275,208$33,105,932$55,553,867$17,866,238$14,758,439$28,178,327$60,803,00493.099.0
Ethiopia$19,499,477$17,495,821$103,477,386$140,472,684$20,097,637$19,334,925$44,500,139$83,932,70190.089.0
Haiti$14,181,119$34,372,263$51,749,891$100,303,273$14,611,550$30,106,447$43,048,408$87,766,40577.085.0
Kenya$56,591,156$146,132,514$234,030,849$436,754,519$63,807,040$120,456,513$112,541,769$296,805,32190.097.0
Lesotho$10,462,376$20,843,626$31,703,237$63,009,239$14,050,868$21,140,546$26,020,807$61,212,22193.099.0
Malawi$14,321,280$23,050,062$84,731,219$122,102,561$31,084,406$52,502,078$68,613,196$152,199,68089.095.0
Mozambique$32,009,703$103,055,070$240,274,822$375,339,595$39,102,228$149,534,500$166,514,020$355,150,74876.190.0
Namibia$5,860,629$10,539,001$40,584,784$56,984,415$19,372,076$15,965,548$31,591,075$66,928,69982.499.0
Nigeria$47,420,855$136,018,210$171,857,733$355,296,799$67,789,733$158,063,694$122,508,397$348,361,82482.996.0
Rwanda$8,942,243$42,042,538$16,625,175$67,609,956$13,038,878$25,660,903$17,576,226$56,276,00792.099.0
South Africa$53,379,111$142,389,246$257,463,135$453,231,491$85,711,833$178,734,528$124,817,074$389,263,43688.091.0
Tanzania$64,427,213$88,685,437$266,269,079$419,381,729$60,038,096$155,506,898$200,291,101$415,836,09580.097.0
Uganda$42,291,465$144,480,428$211,712,274$398,484,167$49,130,305$147,510,953$152,084,226$348,725,48488.094.0
Ukraine$3,968,162$9,741,849$18,967,369$32,677,380$8,752,342$12,800,280$14,803,193$36,355,81593.098.0
Zambia$31,912,365$160,009,043$177,411,909$369,333,318$53,606,148$174,679,809$133,148,050$361,434,00789.297.0
Zimbabwe$21,706,311$43,324,946$73,841,291$138,872,548$52,470,392$70,552,100$56,255,761$179,278,25384.096.0
Notes: PEPFAR spending represents bilateral spending only. Viral suppression is percent of people with HIV on antiretroviral treatment who are virally suppressed.   
Sources: PEPFAR’s program expenditure database; UNAIDS 2024 HIV estimates.

Moaven Razavi, Collins Gaba, and Allyala Nandakumar are with Boston University. Jen Kates is with KFF. The authors would like to acknowledge assistance provided by William Crown and Deborah Stenoien from Boston University.

News Release

New KFF-Washington Post Survey Explores Parents’ Trust In, and Confusion About, Childhood Vaccines as the Trump Administration Revamps Federal Policies

Most Parents Remain Confident in Routine Childhood Vaccines and Support School Mandates, But Are Less Certain About Seasonal Flu and COVID Vaccines; 1 in 4 MAGA Republicans Say They Have Delayed or Skipped a Child’s Vaccine

Published: Sep 15, 2025

A new KFF-Washington Post partnership survey of parents explores their experiences with and views about vaccines for their children, including a look into how they make decisions related to vaccines and where they are uncertain or confused about their safety.

The poll comes as the Trump administration’s Health and Human Services Secretary Robert F. Kennedy Jr. continues to question the childhood vaccine schedule and to raise doubts about vaccine safety and effectiveness. Based on interviews with more than 2,700 parents, including more than 1,000 parents with children under age 6 who have had to make decisions about vaccines in the post-COVID era, the survey’s findings will be featured in a series of Washington Post stories and KFF reports analyzing the survey data.

The survey reveals large majorities of parents view long-standing childhood vaccines such as the ones to prevent measles, mumps, and rubella (MMR) and polio as safe and important, but are less confident in seasonal vaccines for flu and especially COVID-19.

While most parents say they keep their children up to date on recommended childhood vaccines, about one in six (16%) say that they have delayed or skipped at least one vaccine for their children (other than those for flu and COVID-19). Those most likely to report delaying or skipping vaccines include Republican parents (22%), especially those who identify with President Trump’s “Make America Great Again” movement (25%), parents under age 35 (19%), and those who homeschool their child (46%).

Among parents who delayed or skipped some vaccines for their children, the most common reasons include concerns about side effects, a lack of trust in vaccine safety, and a belief that not all recommend vaccines are necessary.

This is the 37th survey in the KFF-Post partnership dating back to 1995 that combines survey research with in-depth journalism. The Post today published its overview of the results, while KFF published a report breaking down the data. The Post plans to publish additional stories drawing on the survey results.

Key themes from the survey include:

Most favor school vaccine requirements. A large majority (81%) of parents say that public schools should require students to get the measles and polio vaccines, with exceptions for medical and religious reasons. Among all parents, 8% say that they had requested an exemption to vaccine requirements so a child could attend school or daycare.

Many are uncertain about false claims. When asked about several false claims about vaccines and measles, relatively few parents believe the untrue statements, but larger shares are uncertain what to believe. One example: While relatively few (9%) parents believe the false claim that the MMR vaccine can cause autism in children, nearly half (48%) say they don’t know enough to say.

Views of parents with children diagnosed with autism spectrum disorder. Parents of children with autism spectrum disorder are somewhat more likely than other parents to believe the false claim that vaccines cause autism (16% vs. 9%).

Confidence in federal health agencies is shaky. Fewer than one in six (14%) parents say they have “a lot” of confidence in government health agencies like the Centers for Disease Control and Prevention (CDC) and the Food and Drug Administration to ensure the safety and effectiveness of vaccines, while half say they have only a little confidence (29%) or none at all (22%). Confidence is even lower in the agencies’ abilities to make decisions based on science rather than the views of agency officials or to act independently without interference from outside interests. A quarter (26%) of parents overall say that the CDC recommends too many vaccines.

Many parents are unsure about impact of federal vaccine policy changes. Few parents (11%) say they’ve heard “a lot” about Secretary Kennedy’s changes to federal vaccine policy. When asked about the changes’ impact, most say either that they don’t know or that the changes won’t make of a difference on safety, access, and industry influence.

The survey also examines parents’ views of the safety testing for vaccines, the number of recommended vaccines, and experiences with the human papillomavirus (HPV) vaccine.

METHODOLOGY INFO:

The KFF/Washington Post Survey of Parents includes interviews with a nationally representative sample of 2,716 parents or legal guardians of children under age 18 in the U.S. The survey was conducted between July 18-August 4, 2025, online, in English and Spanish, using the Ipsos KnowledgePanel. The margin of sampling error including the design effect for total sample of parents is plus or minus 2 percentage points. For results based on other subgroups, the margin of sampling error may be higher.

A Look at Recent Changes to State Vaccine Requirements for School Children

Published: Sep 12, 2025

Routine vaccination rates for kindergarten children have declined since the COVID-19 pandemic began, while exemptions from school vaccination requirements, particularly non-medical exemptions, have increased. These trends coincide with shifting attitudes toward childhood vaccination likely fueled in part by vaccine misinformation. The past few years have seen more skepticism and confusion among the public about the safety and effectiveness of vaccines, a decline in trust of health authorities, and a growing partisan divide. Shifts in vaccine attitudes are reflected in recent state level policy changes, with state lawmakers introducing more than 2,500 vaccine-related bills since 2021, with almost half targeting vaccine requirements. In addition, Florida officials recently announced plans to eliminate all school vaccination requirements. Despite these changes, recent KFF polling found that public confidence in the safety of routine vaccines like MMR remains high and about eight in ten (81%) parents overall as well as large majorities of parents who identify as Democrats, independents, and Republicans support current state vaccine requirements, saying students should be required to be vaccinated against measles and polio to attend public schools with some exceptions. This policy watch examines recent state policy changes to school vaccine requirements and the extent to which they may impact vaccination trends.

States and local jurisdictions, not the federal government, set vaccine requirements for daycare and school entry. The federal government does, however, have a long-standing, evidence-based system for approving and recommending vaccines for the public, including the childhood vaccination schedule. The childhood vaccination schedule is set by the Centers for Disease Control and Prevention (CDC) based on recommendations from the Advisory Committee on Immunization Practices (ACIP). ACIP’s recommendations are used by many states to develop school vaccine requirements. HHS Secretary Robert F. Kennedy Jr. (RFK Jr.), who has long record of opposing immunizations and spreading vaccine misinformation, has led recent efforts to re-examine the federal childhood vaccine schedule, replace members of ACIP, and restrict COVID-19 vaccines and mRNA vaccine research. In addition, the Trump administration recently released a report that calls for a new vaccine framework that includes reevaluating the childhood vaccine schedule and addressing vaccine injuries.

All states currently require children to be vaccinated against certain diseases in order to attend public schools. School vaccination requirements are an important tool for reducing the spread of diseases and increasing vaccination coverage rates. Required vaccinations across every state and D.C. include MMR, DTaP, polio, and varicella; some states also require hepatitis A, hepatitis B, meningococcal, and/or HPV vaccines. At this time, no states require the COVID-19 vaccine for school entry. While it has yet to be enacted, Florida’s plan to eliminate all school vaccination requirements would make them the first and only state to do so. However, as the divide between red and blue states on health policy grows, more states may consider moving this direction.

All states allow exemptions from school vaccination requirements for medical reasons and almost all states (47 including D.C.) allow exemptions for religious and/or personal beliefs (Figure 1). This leaves four states (California, Connecticut, Maine, and New York) that only allow medical exemptions. Studies have shown that higher exemption rates from school vaccination requirements are associated with lower vaccination coverage rates and increased risk for disease outbreaks. In the 2024-2025 school year, the share of children claiming an exemption from vaccination requirements from one or more vaccinations rose to 3.6%, the highest national exemption rate to date, up from 2.5% in 2019-2020. Increases in non-medical exemptions accounted for the recent increases, with non-medical exemptions increasing from 2.2% to 3.4% over the period. Vaccination rates and exemption rates vary significantly by state, with the share of children claiming an exemption from one or more vaccinations during the 2024-2025 school year ranging from 0.1% in California to 15.4% in Idaho.

47 States Allow Exemptions From School Vaccination Requirements for Religious and/or Personal Beliefs

At least 10 states so far this year have enacted or issued changes related to routine vaccine requirements for children (Table 1). In the years following the pandemic, states saw an increase in vaccine-related policy proposals. The pandemic spurred increased state legislative activity initially focused on state-level authority to require COVID-19 vaccines. However, over time, as the response to COVID-19 became more politicized, states began limiting COVID-19 vaccine mandates as well as focusing more broadly on routine vaccination requirements (and exemptions to those requirements) in schools. Notably, most of the vaccine-related bills introduced by legislators since the pandemic began have not passed, but ten states in the past year have enacted or issued policy changes related to school or child care vaccination requirements.

Almost all states (nine out of 10 states with recent changes) made changes that could result in more students claiming a non-medical exemption, which could reduce vaccination rates. Many of the recent changes (described in Table 1) will make it easier for families with children in childcare settings or school to obtain a non-medical vaccine exemption. Notably, the governor of West Virginia signed an executive order allowing religious and personal belief exemptions in January 2025, though litigation is ongoing. Prior to 2025, West Virginia was one of five states (now four states) that only allowed medical exemptions and had the highest vaccination rates and lowest exemption rates in the country during the 2023-2024 school year (the latest available data for the state). In addition, Idaho, the state with the lowest vaccination rates and highest exemption rates during the 2024-2025 school year, transferred control of required vaccines to the legislature and restricted medical mandates (likely weakening school vaccine requirement enforcement). These changes, in addition to broader state efforts to scale back immunization outreach and promotion, changes to vaccine recommendations at the federal level, and reduced support from the federal government for state and local health departments, could further increase the number of exemptions requested and drive down vaccination rates among children. Florida’s plan to eliminate all school vaccination requirements goes beyond expanding exemptions and would mark a major shift in state vaccination requirements, though the issue will have to be taken up by the state legislature.

At the same time, one state has made a change that could maintain or increase children’s routine vaccination rates. Colorado recently passed a law allowing the consideration of vaccine recommendations from outside groups like the American Academy of Pediatrics (AAP), not only ACIP, when developing school vaccine requirements. More states may move in this direction depending on the outcome of ACIP’s upcoming meeting on vaccine recommendations and potential further changes by RFK Jr. to the ACIP panel. In addition, the AAP also recently reaffirmed their support for eliminating non-medical exemptions amid rising exemption rates, and some states, such as Massachusetts and Hawaii, are proposing eliminating non-medical exemptions, though these changes have not been enacted. While the appointment of RFK Jr. in early 2025 likely spurred additional efforts to loosen vaccine requirements in many states this year, other states are working to ensure vaccine access amid changes at the federal level.

At Least 10 States So Far This Year Have Enacted or Issued Changes Related to Routine Vaccine Requirements for Children

The Landscape of School-Based Mental Health Services

Published: Sep 11, 2025

Editorial Note

This analysis, originally published on September 6, 2022, was updated on September 11, 2025 to incorporate the latest developments and data.

Nearly one in five students attending public schools in the United States utilize school-based mental health services, underscoring how schools can serve as an access point for mental health treatment among youth. Federal policy measures, including the Bipartisan Safer Communities Act, the American Rescue Plan Act, and changes to Medicaid guidance, provided pathways to expanding and improving access to school-based services. However, recent actions – such as cuts to the Department of Education, the freezing of $1 billion allocated for school-based mental health services, and major reductions to Medicaid – may cause disruptions. Some school programs have already reported concerns with providing mental health services in the wake of these recent actions, including programs in New York, North Carolina, and Texas. These disruptions come at a time when approximately 1 in 5 teens are experiencing symptoms of anxiety or depression and many youth have reported bullying and exposure to violence, which can have adverse effects on their mental health. Additionally, a 2024 KFF survey found differences in receipt of mental health care services by race and ethnicity, with a larger share of White parents compared to Black, Hispanic, and Asian parents reporting that their children received these services in the past three years.  

This issue brief explores the landscape of mental health services, including services offered, utilization, barriers, and funding, and how recent federal actions may affect school-based mental health care. This analysis draws upon survey data collected directly from public school administrators via the School Pulse Panel,1 a study by the National Center for Education Statistics and the U.S. Census Bureau that surveys schools monthly on a variety of topics, including school mental health services. Key Findings include:

  • In the 2024-2025 school year, 18% of students utilized school-based mental health services.
  • About one-third of schools reported they strongly (11%) or moderately disagreed (25%) that they could effectively provide mental health services. Barriers to providing mental health care services to students include funding and mental health provider shortages.
  • Ninety-seven percent of schools provide at least one mental health service to students. In recent years, larger shares of these schools provide services via telehealth, and provide group-based and family interventions.
  • Seventy percent of public schools that provide mental health services had a school or district-employed licensed mental health professional on staff and 57% employed an external mental health provider.
  • Thirteen percent of schools did not have mental health services available for staff in the 2024-2025 school year.

Background

School-based mental health services can improve access to care, allow for early identification and treatment of mental health issues, and may be linked to reduced absenteeism and better mental health and substance use outcomes. School-based services can also reduce access barriers for underserved populations, including children from low-income households and children of color.

The delivery of mental health services in schools has evolved over time and continues to vary across schools. Some students access in-person mental health services at schools or near campus while others access services through telehealth. Service delivery can range from a single provider (who is not necessarily a licensed mental health professional) to a team of providers, including psychologists, social workers, and academic or guidance counselors. A growing number of schools have also integrated social and emotional learning and other mental health literacy programs into their curriculum.

Schools receive support for providing mental health services in several ways. This includes support at the federal level through the Department of Education and the Department of Health and Human Services. A recent federal measure, the Bipartisan Safer Communities Act (BSCA) of 2022, included provisions to support and expand school-based mental health services, such as $1 billion to increase the number of mental health providers in schools and provide training. However, in April 2025, under the Trump Administration, the Department of Education announced the cancellation of these funds. Additionally, President Trump signed an executive order in March 2025 to dismantle the Department of Education, an entity which has developed guidance regarding school-based health services in partnership with Medicaid and provides resources and grants to support mental health, anti-bullying, and trauma-prevention interventions in schools.

Schools can also receive support through Medicaid, including reimbursement for medically necessary services that are part of a student’s Individualized Education Plan (IEP), reimbursement for eligible health services for students with Medicaid coverage and for some administrative services. In 2022 and 2023, CMS issued guidance to increase the accessibility of these services by eliminating some of the practical barriers that schools faced when delivering services through Medicaid. However, significant changes to Medicaid, including budget cuts, in the reconciliation bill passed in July 2025 may impact how Medicaid can support school services in the future. In 2023, nearly four in ten children in the U.S. had Medicaid coverage.

What Share of Students Utilize School-Based Mental Health Services?

In the 2024-2025 school year, public schools reported that on average 18% of students utilized school-based mental health services. Additionally, 58% of schools reported that the number of students who sought school-based mental health services increased since the prior school year. Similarly, there was a 61% increase from the 2023-2024 school year to the 2024-2025 school year in concerns expressed by staff about students exhibiting depression, anxiety, trauma, or emotional dysregulation/disturbance.

What Have Schools Said About Their Ability To Provide Mental Health Services To Students?

In the 2024-2025 school year, approximately half of public schools reported they could effectively provide mental health services to all students in need. This includes 10% of schools that say they strongly agree they could effectively provide mental health service and 42% that moderately agreed. Meanwhile, about one-third of schools reported they strongly (11%) or moderately disagreed (25%) that they could effectively provide mental health services and 11% neither agreed or disagreed. These shares have remained mostly similar since survey data collection began in the 2021-2022 school year.

Among the schools that did not strongly believe they could effectively provide mental health services to students in need, inadequate funding and mental health provider shortages have remained the most frequently reported limitations since the 2021-2022 school year (Figure 1).

Interactive DataWrapper Embed

However, the share reporting inadequate funding has increased over time (from 47% in 2021-2022 to 56% in 2024-2025), while the share reporting insufficient mental health staff coverage and access to licensed professionals has slightly decreased over the same period (from 61% to 55% and from 57% to 51%, respectively). These changes may reflect recent federal efforts to increase the number of school mental health professionals but also the end of federal pandemic-era funds. Further, many schools continue to not meet recommended ratios for psychologists to students (500:1) or counselors to students (250:1). Among schools with staffing vacancies in the 2024-2025 school year, 28% of public school administrators feel they are understaffed with mental health providers.

What Mental Health Services Are Offered to Students?

In the 2024-2025 school year, 97% of public schools reported offering at least one type of mental health service to their students. As shown in Figure 2, the most frequently offered services are:

  • Individual-based intervention like one-on-one counseling or therapy (83% of public schools)
  • Case management or coordinating mental health services (70%), and
  • Referrals for care outside of the school (67%).

The use of telehealth to deliver mental health treatment has increased from 17% to 22% between the 2021-2022 and 2024-2025 school years. While telehealth became a more widely used pathway to delivering health care since the pandemic, a growing number of schools were already providing care through telehealth prior to the pandemic.

Group-based interventions increased between the 2021-2022 and 2024-2025 school year (from 56% to 65%), as well as family interventions (from 38% to 43%).

Interactive DataWrapper Embed

Only about one-third of schools provide outreach services, which includes mental health screenings for all students. These universal behavioral health screenings are considered a best practice and allow for schools to better identify all students with needs and tailor services to their specific student population. However, many schools do not offer these screenings often due to a lack of resources or difficulty accessing providers to conduct screenings, burden of collecting and maintaining data, and/or a lack of buy-in from school administrators.

Who Provides Mental Health Services in Schools?

Staffing models for school-based mental health care can vary across schools. In the 2024-2025 academic year, 76% of public schools that provide mental health services had two or more types of mental health providers while 24% have one type of provider. In the same year, 70% of these public schools had a school or district-employed licensed mental health professional on staff and 57% had an external mental health provider (Figure 3).

Interactive DataWrapper Embed

Between the 2021-2022 and 2024-2025 school years, there was a decrease in the share of public schools reporting that school counselors (from 83% to 73%) or school nurses (from 25% to 16%) provided mental health services to students (Figure 3). These decreases may be reflective of schools expanding their mental health teams in recent years so that they are less reliant on general counselors and medical staff. While general or academic school counselors can provide mental health services to students, they are not equipped to offer long-term care.

Teachers often play a role in identifying students with mental health needs and linking them to care, although prior research suggests  that many teachers may not be adequately trained to do so. In the 2024-2025 school year, 61% of schools reported providing trainings and professional development to staff in order to help them support the emotional and mental health of school students. Data on the impact of these trainings is unavailable and it is unclear what share of schools provided trainings in the years prior.

How Do Schools Receive Funding For The Mental Health Services They Provide?

School mental health services are supported through multiple sources of funding at the national, state, and local level. In recent years, a growing share of public schools reported receiving funding for mental health services from district or school funds (from 58% in 2021-2022 to 65% in 2024-2025) or partnerships with organizations (from 38% in 2021-2022 to 44% in 2024-2025) (Figure 4). Note that the School Pulse Panel survey questionnaire does not specify which funds are from Medicaid.

Interactive DataWrapper Embed

The share of public schools receiving funding from federal grants or programs has decreased from 53% in 2021-2022 to 33% in 2024-2025. This change may be due to the cessation of pandemic-era relief funds, like the Elementary and Secondary School Emergency Relief (ESSER) funds, which provided schools with the financial resources to address increasing concerns about student mental health. In 2022, the Bipartisan Safer Communities Act allowed for new funding sources to support school-based mental health services, however the Trump Administration froze $1 billion in funding in 2025. 

What Mental Health Services Are Available For Staff?

Teachers and other school staff play a multitude of roles, including monitoring students’ mental health and providing support as needed. Burnout, driven by anxiety, depression, and low job satisfaction is prevalent among teachers. In the 2024-2025 academic year, 36% of staff reported that they have seen an increase in staff expressing concerns about themselves or their colleagues showing signs of depression, anxiety, emotional dysregulation or trauma since the prior school year. While many schools offer mental health services for staff, 13% of schools do not (Figure 5).

Interactive DataWrapper Embed

Sasha Zitter, formerly with KFF, contributed to this analysis.

  1. The School Pulse Panel utilizes a random stratified sample of the Common Core of Data, a universe of public schools. This stratified sample includes public and public charter schools, schools with magnet programs, alternative schools, special education schools, and vocational schools. Approximately 4,000 schools were included in the sample for the 2024-2025 school year. Approximately 1,600 schools responded to the March survey – findings from this survey are included in this brief. There has been some variation in the number of schools that respond each month. While school principals are the initial point of contact to complete the survey, they may invite other school and district staff to assist with completion. Published data is weighted and adjusted to account for non-response. ↩︎

KFF Global Health Budget Summaries

Published: Sep 11, 2025

These global health budget summaries highlight key information about global health funding levels throughout the federal budget and appropriations process.

FY 2026

Senate:

August 4, 2025

House:

September 11, 2025

July 23, 2025

Request:

Administration Releases Additional Details of Fiscal Year 2026 Budget Request

June 4, 2025

White House Releases FY26 Budget Request

May 2, 2025

FY 2025

Final:

Congress passes Full-Year Continuing Resolution Bill, maintaining global health funding at prior year levels

March 18, 2025

Senate:

August 5, 2024

August 5, 2024

House:

July 9, 2024

House Appropriations Committee Approves the FY 2025 State and Foreign Operations (SFOPs) Appropriations Bill

June 12, 2024

Request:

Global Health Funding in the FY 2025 President’s Budget Request

March 12, 2024

FY 2024

Omnibus:

Global Health Funding in the FY 2024 Final Appropriations Bill

March 22, 2024

Senate:

July 28, 2023

July 21, 2023

House:

November 3, 2023

House Approves the FY 2024 State and Foreign Operations (SFOPs) Appropriations Bill

September 28, 2023

Request:

Global Health Funding in the FY 2024 President’s Budget Request

March 10, 2023

FY 2023

Omnibus:

Global Health Funding in the FY 2023 Omnibus

December 20, 2022

Senate:

Senate Appropriations Committee Releases FY23 State and Foreign Operations (SFOPs) and Labor, Health and Human Services (Labor HHS) Appropriations Bills

July 29, 2022

House:

June 29, 2022

House Appropriations Committee Releases the FY23 State and Foreign Operations (SFOPs) Appropriations Bill

June 28, 2022

Request:

White House Releases FY 2023 Budget Request

March 29, 2022

FY 2022

Omnibus:

Global Health Funding in the FY 2022 Omnibus

March 9, 2022

Senate:

Senate Appropriations Committee Releases FY 2022 State and Foreign Operations (SFOPs) and Labor Health and Human Services (Labor HHS) Appropriations Bills

October 20, 2021

House:

July 14, 2021

House Appropriations Committee Releases the FY22 State and Foreign Operations (SFOPs) Appropriations Bill

June 30, 2021

Request:

White House Releases Full FY 2022 Budget Request

June 2, 2021

FY 2021

Omnibus:

Global Health Funding in the FY 2021 Omnibus

January 8, 2021

Senate:

Senate Appropriations Committee Releases FY 2021 State and Foreign Operations (SFOPs) and Labor Health and Human Services (Labor HHS) Appropriations Bills

November 11, 2020

House:

House Appropriations Committee Approves FY 2021 Health and Human Services (HHS) Appropriations Bill

July 14, 2020

House Appropriations Committee Approves FY21 State and Foreign Operations (SFOPs) Appropriations Bill

July 9, 2020

Request:

White House Releases FY21 Budget Request

February 11, 2020

FY 2020

Omnibus:

Global Health Funding in the FY 2020 Conference Agreement

December 19, 2019

Senate:

Senate Appropriations Committee Approves FY 2020 State and Foreign Operations (SFOPs) Appropriations Bill

September 27, 2019

Senate Appropriations Committee Releases Draft FY 2020 Health and Human Services (HHS) Appropriations Bill

September 20, 2019

House:

House Passes Minibus That Includes Global Health Funding In FY 2020 State & Foreign Operations (SFOPs) and Health & Human Services (HHS)

June 20, 2019

House Appropriations Committee Approves FY 2020 State & Foreign Operations (SFOPs) Appropriations Bill

May 17, 2019

House Appropriations Committee Approves FY 2020 Health and Human Services (HHS) Appropriations Bill

May 13, 2019

Request:

White House Releases FY20 Budget Request

March 11, 2019

FY 2019

Omnibus:

FY19 Conference Agreement Released, Includes State & Foreign Operations (SFOPs) Funding

February 14, 2019

Senate:

Senate Appropriations Committee approves FY19 State & Foreign Operations (SFOPs) Appropriations Bill

June 22, 2018

House:

House Appropriations Committee approves FY19 State and Foreign Operations (SFOPs) Appropriations Bill

June 20, 2018

Request:

White House Releases FY 2019 Budget Request

February 13, 2018

FY 2018

Omnibus:

President Signs FY18 Omnibus Bill

March 22, 2018

Senate:

Senate Appropriations Committee approves FY 2018 State & Foreign Operations (SFOPs) and Health & Human Services (HHS) Appropriations Bills

September 11, 2017

House:

House Appropriations Subcommittees approve FY 2018 State & Foreign Operations (SFOPs) and Health & Human Services (HHS) Appropriations Bills

July 19, 2017

Request:

White House Releases FY18 Budget Request

May 24, 2017

U.S. Global Health Funding in Draft FY18 Budget Request

April 26, 2017

White House Releases FY18 Budget Blueprint

March 16, 2017

FY 2017

Omnibus:

Congress Releases FY17 Omnibus

May 1, 2017

House:

House Appropriations Committee approves FY 2017 State and Foreign Operations Appropriations Bill

July 13, 2016

Senate:

Senate Appropriations Committee approves FY 2017 State and Foreign Operations Appropriations Bill

June 30, 2016

Request:

White House Submits FY17 Reduction Options to Congress

March 29, 2017

White House Releases FY17 Budget Request

February 9, 2016

FY 2016

Omnibus:

Congress Releases FY16 Omnibus

December 16, 2015

Senate:

Senate Appropriations Subcommittee Approves FY 2016 State and Foreign Operations Appropriations Bill

July 8, 2015

House:

Updated: House Appropriations Committee releases FY16 Health & Human Services Appropriations Bill

June 24, 2015

House Appropriations Committee releases FY 2016 State and Foreign Operations Appropriations Bill

June 11, 2015

Request:

The U.S. Global Health Budget: Analysis of the Fiscal Year 2016 Budget Request

March 11, 2015

White House Releases FY16 Budget Request

February 2, 2015

FY 2015

Omnibus:

Congress Releases FY15 Omnibus

December 10, 2014

House:

FY15 Health & Human Services Appropriations Bill Introduced in House

September 15, 2014

House Appropriations Committee approves FY2015 State and Foreign Operations Appropriations Bill

June 24, 2014

Senate:

Senate Appropriations Committee releases FY15 Health & Human Services Appropriations Bill

July 24, 2014

Senate Appropriations Committee approves FY 2015 State and Foreign Operations Appropriations Bill

June 19, 2014

Request:

White House releases FY15 Budget Request

April 22, 2014

The U.S. Global Health Budget: Analysis of the Fiscal Year 2015 Budget Request

April 7, 2014

FY 2014

Omnibus:

FY14 Omnibus Appropriations Act Released

January 13, 2014

Senate:

Senate Appropriations Committee approves FY 2014 State and Foreign Operations Appropriations Bill

July 25, 2013

Senate Appropriations Committee approves FY14 Health & Human Services Appropriations Bill

July 11, 2013

House:

House Appropriations Committee approves FY 2014 State and Foreign Operations Appropriations Bill

July 24, 2013

Request:

U.S. Funding for Global Health: The President’s FY 2014 Budget Request

May 23, 2013

White House releases FY 2014 Budget Request

April 10, 2013

House Committee on Appropriations Approves FY 2026 Labor, Health and Human Services, Education, and Related Agencies (Labor HHS) Appropriations Bill & Accompanying Report

Published: Sep 11, 2025

The House Committee on Appropriations approved its FY 2026 Labor, Health and Human Services, Education, and Related Agencies (Labor HHS) appropriations bill, accompanying report, and amendments on September 9, 2025. While most U.S. global health funding is provided to the State Department through a separate appropriations bill, the Labor HHS appropriations bill includes funding for global health programs at the Centers for Disease Control and Prevention (CDC) as well as funding for global health research activities at the National Institutes of Health (NIH).

Global health funding amounts specified in the House FY 2026 Labor HHS appropriations bill are as follows (some amounts are not yet known):

  • Centers for Disease Control and Prevention (CDC): The bill eliminates funding for several programs at the CDC’s Center for Global Health including: 1) Global HIV/AIDS; 2) Global Tuberculosis; and 3) some global vaccination activities. [i] The bill maintains CDC’s funding at the prior year (FY 2025) level for global polio vaccination and Global Public Health Protection programs, and transfers funding for Parasitic Diseases and Malaria from the Center for Global Health to the National Center for Emerging and Zoonotic Infectious Diseases, but does not specify an amount.
  • National Institutes of Health (NIH): Funding for global health research activities at the Fogarty International Center (FIC) at NIH matches the prior year (FY 2025) amount. Funding for other global health research activities (i.e., global HIV/AIDS and malaria research) at NIH is not yet known because it is determined at the agency level rather than specified by Congress in annual appropriations bills.[ii]

See the table below for additional details on global health funding (downloadable table here). See other budget summaries and the KFF budget tracker for details on historical annual appropriations for global health programs.

KFF Analysis of Global Health Funding in the FY 2026 House Labor, Health and Human Services, Education, and Related Agencies (Labor HHS) Appropriations Bill

[i] Funding for FY25 was provided in a full-year Continuing Resolution (CR), which maintained FY24 levels. All FY25 amounts and associated notes are based on those specified in relevant FY24 appropriations bills.

[ii] The House FY26 Labor HHS appropriations bill states that “Of the amounts made available in this Act for NIH, the amount for research related to the human immunodeficiency virus, as jointly determined by the Director of NIH and the Director of the Office of AIDS Research, shall be made available to the ‘Office of AIDS Research’ account.”