Who are the Direct Care Workers Providing Long-Term Services and Supports (LTSS)?

Published: Oct 30, 2024

More than 6 million people use paid long-term services and supports (LTSS) delivered in home and community-based settings and more than 2 million people use LTSS delivered in institutional settings, according to CBO estimates. LTSS encompass the broad range of paid and unpaid medical and personal care services that assist with activities of daily living (such as eating, bathing, and dressing) and instrumental activities of daily living (such as preparing meals, managing medication, and housekeeping). The 8 million people using LTSS only includes people requiring ongoing or maintenance therapy. Many others use similar services on a shorter-term or intermittent basis, such as care provided through the Medicare home health and skilled nursing facility benefits. Direct care workers play a pivotal role in providing these services. They perform demanding, high-stress work for low wages and often no benefits.

This analysis uses the 2022 American Community Survey to provide an overview of demographic characteristics, wages, and health insurance coverage of direct care workers, which include home health aides, personal care aides, nursing assistants, licensed practical nurses (LPNs), and registered nurses (RNs). It focuses in particular on direct care workers in nursing facilities, residential care facilities, and home health as well as those that provide services or work in settings that provide nonresidential services for older adults and younger adults with disabilities (see Methods). In doing so, we examine the direct care workforce broadly and differences across job classifications and settings of work. Key takeaways include:

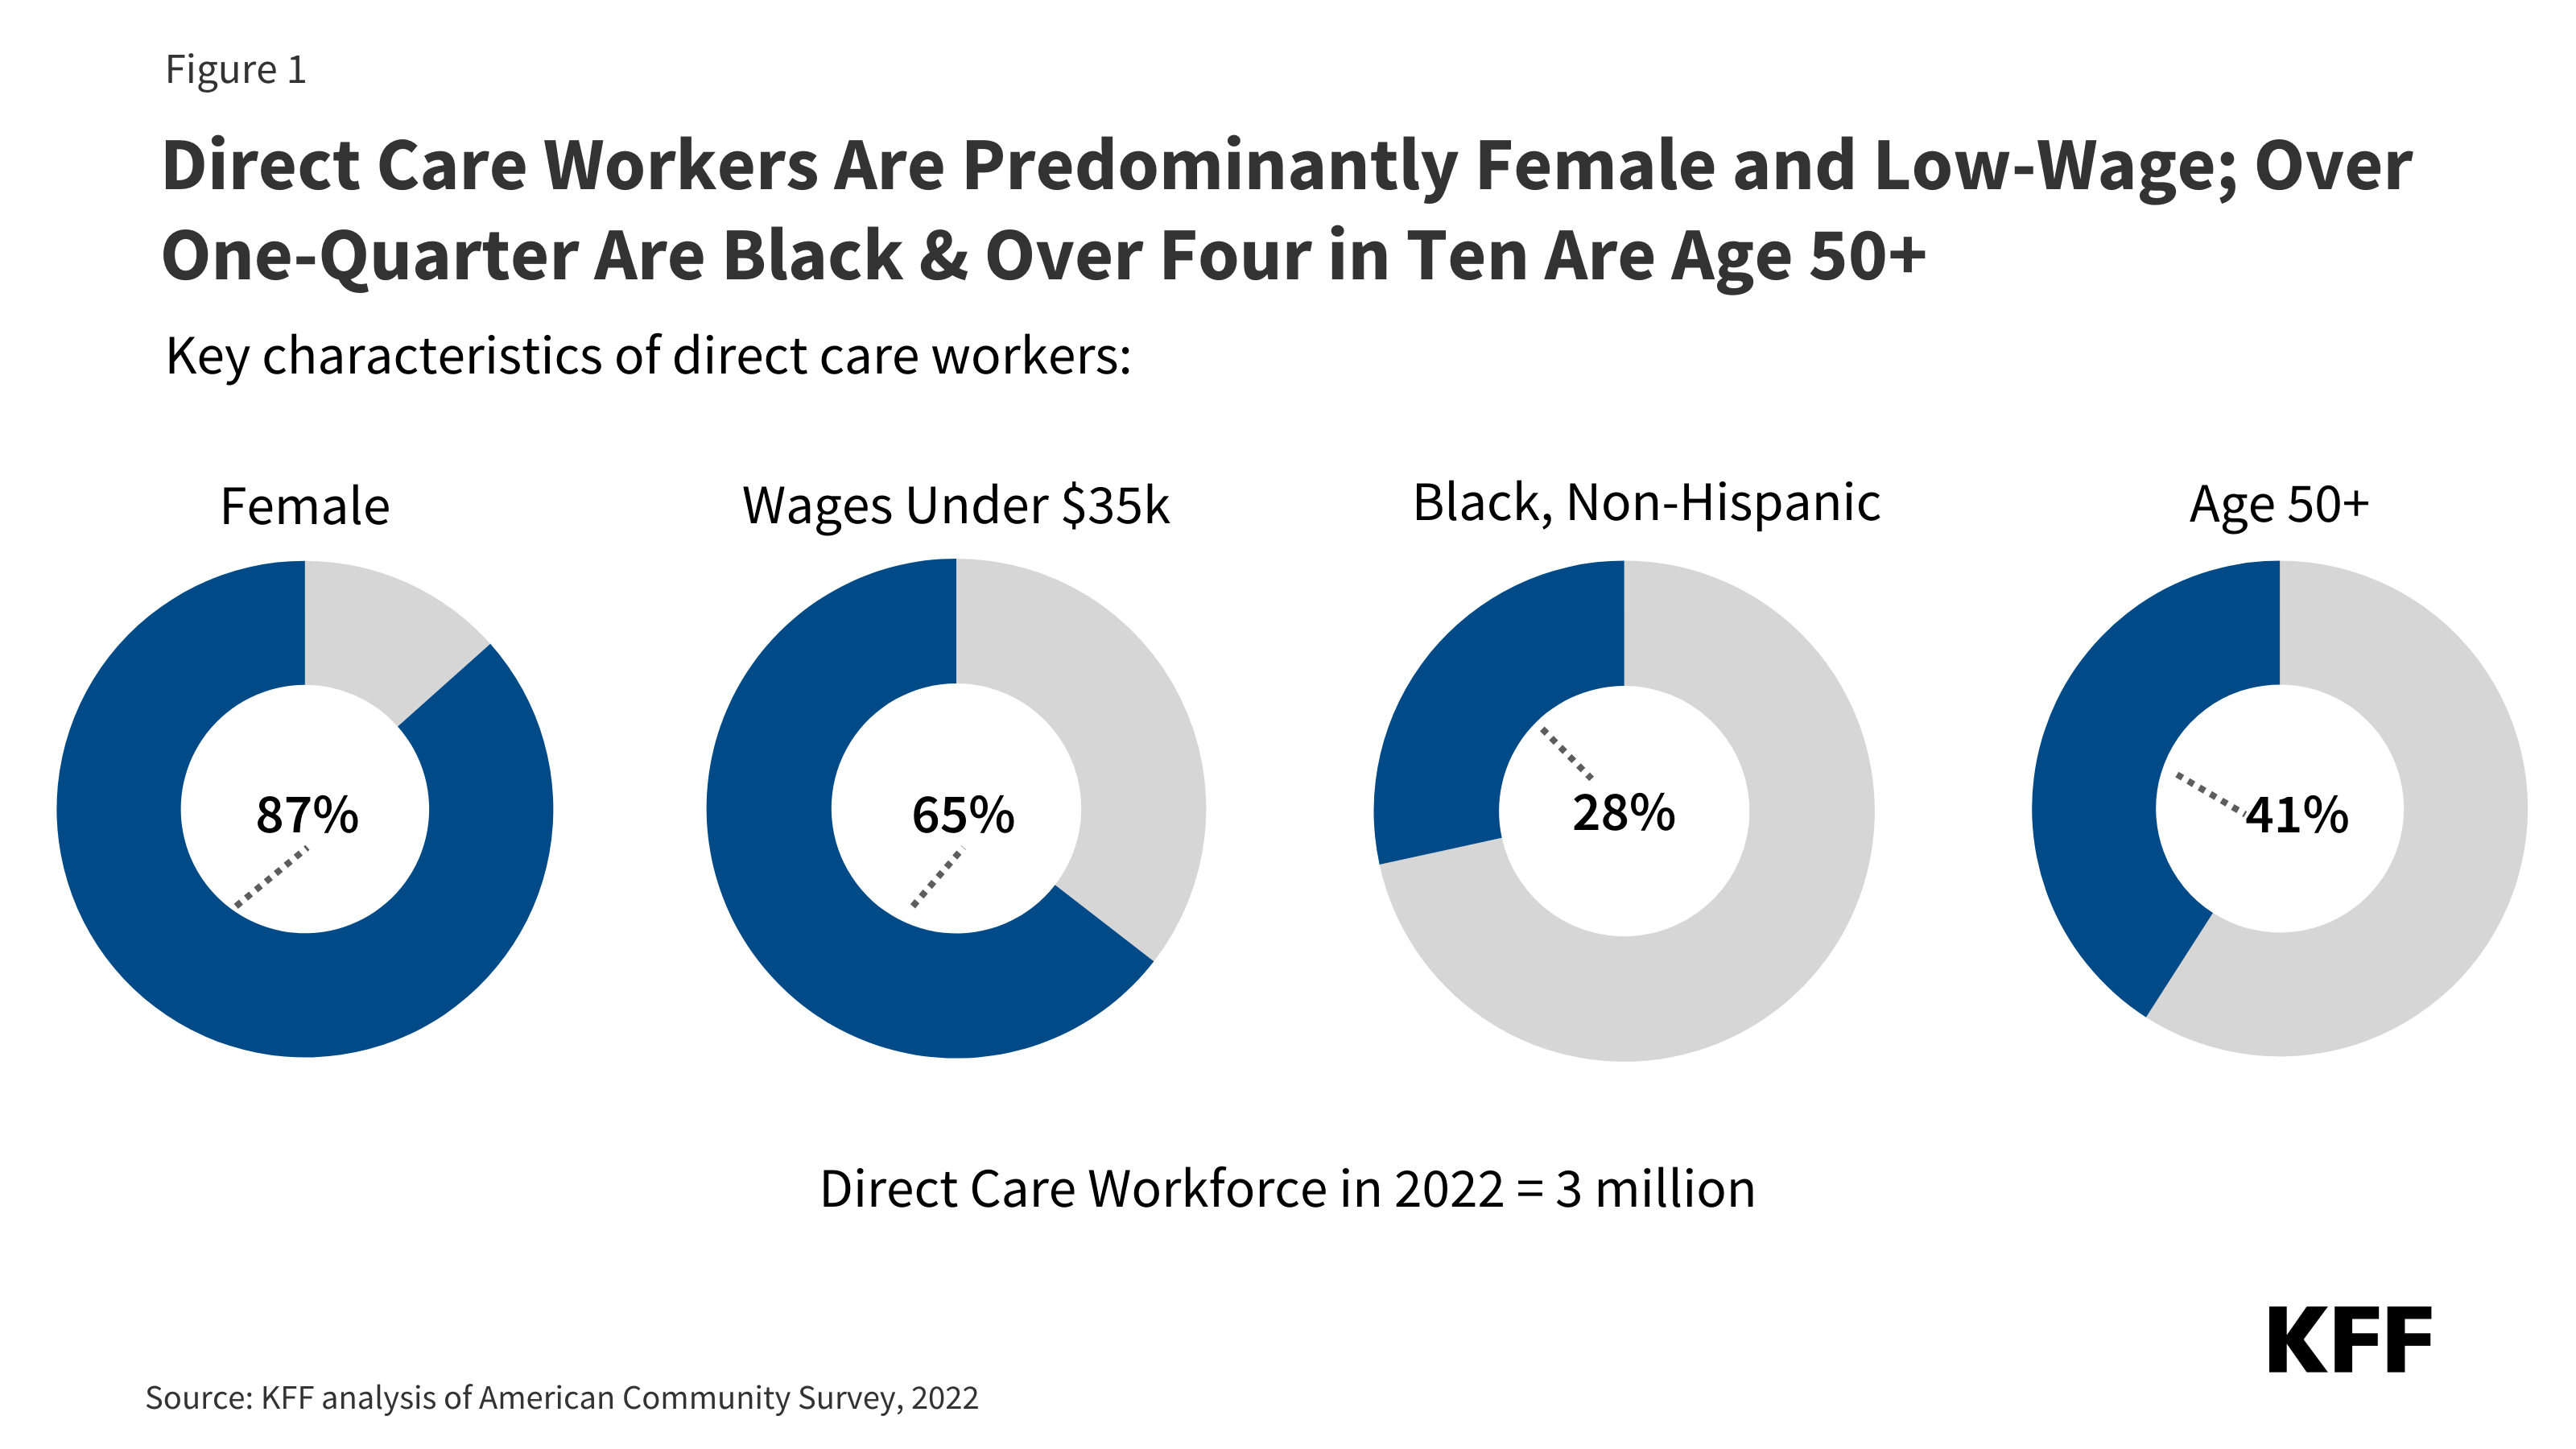
  • There are nearly 3 million direct care workers who are predominantly female (87%) and low-wage (65%); over one-quarter are Black (28%) and over four in ten are 50 years old or more (41%) (Figure 1).
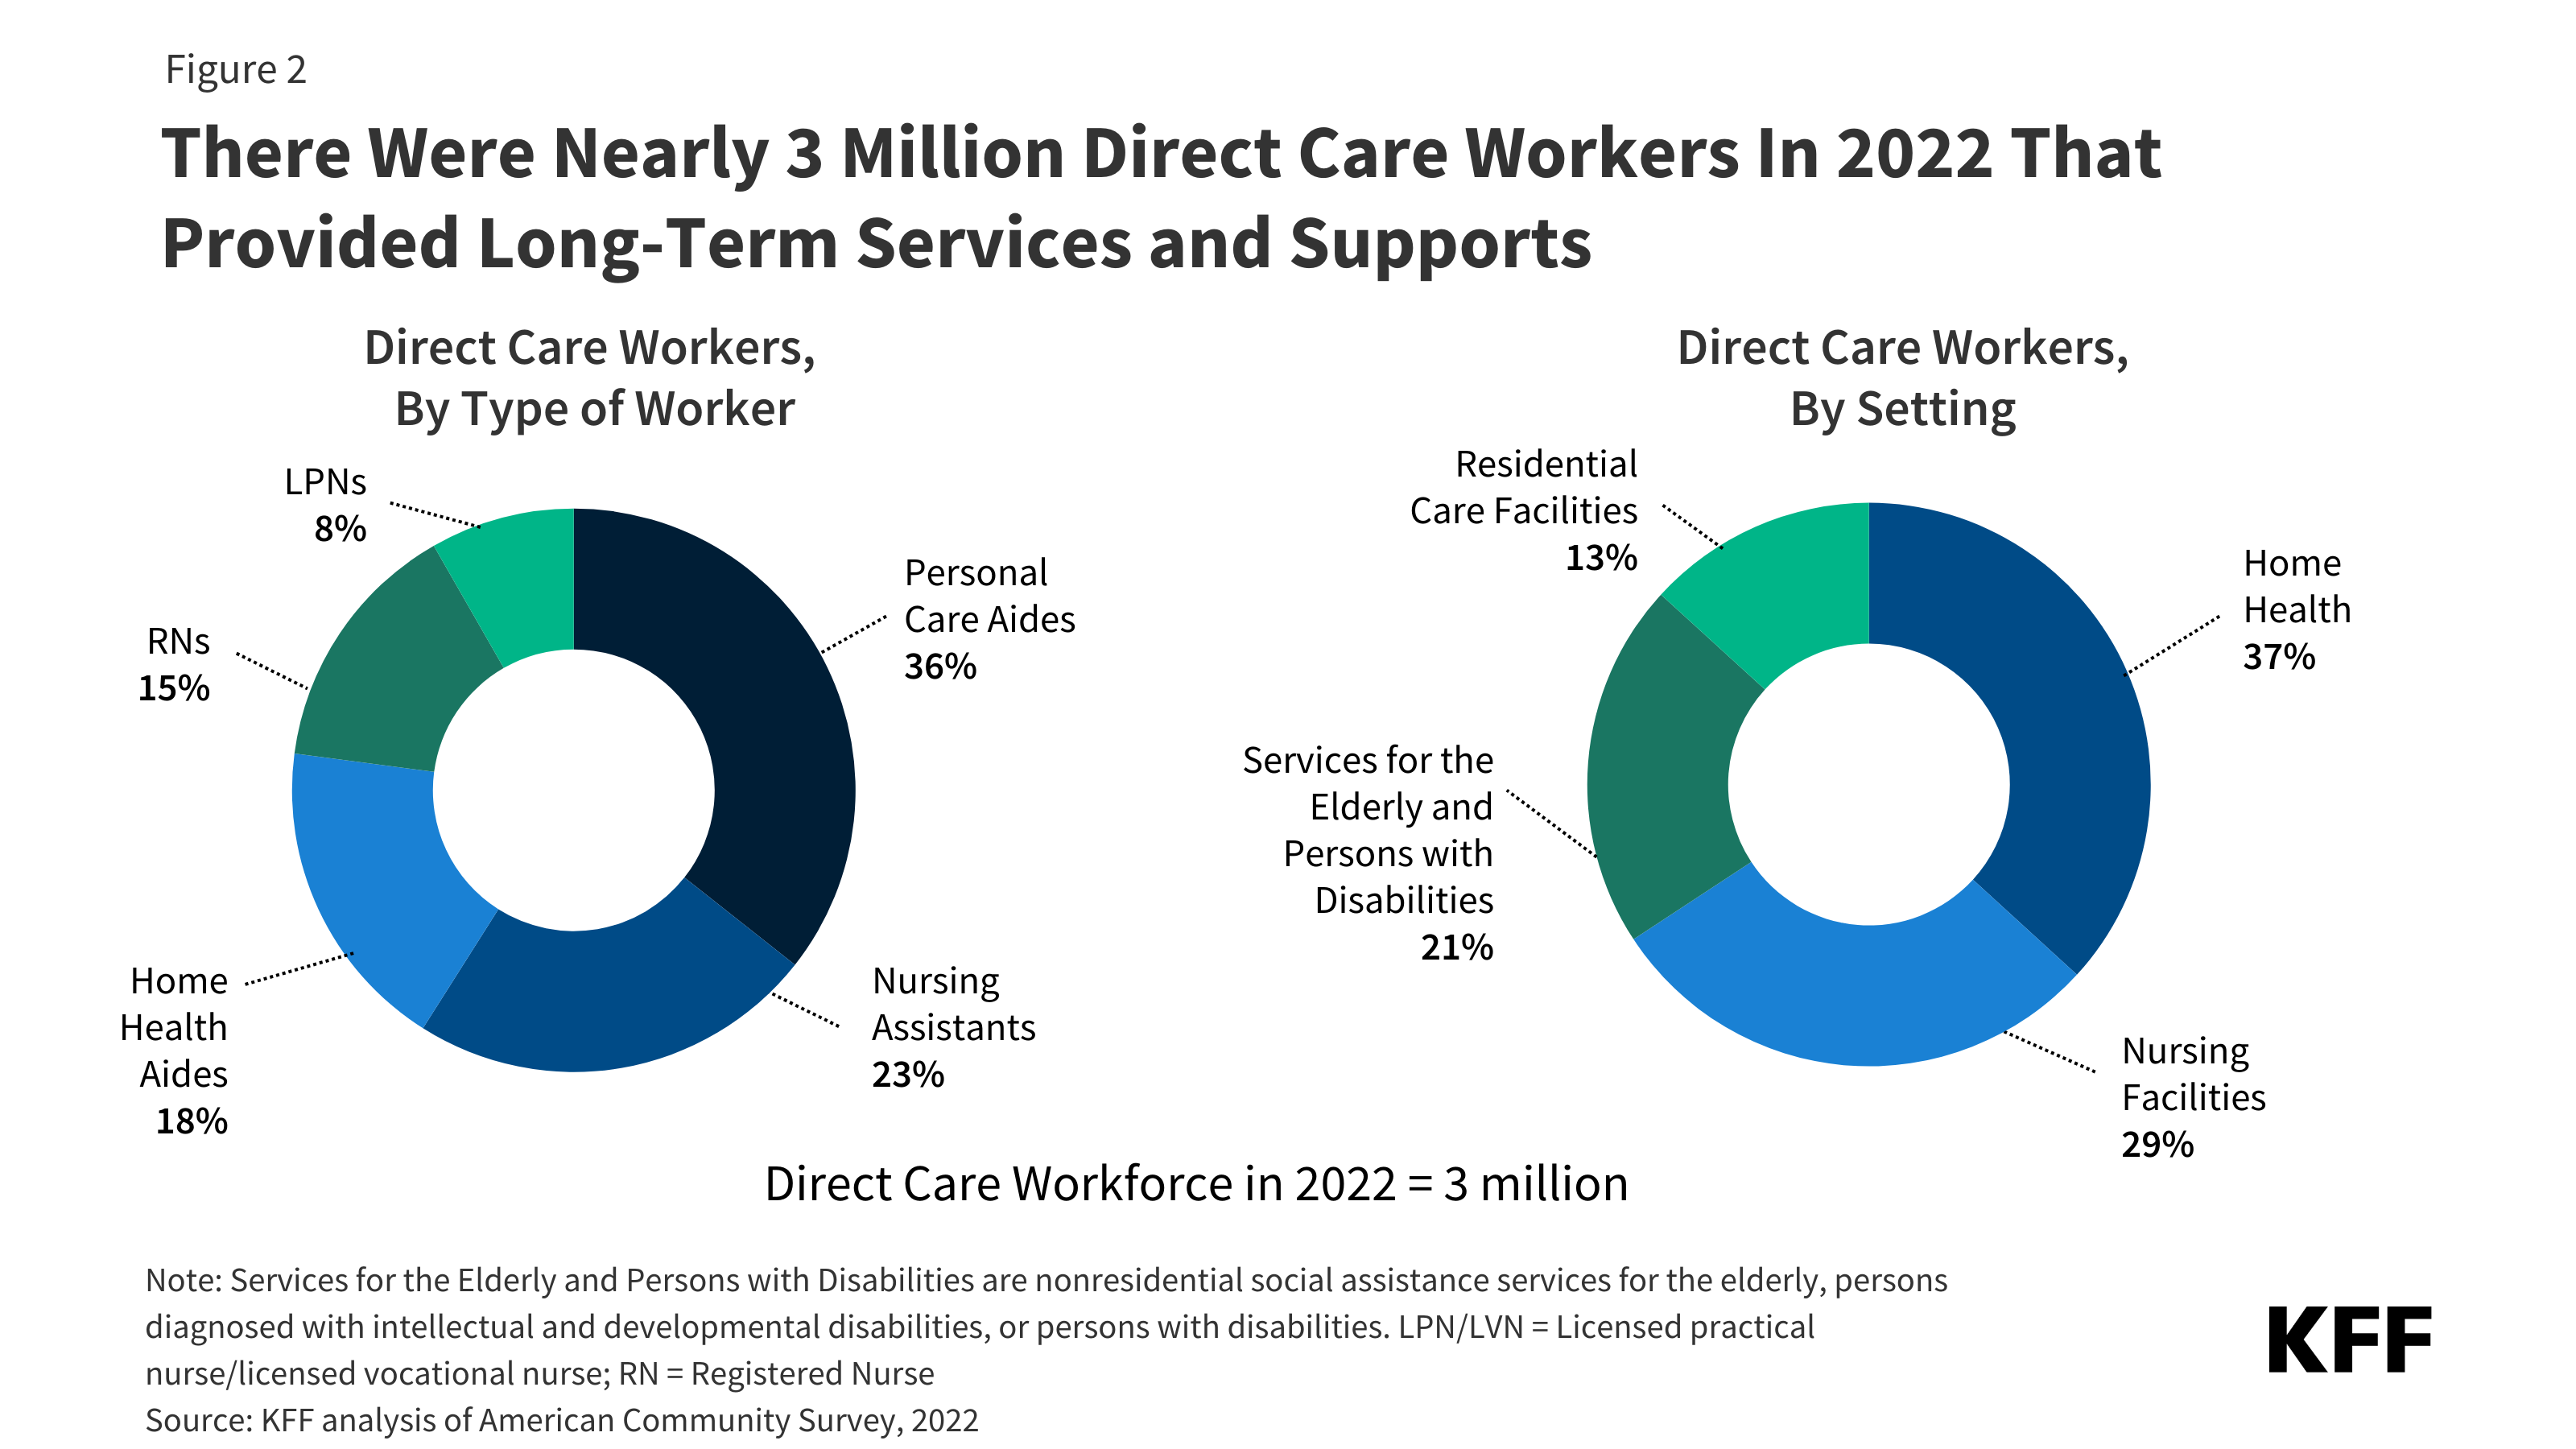
  • Direct care workers work across a variety of settings and include personal care aides, nursing assistants, home health aides, LPNs, and RNs (Figure 2).
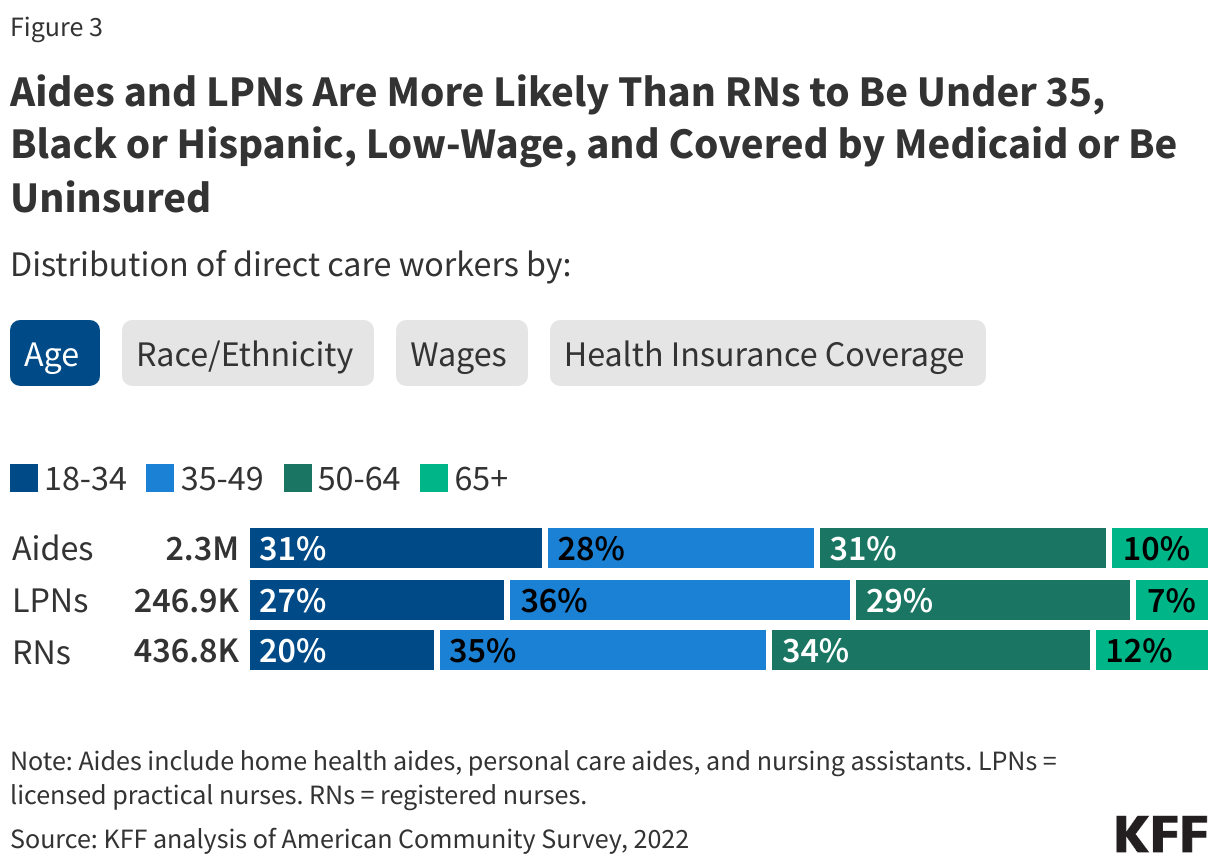
  • Home health aides, personal care aides, and nursing assistants (collectively, “aides”) and LPNs are more likely to be under 35, Black or Hispanic, low-wage workers, uninsured, or covered by Medicaid when compared with RNs (Figure 3).
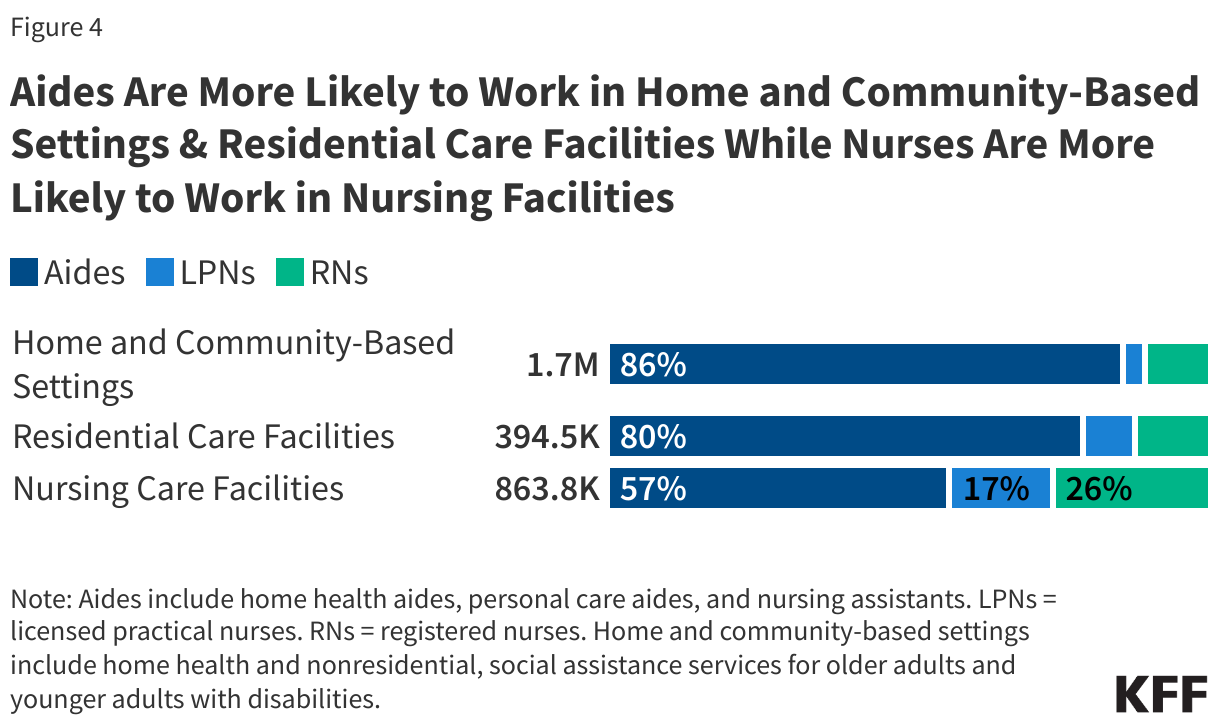
  • Nursing facilities and residential care facilities have higher shares of nurses (LPNs and RNs) when compared to home health settings and services for older adults and younger adults with disabilities (collectively, “home and community-based settings”) (Figure 4).
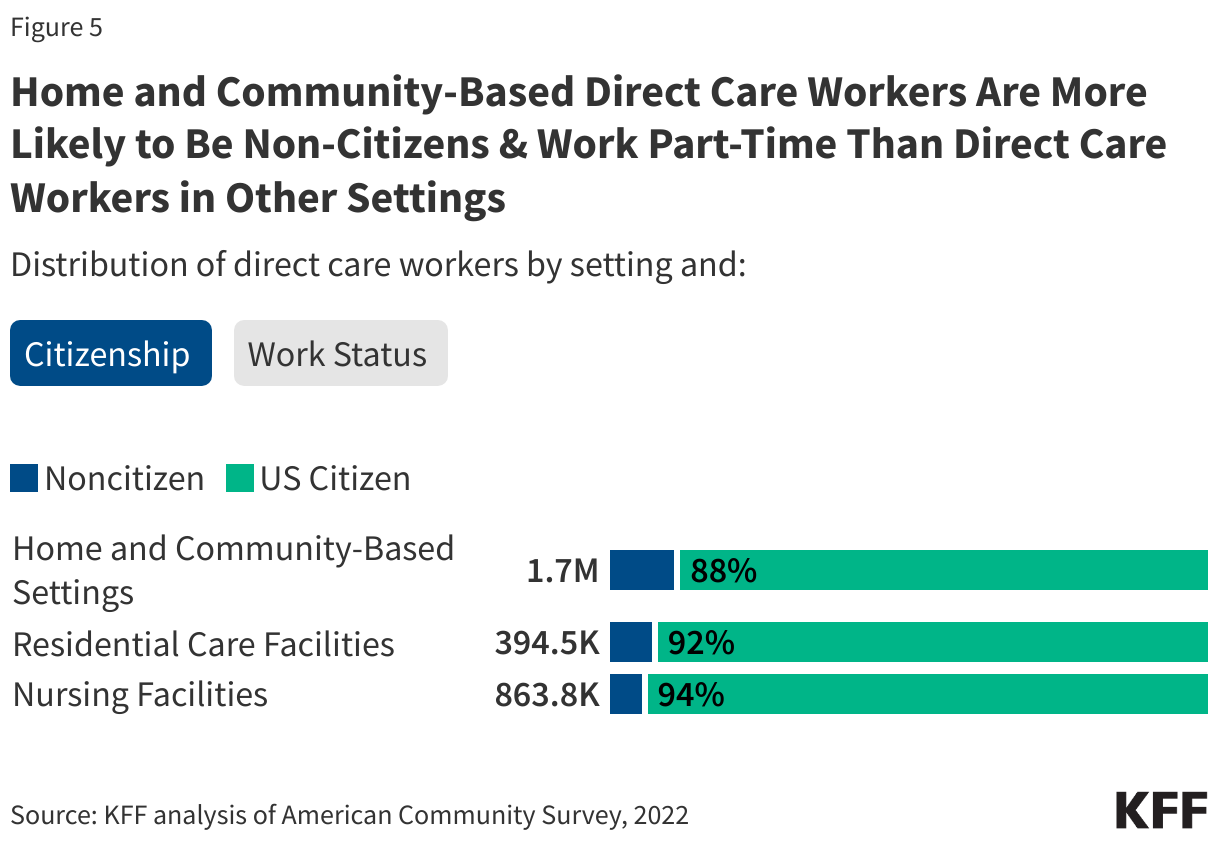
  • Direct care workers in home and community-based settings are more likely to be noncitizens and work part-time when compared to those in nursing facilities and other residential care settings (Figure 5).

There have been longstanding challenges finding enough workers to provide LTSS for people who need such services, and the COVID-19 pandemic exacerbated those issues considerably. In a 50-state survey of officials administering Medicaid HCBS programs, nearly all responding states reported they were experiencing shortages of direct support professionals, personal care attendants, and/or home health aides. The adequacy of staffing in nursing facilities has also been a longstanding issue.

In response to workforce issues, the federal and state governments have taken action to support direct care workers. Section 9817 of the American Rescue Plan Act (ARPA) provided states with an additional 10 percentage points of federal funding for their Medicaid HCBS expenditures that occurred between April 1, 2021, and March 31, 2022. States were required to reinvest the additional federal funding in Medicaid HCBS, resulting in an estimated $37 billion of new HCBS funding. As of December 31, 2023, the number one use of the ARPA funds—accounting for more than $26 billion of the planned $37 billion in new funding—was for workforce recruitment and retention. The second largest use (an additional $4 billion) was for workforce training. Other uses of funding include quality improvement activities and reducing or eliminating HCBS waiting lists.

The Biden-Harris Administration finalized two rules aimed at addressing shortages of direct care workers: (1) the first-ever requirements for nurse staffing levels in nursing facilities, and (2) a rule governing access to Medicaid services with several provisions to strengthen the HCBS workforce, including requiring states to spend least 80% of total Medicaid payments for certain HCBS on compensation for direct care workers, a provision that will not take effect until 2029. Many states have adopted payment rate increases for HCBS providers and nursing facilities with the goal of boosting staffing levels, as reported to KFF in a 2023 survey. Vice President Harris also recently put forth a proposal that would establish a new Medicare home care benefit, among other changes. Although the proposal does not yet have specifics, it proposes improvements for care workers via access to better wages.

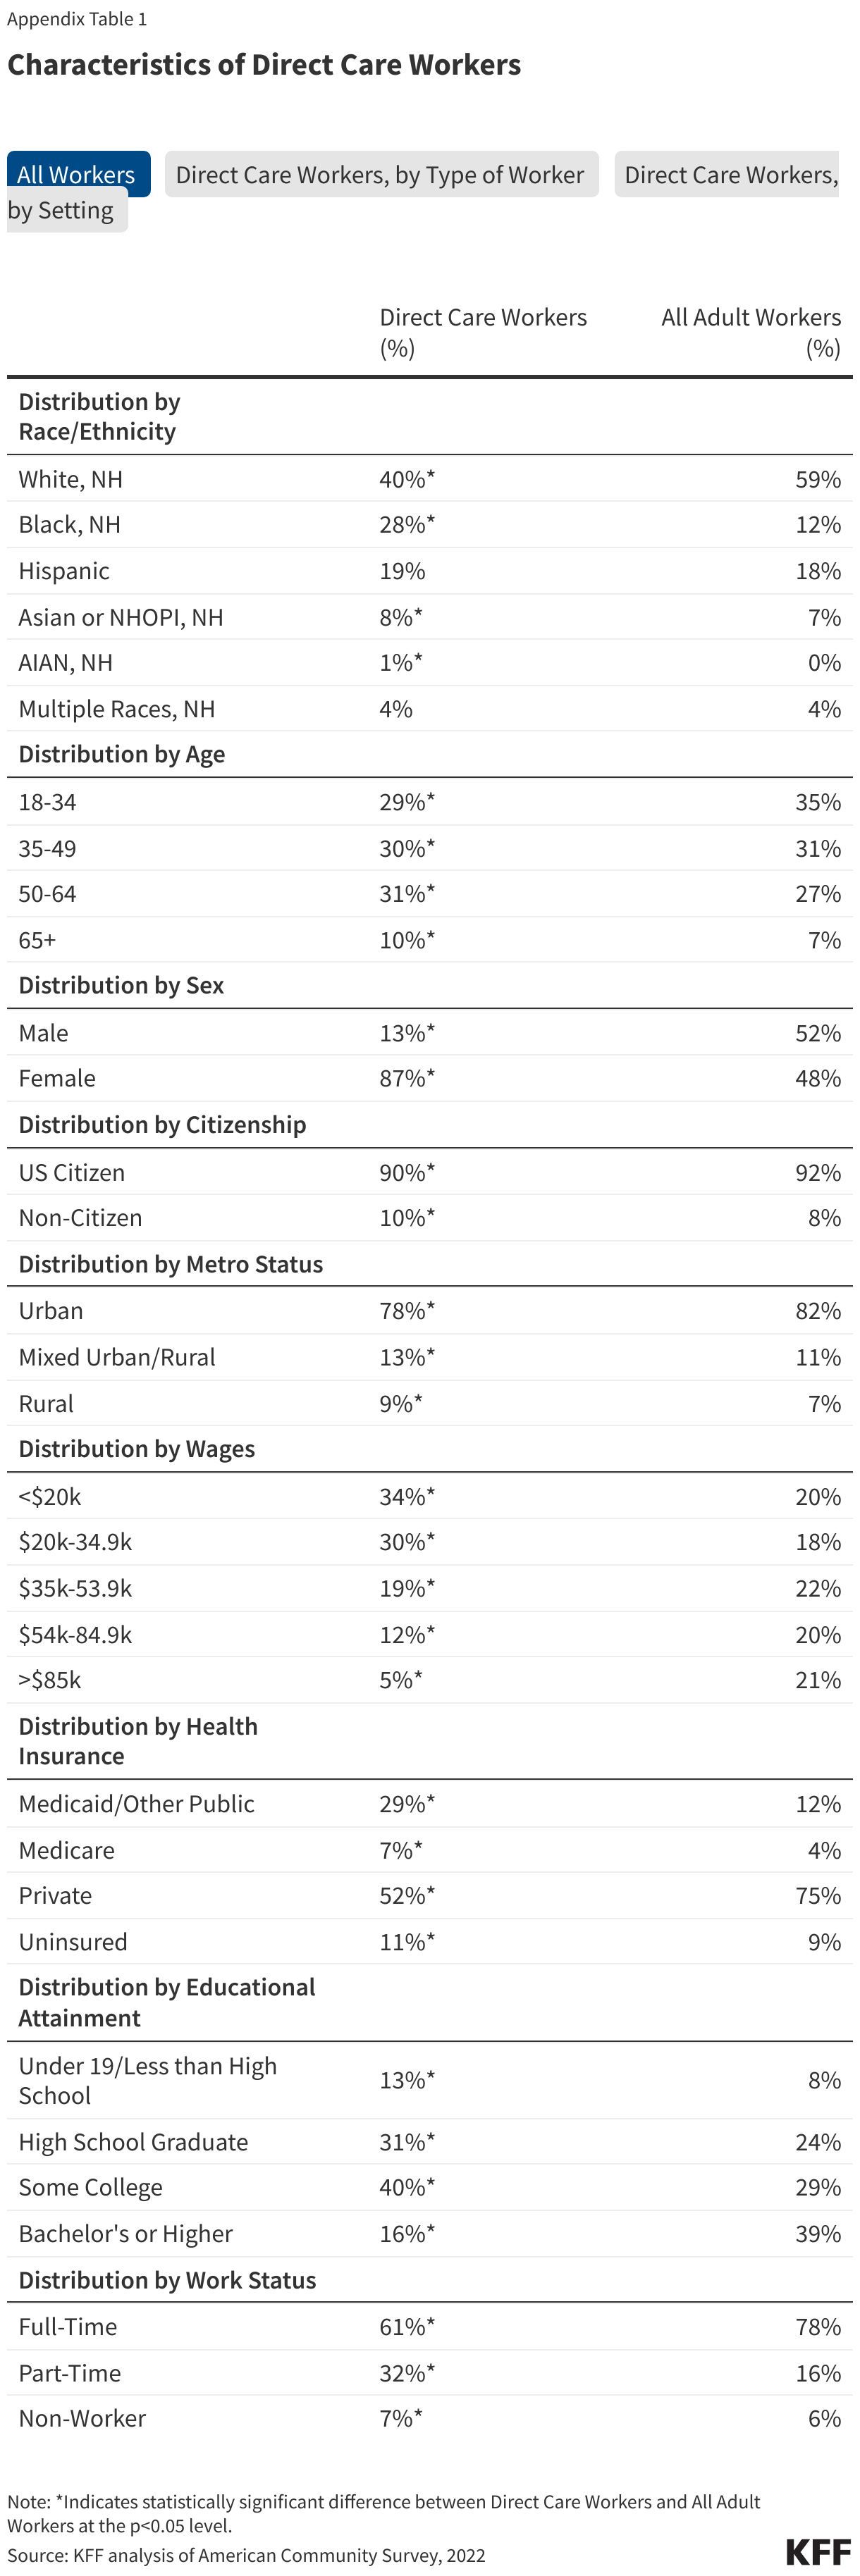
In 2022, there were nearly 3 million direct care workers who provided LTSS to people ages 65 and older and people under 65 with disabilities. These workers were predominantly female (87%) and low-wage (65%); over one-quarter were Black (28%) and over four in ten were age 50+ (41%) (Figure 1). Nearly one in three were part-time workers, and about one in ten were noncitizens, uninsured, and/or lived in rural areas. These demographic characteristics are all somewhat more common among direct care workers than among other working adults (Appendix Table 1).

Box 1: Who Are Direct Care Workers and Where Do They Work?

By Type of Worker:                                 

Home Health Aides: Home health aides assist older adults and people with disabilities living at home with medical care. They may help with checking vital signs, assist with medical equipment, and help with administering medication. They may also help with activities of daily living (ADLs), which include eating, bathing, dressing, assisting with walking/exercise, and using the bathroom.

Personal Care Aides: Personal care aides assist older adults and people with disabilities living at home with ADLs. Personal care aides also help with instrumental activities of daily living (IADLs), such as grocery shopping, meal preparation, and managing medications.

Nursing Assistants: Nursing assistants, or certified nursing assistants (CNAs), typically work in nursing homes and assist residents with ADLs. All CNAs must have completed a nurse aide training and competency evaluation program within 4 months of their employment. They must also pursue continuing education each year.

Licensed Practical Nurses (LPN): LPNs provide care under the direction of a registered nurse (RN). Together, RNs and LPNs make sure someone’s plan of care is being followed and their needs are being met. LPNs typically have one year of training.

Registered Nurses (RN): RNs are responsible for the overall delivery of care and assess overall health care needs. RNs are typically required to have between two and six years of education.

By Setting of Care:

Nursing Facilities: Nursing facilities are residential settings that provide round-the-clock nursing and personal care to residents who either need short-term rehabilitation following a hospitalization or injury or long-term care to residents with chronic medical and/or mental health conditions requiring access to 24-hour skilled care and assistance with ADLs or personal care.

Residential Care Facilities: These settings include residential settings that serve individuals with intellectual and developmental disabilities, mental illness, or substance use disorder. These settings also include establishments that provide residential and personal care services for older adults or younger adults with disabilities who are unable to fully care for themselves. These settings can include assisted living facilities, continuing care retirement communities, and group homes for adults with disabilities. The care typically includes room, board, supervision, and assistance with activities of daily living.

Home Health: Home health agencies are organizations that provide skilled rehabilitative or post-acute care as well as long-term personal care for patients. The same skilled services provided by skilled nursing facilities, such as nursing, occupational therapy, and physical therapy, are instead provided in the home, along with assistance with ADLs and IADLs.

Services for the Elderly and Persons with Disabilities: These are services or settings that provide nonresidential, social assistance services for older adults and younger adults with disabilities. These establishments typically focus on the welfare of these individuals in such areas as day care, non-medical home care or homemaker services, social activities, group support, and companionship. These services and settings can include adult day care centers, home care services for older adults, and companion services.

Direct care workers provide care across various settings: 58% worked in home health settings or provided nonresidential services for seniors and people with disabilities (collectively, “home and community-based services” or “HCBS”), 29% worked in nursing facilities, and the remaining 13% worked in residential care facilities (Figure 2). Nursing facilities are the most medically-oriented institutional settings, providing both short-term skilled nursing and long-term maintenance care services. Residential care facilities include a variety of settings – some institutional and some community-based – and are, as a group, less institutionalized than nursing facilities. HCBS are provided in people’s homes and other community-based settings (Box 1).

Over three-quarters (77%) of direct care workers were personal care aides, nursing assistants, or home health aides (collectively “aides”) and the remaining quarter (23%) were registered nurses (RNs) or licensed practical nurses (LPNs) (Figure 2). Direct care worker responsibilities vary, with some workers primarily providing personal care services, some providing primarily medical care, and some providing a mix of both. Aides tend to provide mostly personal care services whereas RNs provide mostly medical care, and LPNs provide both types of services (Box 1). The educational requirements for LPNs and, especially, RNs, are greater than the requirements for aides on account of the more medical nature of their duties.

Compared with registered nurses, higher percentages of aides and LPNs are younger, Black or Hispanic, low wage, and covered by Medicaid or uninsured (Figure 3). Nearly one in three aides (31%) and over one in four LPNs (27%) are under 35 years old, compared with just one in five RNs (20%). Over half of all aides (52%) and nearly four in ten LPNs (39%) are Black or Hispanic, compared to just 25% of RNs. RNs are the highest paid direct care workers and aides are the lowest-paid direct care workers, with over three-quarters (76%) of aides reporting wages under $35,000. In comparison, just one-fifth (21%) of RNs report wages of less than $35,000. LPNs’ wages are higher than those of aides but lower than those of RNs. The differences in wages are likely attributable, at least in part, to the fact that the educational requirements are most rigorous for RNs and least rigorous for aides. Aides are also more likely than nurses to work part-time, likely another contributing factor to the wage discrepancies (Appendix Table 1). Aides are twice as likely to be uninsured compared with RNs (12% vs 6%) and four times as likely to be covered by Medicaid (35% vs 9%). LPNs are nearly twice as likely as RNs to be uninsured (11% vs 6%) or be covered by Medicaid (16% vs 9%).

Aides and LPNs Are More Likely Than RNs to Be Under 35, Black or Hispanic, Low-Wage, and Covered by Medicaid or Be Uninsured

Nursing facilities and residential care facilities have higher shares of nurses compared to home and community-based settings (Figure 4). The percentage of direct care workers who are RNs or LPNs is 43% in nursing facilities, 21% in residential care facilities, and 14% in home and community-based settings. The Biden-Harris Administration released a rule that creates new requirements for nurse staffing levels in nursing facilities, including minimum levels for nurse aides and registered nurses. This rule was highly anticipated as it would create the first-ever federal minimum staffing levels, though even prior to the staffing rule, many states had their own minimum staffing levels. In contrast, a new rule on access to Medicaid services includes several requirements regarding the adequacy of states’ payments for direct care workers in home and community-based settings, but does not establish any minimum staffing levels for such settings.

Aides Are More Likely to Work in Home and Community-Based Settings & Residential Care Facilities While Nurses Are More Likely to Work in Nursing Facilities

Direct care workers that work in home and community-based settings are significantly more likely to be noncitizens, work part-time, and have lower wages when compared to those in nursing facilities and other residential care settings (Figure 5 and Appendix Table 1). Among direct care workers in home and community-based settings, 12% are noncitizens compared with 8% in residential care facilities and 6% in nursing facilities. Noncitizens include those who are lawfully present as well as those who are undocumented, though the majority of noncitizen immigrants are lawfully present. Part-time work is also more common among workers in home and community-based settings, with 40% of workers working part-time compared with 22% of nursing facility workers and 24% of residential care facility workers. Direct care workers overall are more likely to be part-time workers than all adult workers (32% vs 16%), which may be part of the reason they are more likely to have wages under $35,000 (64% vs. 38%) (Appendix Table 1). Low wages among direct care workers broadly are a key driver in the high turnover in the workforce, which has spurred action among federal and state policymakers. The Biden-Harris administration finalized a rule aimed at ensuring access to Medicaid services, which included a provision that requires states to spend least 80% of total payments for certain HCBS on compensation for direct care workers. Most states have also increased payments to direct care workers to increase the supply of HCBS workers, though some of those states have indicated that some of those increases are temporary.

Home and Community-Based Direct Care Workers Are More Likely to Work Part-Time & Be Non-Citizens Than Direct Care Workers in Other Settings

Both 2024 presidential candidates have addressed direct care workforce shortages in their party platforms, but questions remain about how the shortages would be addressed. The Republican platform proposals address disincentives that contribute to workforce shortages, but it is unclear what policies a Republican Administration would put forth to achieve those goals. On October 8, 2024, Vice President Harris put forth a proposal that would establish a new Medicare home care benefit, among other changes. Although the proposal is not fully specified, it proposes to lift up care workers by providing access to better wages. If enacted, the Harris proposal would be the first major expansion of Medicare since the Medicare Modernization Act of 2003 that added a prescription drug benefit to the program. Many policy details would have to be worked out as the proposal wound its way through Congress, including questions about eligibility, benefit design, financing, and workforce shortages.

Methods

This analysis is based on KFF analysis of the 2022 American Community Survey (ACS), 1-year file. The ACS includes a 1% sample of the US population, and the subset of direct care workers used here includes over 26,000 observations. Direct care workers are those who fall into the following occupation codes: Registered nurses (3255); Licensed practical and licensed vocational nurses (3500); Home health aides (3601); Personal care aides (3602); and Nursing assistants (3603). Home health aides, personal care aides, and nursing assistants are collapsed into “Aides” in parts of this analysis. This analysis only includes those who work in the following industries: Home Health Care (8170), Nursing Care Facilities (8270), Residential Care Facilities (8290), and Individual and Family Services (8370). Home health care and individual and family services are collapsed into “HCBS” for parts of this analysis.

These industries capture the majority of workers providing long-term health services. They exclude some workers who may be providing ongoing non-health social services to individuals. The ACS asks respondents about their health insurance coverage at the time of the survey. Respondents may report having more than one type of coverage; however, individuals are sorted into only one category of insurance coverage.

We define the direct care workforce as all individuals who earned at least $1,000 during the year and indicated that their job was in both the long term care industry and occupation codes listed above.

Notably, the ACS does not include unpaid LTC caregivers, such as relatives and friends, who actually provide the majority of community-based long-term services and supports in the US. A limitation of federal surveys broadly, including ACS, is the likely underrepresentation of noncitizens, particularly recent and undocumented immigrants.

Characteristics of Direct Care Workers

Experiences of Direct Care Workers and Family Caregivers of Home- and Community-Based Services (HCBS)

Published: Oct 30, 2024

Issue Brief

KFF estimates that there are over 4 million people using Medicaid home- and community-based services (HCBS), which include medical and supportive services that assist people with activities of daily living (such as eating, bathing, and dressing) and instrumental activities of daily living (such as preparing meals, managing medications, and housekeeping). Direct care workers play a pivotal role in providing such services for people who need help because of aging, chronic illness, or disability. Direct care workers perform demanding, high-stress work for low wages and often no benefits. There have been longstanding challenges finding enough direct care workers, and the COVID-19 pandemic exacerbated those issues considerably. In a 50-state survey of officials administering Medicaid HCBS programs, nearly all responding states reported they were experiencing shortages of direct support professionals, personal care attendants, and/or home health aides.

In response to workforce issues, the federal and state governments have taken action to support direct care workers. The American Rescue Plan included a provision to increase the federal matching rate (FMAP) temporarily for spending on Medicaid HCBS by 10 percentage points, and all states used at least part of these additional federal funds to recruit and retain direct care workers. The Biden Administration also finalized a rule aimed at improving access to Medicaid services, which included several provisions aimed specifically at strengthening the HCBS workforce, including a requirement for states to spend least 80% of total payments for certain HCBS on compensation for direct care workers. Nearly all states have adopted payment rate increases for HCBS providers with the goal of boosting staffing levels, as reported to KFF in a 2023 survey.

Although long-term services and supports (LTSS) is not a dominant election issue, support for caregivers resonates with voters and both presidential candidates have called for investing more in home care. Former President Trump has called for more home care for seniors, while Vice President Harris has called for increased home care for seniors and people with disabilities, and has also promoted rules and legislation to strengthen Medicaid HCBS. Vice President Harris recently put forth a proposal that would establish a new Medicare home care benefit, among other changes. Although the proposal does not yet have specifics, it proposes to lift up care workers by providing access to better wages.

KFF conducted four focus groups in May 2024 with direct care workers and unpaid caregivers who provide HCBS. See Box 1 and Appendix Table 1 for more information about the focus group participants and methods. This issue brief presents findings from the focus groups including caregiver characteristics; physical, emotional, and mental caregiving demands of caregiving; their wages, finances, and opportunities for advancement; and what caregivers would like policymakers to know about their work. Key findings from our groups, which cannot necessarily be generalized to all caregivers, include the following:

  • All caregivers reported that they were drawn to the work because it allowed them to help people. Many paid caregivers started as unpaid family caregivers before becoming paid caregivers while many participants in the family and friend focus groups reported that they started caregiving because they were the only person available to help.
  • All caregivers reported that their jobs were physically and mentally demanding and there were limited resources to help deal with challenges of caregiving. Caregivers described the difficulties of balancing paid and family caregiving responsibilities with caring for their other family and friends, professional commitments, and self-care.
  • Caregivers in all groups reported struggling to make ends meet and that their compensation did not match the demands of the work. Some paid caregivers described this work as a steppingstone to a different career, while other caregivers described this career as more permanent, though nearly all agreed that there are little to no opportunities for advancement. Participants in the family and friends groups who were receiving payments from Medicaid reported that the Medicaid payments were lower than their earnings from other work. Not surprisingly, caregivers voiced support for polices to increase wages and benefits for paid caregivers and provide training and resources for all caregivers, which could be achieved through increased funding for Medicaid HCBS or other mechanisms.

Box 1: Information About the Focus Group ParticipantsThe focus groups included 28 adults who self-identified as paid direct care workers or family caregivers to individuals enrolled in Medicaid and receiving HCBS. KFF worked with PerryUndem Research/Communication to recruit participants and conduct four focus groups. Individuals who were able to participate in our groups needed to have two hours of time, a quiet space, and internet. Participants included adults who varied in terms of the length of their time as a caregiver, type of employment, state of residence, gender, race/ethnicity, age, and immigration status. Groups were stratified into paid and family caregivers and the age of the people cared for. Some paid direct care workers were employed by home care agencies while others were employed and directed by the Medicaid enrollee they cared for through “self-directed services” programs. Some family caregivers received compensation for their role as caregivers, and most maintained other employment. These characteristics may not fully represent many caregivers, so findings may not be generalizable to the entire caregiver population. See Appendix Table 1 for demographic details about the participants in the focus group, and a separate KFF analysis on the demographics of all direct care workers nationwide.

All caregivers reported that they were drawn to the work because it allowed them to help people.

Both paid and unpaid caregivers reported that they were drawn to the work because it allowed them to help people. Caregivers across the focus groups described providing a wide range of services to those that they cared for, including bathing, feeding, preparing meals, running errands, and providing companionship.Some caregivers reported helping with specific activities, such as preparing meals while other caregivers reported that they helped with “everything from A to Z.” Though most participants described the work as mentally and physically strenuous, nearly all reported it gave them a sense of feeling like they were helping people by providing help with things individuals could not do on their own or without assistance. Caregivers reported feeling a great sense of satisfaction from their work, with family caregivers deriving fulfillment from caring for loved ones while paid caregivers derived fulfillment from helping those people who were unable to care for themselves. One caregiver noted “for me, personally, the end result was to just get that smile,” while another noted that “you kind of build a bond with [the clients] over time… and they become like family.”

Many paid caregivers started as unpaid family caregivers, sometimes for multiple family members, before becoming paid caregivers. Paid caregivers described being drawn to caregiving jobs because they had first experienced taking care of family members, such as grandparents or parents, and were able to “make a difference” in their clients’ lives. One caregiver noted he started caregiving right out of high school for his grandmother and discovered that he enjoyed the work immensely. He continued on to get his caregiver’s certificate, eventually becoming a home health aide. Another caregiver took care of his grandmother and his dad before eventually starting to work with non-family members on a paid basis.  

“I started [caregiving] when I was actually fresh out of high school. I had a grandma that needed help…the county of Los Angeles [would] give her hours and in return you help her out, you cook her meals, help her laundry, etc.…I liked helping people so then I continued…I’m a home health aide. I did my 120 hours course to get my caregiver certificate and I take pride in my work. I just want to give the patients…whatever I can do to help them.”

– Latino man, CA, 36, Direct Care Worker

Many participants in the family and friend focus groups reported that they started caregiving because they were the only person available to help. Family caregivers noted that while they were doing this out of love for the person they were caring for, they also felt they were the only person available to do the work. One participant shared: “it became known throughout the family that [she] was the caregiver, that [she] was the one to call.” Family caregivers also shared that they hoped someone would one day care for them the way that they are caring for others.

“She’s about 105 pounds so I pick up with one hand and one arm and put her in the shower and I cook, I clean, I do everything for her. Because on a good day, she can sit up by herself and she can possibly hold onto something and stand up for about 10 seconds. I don’t want her doing that, because if she falls and hurts herself, then that makes things worse…she said; she said, cuz why do you do it? I said; if not me, who? That’s how I feel, because I would hope to God that if I ever needed it, someone would do for me what I would do for you.”

– Black man, FL, 59, Family Caregiver

All caregivers reported that their jobs were physically and mentally demanding.

Participants in both groups described physically demanding responsibilities, with older caregivers reporting that caregiving became increasingly difficult as they aged. Nearly all caregivers described the job as taking a physical toll on their bodies and shared physical health conditions they had developed due to the demands of caregiving, including back pain, knee pain, and overall fatigue.One participant who was 58 years old and diagnosed with fibromyalgia noted that there were days where “[she] feels worse than [he] does,” referring to the loved one she cared for. Another 60-year-old participant described that “it takes a tremendous amount of energy to be able to do the kind of work that we do,” noting that he no longer has the physical capacity to do the work.

“The physical part is [hard]. I’m getting older and it’s getting a little harder…sometimes my client gets dizzy from his medication, and I’ve got to help him. And he’s 6 foot tall, 250 pounds. So, if he was to fall there’s no way I could catch him. Just keeping up with taking care of him. I don’t know how long I’ll be able to do this as I get older.”

– White woman, MO, 51, Direct Care Worker

Participants in both groups described the mentally demanding responsibilities, which included watching people’s conditions deteriorate over time. Nearly all caregivers across groups expressed that thinking about the long-term prognosis for the people they cared for was incredibly emotionally challenging. Caregivers working with older people, particularly those with dementia, shared that it was difficult knowing that the people they take care of won’t get better, and described the work as “thankless.” Caregivers who cared for younger children described the toll of the work as less physically demanding but much more emotionally challenging. A paid caregiver explained, “If I have a sick child that’s on the verge of death, that is really, really hard for me.”

“Mentally, it’s just so hard… my patient will have fits and literally scream all day even though nothing’s wrong with her. And it’s just like draining hearing that scream 24/7 for eight hours a day. She’ll have no problem just screaming; or she just won’t want to put her clothes on or she will just start throwing everything…So stuff like that, I feel like it just gets to me. Because it’s just like, ‘oh I just cleaned up, and now like it’s back to being messy.’ You know you can’t be irritated; you can’t be annoyed because [patients aren’t] capable of knowing what they’re doing.”

– Asian woman, VA, 23, Direct Care Worker

For parents with children who are medically complex or have significant physical, mental, or intellectual disabilities, caregiving goes well beyond the “ordinary” responsibilities of being a parent. Parents of such children are often required to provide what the Centers for Medicare & Medicaid Services (CMS) describes as “extraordinary care,” which exceeds the range of activities that a parent would ordinarily perform in the household on behalf of a person without a disability or chronic illness of the same age. Such responsibilities are often necessary for children to avoid being placed in an institution, which is why Medicaid will pay for those services in some cases. Parents in the focus groups shared fears about what caring for their children would look like in the future, especially as the parents themselves aged. One participant noted that it was extremely mentally challenging to envision the future and think about how her son was “always going to have to be, either liv[ing] with family or at worst…a group home setting.”

“I’m constantly turning over scenarios in my head and then I’m always wondering how long can I continue this? You know [he is] going to need care for the rest of his life, unfortunately…He’s always going to have to either live with family or at worst a group home setting. So these are things that I have to worry about, and I’m getting older. And not only worrying about my end-of-life care, but somebody else who’s nowhere near end-of-life and how do I do that? My head’s always in a spin. It’s just always in a spin.”

– Biracial woman, AZ, 51, Family Caregiver

Participants in both groups noted there were few resources to help deal with mental, emotional, and physical challenges of caregiving. Most paid caregivers explained that their employers provided limited emotional and mental support. Many of them relied on resources outside of their employer to deal with the demands of the work, noting examples such as therapy, exercise, and religion. Family caregivers also noted that they had few resources to cope with the demands of their work: one participant described the focus group as their first opportunity to open up about the challenges of caring for their loved one.

Several paid caregivers described difficult and often unkind treatment from clients and their families, adding to the mental challenges of an already difficult job. Paid caregivers overwhelmingly described the job as emotionally draining and some described having to mentally prepare for the demands of the work prior to a shift. Several described difficult conversations with the family members of those they care for, explaining that they are frequently accused of not properly caregiving for the family’s loved one. One caregiver explained “When [the patient’s families] do come they will swear you’re not taking care of their mom or dad correctly, despite not coming around for months at a time.”  A caregiver agreed, describing the caregiver as “stuck in between” caring for the patient and coordinating with difficult family members who are emotionally drained and may not understand the limits of Medicaid funding.

“Sometimes you’re around [the patient’s] family as if they were yours. It’ll be like a family member that flew out here, and they come in and they want to nitpick and do all these things…Meanwhile, you’ve been with this patient for years at this point and you have never seen this man before. And that becomes a sticky situation because now they want to voice their concerns and it’s like; ‘where were you for the last two years I’ve been with your dad, your aunt, your father? I didn’t even know you existed.’ A lot of the times the families are the biggest problem and, to an extent I get it, because they’re emotional, but at the same time I feel like they need to understand it from a caregiver’s point of view, because if that was the case why don’t you just bring them home with you.”

– Biracial woman, NY, 37, Direct Care Worker

A few direct care workers who were Black reported experiencing racism from clients or family members of clients. Those caregivers reported that racial discrimination impacted their ability to successfully do their work and added to the mental challenges of the work. One Black caregiver shared that her elderly patients sometimes “don’t want [her] to come in their home or take care of them…They prefer a White caregiver.” These experiences echo findings in KFF’s 2024 survey, in which more than half of Black adults responded that racism is a major problem for employment in the U.S.

“Working with the elderly, sometimes somebody like me, they don’t want…They don’t want me to come in their house or take care of them. I have had that happen. They prefer a white caregiver…they’ll tell you straight to your face; ‘I don’t want you to take care of me.’ I’ll call my job and let them know… ‘hey, this patient doesn’t want me to take care of them so they’ll reassign me to somewhere else.’…If the patient doesn’t want me to touch them, I can’t provide the proper care. That’s putting the patient’s caring at risk.”

– Black woman, GA, 36, Direct Care Worker

For family caregivers, some of the unique demands stem from the emotional demands associated with caring for a loved one and administrative barriers to accessing Medicaid HCBS. Nearly all family caregivers reported that the work was a challenging obligation, but that they really wanted to avoid making their loved ones feel like a burden. They saw their roles as fulfilling and appropriate duties for family members. One participant summed it up: “it’s my mom, she took care of me – so I need to take care of her.” Beyond the emotional challenges, some participants described significant administrative barriers related to accessing Medicaid HCBS for their loved ones. One participant struggled to navigate the paperwork and complicated timelines of ensuring their loved one remained enrolled in Medicaid and another expressed frustration that they were not able to get approved for enough hours of paid care, which was particularly challenging because their loved one needed help round-the-clock.

“Our big problem is paperwork and reapplying [for Medicaid] and all of that stuff. It’s just exhausting. And you’ll have to do it three and four times, and you’re aggravating your doctor’s office, because they’ve already faxed it and they have to fax it again. Those are the big problems for us, the trying to renew everything that was put in place three months ago or a year ago, and you have to go all the way through it again. And then you get approved, and you’re not approved for the year, you’re approved for three months, after four months of working on it and you’re still working on it and it’s just a never-ending thing, paperwork wise.”

– White woman, FL, 57, Family Caregiver

Caregiving is a complex balancing act.

Participants in the paid focus groups described having difficulties balancing work with other responsibilities, especially to their own families. Caregivers described the immense challenge of caring for someone and then, going home and immediately caring for other family members. Several caregivers noted how they were often emotionally and physically depleted and felt they did not have energy left to properly care for their children and spouses. One caregiver described that between her night shifts at work and her school commitments during the day, she has wondered whether she is still being a good mom. Another caregiver agreed and explained, “I have a five-year-old and she wants to sometimes play, and sometimes I don’t have enough sleep, sometimes I’m drained.” Some caregivers had their own emotionally intense family challenges at home that they were not able to provide sufficient attention to due to the lack of emotional and mental capacity after a long day of caregiving. Some caregivers worked schedules that made it difficult to have time with their children at all. Another caregiver described the challenge of giving her best to her client and then “sometimes not having that energy to go and basically give [her] best to [her] home, [her] children.” The situation becomes harder when caregivers’ shifts end and there is no one coming to replace them. One caregiver works the night shift before getting home to take her kids to school and daycare. When the day shift worker never arrived to replace her one morning, she called the agency only to be told that legally, she could be there for 20 hours. She was forced to choose between not showing up for her kids or leaving the patient—who required round-the-clock care—alone.

“My [daughter] is not working, she’s saying the economy is hard…I work such varied hours, I’m not there for her. And then it’s like, am I doing enough? Her mental health is really spiraling out of control…I’ve been at this job for three years. My patient is gradually declining [with] Alzheimer. Also, my daughter tried to commit suicide…I have committed to this job to be here. And then it’s like, I couldn’t find anybody at the time who was willing to work with a dementia patient…it is so hard. It’s kind of stressful, because when I leave [work] and I go home, it’s like I’m going into another stress of trying to talk to [my daughter] and make her feel like it’s going to be okay. So that’s my stress.”

– Black woman, NY, 51, Direct Care Worker

Participants in the family and friends group described difficulties balancing caregiving responsibilities with self-care. Many family caregivers mentioned compromising care for themselves, forgoing exercise, or doctors’ visits to fulfill their caregiving duties. One participant described putting off mammograms to the point of having to have surgery, noting that “I knew there was something wrong.” She explained that she has had doctor appointments scheduled, but something would come up with her mother and she would not be able to find help in time to attend her scheduled appointment. Family caregivers also described elongated periods when they were caregiving on their own with no help as “overwhelming,” and that splitting the responsibility of caregiving with other family members helped enormously.

“I’m juggling a lot. I’m sometimes at [loved one’s] house until 11:00, 10:30. I’m feeding him his dinner and then after that it’s [his] medications and getting him from his power chair into the bed and there is just a couple of hours routine that we have to do and it’s making sure that he’s coughing and that he feels his airways are open before I leave and putting the oxygen on and he has to feel comfortable to be left alone for the night, and it takes a while. And so I’m not getting home until maybe 11-11:30, and I have to get up for my regular job in the morning, and I just find myself exhausted. And that’s how it’s affecting me, just exhaustion.”

– White woman, FL, 57, Family Caregiver

Many family caregivers did not have paid caregiving help to help balance responsibilities because of a lack of trust in paid caregivers, high costs, or difficulty finding someone. Some family caregivers explained that they were reluctant to have paid caregivers help out due to the lack of trust in paid caregivers, while others have struggled to find someone that fits the needs of their family. One caregiver noted that her grandmother “is picky….She only wants to deal with family.” One caregiver described the difficulty of finding culturally competent care because her father only speaks Spanish.

I have to find a way to put myself first because I’m getting burnt out, I’m getting overwhelmed, and I absolutely love my [loved one] but you know, I’m thinking about the long term and I have to try to figure something out. Thank God, I have my husband who helps me with the other things, but I think because I’m doing this alone, that’s the scariest part.”

– Latina woman, NY, 34, Family Caregiver

Caregivers in both groups reported struggling to make ends meet and compensation did not match the demands of the work.

Nearly all caregivers agreed that their compensation did not match the demands of the work. Participants generally agreed that the work was not valued as highly as it should be, with one participant noting that “people pay more to take care of their animals than they do [for] our elderly.” Among participants, there was no consensus on the exact level of compensation that was sufficient. One participant explained “I feel like you’re never going to get paid enough… they smack you, they spit on you…but I feel like we definitely deserve… a higher wage.” In 2023, the Bureau of Labor Statistics reported that the median pay for home health and personal care aides was $16.12 per hour or $33,530 per year. KFF analysis found that in 2022, 65% of direct care workers made less than $35,000 annually.

“I’m not even getting paid the state minimum wage. I’m still arguing with the company that I work for, because I got a raise a year ago to the minimum wage. Now minimum wages went up again this year, and they don’t want to [give me another] raise. And I’m like, isn’t that illegal? And if for some reason I can’t clock in by the telephone and I have to send in a time sheet, they gave me $2 an hour less for those hours on that day. So that’s really stinky.”

– White woman, MO, 51, Direct Care Worker

Some caregivers felt that their low wages reflected inequitable treatment by employers. One paid caregiver felt underappreciated and angry when she learned that another caregiver serving the same client was being paid $10 more an hour than she was. Another caregiver described pay disparities within the agency between management and the caregivers: “I think there should be more equity, where the people who are doing the hands-on work should be getting higher wages.” These sentiments expressed by caregivers align with the provisions in the recent Medicaid access rule which requires that at least 80% of Medicaid payments for certain HCBS be spent on compensation for direct care workers. 

Participants in the paid groups reported little growth in wages over the past few years despite higher costs of living. Nearly all participants agreed that inflation and the high cost of living combined with low wages were causing enormous financial stress in their household. One paid caregiver described that she had been “struggling financially trying to keep up with groceries, food, and gas,” while another explained having to work two jobs to deal with the impacts of inflation.

“Oh, just, well I was just, like I just said earlier, just the fuel cost alone that puts a big hole in your, in your check. (short laugh) And then you got the rent. And car insurance, my car insurance went up, I had to call them yesterday; I’m like oh my God what’s happening? And my wages are not matching what’s happening here.”

– Black woman, NY, 51, Direct Care Worker

Most paid caregivers reported having no paid time off or other benefits. Most caregivers did not receive health insurance through their employer and instead relied on other sources for health insurance including Medicaid, the Marketplace, or a spouse’s employer-based health insurance. Nearly half of paid caregivers in the focus groups were on Medicaid and several caregivers were uninsured because they did not qualify for Medicaid and thought private insurance was too expensive. One caregiver explained that she was uninsured because “a lot of these healthcare plans that these jobs offer are not affordable.” Several caregivers mentioned wanting paid time off, given the demands of their jobs. One participant explained, “The company we work for we don’t have vacation days, we don’t have time off, we don’t have any health insurance, and I don’t think that’s right.” Another participant mentioned that retirement benefits would also be a good benefit to have, explaining “when you reach retirement age, you don’t have to be depending on your kids to supplement your income.”

“The biggest issue that I have is we don’t have any benefits. The company we work for we don’t have vacation days, we don’t have time off, we don’t have any health insurance, and I don’t think that’s right.”

– White woman, PA, 28, Family Caregiver

Some paid caregivers described this work as a steppingstone to a different career, while other caregivers described this career as more permanent, though nearly all agreed that there are little to no opportunities for advancement. Several of the paid caregivers in the focus groups were in school and expressed the desire to use their forthcoming degree to leave the direct care workforce and go make more money elsewhere. One paid caregiver who was in school to become a registered nurse explained “I don’t see myself doing home health in the long term. I would like to be like a healthcare administrator in a nursing home.” Another caregiver described “I’m going to leave this field because obviously it’s underpaid, and I have to put my kids first.” Several of those who described this career as more permanent also lived in households where there were other earners and explained that those other earners were key to being able to continue their caregiving career.

Participants in the family and friends group also reported struggling to make ends meet, especially when they had to reduce their hours because of caregiving duties. Several family caregivers had to reduce their number of working hours because of caregiving resulting in lower income levels and careful budgeting. One participant noted that after reducing their work hours, their household budget got tighter. Their kids were “without as much as they [were] used to” and the participant “hoped to be making more money you know, in order to be saving up for [their] own retirement.” Some family caregivers reported relying on other family members, especially spouses, to keep up with household expenses. One family caregiver shared that their partner had become the “primary bread winner” of their household. Several family and friend caregivers who cared for older family members noted that they were also stressed about their loved one’s finances.  

“Right now our life is pretty difficult… so much of my time is focused on attending toward my son, which I don’t mind, but due to the inflation and everything that’s going on, it makes it hard for me to pick up extra work here and there, so definitely it’s a little rough right now.”

– Black man, IL, 34, Family Caregiver

Participants in the family and friends groups who were receiving payments from Medicaid reported that the Medicaid payments were lower than their earnings from other work. Several family caregivers reported receiving payments from Medicaid, though other family caregivers reported not knowing that this was an option available to some family caregivers (Box 2). One caregiver explained that she knew that her dad qualified for a part-time paid caregiver through Medicaid, but never looked into whether she would be able to receive payments, noting “I am curious to know…if I could since I’m already doing the work.” Those who received payments noted that while the payments were helpful, they were insufficient for the work performed and did not offset the impacts of inflation and overall costs of living. One family caregiver reported trying to find a different agency to work with since different agencies pay different rates.

“Because it’s a family member that I take care for a certain amount of hours, I do get paid…it definitely helps, especially with the inflation of the food prices and the gas…[but] it’s not minimum wage.”

– Black woman, NY, 40, Family Caregiver

Box 2: How do Medicaid payments to family caregivers work?

The availability of payments for and support of family caregivers increased during the public health emergency, and nearly all states still allow payments to family caregivers for at least one of their HCBS programs. Different states and HCBS programs have varying processes for getting payments to caregivers, which may be difficult for family caregivers to navigate. Caregivers may have to meet specific state requirements or become certified Medicaid providers in the state to receive payments. Family caregivers can be paid an hourly wage or a stipend through a structured family caregiving option. States are more likely to allow family caregivers to be paid if they are not legally responsible for the person receiving care and if the person receiving care is enrolled in an HCBS waiver. Payments to family caregivers are most common for people with intellectual or developmental disabilities and people who are ages 65 and older or with physical disabilities.

Focus group participants had views about policy changes that could better support caregivers.

“I would like policymakers to know that my job is important, because who would take care of elderly patients who would care for them, not to abuse them? So, you know, put plans in place to assist us, to help us, so we can be great at our jobs.”

– Black woman, NY, 51, Direct Care Worker

Nearly all caregivers highlighted the importance of increased wages to support access to high-quality paid care, and the types of policies that would make wage increases possible, which include more funding for Medicaid HCBS. There was no consensus on an ideal level of compensation for caregivers, but all focus groups discussed the need for more Medicaid funding to address the insufficient payment rates. Paid caregivers and family caregivers alike believed that Medicaid should be paying more for paid caregivers. A paid caregiver explained that higher wages would mean that “[he] wouldn’t have to work another job, and [he] would actually be able to have a better balance with my personal life and [his] job.” A family caregiver noted specifically that paid caregivers needed to be paid more, saying “our loved ones need to be taken care of as well and these people, they pay them nothing. So that reflects in the care that…[our] loved ones get.”

Most caregivers thought that higher wages would require additional Medicaid funding, but some caregivers reported that they felt a higher share of Medicaid spending could go to wages for direct care workers. A recently finalized rule under the Biden-Harris Administration aims to address the latter issue: Starting in 2028, states will be required to ensure that at least 80% of Medicaid payments for personal care, homemaker, habilitation, and home health aide services go to compensation for direct care workers.

“One of the things I noticed in my agency is that we’re top heavy in terms of managers. We’ve got a lot of managers that have a lot of credentials and they’re making much, much higher salaries than the people who are in direct service roles. I think there should be more equity, where the people who are doing the hands-on work should be getting higher wages. I think that some of the higher-level ones maybe are overpaid.”

– White man, MA, 61, Direct Care Worker

Paid caregivers expressed that in addition to higher wages, they wanted better benefits, training, and advancement opportunities. Paid time off was one of the more frequently requested benefits. One paid caregiver previously had PTO but lost it after switching agencies. Participants expressed that PTO “was a big help for [them], just to be able to take a break because [providing] healthcare is taxing on your body.” A few paid caregivers believed health insurance was an important benefit as well, especially due to the physical demands of their job. One paid caregiver who was uninsured was concerned that the physical demands of their work would eventually “take a toll” on them. Caregivers also explained that they felt stuck at the level of work they were doing and expressed interest in career advancement opportunities. One paid caregiver said their employer provided fair wages, but no training or advancement for full-time employees.

“Being able to take a leave of absence, just to take a little break would be wonderful. Just because it is mentally draining, physically draining. Because you’re dealing with a lot…I would like something that will give you a break, not a vacation…[Being able] to take a leave of absence just for a few weeks just to reset, that would be ideal for me and paid.”

– Biracial woman, CA, 42, Direct Care Worker

Paid and unpaid caregivers alike reported wanting more supports for the mental and emotional demands of caregiving. One paid caregiver said they would be interested in a support group explaining that the work would “catch up to them” as they continued in the profession. Several caregivers said they wanted emotional support to better manage the stress of caregiving. One family caregiver said, “the support network isn’t there in terms of even having a space [to] discuss it with other carers…there’s just nothing really there for us to mentally unpack everything that we have to deal with.” Overwhelmingly, caregivers wanted policy makers to know that the caregiving work they do is important and that they deserve fair pay and fair treatment.

Beyond mental and emotional supports, family caregivers voice support for policies that would provide them with more opportunities for training, respite care, and reimbursement for their time, particularly when caregiving responsibilities rendered them unable to work. Family caregivers noted that they rarely received specific training on how to care for their loved ones. They described relying heavily on external research from sources such as Facebook or Google to provide them with specific instructions on how to care for their loved ones. One family caregiver mentioned that training on time management might help them better manage the demanding schedule of their caregiving duties. Some family caregivers also expressed interest in respite care to provide them with a break and alleviate the stresses of constant caregiving. Some family caregivers described ways in which financial reimbursement could be helpful, particularly for people who had to reduce their working hours because of caregiving. One caregiver explained that they were not aware that they could potentially be paid for their role as a caregiver and noted that increasing awareness of those opportunities is important. A different caregiver noted that tax exemptions or deductions tax exemptions or deductions could be one path to compensating family caregivers who were not paid by Medicaid.

“I also think that we need to be paid more. And it needs to be easier for family members to be able to get paid…because I think family members overall are able to provide better quality care. There are some people that are not comfortable with people who aren’t family members coming in and being able to give family members more options to make enough to make the caregiving more of a focus, would probably be beneficial.”

– White woman, PA, 28, Family Caregiver

Appendix

Characteristics of Focus Group Participants

Ten Things to Watch for 2025 ACA Open Enrollment

Published: Oct 30, 2024

On the heels of three straight years of record high enrollment, the 12th annual Affordable Care Act (ACA) Marketplace open enrollment season will be another opportunity for more people to gain coverage. It is also an opportunity for people already enrolled to make changes to their health plan. Here are ten things to know about the 2025 open enrollment period.

The Number of ACA Marketplace Enrollees Receiving Premium Tax Credits in 2024 Has Nearly Doubled Since 2020
  1. Unsubsidized premiums are increasing modestly, but most enrollees won’t pay that. Premiums for benchmark silver plans, which are the basis for subsidy calculations, are increasing by 4% on average, while lowest-cost bronze premiums are up by 5%. Premium increases are steepest in Vermont, Alaska, and North Dakota, where unsubsidized monthly costs are growing by 10% or more. Meanwhile, low-cost plan premiums are falling in 9 states, including by double digits in Louisiana. (State-level data are here.) A Peterson-KFF Health System Tracker analysis found that rising hospital costs and increased use of GLP-1 drugs are among factors contributing to higher premiums. On average nationally, a 40-year-old’s benchmark silver premium would be $497 per month without a subsidy. However, the vast majority (92%) of Marketplace shoppers receive a subsidy, and with enhanced subsidies most of them can find a plan with a premium of less than $10 per month. Because these subsidies cap monthly payments at a share of an enrollee’s income, the vast majority of Marketplace enrollees will not have to pay a premium increase.
  2. This could be the last year of enhanced subsidies. Enhanced subsidies under the Inflation Reduction Act (IRA) are set to expire at the end of 2025. Initially introduced in the American Rescue Plan Act, these subsidies increased premium support for existing enrollees and expanded eligibility to those earning above 400% of the poverty level. These subsidies, which have driven the record-high enrollment in Marketplaces, will remain in place for the duration of 2025, but would require an act of Congress to extend them in 2026 or beyond. If these enhanced subsidies expire, the original ACA subsidies will remain in place but premium payments (net of subsidies) are expected to double or more in a number of states in 2026.
  3. Marketplace shoppers will have more choice of insurers. On average, across states, 9.6 insurers are participating on the ACA Marketplaces, which is higher than in any prior year (state data are here). In 2025, 97% of Healthcare.gov enrollees will have 3 or more ACA insurers, up from 78% of enrollees in 2021. Several insurers are entering into new states in 2025. For example, UnitedHealth Group is expanding into 4 new states and 119 additional counties in 13 of the 26 states where they already participate. Centene (Ambetter) also announced it is expanding into 60 new counties across 10 states. With ACA Marketplace signups reaching record highs and strong financial performance for participating insurers, the ACA Marketplaces have become a more appealing market than they had been in 2018, when insurer participation was at a low point.
  4. Open enrollment is from November 1, 2024 to January 15, 2025 in most states. In accordance with new federal rules encouraging states to standardize their open enrollment periods, the 2025 open enrollment period will now begin on November 1, 2024 in all states except Idaho, where open enrollment began October 15. Open enrollment will end on January 15, 2025 in most states, except Idaho (December 16, 2024), Massachusetts (January 23), California, New Jersey, New York, Rhode Island, and DC (all January 31).
  5. New states are transitioning to a State Based Marketplace. Georgia will be transitioning to a State Based Marketplace for the 2025 plan year. This will bring the total number of state-based marketplaces to 20. Illinois is scheduled to transition into a state-based marketplace for the 2026 plan year and will stop using the federal platform in November 2025. For now, Illinois residents should continue to use Healthcare.gov.
  6. The federal government is taking new actions to combat fraud. The federal government has received numerous complaints from consumers who have been the victims of fraud, where insurance brokers have signed them or switched their plans without their consent. The federal government has taken enforcement actions to combat this fraud (including suspending certain brokers) and has applied Healthcare.gov standards on web brokers and direct enrollment entities to State-Based Marketplaces.
  7. Changes to short-term plans are taking effect. The Biden Administration is reversing the Trump Administration’s expansion of short-term health insurance plans that are not ACA-compliant and can discriminate against people with pre-existing conditions. The new rules require that short-term plans be limited to 4 months total, and must now come with a consumer notice in all online and written marketing, enrollment application and other materials stating that the coverage “is NOT comprehensive health coverage.” Short-term plans are not sold on the ACA Marketplaces, but some consumers have reported feeling misled into believing they were buying comprehensive plans. A similar disclaimer notice must be included in materials for fixed indemnity policies sold to consumers off Marketplace. These are plans that pay a specific amount if someone is sick or hospitalized. Like short-term plans, fixed indemnity plans do not have to meet most of the ACA’s consumer protections. Written and online information must now say that this fixed indemnity coverage “is NOT health insurance.” While a recent lawsuit challenges the new notice for fixed indemnity plans, as of now it is still required.
  8. Special enrollment opportunities are changing. HealthCare.gov enrollees with incomes up to 150% of poverty will continue to have a year-round special enrollment opportunity, though this is optional for state-based marketplaces. However, the “Medicaid Unwinding” special enrollment period is ending November 30, 2024. In addition, starting in 2025, all consumers who choose an ACA Marketplace plan during a special enrollment period (whether a federal or state-based marketplace) will have their coverage begin on the first day of the month following their plan selection. (In the past, in some state-based Marketplaces, if a consumer chose a health plan during a special enrollment period after the 15th of the month, coverage began on the first day of the second month.)
  9. Deferred Action for Childhood Arrivals (DACA) recipients will be allowed to sign up for subsidized coverage through the Marketplace in 2025. A new Biden-Harris administration rule finalized earlier this year expands eligibility for DACA recipients by redefining “lawfully present.” Starting November 1, 2024, DACA recipients will be allowed to sign up for coverage through the Marketplace or through the Basic Health Program. They will have access to premium tax credits and cost sharing reductions, even if their income is below 100% FPL. There will be a 60-day special enrollment period starting on November 1, 2024 that allows newly eligible DACA recipients to sign up for coverage. Consumers who enroll during November 2024 can have their new Marketplace coverage begin as early as December 1, 2024. While there is pending litigation, DACA recipients can still enroll.
  10. Network adequacy rules must be met. Starting in 2025, federal Marketplace plans will be required to meet maximum appointment wait-time standards (e.g., no more than a 10-business day wait for a behavioral health appointment, a 15-business day wait for routine primary care appointments, and 30 business days for non-urgent specialty care appointments). These plans are expected to have a “secret shopper” survey conducted starting in 2025 to test whether in-network providers are meeting these appointment wait times for new patients seeking primary and behavioral health care.

Medicaid and CHIP Eligibility Expansions and Coverage Changes for Children Since the Start of the Pandemic

Published: Oct 29, 2024

The pandemic-era continuous enrollment provision sustained Medicaid for millions of enrollees, making it easier for children to get on and stay on coverage. Between February 2020 and April 2023 with continuous enrollment in place, child enrollment in Medicaid and CHIP increased by 20%. While national child enrollment has since nearly returned to pre-pandemic levels, state child eligibility expansions may help to bolster coverage in the aftermath of the unwinding of the continuous enrollment provision.

During the pandemic, states took advantage of a range of flexibilities to facilitate access to Medicaid and CHIP coverage, such as eliminating or waiving premiums for Medicaid and CHIP. Following the end of continuous enrollment, recent federal policies have sought to extend coverage protections for children. The Consolidated Appropriations Act, 2023, required all states to implement 12-month continuous eligibility for children beginning on January 1, 2024. Expanding on that continuous eligibility policy to provide more stable coverage over a longer period of time for vulnerable populations, the Centers for Medicare and Medicaid Services (CMS) has encouraged states to seek approval to provide multi-year continuous eligibility for children through Section 1115 demonstration authority. CMS also published an Eligibility and Enrollment final rule earlier this year that eliminates lock-out periods for failure to pay premiums in CHIP and requires smoother transitions between Medicaid and separate CHIP programs, among other changes.

This policy watch identifies states that have expanded access to Medicaid and CHIP coverage for children or have adopted policies to make it easier for children to maintain coverage since the start of the pandemic. Data are from annual surveys of state Medicaid and CHIP program officials conducted by KFF and the Georgetown University Center for Children and Families.

Facilitating Medicaid/CHIP Coverage for Children

Building on the experience with continuous enrollment and other pandemic-era protections, since 2020 half of states (25) have taken steps or are planning actions to expand coverage or reduce enrollment barriers for children (Figure 1). Four states expanded coverage by increasing child income eligibility for Medicaid and CHIP and/or adopting the federal option to cover lawfully-residing immigrant children without the 5-year wait. Eighteen states have taken steps or are planning actions to reduce enrollment barriers for children, such as by pursuing multi-year continuous eligibility waivers for young children, eliminating or continuing to suspend premiums, or transitioning from a separate CHIP program to a CHIP-funded Medicaid expansion program. Three states have taken steps to both expand coverage and reduce enrollment barriers.

Half of states have taken steps since 2020 or are planning actions to expand coverage or reduce enrollment barriers for children

Expanding Coverage

Four states recently expanded coverage by increasing income eligibility levels for children in Medicaid and CHIP (Figure 2). In 2022 the Kansas legislature increased CHIP eligibility to 255% of the federal poverty level (FPL). In the past year, Arizona increased eligibility from 205% FPL to 230% FPL in its separate CHIP program, Maine raised Medicaid child eligibility from 213% FPL to 305% FPL, and North Dakota expanded Medicaid child eligibility to 205% FPL, up from 175% FPL. With these changes, Idaho is the only state with a child eligibility level below 200% FPL. Across all states, the median children’s upper eligibility level is 255% of the Federal Poverty Level (FPL) ($65,841 for a family of three in 2024). Twenty states now cover children at or above 300% FPL.

Four states have expanded Medicaid/CHIP child eligibility since 2020

Since 2020, three states have newly taken up the federal option to cover lawfully residing immigrant children without the 5-year wait. Most lawfully residing immigrants must wait five years after they obtain qualified status before they can enroll in Medicaid or CHIP. However, states have the option to waive the five-year waiting period for lawfully residing children, otherwise known as the Immigrant Children’s Health Improvement Act (ICHIA) option. Georgia, Michigan, and New Hampshire recently adopted this option, joining 34 other states and the District of Columbia that adopted prior to 2020 (Figure 3). Indiana plans to eliminate the waiting period for children and pregnant individuals in 2025.

Three states have extended Medicaid/CHIP coverage to lawfully-residing immigrant children without the five-year wait since 2020

Six states (Connecticut, Maine, New Jersey, Rhode Island, Utah, and Vermont) newly provide fully-state funded coverage to all income-eligible children regardless of immigration status since 2020. These programs extend coverage to immigrant children who are ineligible for federally funded coverage because they do not have qualified status or because they are undocumented. Connecticut only covers children under age 13 and Utah caps the number of children who can be enrolled. Six states (California, Illinois, Massachusetts, New York, Oregon, Washington) and the District of Columbia began providing comprehensive state-funded coverage for children regardless of immigration status prior to the COVID-19 public health emergency. By 2025, Colorado and Minnesota plan to offer state-funded Medicaid-like coverage to income-eligible children regardless of immigration status.

Reducing Enrollment Barriers

Thirteen states have federal approval or are in the process of developing waivers to expand upon the 12-month continuous eligibility requirement and implement multi-year continuous eligibility for young children. Continuous eligibility has been shown to reduce Medicaid disenrollment and “churn” rates (rates of individuals temporarily losing Medicaid coverage and then re-enrolling within a short period of time). When individuals churn on and off coverage, the gaps in coverage may limit access to care or lead to delays in getting needed care, which can be especially problematic for young children who receive frequent screenings and check-ups. In September 2022, CMS approved Oregon’s waiver to implement continuous eligibility for children from birth to age six as well as 24 months of continuous eligibility for nearly all enrollees ages six and older. Since then, CMS has approved multi-year continuous eligibility requests for children in Washington and New Mexico. Six states have submitted section 1115 waivers and four states are in the process of developing waivers to implement multi-year continuous eligibility for young children (Table 1).

Thirteen states have federal approval or are in the process of developing waivers to implement multi-year continuous eligibility for young children

Twelve states have eliminated Medicaid or CHIP premiums since 2020 or continue to suspend premiums, reducing financial barriers to coverage for children. While new rules related to 12-month continuous eligibility prohibit states from disenrolling children because of failure to pay premiums during the continuous eligibility period, premiums can still act as a barrier to enrollment because states can require families to pay the initial premium before they can enroll their child. During the COVID-19 public health emergency, most states that charged premiums suspended or waived them for some or all enrollees. Nine states — California, Colorado, Illinois, Maine, Maryland, Michigan, New Jersey, North Carolina, and Utah — have eliminated Medicaid and/or CHIP premiums since 2020. Utah eliminated CHIP premiums in July but increased other cost-sharing requirements at the same time (Figure 4). In three states that charged premiums prior to the pandemic (Arizona, Delaware, and Vermont), premiums remain suspended. Delaware is awaiting CMS approval to discontinue premiums entirely and Vermont has suspended premiums indefinitely. A total of 18 other states still charge premiums. Twenty states and the District of Columbia did not charge premiums or enrollment fees prior to 2020.

Nine states have eliminated Medicaid or CHIP premiums for children since 2020 and three states continue to suspend premiums

Since 2020, a total of five states (Illinois, Maine, North Carolina, Kentucky, and Wyoming) have transitioned all child enrollees from the state’s separate CHIP program to a CHIP-funded Medicaid expansion program. Rules governing administration of and eligibility processing in separate CHIP programs differ from Medicaid. Sixteen additional states choose to cover all uninsured children eligible for CHIP in Medicaid (known as M-CHIP), but states can also choose to cover uninsured children eligible for CHIP through a separate CHIP program only (2 states) or through a combination of a separate CHIP and M-CHIP (28 states) (Figure 5). Covering CHIP children in Medicaid streamlines administration and provides all children with child-focused EPSDT Medicaid benefits and other Medicaid protections, including limitations on cost-sharing, while operating a separate CHIP allows states to alter benefit packages and delivery systems and provides more flexibility to impose premiums and cost sharing. Covering CHIP children in Medicaid can also prevent children from losing coverage during necessary transitions between Medicaid and separate CHIP programs.

Since 2020, five states have transitioned all child enrollees from the state’s separate CHIP program to a CHIP-funded Medicaid expansion program

Follow the Money: How Medicaid Financing Works and What That Means for Proposals to Change it

Published: Oct 29, 2024

In a recent column, KFF President and CEO Drew Altman wrote that the program most likely to be in the crosshairs if Republicans take control this November is Medicaid because Social Security and Medicare are largely off the table, leaving Medicaid as the likely source for savings needed to pay for proposed tax cuts. Of these three programs, Medicaid and the Children’s Health Insurance Program (CHIP) is the smallest in terms of federal outlays because Medicaid is jointly financed by the federal government and the states, though it covers more people than Medicare or Social Security and still represents a substantial amount of federal spending. In an effort to reduce federal Medicaid spending, Former President Trump has previously supported policies to repeal or weaken the Affordable Care Act (ACA), as well as cap and reduce Medicaid financing. These proposals stand in sharp contrast to proposals that Vice President Harris supports to protect and strengthen Medicaid and the ACA.

Because Medicaid is administered by states within broad federal rules, Medicaid programs and spending vary across states. Total Medicaid spending depends on multiple factors, including the number and mix of enrollees, their use of health care and long-term services and supports, the prices of Medicaid services, and state policy choices about benefits, provider payment rates, and other program factors. Medicaid financing is complex. States are guaranteed federal matching dollars without a cap for qualified services provided to eligible enrollees. The match rate (the share that the federal government pays, known as the federal medical assistance percentage or “FMAP”) varies across states, some services and populations, and sometimes is adjusted during economic downturns:

  • FMAP variation across states: The match rate for most Medicaid enrollees is determined by a formula in the law that provides a match of at least 50% and provides a higher federal match rate for states with lower per capita income (up to a cap of 83%). For FY 2025, this ranged from 50% in a number of states to 76.9% in Mississippi. The territories and the District of Columbia have match rates that are set in statute.
  • FMAP variation across some services and populations: Most notably, the ACA expansion group is financed with a 90% federal match rate, so states pay 10%. The American Rescue Plan Act included an additional temporary fiscal incentive to states that newly adopt the Medicaid expansion. Family planning services are also reimbursed at a 90% match rate; Indian Health Services (IHS) provided in an IHS facility are reimbursed at 100% match rate.
  • FMAP variation during economic downturns: During economic downturns, enrollment in Medicaid grows, increasing state Medicaid costs while state tax revenues typically decline. Due to the federal match, as spending increases during economic downturns, so does federal funding. During the pandemic-induced recession and the two economic downturns prior to the pandemic, Congress enacted legislation that temporarily increased the federal match rate to provide increased support for states to help fund Medicaid and other services. During the pandemic, the enhanced match was tied to a requirement that states provide continuous enrollment for Medicaid enrollees. As a result of the enhanced match rate, state spending during the pandemic declined despite historic increases in Medicaid enrollment. This also illustrates how decreases to the federal match rate have the opposite impact and increase costs for states.

As a result of all of these factors combined, the federal government paid 71% ($573 billion) of the costs of Medicaid ($804 billion) in 2022. This share is slightly higher than historic shares due to the enhanced pandemic match rate, but there is variation across states (Figure 2). The combination of low per capita income and adopting the ACA expansion are both factors in determining the overall share of federal spending on Medicaid. While the federal share of Medicaid spending varies across states, so does the total amount of federal Medicaid dollars coming into the state. States with the largest populations (California, New York, Texas, Pennsylvania, Ohio) receive the most federal Medicaid funding.

The Share of Medicaid Spending Paid For by the Federal Government Varies by State

Prominent conservative proposals to reduce federal Medicaid spending typically feature one (or a combination) of approaches:

  • Converting Medicaid to a block grant, which would provide a fixed amount of federal funding to each state and greater flexibility over eligibility and benefits;
  • Capping federal spending on a per enrollee basis;
  • Altering the FMAP, such as by eliminating the enhanced match for the ACA expansion group, lowering the FMAP floor, or decreasing the FMAP to 50 percent for all eligibility groups, states, and services; or
  • Restricting or eliminating the use of provider taxes, which states use to fund their share of Medicaid spending, and thus reducing federal matching funds.

These approaches for restricting federal Medicaid spending would not result in lower overall costs, but instead would shift costs to states. States would have to make tough choices about whether to reduce coverage, services and provider rates in Medicaid, or whether to raise revenues or cut other state spending. Notably, over half of Medicaid spending is for enrollees who qualify on the basis of age or disability. These enrollees typically use long-term services and supports that are not covered by Medicare or private insurance and extremely expensive to obtain paying out of pocket.

The effect of various Medicaid financing changes would be uneven across states. Certain states (like those that have higher shares of federal spending, adopted expansion, have higher health care costs, populations with worse health status or higher health needs, or states that rely more heavily on intergovernmental transfers or provider taxes) could face more difficulty maintaining their programs.

Significant cuts to Medicaid could also run up against public opinion. Two-thirds of adults in the U.S. say they have had some connection to the Medicaid program and three-fourths of the public have favorable views of the program (with majorities across political parties). In addition, the majority of Medicaid enrollees and the public prefer to keep Medicaid as it is today with the federal government guaranteeing coverage for low-income people, setting standards for who states cover and what benefits people get, and matching state Medicaid spending as the number of people on the program goes up or down. How the public would ultimately view changes to Medicaid would depend on how the debate is framed and what other issues, such as tax cuts, are in play. While Medicaid has not been a prominent part of the public debate during the campaign, it is likely to remain a divisive issue, and the election could have significant consequences for financing and coverage of the program.

Overview and Implications of the ACA Marketplace Expansion to DACA Recipients

Published: Oct 29, 2024

Note: This content was updated on July 1, 2025 to reflect new regulations eliminating ACA Marketplace eligibility for DACA recipients.

On May 3, 2024, the Biden-Harris administration published new regulations extending eligibility for Affordable Care Act (ACA) Marketplace coverage to Deferred Action for Childhood Arrivals (DACA) recipients. Under these regulations, the definition of lawfully present would newly include DACA recipients for the purposes of eligibility to purchase coverage through the ACA Marketplaces and to receive premium tax credits and/or cost sharing reductions or to enroll in Basic Health Program (BHP) coverage in states with those programs. The regulation became effective November 1, 2024, allowing for enrollment during the 2025 Open Enrollment Period, which runs from November 1, 2024, to January 15, 2025. The administration estimated that 100,000 uninsured DACA recipients will receive coverage under the new rule. However, due to recent court decisions, DACA recipients in 19 states remain ineligible to enroll in ACA Marketplace coverage. On June 25, 2025, the Centers for Medicare and Medicaid Services (CMS) finalized a rule that will once again exclude DACA recipients from the definition of “lawfully present” immigrants for the purposes of health coverage, making them ineligible to purchase coverage through the ACA Marketplaces beginning 60 days after the final rule’s publication. This brief provides an overview of the DACA program, discusses its status and potential impacts of the health coverage expansion, and highlights key issues to consider.

Overview of DACA

DACA was originally established via executive action in June 2012 to protect certain undocumented immigrants who were brought to the U.S. as children from removal proceedings and receive authorization to work for renewable two-year periods. To be eligible, individuals must have arrived in the U.S. prior to turning 16 and before June 15, 2007; be under the age of 31 as of June 15, 2012 (i.e., under age 43 as of 2024); be currently enrolled in school, have completed high school or its equivalent or be a veteran; and have no lawful status as of June 15, 2012. As of June 2024, there were over 530,000 active DACA recipients residing in the U.S. (Box 1).

Box 1: Who Are DACA Recipients?

As of June 30, 2024, there were roughly 530,000 active DACA recipients in the U.S. from close to 200 different countries of birth. Over one in four (28%) active DACA recipients reside in California, with another 17% living in Texas, 5% in Illinois, 4% in New York, 4% in Florida, and the remaining 42% distributed in other states across the country. DACA recipients are young, with the majority under age 36, and over half are female.

Prior to the 2024 health coverage expansion, DACA recipients were ineligible for any federally funded health coverage. Previously, individuals with DACA status were not considered lawfully present for purposes of health coverage eligibility and remained ineligible for Medicaid, the Children’s Health Insurance Program (CHIP), and ACA Marketplace coverage despite having a deferred action status, which otherwise qualified for Marketplace coverage. These eligibility restrictions left DACA recipients with the same limited health coverage options as undocumented immigrants, who are ineligible for federally funded health coverage programs. Some states have fully state funded health coverage programs for low-income immigrants regardless of immigration status, including DACA recipients, but they vary in eligibility and scope of benefits.

While most DACA recipients are working and in good health, many face challenges accessing health coverage and care, including high uninsured rates. Based on KFF analysis of federal survey data, a majority of immigrants who are likely eligible for DACA are working and have self-reported excellent or very good health. However, data show that DACA recipients continue have high uninsured rates, reflecting their limited eligibility for coverage, as is the case for likely undocumented immigrants. Overall, half of likely undocumented immigrant adults in the U.S. lack health insurance coverage, significantly higher than their immigrant counterparts who are lawfully present (18%) or naturalized citizens (6%) (Figure 1).

Half of Likely Undocumented Immigrant Adults were Uninsured as of 2023E

ACA Marketplace Expansion to DACA Recipients

On May 3, 2024, the Biden-Harris administration published new regulations making DACA recipients newly eligible to purchase ACA Marketplace coverage with premium tax credits and cost sharing reductions beginning November 1, 2024. Under these regulations, active DACA recipients would be considered lawfully present for the purposes of health coverage eligibility and will therefore be able to enroll in health insurance plans through the ACA Marketplaces for the first time during the 2025 ACA Open Enrollment Period between November 1, 2024, and January 15, 2025. Income-eligible DACA recipients would also qualify for premium tax credits and/or cost sharing reductions and be able to enroll in BHP coverage in states that have implemented it (currently MN and OR). DACA recipients would be able to start using their new ACA coverage as early as December 1, 2024, under the Special Enrollment Period.

The administration estimated that 100,000 uninsured DACA recipients will receive health coverage under the new rule which will likely result in improved access to care and financial security for DACA recipients and their families and ultimately improve health outcomes. Data from the 2023 KFF/LA Times Survey of Immigrants show that immigrants who lack health insurance coverage face a range of barriers accessing and using health care in the U.S. Uninsured immigrant adults are about three times as likely as their counterparts with insurance coverage to report not having a usual source of care other than an emergency room (42% vs. 13%) and not having had a doctor’s visit in the past 12 months (52% vs. 18%); they also are about twice as likely to report skipping or postponing care in the past 12 months (36% vs. 19%) (Figure 2). Uninsured immigrant adults also are more likely than those with insurance coverage to report unfair treatment by a health care provider and to report challenges obtaining respectful and culturally competent health care.

Uninsured Immigrant Adults are More Likely than Those with Insurance Coverage to Report Barriers to Health Care

The Trump administration finalized new regulations that would make DACA recipients ineligible for ACA Marketplace coverage. On June 25, 2025, the Centers for Medicare and Medicaid Services (CMS) finalized a rule that will once again exclude DACA recipients from the definition of “lawfully present” immigrants for the purposes of health coverage, making them ineligible to purchase coverage through the ACA Marketplaces beginning 60 days after the final rule’s publication. Thousands of DACA recipients living and working across the U.S. could lose access to affordable health coverage options due to these new regulations.

Issues to Consider

The future of the DACA program remains uncertain due to ongoing litigation and recent court rulings. Subject to ongoing litigation and court rulings challenging the legality of the DACA program, while the Department of Homeland Security (DHS) is accepting first-time DACA requests, it is unable to process them. However, DHS is continuing to process DACA renewal requests and related requests for employment authorization while it awaits a decision by the court. President Trump tried to end DACA during his first term but was blocked by the Supreme Court in 2020. His campaign has said that he will try again to eliminate DACA protections if elected. However, in an interview, President Trump indicated that he would work on addressing the status of “Dreamers” and indicated a willingness to work with Democrats on the issue, although the details of this proposed plan remain unclear. However, in June 2025, the Centers for Medicare and Medicaid Services finalized new regulations that exclude DACA recipients from the definition of “lawfully present” immigrants for the purposes of health coverage, which would make DACA recipients across the U.S. ineligible for purchasing coverage through the ACA Marketplaces.

The number of people who are eligible for DACA has been dwindling over time and there is no pathway to citizenship for DACA recipients. Given its eligibility requirements as well as legal challenges to the program, the number of people who can receive DACA has decreased over time from a high of 700,000 in 2017 to roughly 530,000 as of 2024. The American Dream and Promise Act of 2023 would provide a pathway to lawful permanent resident status and eventually citizenship for undocumented immigrants who were brought to the U.S. as children and who meet certain requirements. However, different versions of the Act have been proposed to Congress since 2001 but have never been passed suggesting that there is no clear pathway to passage of such legislation.

The U.S. Government and Global Neglected Tropical Disease Efforts

Published: Oct 29, 2024

This fact sheet does not reflect recent changes that have been implemented by the Trump administration, including a foreign aid review and restructuring. For more information, see KFF’s Overview of President Trump’s Executive Actions on Global Health.

Key Facts

  • Neglected tropical diseases (NTDs) are a set of infectious diseases grouped together due to their often chronic, disfiguring, and stigmatizing impact; their close association with poverty; and their geographic overlap.
  • While there are numerous NTDs in the world, the World Health Organization (WHO) has highlighted over 20 that particularly impact poor, politically marginalized populations; cause significant morbidity and/or mortality; are neglected by research; and can be controlled using effective methods.
  • In recent years, the U.S. government (U.S.) has affirmed its support for global NTD goals, including eradicating, eliminating, and controlling several NTDs.
  • The U.S. has become more involved in global NTDs since launching its first NTD program in 2006 at the U.S. Agency for International Development (USAID) with a focus on five NTDs that are among the most prevalent NTDs globally but can be controlled and even eliminated with low-cost and effective interventions.
  • Total U.S. funding for NTDs increased from $15 million in FY 2006, which was the first year Congress appropriated funds for NTDs, to approximately $115 million in FY 2024.

Global Situation

NTDs have garnered greater attention from the U.S. government and other global donors over the past nearly 20 years, spurred on by growing recognition of their potential threat to the achievement of the Millennium Development Goals (MDGs) and their successor, the Sustainable Development Goals (SDGs). In addition, the development and expansion of an integrated NTD treatment approach capitalized on the availability of safe and effective treatments for the most prevalent NTDs.

Neglected Tropical Diseases (NTDs)

A group of parasitic, bacterial, and viral infectious diseases that primarily affect the most impoverished and vulnerable populations in the world and, as such, have received scant attention until the recent past.

NTDs are among the top 12 major communicable disease causes of ill health globally, behind lower respiratory infections, diarrheal diseases, tuberculosis, malaria, and HIV, among others.1  NTDs are grouped together due to their often chronic, disfiguring, and stigmatizing impact; their close association with poverty; and their geographic overlap.

Impact

NTDs have low mortality but high morbidity rates. Approximately one-fifth of the world’s population (1.6 billion people) require NTD interventions (both preventive and curative). Each year, approximately 200,000 people die as a result. Infection with a NTD may result in severe disability, disfigurement, blindness, and malnutrition, and individuals are often infected with multiple NTDs simultaneously. The health impact of NTDs negatively affects economic development, hampers educational achievement and cognitive development, and reduces agricultural productivity and food security.

NTDs span the globe; in 2021, 179 countries reported at least one case of NTDs. However, the majority of the NTD burden is concentrated in low- and middle-income countries in Africa, Asia, and Latin America. People living in areas lacking access to clean water, health services, and adequate housing and sanitation, in both rural and urban settings, are among the most impacted by NTDs. Women and children in particular are most at risk of infection, since they are more exposed to NTDs and more often face barriers to accessing treatment, particularly those living in remote areas.

Major NTDs

While there are numerous NTDs in the world, the World Health Organization (WHO) has highlighted 21 that particularly impact poor, politically marginalized populations; cause significant morbidity and/or mortality; are neglected by research; and can be controlled using effective methods.2 

Five “tool-ready” NTDs, those that can be controlled and even eliminated due to the availability of low-cost and effective interventions, are among the most prevalent NTDs (see Table 1). This subset of NTDs is increasingly the focus of donor efforts, including USAID’s NTD Program.

NTDs Targeted by USAID's NTD Program

Interventions

A number of strategies have been successful in controlling and, in some areas, even eliminating certain NTDs. Although many interventions are relatively inexpensive, challenges persist in delivering tools and services to the most at-risk populations.

The recommended strategy for NTD elimination is an integrated control approach, often targeting multiple NTDs simultaneously, through mass drug administration (MDA) and other community-level transmission control measures. MDA is the regular distribution of medicines to entire at-risk populations, regardless of infection status. The use of MDA allows programs to reach more people and improve the likelihood of suppressing transmission. Implementation of MDA is often made possible through donations from pharmaceutical companies. In addition to MDA, other measures such as promoting clean water, sanitation, and hygiene (WASH), good veterinary public health, and vector control also play critical roles in addressing the underlying causes of NTDs.

Global Goals

As NTDs began to receive greater attention and global efforts have expanded over the past nearly twenty years, major global NTD goals have been set recently through:

SDG 3: End the Epidemic of NTDs

Adopted in 2015 by all member-states of the United Nations, the Sustainable Development Goals (SDGs) included a target of ending the epidemic of NTDs by 2030 as part of SDG 3 (“ensure healthy lives and promote well-being for all at all ages”). The SDGs are the successor to the Millennium Development Goals (MDGs), which did not include a specific NTD indicator.

WHO Roadmap for NTDs 2021-2030

The Roadmap outlines targets and strategies for global NTD control, elimination, and eradication efforts from 2021 through 2030. Among its goals are the eradication (permanent reduction of a disease’s worldwide incidence to zero with no risk of reintroduction) of dracunculiasis (Guinea worm disease) and yaws and the elimination (interruption of transmission in a defined geographical area(s), marked by a reduction of incidence to zero with a minimal risk of reintroduction) of human African trypanosomiasis (gambiense), leprosy, and onchocerciasis by 2030. In addition to the Roadmap’s eradication and elimination targets, it also lays out overall targets including 90% reduction in the number of people requiring interventions for NTDs, a 75% reduction in DALYs related to NTDs, and at least 100 countries eliminating at least one NTD.

Kigali Declaration on Neglected Tropical Diseases

In 2022, the Kigali Declaration, endorsed by key public and private stakeholders, laid out global NTD goals (affirming those in the SDGs and Roadmap) and commitments. It aims to improve partner efforts to coordinate and collaborate across their respective efforts in order to help eliminate NTDs. Among its goals are the elimination of at least one NTD in 100 countries and reduction of people requiring NTD interventions by 90% by 2030. These goals are in alignment with some of the WHO Roadmap goals. The Kigali Declaration is the successor to the London Declaration on NTDs (2012-2020).

U.S. Government Efforts

Over the past nearly twenty years, U.S. attention to and funding for NTDs have increased markedly. Historically, the U.S. government’s response to NTDs was relatively limited, focusing largely on research and surveillance conducted by the National Institutes of Health (NIH), the Centers for Disease Control and Prevention (CDC), and the Department of Defense (DoD). In 2006, Congress first appropriated funds to the U.S. Agency for International Development (USAID) for integrated NTD control, after which the agency launched its NTD Program. In 2008, the U.S. announced expanded NTD efforts, building on USAID’s NTD Program. In 2012, the U.S. signed onto the London Declaration, and shortly afterward, the U.S. adopted a longer term global health goal of protecting communities from infectious diseases and highlighted the important role of NTD efforts in achieving this goal.

Organization

USAID serves as the lead implementing agency for U.S. NTD efforts. Several other agencies, including NIH, CDC, DoD, and the U.S. Food and Drug Administration (FDA), are also involved in responding to NTDs worldwide. Collectively, U.S. activities have helped reach more than 30 countries.3 

USAID

USAID’s NTD Program targets five “tool-ready” NTDs (see Table 1). Having scaled up from five countries in 2006, it now spans 26 countries, mostly in sub-Saharan Africa and Southeast Asia, and has one regional program, which reaches an additional eight countries in the Americas. Using interventions such as MDA, the U.S. supports endemic countries in scaling up and developing their capacity to manage NTD control programs. The program’s goals are to control and eliminate diseases, strengthen the NTD scientific and program evidence, support sustainable country-led programs, and expand partnerships with key stakeholders.

Other U.S. Efforts

Other agencies, including NIH, CDC, and DoD, support NTD control efforts through implementation assistance of NTD interventions, technical assistance to help develop guidelines for NTD control and improve monitoring systems, and research and development (R&D) activities focused on developing new NTD tools and encouraging the adoption of existing NTD tools. These efforts include a focus on the USAID-targeted NTDs, as well as others (such as dengue, and neglected tropical fungal diseases including mycetoma, chromoblastomycosis, and sporotrichosis, among others). In addition to these efforts, the FDA administers the congressionally-authorized Tropical Disease Priority Review Voucher Program, which provides for a voucher to a developer that is awarded at the time of approval for a product meant to prevent or treat an eligible NTD. The voucher, which can subsequently be redeemed for a priority review of an application for another product, is designed as an incentive for the private sector to invest in new NTD drug development. A number of vouchers have already been awarded by the FDA.

Multilateral and Other Efforts

U.S. NTD efforts are coordinated with a number of international partners (like WHO and private sector entities), regional strategies (like the Regional Strategic Framework for sustaining, accelerating, and innovating to end neglected tropical diseases in the South-East Asia Region, 2024-2030), and funding mechanisms (like the END Fund). For example, the pharmaceutical industry donates several NTD drugs to many of the countries that also receive USAID NTD support; USAID has estimated the value of these donations in U.S.-supported countries at approximately $29.9 billion since 2007.

Funding

Congress first appropriated funding for NTDs in FY 2006, and while total U.S. funding for NTDs has risen overall since then (from $15 million in FY 2006 to approximately $115 million in FY 2024), funding was flat at around $100 million for several years (see Figure for most recent funding data). The Biden Administration has requested level funding for NTDs for FY 2025. U.S. funding for NTDs is provided through the Global Health Programs account at USAID.

U.S. Funding for Global Neglected Tropical Diseases (NTDs), FY 2016 - FY 2025
  1. Based on WHO, “Global Health Estimates 2021: Global DALYs by cause, age, and sex, 2000-2021,” Global Health Estimates 2021 Summary Tables, https://www.who.int/data/gho/data/themes/mortality-and-global-health-estimates/global-health-estimates-leading-causes-of-dalys. ↩︎
  2. WHO, “Global report on neglected tropical diseases 2024,” https://www.who.int/publications/i/item/9789240091535. The list of NTDs are: Buruli ulcer; Chagas disease; dengue and chikungunya; dracunculiasis (Guinea worm disease); echinococcosis; foodborne trematode infections; human African trypanosomiasis (sleeping sickness); leishmaniasis; leprosy; lymphatic filariasis; mycetoma, chromoblastomycosis and other deep mycoses; noma, onchocerciasis (river blindness); rabies; scabies and other ectoparasites; schistosomiasis; snakebite envenoming; soil-transmitted helminths; taeniasis and cysticercosis; trachoma; and yaws. ↩︎
  3. Other US. efforts may reach additional countries. ↩︎

Recent Changes in Medicaid Financing in Puerto Rico and Other U.S. Territories

Published: Oct 28, 2024

The U.S territories – American Samoa, the Commonwealth of the Northern Mariana Islands (CNMI), Guam, Puerto Rico, and the U.S. Virgin Islands (USVI) – have faced an array of longstanding fiscal and health challenges that were exacerbated by somewhat recent natural disasters and the COVID-19 pandemic. Over 1.7 million people residing in the territories were enrolled in Medicaid in fiscal year (FY) 2023. Medicaid financing in the territories differs from the states due to a statutorily set Federal Medical Assistance Percentage (FMAP) and an annual ceiling in federal funding that has historically resulted in lower levels of funding and often health care coverage and access.

Over time, Congress has provided temporary supplemental federal funding and increases to the FMAP rate in response to emergencies beyond the Medicaid allotments set in statute. Most recently, the Families First Coronavirus Response Act (FFCRA) significantly increased allotments for the territories and the 2023 Consolidated Appropriations Act (CAA) included a permanent statutory increase to 83% (from 55%) for most of the territories’ Medicaid allotments and FMAP rates, except Puerto Rico. In Puerto Rico, the allotments are set in statute through FY 2027, and the FMAP was increased to 76% and set to expire after FY 2027 and return to 55% without legislative action.

While neither candidate has announced detailed policy proposals in the campaign, the outcome of the 2024 election could have implications for the American territories. In a recently released policy fact sheet, Vice President Harris highlights several initiatives to support Puerto Rico, including calling for Congress “to pursue parity and equal access to key federal programs that support health care, nutrition, and other critical needs for low-income families, seniors, and people with disabilities.” In addition, the Biden-Harris administration proposed eliminating Medicaid funding caps for the American territories and bringing FMAP rates in parity with the states in their FY 2025 budget. In contrast, former President Trump previously proposed reducing Medicaid funding for Puerto Rico and has supported proposals to cap and reduce Medicaid financing and the FMAP, which could impact the territories as well. This issue brief provides background on how Medicaid financing differs between U.S. territories and states and the implications of these differences.

How does Medicaid in the territories differ from the states?

Unlike in the 50 states and D.C., annual federal funding for Medicaid in the U.S. territories is subject to a statutory cap and fixed matching rate. Both the capped federal allotment (known as the Section 1108(g) allotment) and the territories’ FMAP are fixed in statute. Annual federal Medicaid funding is set in statute for Puerto Rico for FY 2023 through FY 2027 and increases in the allotments are tied to the medical care component of the Consumer Price Index for All Urban Consumers (CPI-U) for the rest of the territories. This funding arrangement is unlike federal Medicaid funding for states, where federal dollars are uncapped and the FMAP is adjusted annually based on a state’s relative per capita income. In addition, the territories receive Section 1935(e) funding, also known as the Enhanced Allotment Program (EAP), which can be used to provide prescription drug coverage under Medicaid for low-income Medicare beneficiaries who would otherwise be eligible for subsidies under Medicare Part D. Most territories receive funding for Medicaid data systems, and Puerto Rico receives additional funds for physician payment rates and for program integrity through FY 2027.

Medicaid programs in the territories have programmatic differences in coverage and benefits compared to the states. Unlike the states, the territories develop their own measures rather than use federal poverty levels (FPL) to determine eligibility for Medicaid for the population. CNMI and American Samoa operate Medicaid programs under waivers so they are not subject to most program requirements, including flexibility that allows them to waive coverage of any benefits that are mandatory in the states when needed.

What are recent Medicaid financing changes for the Territories?

The 2023 CAA included a permanent statutory increase in territories’ Medicaid FMAP rate, except in Puerto Rico, where the increase will expire at the end of FY 2027. Congress has previously authorized both permanent and supplemental increases in the FMAP rate for the territories broadly and in response to specific emergency events (Table 1). Following the passage of the Affordable Care Act (ACA), the FMAP rate for territories was increased from 50% to 55% in 2011, and at the beginning of FY 2020, during the COVID-19 pandemic, the FMAP was temporarily increased to 100%. For the remainder of FY 2020 through the beginning of FY 2023, Congress increased FMAP rates from 55% to 83% for American Samoa, CNMI, Guam, and USVI and from 55% to 76% for Puerto Rico (with an additional increase of 6.2% if certain maintenance of eligibility requirements were met). With the 2023 CAA, Congress made the temporary FMAP increase to 83% permanent for American Samoa, CNMI, Guam, and the USVI, while authorizing a temporary increase to Puerto Rico’s FMAP to 76% through FY 2027. The law also provides 100% federal funding for qualifying data system improvements for American Samoa, CNMI, Guam, and USVI, up to $20 million for all four of the territories.

In addition to the change in the FMAP rates, annual federal capped funding for the territories increased substantially in FY 2020. The FFCRA increased allotments for each of the territories for FY 2020 and FY 2021 and then CMS used these levels as the new base for FY 2022 and beyond, except for Puerto Rico, where capped amounts are set in statute through FY 2027. The annual capped funding for Puerto Rico will be $3.475 billion for FY 2025, $3.645 billion for FY 2026, and $3.825 billion for FY 2027. After FY 2027, the allotments for Puerto Rico will be calculated from the much lower FY 2019 base without a legislative change.

FMAP Rates for the U.S. Territories

What are the implications of the Medicaid financing structure in the territories?

The capped federal Medicaid funding structure in the territories contributes to cost shifts to the territories and/or coverage restrictions. Once a territory exhausts its capped federal funds, the territory must use local funds to cover costs of coverage or may suspend or limit services. Historically, all of the territories have reported depleting the capped federal funds before the fourth quarter of the year. Medicaid programs in American Samoa and CNMI have recently suspended or limited a wide range of services for parts of the fiscal year due to funding constraints, despite the recent increases in allotments and FMAP rates.

In the absence of additional statutory changes, annual federal allotments for Medicaid in Puerto Rico will drop and the FMAP rate will drop to 55% in FY 2028. Under the 2023 CAA, Puerto Rico’s annual federal allotment will drop in FY 2028 because it will be re-calculated based on the annual FY 2019 cap adjusted to the medical component of the CPI-U without regard for the additional funding received between FY 2020 and FY 2027, and the FMAP will return to 55% in FY 2028. Both of these changes would result in significant reductions in federal Medicaid funding for Puerto Rico. Beyond adjustments for Puerto Rico, proposals like the Territories Health Equity Act would treat the territories like states for Medicaid funding and eliminate federal funding caps if enacted by Congress.

Limits on federal Medicaid funding contribute to increasing challenges for the territories in addressing health care needs of their residents given growing poverty, infrastructure, and environmental challenges. Studies have found that the territories rank worse than the states on health care quality measures and health outcomes. The territories also have higher rates of poverty and unemployment, and all the territories, with the exception of Puerto Rico, also have higher rates of uninsured people than the U.S. population overall (Appendix Figure 1). Limitations in federal data on the American territories, including gaps in federal statistics and Medicaid claims reporting, and limited local public health workforce capacity may reduce government capabilities to understand and address these challenges. The territories have also become increasingly susceptible to natural disasters and environmental hazards due to climate change as well as U.S. colonial and military activity, which can exacerbate population loss due to outmigration and further negatively impact island economies. Recent disaster events in Puerto Rico have also shown how they negatively impact health outcomes and the mental health of residents in the long-term.

Appendix

Select Socioeconomic Demographics of the U.S. Territories

Racial Disparities in Maternal and Infant Health: Current Status and Efforts to Address Them

Published: Oct 25, 2024

NOTE: This brief was updated on November 4, 2024 to incorporate additional information about the role of midwives in maternal and infant care.

Summary

Stark racial disparities in maternal and infant health in the U.S. have persisted for decades despite continued advancements in medical care. The disparate impact of the COVID-19 pandemic for people of color increased attention to health disparities, including the longstanding inequities in maternal and infant health. Additionally, the overturning of Roe v. Wade, increased barriers to abortion and may widen the existing disparities in maternal health. Given these factors, there recently has been increased attention to improving maternal and infant health and reducing disparities in these areas.

This brief provides an overview of racial disparities for selected measures of maternal and infant health, discusses the factors that drive these disparities, and provides an overview of recent efforts to address them. It is based on KFF analysis of publicly available data from CDC WONDER online database, the National Center for Health Statistics (NCHS) National Vital Statistics Reports, and the CDC Pregnancy Mortality Surveillance System. While this brief focuses on racial and ethnic disparities in maternal and infant health, wide disparities also exist across other dimensions, including income, education, age, and other characteristics. For example, there is significant variation in some of these measures across states and disparities between rural and urban communities. Data and research often assume cisgender identities and may not systematically account for people who are transgender and non-binary. In some cases, the data cited in this brief use cisgender labels to align with how measures have been defined in underlying data sources. Key takeaways include:

Large racial disparities in maternal and infant health outcomes persist. Pregnancy-related mortality rates among American Indian and Alaska Native (AIAN) and Black women are over three times higher than the rate for White women (63.4 and 55.9 vs. 18.1 per 100,000). Black, AIAN, and Native Hawaiian or Pacific Islander (NHPI) women also have higher shares of preterm births, low birthweight births, or births for which they received late or no prenatal care compared to White women. Infants born to Black, AIAN, and NHPI people have markedly higher mortality rates than those born to White people.

Maternal and infant health disparities reflect broader underlying social and economic inequities that are rooted in racism and discrimination. Differences in health insurance coverage and access to care play a role in driving worse maternal and infant health outcomes for people of color. However, inequities in broader social and economic factors, including income, are primary drivers for maternal and infant health disparities. Moreover, disparities in maternal and infant health persist even when controlling for certain underlying social and economic factors, such as education and income, pointing to the roles racism and discrimination play in driving disparities.

Increased attention to maternal and infant health has contributed to a rise in efforts and resources focused on improving health outcomes and reducing disparities in these areas. These include efforts to expand access to coverage and care, increase access to a broader array of services and providers that support maternal and infant health, diversify the health care workforce, and enhance data collection and reporting. However, addressing social and economic factors that contribute to poorer health outcomes and disparities will also be important. Moreover, the persistence of disparities in maternal health across income and education levels, points to the importance of addressing the roles of racism and discrimination as part of efforts to improve health and advance equity.

Moving forward, legislative and policy efforts and the outcome of the 2024 presidential election could all have important implications for efforts to address racial disparities in maternal and infant health. For example, state variation in access to abortion in the wake of the overturning of Roe v. Wade may exacerbate existing racial disparities in maternal health. Further, differences in records and proposed approaches by Vice President Harris and former President Trump on abortion, reproductive health, and maternal health will likely have different implications for disparities in maternal health going forward.

Racial Disparities in Maternal and Infant Health

In 2020, approximately 900 women died in the U.S. from causes related to or worsened by pregnancy. Pregnancy-related deaths are deaths that occur within one year of pregnancy. Approximately one quarter (26%) occur during pregnancy, another quarter (27%) occur during labor or within the first week postpartum, and nearly half (47%) occur one week to one year postpartum, underscoring the importance of access to health care beyond the period of pregnancy. Recent data shows that more than eight out of ten (84%) pregnancy-related deaths are preventable. Although leading causes of pregnancy-related death vary by race and ethnicity, infection (including COVID-19) and cardiovascular conditions are the leading causes of pregnancy-related death among women overall, illustrating the importance of care for chronic conditions on pregnancy-related outcomes. Additional data from detailed maternal mortality reviews in 38 states found mental health conditions to be the overall leading cause of pregnancy-related deaths.

AIAN and Black people are more than three times as likely as White people to experience a pregnancy-related death (63.4 and 55.9 vs. 18.1 per 100,000 live births) in 2020 (Figure 1). Hispanic people also have a higher rate of pregnancy-related deaths compared to White people (22.6 vs. 18.1 per 100,000). The rate for Asian people is lower compared to that of White people (14.2 vs. 18.1 per 100,000). Data from one year were insufficient to identify mortality among NHPI women. However, earlier data showed that NHPI (62.8 per 100,000) people had the highest rates of pregnancy-related mortality across racial and ethnic groups.

Pregnancy-Related Mortality per 100,000 Births by Race and Ethnicity, 2020

Research shows that these disparities increase by age and persist across education and income levels. Data show higher pregnancy-related mortality rates among Black women who completed college education than among White women with the same educational attainment and White women with less than a high school diploma. Similarly, studies find that high income Black women have the same risk of dying in the first year following childbirth as the poorest White women. Other research also shows that Black women are at significantly higher risk for severe maternal morbidity, such as preeclampsia, which is significantly more common than maternal death. Further, AIAN, Black, NHPI, Asian, and Hispanic women have higher rates of admission to the intensive care unit during delivery compared to White women, which is considered a marker for severe maternal morbidity.

Maternal death rates declined across most racial and ethnic groups between 2021 and 2022 following the large increase in maternal deaths rates due to COVID-19. Maternal mortality and pregnancy-related mortality are similar concepts but maternal mortality is a narrower measure, limited to deaths that occur while pregnant or within 42 days or pregnancy and excluding those due to accidents or acts of violence. However, more recent maternal mortality data are available allowing for examination of trends since COVID-19. Black women had the highest maternal mortality rate across racial and ethnic groups between 2018 and 2022 and also experienced the largest increase during the pandemic (Figure 2). Maternal mortality rates decreased significantly across most racial and ethnic groups between 2021 and 2022. This decline may reflect a return to pre-pandemic levels following the large increase in maternal death rates due to COVID-19 related deaths. Despite this decline, the U.S. has the highest maternal mortality rate among high-income countries and the maternal mortality rate for Black women remained over two and a half times as high as the rate for White women.

Maternal Mortality per 100,000 Births by Race and Ethnicity, 2018-2022

Birth Risks and Outcomes

Black, AIAN, and NHPI women are more likely than White women to have certain birth risk factors that contribute to infant mortality and can have long-term consequences for the physical and cognitive health of children. Preterm birth (birth before 37 weeks gestation) and low birthweight (defined as a baby born less than 5.5 pounds) are some of the leading causes for infant mortality. Receiving pregnancy-related care late in a pregnancy (defined as starting in the third trimester) or not receiving any pregnancy-related care at all can also increase the risk of pregnancy complications. Black, AIAN, and NHPI women have higher shares of preterm births, low birthweight births, or births for which they received late or no prenatal care compared to White women (Figure 3). Notably, NHPI women are four times more likely than White women to begin receiving prenatal care in the third trimester or to receive no prenatal care at all (22% vs. 5%). Black women also are nearly twice as likely compared to White women to have a birth with late or no prenatal care compared to White women (10% vs. 5%).

Birth Risks by Race and Ethnicity, 2022

While teen birth rates overall have declined over time, they are higher among Black, Hispanic, AIAN, and NHPI teens compared to their White counterparts (Figure 4). In contrast, the birth rate among Asian teens is lower than the rate for White teens. Many teen pregnancies are unplanned, and pregnant teens may be less likely to receive early and regular prenatal care. Teen pregnancy also is associated with increased risk of complications during pregnancy and delivery, including preterm birth. Teen pregnancy and childbirth can also have social and economic impacts on teen parents and their children, including disrupting educational completion for the parents and lower school achievement for the children. The drivers of teen pregnancy are multi-faceted and include poverty, history of adverse childhood events, and access to comprehensive education and health care services. Research studies have found that increased use of contraception as well as support for comprehensive sex education have helped lower the rate of teen births nationally.

Birth Rate per 1,000 for Teens Ages 15-19 by Race and Ethnicity, 2022

Reflecting these increased risk factors, infants born to AIAN, Hispanic, Black, and NHPI women are at higher risk for mortality compared to those born to White women. Infant mortality is defined as the death of an infant within the first year of life, but most cases occur within the first month after birth. The primary causes of infant mortality are birth defects, preterm birth and low birthweight, sudden infant death syndrome, injuries, and maternal pregnancy complications. Infant mortality rates have declined over time although there was a slight increase between 2021 and 2022 (5.4 vs. 5.6 per 1,000 births, respectively). However, disparities in infant mortality have persisted and sometimes widened for over a century, particularly between Black and White infants. As of 2022, infants born to Black women are over twice as likely to die relative to those born to White women (10.9 vs. 4.5 per 1,000), and the mortality rate for infants born to AIAN and NHPI women (9.1 and 8.5 per 1,000) is nearly twice as high (Figure 5). The mortality rate for infants born to Hispanic mothers is similar to the rate for those born to White women (4.9 vs. 4.5 per 1,000), while infants born to Asian women have a lower mortality rate (3.5 per 1,000). Data also show that fetal death or stillbirths—that is, pregnancy loss after 20-week gestation—are more common among NHPI, Black and AIAN women compared to White and Hispanic women. Moreover, causes of stillbirth vary by race and ethnicity, with higher rates of stillbirth attributed to diabetes and maternal complications among Black women compared to White women.

Infant Mortality per 1,000 Live Births by Race and Ethnicity, 2022

About one in five AIAN, Asian or Pacific Islander, and Black women report symptoms of perinatal depression compared to about one in ten White women (Figure 6). Hispanic women (12%) have similar rates of perinatal depression compared to their White counterparts (11%). Other research shows that the prevalence of postpartum depression has grown dramatically over the course of the past decade increasing from 9.4% in 2010 to 19.3% in 2021, driven by increases among Black and Asian and Pacific Islander women. Women of color experience increased barriers to mental health care and resources, along with racism, trauma and cultural barriers. Research suggests that perinatal mental health conditions are a leading underlying cause of pregnancy-related deaths and that individuals with perinatal depression are also at increased risk of chronic health complications such as hypertension and diabetes. Infants of mothers with depression are more likely to be hospitalized and die within the first year of life.

Prevalence of Self-Reported Postpartum Depressive Symptoms Among Women With a Recent Live Birth by Race And Ethnicity, 2018

Factors Driving Disparities in Maternal and Infant Health

The factors driving disparities in maternal and infant health are complex and multifactorial. They include differences in health insurance coverage and access to care. However, broader social and economic factors and structural and systemic racism and discrimination also play a major role (Figure 7). In maternal and infant health specifically, the intersection of race, gender, poverty, and other social factors shapes individuals’ experiences and outcomes. Recently there has been broader recognition of the principles of reproductive justice, which emphasize the role that the social determinants of health and other factors play in reproductive health for communities of color. Notably, Hispanic women and infants fare similarly to their White counterparts on many measures of maternal and infant health despite experiencing increased access barriers and social and economic challenges typically associated with poorer health outcomes. Research suggests that this finding, sometimes referred to as the Hispanic or Latino health paradox, in part, stems from variation in outcomes among subgroups of Hispanic people by origin, nativity, and race, with better outcomes for some groups, particularly recent immigrants to the U.S. However, the findings still are not fully understood.

Disparities in maternal and infant health, in part, reflect increased barriers to care for people of color. Research shows that coverage before, during, and after pregnancy facilitates access to care that supports healthy pregnancies, as well as positive maternal and infant outcomes after childbirth. Overall, people of color are more likely to be uninsured and face other barriers to care. Medicaid helps to fill these coverage gaps during pregnancy and for children, covering more than two-thirds of births to women who are Black or AIAN. However, AIAN, Hispanic, and Black people are at increased risk of being uninsured prior to their pregnancy, which can affect access to care before pregnancy and timely entry to prenatal care. Beyond health coverage, people of color face other increased barriers to care, including limited access to providers and hospitals and lack of access to culturally and linguistically appropriate care. Several areas of the country, particularly in the South have gaps in obstetrics providers. AIAN women also are more likely to live in communities with lower access to obstetric care. These challenges may be particularly pronounced in rural and medically underserved areas. For example, research suggests that  closures of hospitals and obstetric units in rural areas has a disproportionate negative impact on Black infant health.

Research also highlights the role racism and discrimination play in driving racial disparities in maternal and infant health. Research has documented that social and economic factors, racism, and chronic stress contribute to poor maternal and infant health outcomes, including higher rates of perinatal depression and preterm birth among Black women and higher rates of mortality among Black infants. In recent years, research and news reports have raised attention to the effects of provider discrimination during pregnancy and delivery. News reporting and maternal mortality case reviews have called attention to a number of maternal and infant deaths and near misses among women of color where providers did not or were slow to listen to patients. A recent report determined that discrimination, defined as treating someone differently based on the class, group, or category they belong to due to biases, stereotypes, and prejudices, contributed to 30% of pregnancy-related deaths in 2020. In one study, Black and Hispanic women reported the highest rates of mistreatment (such as shouting and scolding, ignoring or refusing requests for help during the course of their pregnancy). Even controlling for insurance status, income, age, and severity of conditions, people of color are less likely to receive routine medical procedures and experience a lower quality of care. A 2023 KFF survey found that about one in five (21%) Black women say they have been treated unfairly by a health care provider or staff because of their racial or ethnic background. A similar share (22%) of Black women who have been pregnant or gave birth in the past ten years say they were refused pain medication they thought they needed.

Efforts to Address Maternal and Infant Health Disparities

Increased awareness and attention to maternal and infant health have contributed to a rise in efforts and resources focused on improving health outcomes and reducing disparities. These include efforts to expand access to coverage and care, increase access to a broader array of services and providers that support maternal and infant health, diversify the health care workforce, and enhance data collection and reporting.

Since the launch of the White House Blueprint for Addressing the Maternal Health Crisis in 2022, there has been a variety of actions and investments across federal agencies to improve maternal health. The Biden-Harris Administration’s Blueprint focuses on increasing coverage for perinatal services, improving data collection and analysis, expanding the maternity workforce, strengthening social supports, and improving patient-provider relations. Federal initiatives have included a pilot project with distribution of newborn supply kits, a $27.5 million program for specialized maternity care training to over 2,000 OB/GYNs, nurses, and other providers. In March 2024, the Biden Administration issued a new Executive Order to advance women’s health research and innovation, including support to fund research to identify warning signs of maternal morbidity and mortality among Special Supplemental Nutrition Program for Women, Infants, and Children (WIC) recipients. The Office of Intergovernmental and External Affairs (IEA) and the March of Dimes have created a public-private partnership, Maternal Health Collaborative to Advance Racial Equity, to improve maternal health outcomes among Black mothers.  Additionally, the Biden-Harris Administration recently launched the Expanding Access to Women’s Health grant program, which will provide funding to 14 states and the District of Columbia to address disparities in maternal health outcomes with an emphasis on improving access to reproductive and maternal health coverage and services.

Nearly all states have expanded access to Medicaid coverage during the postpartum period, helping to stabilize coverage. Medicaid covers four in ten births nationally. However, historically, many pregnant women lost coverage at the end of a 60-day postpartum coverage period because eligibility levels are lower for parents than pregnant women in many states, particularly those that have not implemented the ACA Medicaid expansion. The American Rescue Plan Act (ARPA) of 2021 initially provided states a new option to extend postpartum coverage to a full year beginning April 1, 2022. As of August 1, 2024, 47 states, including DC, had implemented a 12-month postpartum coverage extension, with additional states planning to implement the extension. KFF analysis suggests that the coverage extension could prevent hundreds of thousands of enrollees from losing coverage in the months after delivery. Additional actions to expand coverage may also help to reduce disparities, including adoption of the ACA Medicaid expansion in the ten remaining states that have not yet expanded, as nearly six in ten adults in the coverage gap in these states are adults of color, and Medicaid expansion promotes continuity of coverage in the prenatal and postpartum periods.

In addition, many state Medicaid programs have implemented policies, programs, and initiatives to improve maternity care and outcomes. This includes outreach and education to enrollees and providers about maternal health issues; expanding coverage for benefits such as doula care, home visits, and substance use disorder and mental health treatment; and using new payment, delivery, and performance measurement approaches. For example, Ohio’s Comprehensive Maternal Care program aims to develop community connections and culturally aligned supports for women with Medicaid as they and their families navigate pre- and post-natal care. Participating obstetrical practices are required to measure and engage with patients and families to hear firsthand accounts of how access to care, cultural competence, and communication methods affect patient outcomes. Some states also are leveraging managed care contracts to require Medicaid plans to develop an explicit focus on reducing disparities related to maternal and child health .

Implementation of evidence-based best practices may help to improve maternal and infant health outcomes. As part of its maternity care action plan, CMS has launched a “Birthing-Friendly” hospital designation to provide public information on hospitals that have implemented best practices in areas of health care quality, safety, and equity for pregnant and postpartum patients. Currently, more than 2,200 hospitals nationwide have received the “Birthing Friendly” designation, however, some argue that additional quality metrics and efforts are needed to improve the impact and utility of this designation. CMS is also proposing new baseline health and safety requirements for hospitals, including topics related to delivery of care in obstetric units, staffing, and annual training on evidence-based maternal health practice and cultural competencies. Moreover, in 2024, CMS has launched a new effort within its maternal and infant health initiative to focus on maternal mental health, substance use, and hypertension management.

Some states include a focus on equity as part of their Maternal Mortality Review Committee (MMRC). Nearly all states have an MMRC that reviews pregnancy associated deaths and offers recommendations to prevent future deaths. However, state MMRCs vary in how they examine racial disparities, with some specifying identifying and addressing disparities as a key focus. Beginning in 2020, discrimination was added to the list of circumstances surrounding a pregnancy-related death that can be reported by MMRCs. For example, in California, each death is examined through a health equity lens and considerations include how social determinants of health, discrimination, and racism may have contributed to the death. Similarly, Vermont amended the charge of its committee in 2020 to include considerations of disparities and social determinants of health, including race and ethnicity in perinatal death reviews. States also vary in the membership of their committees, with some having requirements related to Tribes and doulas or midwives. Washington, Montana and Arizona are examples of states that have a Native or Tribal Government representative, while Oregon and Louisiana have doula representation, and Vermont and Pennsylvania have midwife representation on their MMRCs.

A variety of efforts are underway to increase workforce diversity and expand access to doula services to improve maternal and infant health outcomes and reduce disparities. Studies have shown that a more diverse healthcare workforce and the use of midwives and doulas may improve birth outcomes. Midwives are an important component of the health care workforce, attending approximately one in ten births in 2021. Midwife-attended births are associated with fewer medical interventions, and there are efforts to grow and diversify the midwifery workforce to help improve maternal health outcomes and reduce mortality and morbidity.

The percent of maternal health physicians and registered nurses that are Hispanic or Black is lower than their share of the female population of childbearing age. The Biden Administration’s Blueprint includes efforts by HRSA to provide scholarships to students from underrepresented communities in health professions and nursing schools to grow and diversify the maternal care workforce.

Expanding access to doula services is another approach to increase diversity and expand the maternal health workforce. Doulas are trained non-clinicians who assist a pregnant person before, during and/or after childbirth by providing physical assistance, labor coaching, emotional support, and postpartum care. People who receive doula support have been found to have shorter labors and lower C-section rates, fewer birth complications, are more likely to initiate breastfeeding, and their infants are less likely to have low birth weights. The HHS FY2025 budget directs $5 million towards growing and diversifying the doula workforce and $5 million towards addressing emerging issues and social determinants of maternal health. Additionally, in recent years, there has been growing interest in expanding coverage of doula services through Medicaid. The MOMNIBUS is federal legislation that has been introduced to address maternal health disparities, and proposes to expand access to coverage of midwife and doula services. Some states are taking steps to include coverage through their state programs. As of early February 2024, 12 states reimburse services provided by doulas under Medicaid (CA, DC, FL, MD, MI, MN, NV, NJ, OK, OR, RI, VA), with two states, Louisiana and Rhode Island, also implementing private coverage of doula services. Some states also are seeking to increase access to these providers by providing patient education about these services, supporting training and credentialing of these providers, and raising reimbursement rates.

Some states are seeking to improve access to culturally responsive maternal and childcare through community engagement and collaboration with community stakeholders. For example, as part of its Birth Equity Project, Washington held listening sessions with Black, immigrant, and Indigenous families and birth workers to understand the challenges to birth equity in the state. In 2021 and 2022, Utah conducted the Embrace Project Study to reduce disparities among NHPI women by providing culturally responsive health services, with a focus on mental health and self-care practices rooted in ancestral NHPI cultural traditions. California has a Black Infant Health Program that includes empowerment-focused group support services and client-centered life planning to improve the health and social conditions for Black women and their families. Arizona hosts a maternal and infant mortality summit which brings together stakeholders to discuss how to improve equity and a Tribal maternal task force that develops a Tribal maternal health strategic plan and provides training about maternal health and family wellness from an Indigenous perspective.

A range of organizations are advocating for more interventions and support to address maternal mental health and substance use issues, major causes of pregnancy-related mortality and morbidity. Some studies have found higher rates of postpartum depression among some pregnant and postpartum women of color, but many mental health conditions are undiagnosed and untreated due to stigma and poor access to treatment. These issues also limit access to services for pregnant and postpartum people with substance use disorders. Additionally, some states have laws that take a punitive approach toward substance use during pregnancy, which may discourage some, particularly people of color, from seeking care. Community-based and provider organizations are calling for a number of policy and structural changes to address these challenges, including broader insurance coverage for behavioral health care, higher reimbursement for existing treatment services, greater education and awareness about screening for mental health and substance use conditions among health care providers and childbearing people. Federal initiatives in this area include the launch of the National Maternal Mental Health Hotline by HRSA to provide support, resources and referrals to new mothers and their families.

Looking Ahead

Improving maternal and infant health is key for preventing unnecessary illness and death and advancing overall population health. Healthy People 2030, which provides 10-year national health objectives, identifies the prevention of pregnancy complications and maternal deaths and improvement of women’s health before, during, and after pregnancy as a public health goal. Further, the National Institutes of Health (NIH) Pathways to Prevention panel recently recommended a “maternal mortality moonshot” with a goal of reducing preventable maternal mortality by 50% and eliminating racial disparities within the next 10 years.

While there are a range of efforts underway to reduce disparities in maternal and infant health, state abortion bans and restrictions may exacerbate poor maternal and infant health outcomes and access to care. Since the Dobbs ruling in June 2022, about half of states have banned abortion or restricted it to early in pregnancy. People of color are disproportionately affected by these bans and restrictions as they are at higher risk for pregnancy-related mortality and morbidity, are more likely to obtain abortions, and more likely to face structural barriers that make it more difficult to travel out of state for an abortion. There are many documented cases of people being forced to continue pregnancies that are endangering their lives because they could not obtain abortion care, and the recent deaths of two pregnant women in Georgia were attributed directly to delays in pregnancy termination. State-level bans and restrictions criminalize clinicians who provide abortion care which also has cascading effects on other aspects of maternity care, and as a result some clinicians are choosing not to practice in these states, potentially widening existing clinician shortages. Research also suggests that rates of infant mortality have increased since the Dobbs ruling.

The outcome of the presidential election also could have important implications for disparities in maternal and infant health. While both candidates have taken actions focused on improving maternal health, former President Trump and Vice President Harris have widely differing records and proposals related to health coverage and health. Vice President Harris has been an outspoken advocate for eliminating maternal health disparities and promoting access to abortion and contraception services in addition to maternity care for all. Trump expresses his support for letting states set their own abortion policy, which can limit the availability of other related services, including maternity care.

Explaining Health Care Reform: Questions About Health Insurance Subsidies

Published: Oct 25, 2024

Health insurance is expensive and can be difficult to afford for people with lower or moderate incomes. In response, the Affordable Care Act (ACA) provides sliding-scale subsidies that lower premiums and insurers offer plans with reduced out-of-pocket (OOP) costs for eligible individuals.

This brief provides an overview of the financial assistance provided under the ACA for people purchasing coverage on their own through health insurance Marketplaces (also called exchanges).

Health Insurance Marketplace Subsidies

There are two types of financial assistance available to Marketplace enrollees. The first type, called the premium tax credit, reduces enrollees’ monthly payments for insurance coverage. The second type of financial assistance, the cost sharing reduction (CSR), reduces enrollees’ deductibles and other out-of-pocket costs when they go to the doctor or have a hospital stay. To receive either type of financial assistance, qualifying individuals and families must enroll in a plan offered through a health insurance Marketplace.

Premium Tax Credit

Premium tax credits can be applied to Marketplace plans in any of four “metal” levels of coverage: bronze, silver, gold, and platinum. Bronze plans tend to have the lowest premiums but have the highest deductibles and other cost sharing, leaving the enrollee to pay more out-of-pocket when they receive covered health care services, while platinum plans have the highest premiums but very low out-of-pocket costs.

Also offered on the Marketplace are catastrophic health plans with even lower premiums and higher cost sharing compared to bronze plans. Catastrophic plans are generally only available to individuals younger than 30, and premium tax credits cannot be applied to these plans.

Who is eligible for the premium tax credit?

To receive a premium tax credit for 2025 coverage, a Marketplace enrollee must meet the following criteria:

  • Have a household income at least equal to the Federal Poverty Level (FPL), which for the 2025 benefit year will be determined based on 2024 poverty guidelines (Table 1).
  • Not have access to an employer plan (including a family member’s employer) that both meets minimum value and is considered affordable. For 2025, the threshold that determines if an employer plan is affordable is if the premium is equal to or less than 9.02 percent of one’s household income.
  • Not be eligible for coverage through Medicare, Medicaid, or the Children’s Health Insurance Program (CHIP).
  • Have U.S. citizenship or proof of legal residency. (Lawfully present immigrants whose household income is below 100 percent FPL can also be eligible for tax subsidies through the Marketplace if they meet all other eligibility requirements.)
  • If married, must file taxes jointly.

Income: For the purposes of the premium tax credit, household income is defined as the Modified Adjusted Gross Income (MAGI) of the taxpayer, spouse, and dependents who are required to file a tax return. The MAGI calculation includes income sources such as wages, salary, foreign income, interest, dividends, and Social Security.

Federal Poverty Guidelines for 2025 Coverage Year

Employer coverage: Employer coverage is considered affordable if the required premium contribution is no more than 9.02 percent of household income in 2025. The Marketplace will look at both the required employee contribution for self-only and (if applicable) for family coverage. If the required employee contribution for self-only coverage is affordable, but the required employee contribution is more than 9.02 percent of household income for family coverage, the dependents can purchase subsidized exchange coverage while the employee stays on employer coverage.

The employer’s coverage must also meet a minimum value standard that requires the plan to provide substantial coverage for physician services and for inpatient hospital care with an actuarial value of at least 60 percent (meaning the plan pays for an average of at least 60 percent of all enrollees’ combined health spending, similar to a bronze plan). The plan must also have an annual OOP limit on cost sharing of no more than $9,200 for self-only coverage and $18,400 for family coverage in 2025.

People who are offered employer-sponsored coverage that fails to meet either the affordability threshold or minimum value requirements can qualify for Marketplace subsidies if they meet the other criteria listed above.

Eligibility for Medicaid: In states that have expanded Medicaid under the ACA, adults earning up to 138 percent FPL are generally eligible for Medicaid and not for Marketplace subsidies. In states that have not adopted Medicaid expansion, adults with income as low as 100 percent FPL can qualify for Marketplace subsidies. However, those with incomes lower than 100 percent FPL are generally not eligible for tax credits or Medicaid unless they meet other state eligibility criteria. KFF estimates that 1.5 million Americans living in non-expansion states fall into this coverage gap.

Certain lawfully present immigrants are exempt from the rule restricting tax credit eligibility for adults below the poverty level. Other federal rules restrict Medicaid eligibility for lawfully present immigrants, other than pregnant women, refugees, and asylees, until they have resided in the U.S. for at least five years. Immigrants who would otherwise be eligible for Medicaid but have not yet completed their five-year waiting period may instead qualify for tax credits through the Marketplace. If an individual in this circumstance has an income below 100 percent of poverty, for the purposes of tax credit eligibility, his or her income will be treated as though it is equal to the poverty level. Exceptions are also made for Deferred Action for Childhood Arrivals (DACA) recipients, who became newly eligible for Marketplace coverage after the Biden-Harris administration passed new regulations in May 2024 expanding the definition of lawfully present to include DACA recipients. Immigrants who are not lawfully present are ineligible to enroll in health insurance through the Marketplace, receive tax credits through the Marketplaces, or enroll in non-emergency Medicaid and CHIP.

What amount of premium tax credit is available?

Required Individual Contribution to Benchmark Plan Premium for 2025 Coverage Year

The premium tax credit limits an individual’s contribution toward the premium of the “benchmark” plan, the second-lowest cost silver plan in their Marketplace. This “required individual contribution” is set on a sliding income scale. In 2025, for individuals with income up to 150 percent FPL, the required contribution is zero, while at an income of 400 percent FPL or above, the required contribution is 8.5 percent of household income (Table 2). Individuals making above 400 percent FPL whose required contribution for a benchmark silver premium is greater than the actual cost of a benchmark silver plan relative to their household income would be ineligible for subsidies.

These contribution amounts were set by the American Rescue Plan Act (ARPA) and later temporarily extended by the Inflation Reduction Act (IRA). Prior to the ARPA, the required contribution percentages ranged from about two percent of household income for people with poverty level income to nearly 10 percent of household income for people with income from 300 to 400 percent FPL. In addition, prior to the ARPA, people with incomes above 400 percent FPL were not eligible for premium tax credits.

The amount of tax credit is calculated by subtracting the individual’s required contribution from the actual cost of the “benchmark” plan. So, for example, if the benchmark plan costs $6,000 annually, the required contribution for someone with an income of 150 percent FPL ($22,590 in 2025) is zero, resulting in an annual premium tax credit of $6,000. If that same person’s income equals 250 percent FPL (or $37,650 in 2025), the individual contribution is four percent of $37,650, or $1,506 per year, resulting in an annual premium tax credit of $4,494.

The premium tax credit can then be applied toward any other plan sold through the Marketplace (except Catastrophic coverage). The amount of the tax credit remains the same, so a person who chooses to purchase a plan that is more expensive than the benchmark plan will have to pay the difference in cost. Conversely, if a person chooses a less expensive plan, such as the lowest-cost silver plan or a bronze plan, the tax credit will cover a greater share of that plan’s premium, and possibly even cover the entire cost, leaving the consumer with a zero-premium plan. When the tax credit exceeds the cost of a plan, it lowers the premium to zero and any remaining tax credit amount is unused.

For certain components of a Marketplace plan premium, the premium tax credit will not apply. First, the tax credit cannot be applied to the portion of a person’s premium attributable to covered benefits that are not essential health benefits (EHB). For example, a plan may offer adult dental benefits, which are not currently included in the definition of EHB. In that case, the person would have to pay the portion of the premium attributable to adult dental benefits without financial assistance. In addition, the ACA prohibits applying premium tax credits to the portion of premiums covering “non-Hyde” abortion benefits. Marketplace plans that cover abortion are required to charge a separate $1 monthly premium to cover the cost of this benefit; this means a consumer who is otherwise eligible for a fully subsidized, zero-premium policy would still need to pay $1 per month for a policy that covers abortion benefits. Finally, if the person smokes cigarettes and is charged a higher premium for smoking, the premium tax credit is not applied to the portion of the premium that is the tobacco surcharge.

How do people receive the premium tax credit?

To receive the premium tax credit, people must apply for coverage through the Marketplace and provide information about their age, address, household size, citizenship status, and estimated income for the coming year. After submitting the application, people will receive a determination letting them know the amount of premium tax credit for which they qualify. The consumer then has the option to have the tax credit paid in advance, claim it later when they file their tax return, or some combination of the two options.

The advanced premium tax credit (APTC) option allows consumers to have 1/12 of their tax credit paid directly to their Marketplace plan insurer each month, reducing the monthly amount the consumer owes. However, because the APTC eligibility determination is based on estimated income, the enrollee is required to reconcile their APTC at tax time the following year, once they know what their actual income was. For people receiving an advanced payment of the premium tax credit in 2025, the reconciliation would occur when they file their 2025 tax return in 2026. If the consumer overestimated their income when they applied, they can receive the unclaimed premium tax credit as a refundable tax credit when they file. If the consumer underestimated their income at the time of application and excess APTC was paid on their behalf during the year, they would have to repay some or all of the excess tax credit when they file. There are maximum repayment limits which vary depending on income, shown in Table 3.

Repayment Limits for Advanced Premium Tax Credits, 2024 Tax Year

Alternatively, people can opt to pay their entire premium costs each month and wait to receive their tax credit until they file their annual income tax return the following year, although most Marketplace participants cannot afford this option. The premium tax credit is refundable, meaning it is available to qualifying enrollees regardless of whether they otherwise owe any federal income tax. Everyone who receives an APTC in a tax year is required to file a tax return for that year in order to continue receiving financial assistance in the future. People who fail to file and reconcile for two consecutive years will be ineligible for premium tax credits the following year.

Cost Sharing Reduction

The second form of financial assistance available to Marketplace enrollees is a cost sharing reduction. Cost sharing reductions lower enrollees’ out-of-pocket cost due to deductibles, copayments, and coinsurance when they use covered health care services.

Who is eligible for the cost sharing reduction?

People eligible for premium tax credits and have household incomes between 100 to 250 percent of poverty are eligible for cost sharing reductions.

How are cost sharing reductions provided?

Unlike the premium tax credit (which can be applied toward any metal level of coverage), cost sharing reductions (CSR) are only offered through silver plans. For eligible individuals, cost sharing reductions are applied to a silver plan, essentially making deductibles and other cost sharing under that plan more similar to that under a gold or platinum plan. Individuals with income between 100 and 250 percent FPL can continue to apply their premium tax credit to any metal level plan, but they can only receive plans with reduced cost sharing if they pick a silver-level plan.

What amount of cost sharing reductions are available to people?

Cost sharing reductions are determined on a sliding scale based on income. The most generous cost sharing reductions are available for people with income between 100 and 150 percent FPL. For these enrollees, silver plans that otherwise typically have higher cost sharing are modified to be more similar to a platinum plan by substantially reducing the silver plan deductibles, copays, and other cost sharing. For example, in 2024, the average annual deductible under a silver plan was just over $5,000, while the average annual deductible under a platinum plan was $97. Silver plans with the most generous level of cost sharing reductions are sometimes called CSR 94 silver plans (with 94 percent actuarial value, which represents the average share of health spending paid by the health plan, compared to 70 percent actuarial value for a silver plan with no cost sharing reductions).

Somewhat less generous cost sharing reductions are available for people with incomes above 150 and up to 200 percent FPL. These reduce cost sharing under silver plans to 87 percent actuarial value (CSR 87 plans). In 2024, the average annual deductible under a CSR 87 silver plan was about $700.

For people with incomes above 200 and up to 250 percent FPL, cost sharing reductions are available to modestly reduce deductibles and copays to 73 percent actuarial value (sometimes called CSR 73 plans). In 2024, the average annual deductible under a CSR 73 silver plan was about $4,500.

Insurers have flexibility in how they set deductibles and copays to achieve actuarial value benchmarks set by the ACA for Marketplace plans, including CSR plans, so actual deductibles may vary from these averages.

The ACA also requires maximum annual out-of-pocket spending limits on cost sharing under Marketplace plans, with reduced limits for CSR plans. In 2025, the maximum OOP limit will be $9,200 ($18,400 family) for all QHPs with lower maximum OOP limits permitted under cost sharing reduction plans (Table 4).

Maximum Annual Limitation on Cost Sharing, 2025