Implications of Reduced Federal Medicaid Funds: How Could States Fill the Funding Gap?
Executive Summary
The Congress is currently debating the American Health Care Act (AHCA), which would not only repeal and replace the Affordable Care Act (ACA) but also make far-reaching changes to the structure and financing of Medicaid. The AHCA would use a per capita cap policy or block grants to cap federal funds to states for Medicaid. Facing reductions in federal Medicaid funding, states could offset lost federal dollars by raising taxes or reducing other state spending (like K-12 education), or states could reduce spending in Medicaid by finding savings or (more likely) by restricting eligibility, benefits, or payments to providers. However, many efficiencies were adopted by state Medicaid programs during the last two major recessions when revenues dropped and budgets were constrained leaving states with few options for easy ways to trim additional spending in the future. On March 13, 2017 the Congressional Budget Office (CBO) estimated that the AHCA would reduce federal Medicaid spending by $880 billion over the 2017-2026 period. By 2026, Medicaid spending would be about 25% less than what CBO projects under current law.
In this analysis, we examine the fiscal implications of state actions to offset the loss of federal Medicaid funding to maintain rather than cut Medicaid programs. This analysis is intended to be illustrative and not predictive of actual state outcomes. In contrast, the CBO estimate of a 25% reduction in federal Medicaid funding by 2026 reflects projections and accounts for federal changes in policy, state responses to the policy change, and reductions in coverage.
What does this analysis do? In this analysis, we present three scenarios of reductions in federal Medicaid spending and examine fiscal implications if all reductions had been in full effect in FFY 2015 (the most recent year for which Medicaid spending data is available). In these scenarios, we assume states fill the gaps caused by federal funding reductions by increasing state spending for Medicaid. To achieve those increases, we examine potential implications for state taxes and education spending by state and by groups of states including expansion status, political party, region and poverty quartile and highlight the groups that could experience the largest effects. These results are illustrative: each state would likely make different policy choices, and states could implement a combination of approaches, or choose not to completely offset the federal reduction.
What does this analysis not do? Unlike the CBO estimates, this analysis does not make projections or anticipate changes to state Medicaid programs through reducing eligibility levels, benefits, or reimbursement rates. If states do undertake these changes to their Medicaid programs, federal reductions would likely be larger. This analysis of the impact in FFY 2015 does not assume that states will drop coverage and does not account for states that may have adopted the expansion in the future.
What were the estimated reductions in federal spending in three scenarios? This analysis estimated reductions in federal Medicaid spending under three scenarios: (1) repeal of the ACA enhanced match rate for expansion adults ($27 billion), (2) repeal of the ACA plus a 10% reduction in federal Medicaid spending for the non-expansion population ($53 billion), and (3) repeal of the ACA plus a 20% reduction in federal Medicaid spending for the non-expansion population ($79 billion). All estimates assume that the full effect of the reductions are experienced in FFY 2015. Beyond the repeal of the ACA enhanced matching funds, the reductions are not based on specific policy changes but rather are based on illustrative potential federal Medicaid spending reductions. If states were to maintain Medicaid services, these reductions would require increases in state Medicaid funding to fill in the gaps in federal funding. Median state Medicaid spending per resident was $534 in FFY 2015. Under the three scenarios, the reduction in federal Medicaid funds would result in a median increase of state Medicaid spending per resident ranging from 17.2% to 40.3%.
What are the potential implications for state taxes and education? States could choose to respond in many ways. For example, they could raise taxes or reduce education spending to fill in gaps in federal funding for Medicaid. Median state tax per resident was $2,715 in 2015. If states opt to raise taxes, the median increase in state taxes per resident would range from 3.5% to 8.1% under the three scenarios; if states increased the largest state tax, the median would range from 8.4% to 18.1%. For most states (29 states), the income tax is the largest state tax followed by sales tax (15 states). Median total spending per pupil for education was $10,961 in 2015. If states opted to fill the gap by reducing state government spending for education, states could face median reductions in state funding for K-12 education per pupil of 10.9% to 24.1% and total funding for K-12 education spending per pupil of 5.5% to 13.7%.
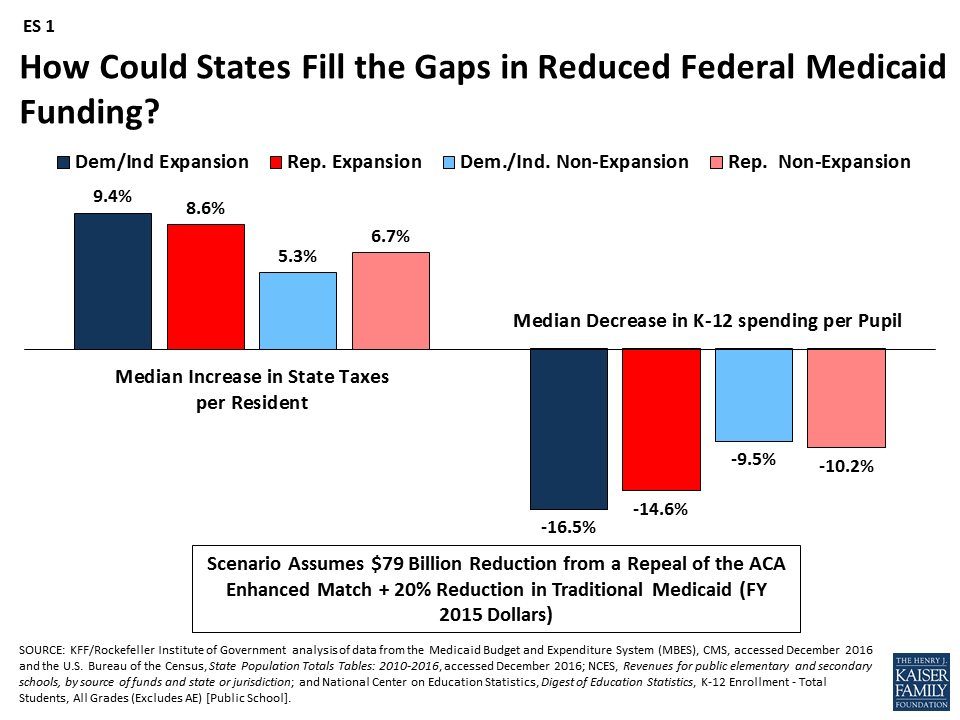
How are different groups of states affected by reductions? Due to the changes in the enhanced match rate, states that have adopted the Medicaid expansion will experience larger federal funding reductions; this outcome is true across states with Republican and Democratic governors. For example, in the scenario that would repeal the ACA enhanced match rate and reduce traditional Medicaid spending by 20%, expansion states would face higher median tax increases and larger reductions in education to fill the federal funding gaps compared to non-expansion states (ES 1). This increased budget pressure could make it difficult for states to maintain the Medicaid expansion. Funding reductions that go beyond eliminating the enhanced match for the ACA Medicaid expansion and entail cuts to the traditional Medicaid program could have a disproportionate effect on states with high poverty. Even though these poorer states spend less per resident on Medicaid, their federal reimbursement rate is relatively high, and so the impact of federal cuts is large.
Issue Brief
Introduction
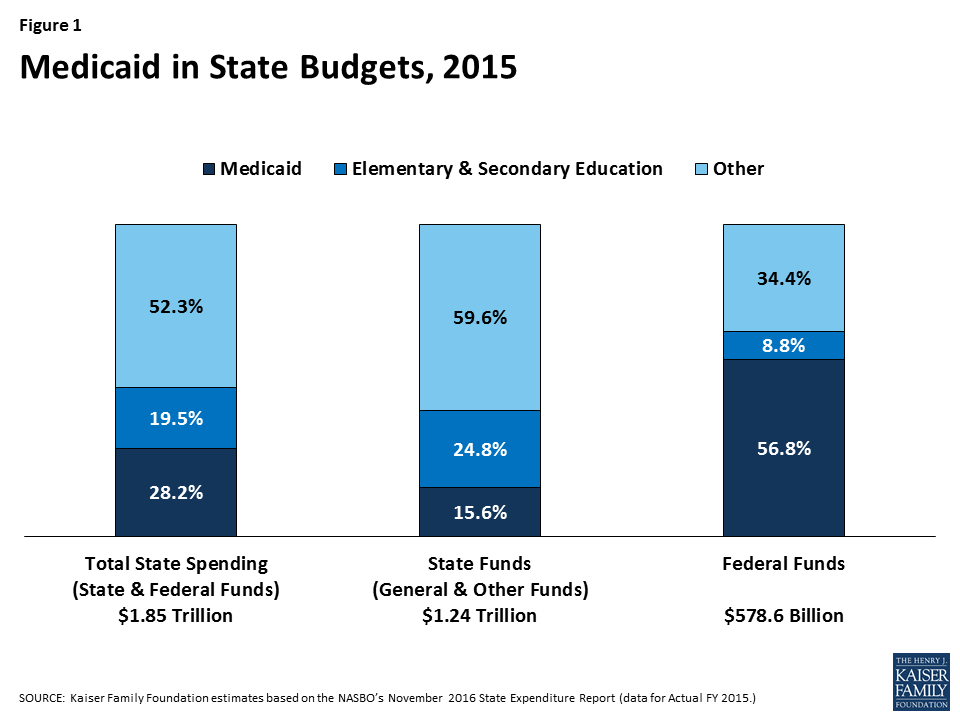
Medicaid has a unique role in state budgets. As a result of the federal matching structure, Medicaid is a spending item but also the largest source of federal revenues for state budgets. In FY 2015, Medicaid accounted for 28.2% (or $523 billion) of total state spending (including state and federal funding) for all items in the state budget, but 15.6% (or $193 billion) of all state spending (from general fund and other state funds), a far second to spending on K-12 education (24.8%, or $307 billion). Medicaid is the largest single source of federal funds for states, accounting for more than half (56.8%, or $329 billion) of all federally supported spending by states in SFY 2015, according to data from the National Association of State Budget Officers (Figure 1). Due to the federal match rate, as state Medicaid spending increases during economic downturns, so does federal funding. The match rate also gives states support and flexibility to address health care emergencies, needs and state health priorities without a pre-set limit on federal funds. States must balance their budgets annually. Since states pay for more than 40% of total Medicaid on average, states have incentives to constrain Medicaid spending by restricting provider payment rates, controlling prescription drug costs and implementing payment and delivery system reforms.
Congress is debating the AHCA, which includes reductions to federal financing combined with fundamental restructuring of Medicaid financing. On March 13, 2017 the Congressional Budget Office (CBO) estimated that the AHCA would reduce federal Medicaid spending by $880 billion over the 2017-2026 period. By 2026, Medicaid spending would be about 25% less than what CBO projects under current law. The CBO estimate reflects projections and accounts for federal changes in policy, state responses to the policy change, and reductions in coverage.
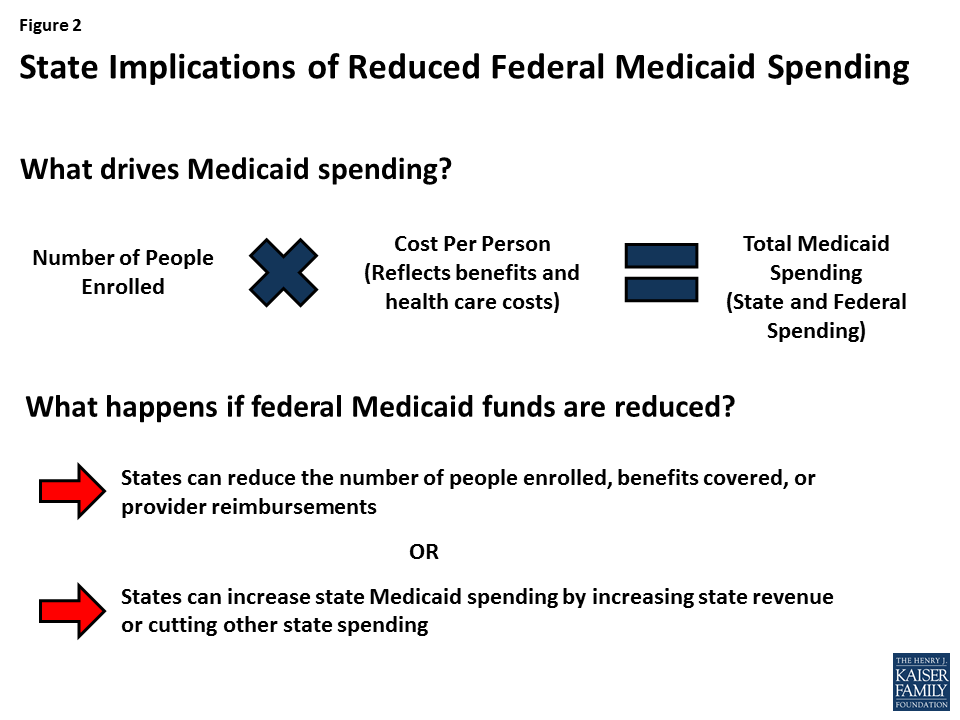
In this analysis, we present three scenarios of reductions in federal Medicaid spending and examine fiscal implications if states fill these financing gaps to maintain their programs and if all reductions are assumed to be in full effect in FFY 2015 (the most recent year for which Medicaid spending data is available). To fill these gaps in financing and maintain current Medicaid programs, we assume states will increase state spending for Medicaid by increasing state taxes or reducing education spending. This analysis is unlike the CBO estimate, which makes projections and accounts for changes in policy, state responses to make changes to Medicaid programs, and reductions in coverage (Figure 2).
Study Design
This brief explores three scenarios of federal Medicaid spending reductions and the potential fiscal implications of different state responses to offset such losses. The analysis was conducted by the Kaiser Program on Medicaid and the Uninsured and the Rockefeller Institute of Government. We assumed that policies were fully effective in FFY 2015 (the most recent year for which Medicaid spending data is available). As noted earlier, unlike the CBO estimate, this analysis does not make projections and does not assume that states make changes to Medicaid programs or reduce coverage.
Scenarios
This analysis examined three scenarios of reductions in federal Medicaid spending. The magnitude of the reductions was calculated by adjusting the match rate for the expansion population from an estimated 90% when fully implemented to a state’s traditional match rate. We used estimated spending for the expansion group for FFY 2015 (spending data for states that expanded mid-year in FFY 2015 or in FFY 2016 were adjusted to account for increases in enrollment and spending for the expansion population). Beyond the repeal of the ACA enhanced matching funds, the reductions are not based on specific policy changes but rather based on estimates of potential federal Medicaid spending reductions. The total amount of federal Medicaid reductions in each scenario is displayed in Figure 3 and described below:
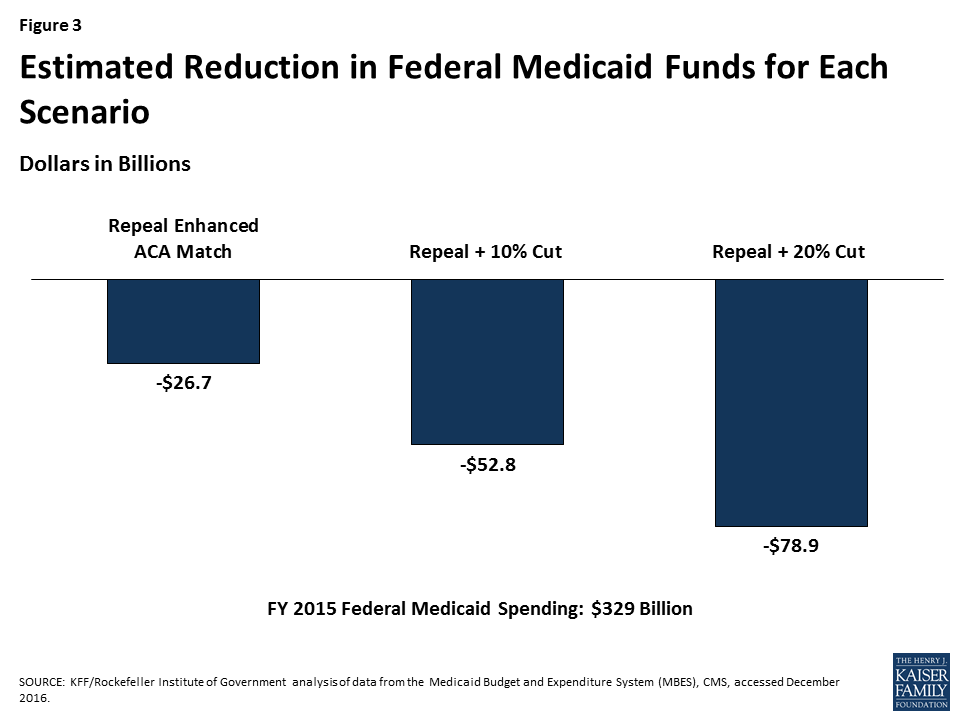
(1) Repeal ACA enhanced matching funds. Assumes states would get the traditional match rate for the expansion population and only includes states that have expanded Medicaid, since there would be no effect on states that did not expand. Total federal cut: $26.7 billion.
(2) Repeal ACA enhanced matching funds + 10% cut in Medicaid for non-expansion populations. Total federal cut: $52.8 billion.
(3) Repeal ACA enhanced matching funds + 20% cut in Medicaid for non-expansion populations. Total federal cut: $78.9 billion.
For each of these scenarios, we examined the outcomes (increased state-financed Medicaid spending per resident) and responses (increased state taxes or decreased K-12 education spending) by state and by groups of states including state expansion status, by political party of the governor (or mayor, for DC), by region and poverty rate. (See Table 1 for more information on state groupings). See Table 1 for median reductions by group and Appendix Table 2 for reductions by state in each of these scenarios. As noted above, the first scenario calculates medians across groups for only expansion states since non-expansion states are not affected.
Outcome and Potential Responses
To fill the gaps created by reductions, states would need to increase state-financed Medicaid spending per resident (outcome). To achieve those increases, states could opt to increase state taxes or reduce education spending (potential responses). These outcomes and responses are illustrative. In reality, faced with reductions in federal Medicaid funding, each state would make different policy choices and states could implement a combination of approaches, or not completely offset the federal reduction. For more details on the methods and data sources, see the Appendix.
| Table 1. Median Federal Medicaid Cuts by State Characteristics, FFY 2015 | |||
| Repeal Enhanced ACA Match | Repeal + 10% Cut | Repeal + 20% Cut | |
| All States | $26,676,000,000 | $52,805,000,000 | $78,933,000,000 |
| By Expansion Status | |||
| Expansion | $26,676,000,000 | $43,608,000,000 | $60,540,000,000 |
| Non-expansion | N/A | $9,197,000,000 | $18,393,000,000 |
| By Political Party of the Governor | |||
| Democratic | $17,994,000,000 | $29,037,000,000 | $40,081,000,000 |
| Republican | $8,589,000,000 | $23,583,000,000 | $38,576,000,000 |
| Independent | $93,000,000 | $185,000,000 | $277,000,000 |
| By Region | |||
| Northeast | $8,363,000,000 | $14,066,000,000 | $19,768,000,000 |
| South | $2,296,000,000 | $11,674,000,000 | $21,052,000,000 |
| Midwest | $4,581,000,000 | $9,920,000,000 | $15,259,000,000 |
| West | $11,436,000,000 | $17,145,000,000 | $22,854,000,000 |
| By Poverty Quartile | |||
| Low Poverty | $3,801,000,000 | $6,700,000,000 | $9,600,000,000 |
| Low-Mid Poverty | $5,642,000,000 | $10,720,000,000 | $15,798,000,000 |
| Mid-Upper Poverty | $15,012,000,000 | $28,575,000,000 | $42,139,000,000 |
| High Poverty | $2,222,000,000 | $6,809,000,000 | $11,397,000,000 |
| By Expansion Status and Political Party of the Governor | |||
| Expansion – Dem/Ind | $17,994,000,000 | $27,788,000,000 | $37,581,000,000 |
| Expansion – Rep | $8,589,000,000 | $15,636,000,000 | $22,682,000,000 |
| Non-expansion – Dem/Ind | N/A | $1,250,000,000 | $2,499,000,000 |
| Non-expansion – Rep | N/A | $7,947,000,000 | $15,894,000,000 |
| NOTE: Data are rounded to the nearest million.SOURCE: KFF/Rockefeller Institute of Government analysis of data from the Medicaid Budget and Expenditure System (MBES), CMS, accessed December 2016. | |||
Key Findings
Outcome: Implications for State-Financed Medicaid Spending Per Resident
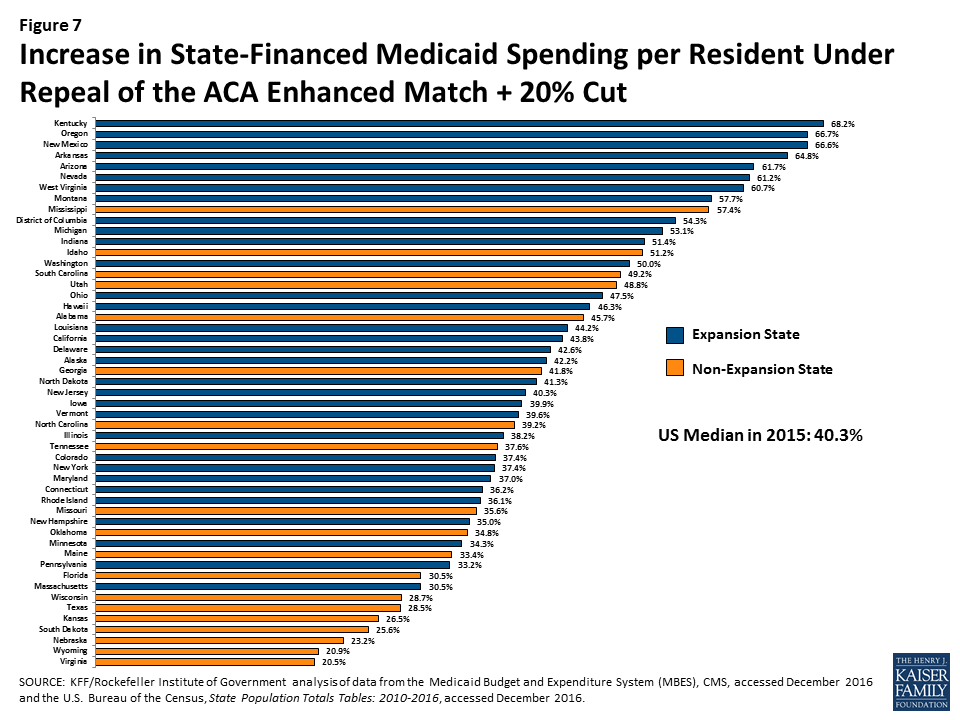
Median state-financed Medicaid spending per resident was $534 in FFY 2015. To fill gaps in federal Medicaid funding assumed in the three scenarios, states would need to increase in state-financed Medicaid spending. Median increases in state-financed spending per resident would range from 17.2% if the enhanced match were repealed up to 40.3% to offset reductions from both the repeal of the matching funds and a 20% reduction of federal funds (Figure 4). These increases for the largest reduction scenario would range from a 20.5% increase in state per resident spending in Virginia to an 68.2% increase in Kentucky.

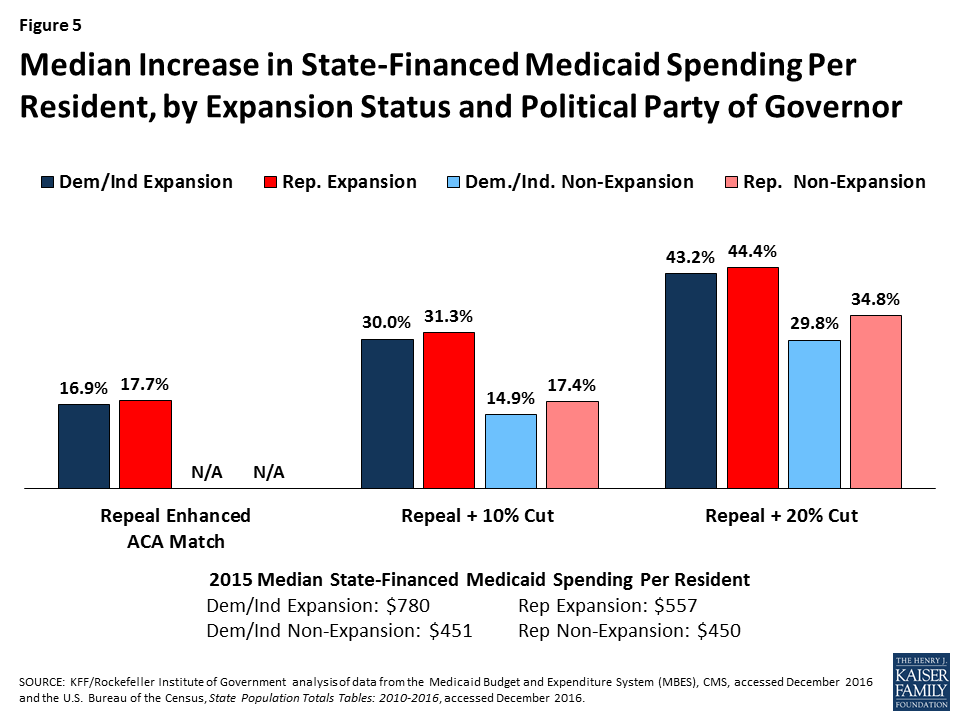
The federal cuts under all of the scenarios would result in larger state spending increases per resident in expansion states compared to non-expansion states (across states with Republican and Democratic governors). High poverty states, where median state Medicaid spending per resident is the lowest ($458) compared to low-poverty states ($655), would experience the largest percent increase, particularly under the largest reduction scenario (Figures 5 and 6).
For median results by group for each scenario, see Table 2. For state-by-state results of changes in state Medicaid spending per resident, see Figure 7 and Appendix Table 3.

| Table 2. Median Increase in State Medicaid Spending per Resident by State Characteristics, 2015 | ||||
| State Medicaid Spending Per Resident,FFY 2015 | Repeal Enhanced ACA Match | Repeal + 10% Cut | Repeal + 20% Cut | |
| Increase in State Medicaid Spending per Resident | Increase in State Medicaid Spending per Resident | Increase in State Medicaid Spending per Resident | ||
| All States | $534 | 17.2% | 27.2% | 40.3% |
| By Expansion Status | ||||
| Expansion | $571 | 17.2% | 31.3% | 43.2% |
| Non-expansion | $450 | N/A | 17.4% | 34.8% |
| By Political Party of the Governor | ||||
| Democratic | $656 | 17.1% | 28.3% | 42.6% |
| Republican | $472 | 17.7% | 25.2% | 39.9% |
| Independent | $889 | 14.2% | 28.2% | 42.2% |
| By Region | ||||
| Northeast | $917 | 15.9% | 26.3% | 36.1% |
| South | $474 | 17.4% | 24.6% | 42.6% |
| Midwest | $554 | 15.8% | 26.0% | 36.9% |
| West | $529 | 23.9% | 36.0% | 50.0% |
| By Poverty Quartile | ||||
| Low Poverty | $655 | 16.5% | 26.3% | 36.2% |
| Low-Mid Poverty | $569 | 17.9% | 27.4% | 38.2% |
| Mid-Upper Poverty | $478 | 17.1% | 27.2% | 39.2% |
| High Poverty | $458 | 18.5% | 30.4% | 55.9% |
| By Expansion Status and Political Party of the Governor | ||||
| Expansion – Dem/Ind | $780 | 16.9% | 30.0% | 43.2% |
| Expansion – Rep | $557 | 17.7% | 31.3% | 44.4% |
| Non-expansion – Dem/Ind | $451 | N/A | 14.9% | 29.8% |
| Non-expansion – Rep | $450 | N/A | 17.4% | 34.8% |
| SOURCE: KFF/Rockefeller Institute of Government analysis of data from the Medicaid Budget and Expenditure System (MBES), CMS, accessed December 2016 and the U.S. Bureau of the Census, State Population Totals Tables: 2010-2016, accessed December 2016. | ||||
Potential State Responses
Fill the Funding Gap with Increases in State Government Taxes
One potential state response to offset the loss of federal Medicaid funds is to increase state taxes. We examine the percent increase in state government taxes that would be required if states were to raise taxes to offset the entire federal Medicaid spending reduction—measured by the Medicaid cut as a percentage of state tax revenue. We also examined the percent increase that would be required in a state’s largest state-government tax, if the state raised that tax to offset Medicaid cuts—measured by the Medicaid cut as a percentage of the state’s largest tax revenue.
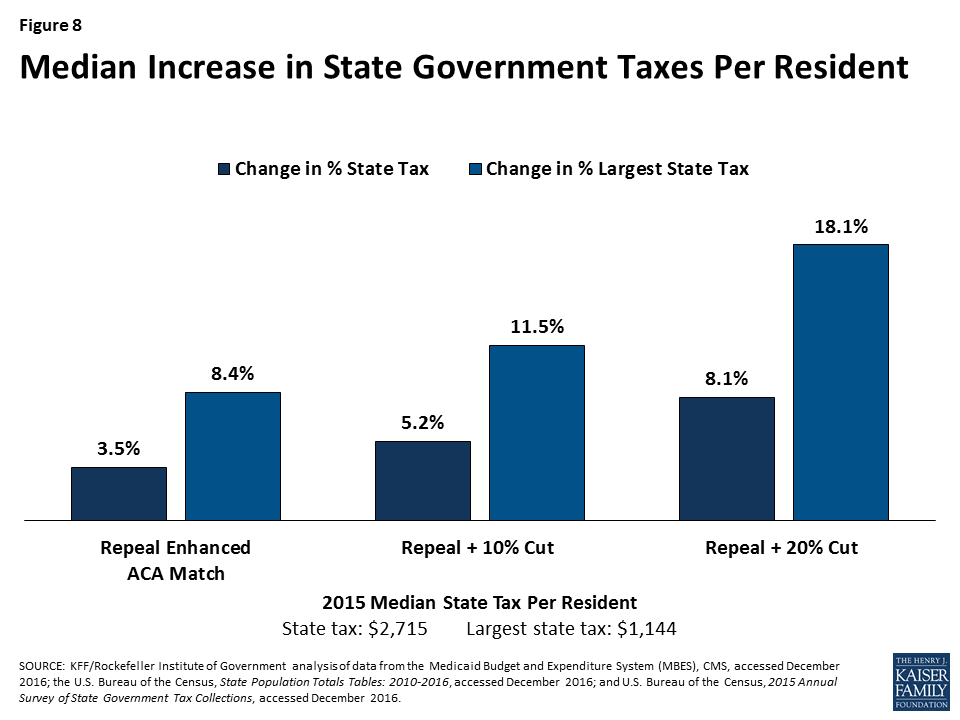
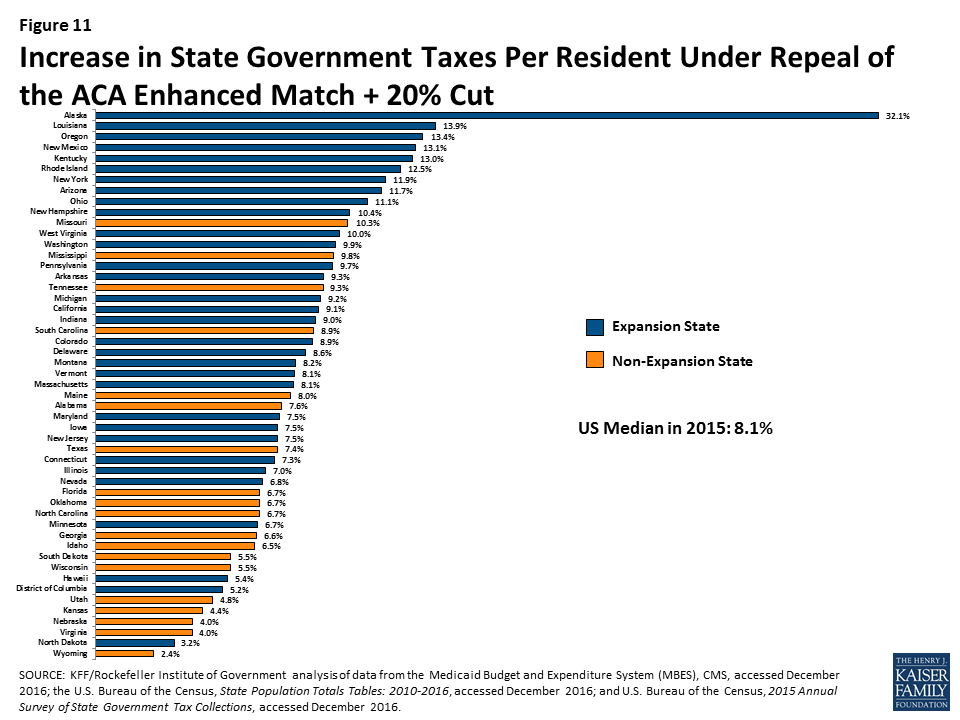
Median state tax per resident was $2,715 in 2015. The analysis shows that the median state would need to increase taxes per resident by 3.5% to 8.1% to offset reductions in federal Medicaid funding under the three scenarios, with increases ranging from 2.4% in Wyoming to 32.1% in Alaska for the largest reduction scenario (Figure 8). When only looking at the largest state tax, the median state tax per resident was $1,144 in 2015 and the median increase would be 8.4% to 18.1%. Under the largest reduction scenario, the increase in the largest state tax would range from 6.3% in Wyoming to 121.6% in Alaska. For most states, the income tax is the largest state tax (29 states), followed by sales tax (15 states), corporate taxes (AK), property taxes (DC and VT), and severance taxes (in ND and WY).
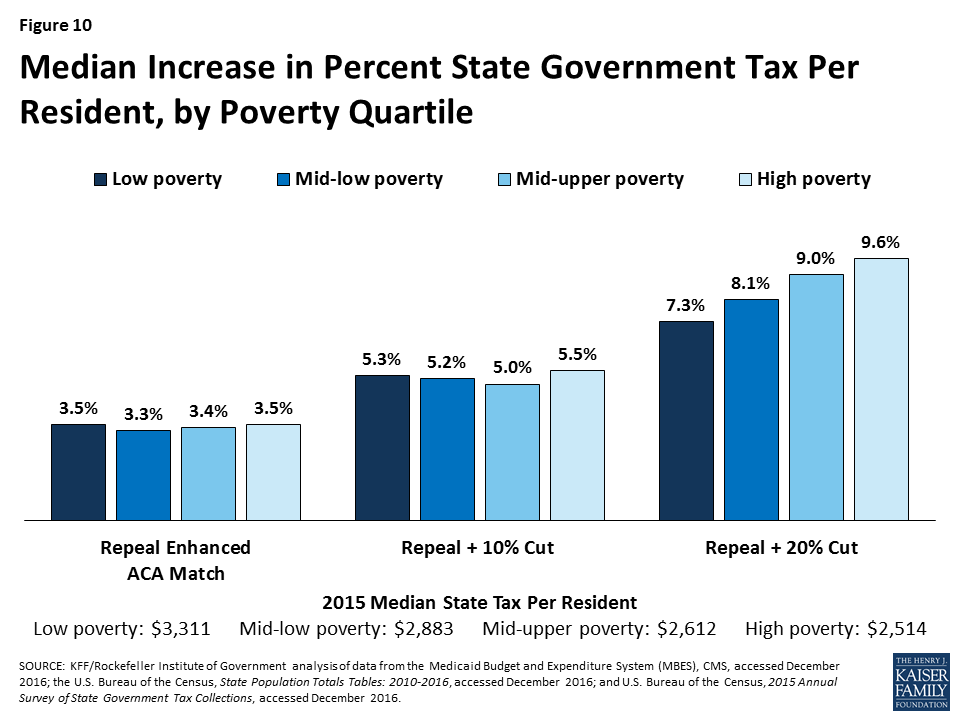
All of the scenarios would result in larger increases in state taxes in expansion states compared to non-expansion states (across states with Republican and Democratic governors). High poverty states could experience the highest median percentage increase in state taxes to offset federal reductions in federal Medicaid funding under the largest reduction scenario (Figures 9 and 10).
For median results by group for each scenario, see Table 3. For state-by-state results of changes in state taxes per resident, see Figure 11 and Appendix Table 4.

| Table 3. Median Increase in State Taxes per Resident by State Characteristics, 2015 | ||||||||
| Total State Tax Revenue per Resident, 2015 | Revenue from the Largest Tax per resident, 2015 | Repeal Enhanced ACA Match | Repeal + 10% Cut | Repeal + 20% Cut | ||||
| Increase in Total State Taxes per Resident | Increase in the Largest State Tax per Resident | Increase in Total State Taxes per Resident | Increase in the Largest State Tax per Resident | Increase in Total State Taxes per Resident | Increase in the Largest State Tax per Resident | |||
| All States | $2,715 | $1,144 | 3.5% | 8.4% | 5.2% | 11.5% | 8.1% | 18.1% |
| By Expansion Status | ||||||||
| Expansion | $2,983 | $1,205 | 3.5% | 8.4% | 6.1% | 14.3% | 9.1% | 20.5% |
| Non-expansion | $2,405 | $1,077 | N/A | N/A | 3.4% | 6.7% | 6.7% | 13.5% |
| By Political Party of the Governor | ||||||||
| Democratic | $3,023 | $1,423 | 3.9% | 9.5% | 6.4% | 13.2% | 8.9% | 17.9% |
| Republican | $2,631 | $1,084 | 3.2% | 8.2% | 4.9% | 10.6% | 7.5% | 18.1% |
| Independent | $1,171 | $309 | 10.8% | 40.9% | 21.4% | 81.2% | 32.1% | 121.6% |
| By Region | ||||||||
| Northeast | $3,533 | $1,483 | 3.6% | 9.3% | 5.6% | 15.5% | 8.1% | 21.2% |
| South | $2,454 | $1,069 | 3.5% | 8.4% | 4.5% | 11.2% | 7.6% | 19.5% |
| Midwest | $2,715 | $1,122 | 2.9% | 7.4% | 4.9% | 10.9% | 6.8% | 16.4% |
| West | $2,628 | $1,170 | 4.4% | 8.9% | 6.5% | 13.1% | 8.9% | 17.7% |
| By Poverty Quartile | ||||||||
| Low Poverty | $3,311 | $1,423 | 3.5% | 8.9% | 5.3% | 11.2% | 7.3% | 15.7% |
| Low-Mid Poverty | $2,883 | $1,170 | 3.3% | 8.1% | 5.2% | 12.6% | 8.1% | 17.5% |
| Mid-Upper Poverty | $2,612 | $1,132 | 3.4% | 8.6% | 5.0% | 10.6% | 9.0% | 18.1% |
| High Poverty | $2,514 | $949 | 3.5% | 8.3% | 5.5% | 14.0% | 9.6% | 24.3% |
| By Expansion Status and Political Party of the Governor | ||||||||
| Expansion – Dem/Ind | $3,026 | $1,513 | 4.0% | 9.6% | 6.5% | 14.1% | 9.4% | 19.6% |
| Expansion – Rep | $2,916 | $1,106 | 3.2% | 8.2% | 5.7% | 15.3% | 8.6% | 22.7% |
| Non-expansion – Dem/Ind | $2,476 | $1,269 | N/A | N/A | 2.7% | 5.5% | 5.3% | 10.9% |
| Non-expansion – Rep | $2,241 | $1,056 | N/A | N/A | 3.4% | 6.7% | 6.7% | 13.5% |
| SOURCE: KFF/Rockefeller Institute of Government analysis of data from the Medicaid Budget and Expenditure System (MBES), CMS, accessed December 2016; the U.S. Bureau of the Census, State Population Totals Tables: 2010-2016, accessed December 2016; and U.S. Bureau of the Census, 2015 Annual Survey of State Government Tax Collections, accessed December 2016. | ||||||||
Fill the Funding Gap with Decreases in Education Spending
Another potential state response to decreased federal Medicaid funds is to shift state dollars from other spending, such as education spending. This analysis assesses the percentage cut in state spending for K-12 education per pupil that would be required if state governments were to reduce spending on education (essentially school aid) to offset Medicaid cuts. Median state funding for education per pupil was $5,961 in 2015. The analysis shows that states could experience median decreases in per pupil state funding for K-12 of 10.9% to 24.1% to offset federal Medicaid reductions under the three scenarios (Figure 12).
Total spending for education is primarily from state and local governments, with a small share financed by the federal government. Reductions in state government spending for K-12 education would have a direct impact on total spending per-pupil. Median total spending per pupil was $10,961 in 2015. For total spending on K-12 education per pupil, states could face reductions in spending of 5.4% to 13.7% (Figure 12). Reductions would vary significantly across states.

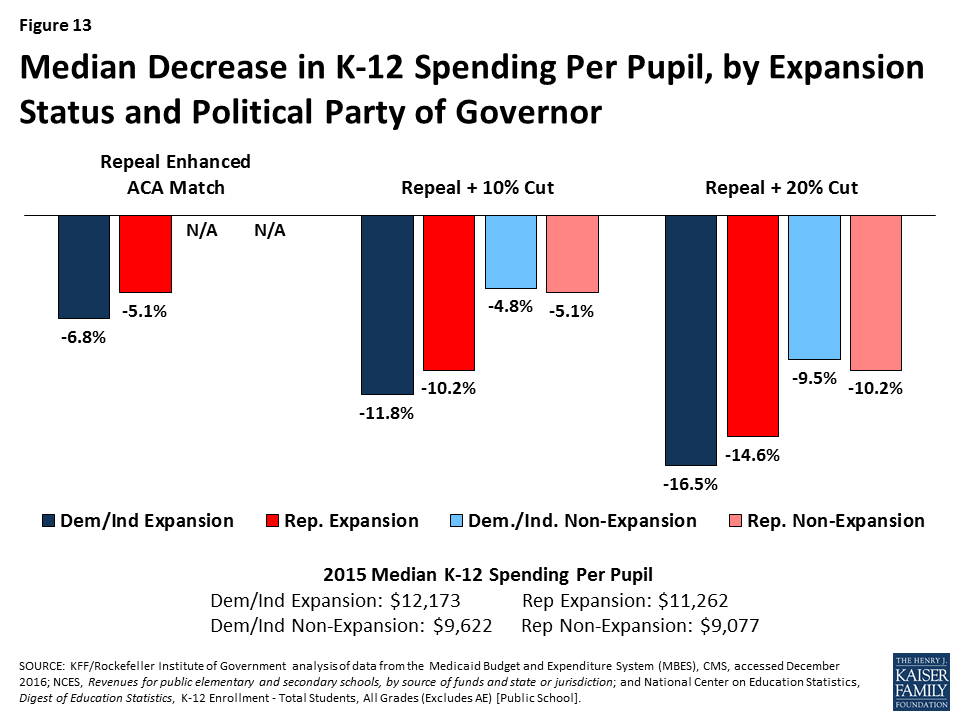
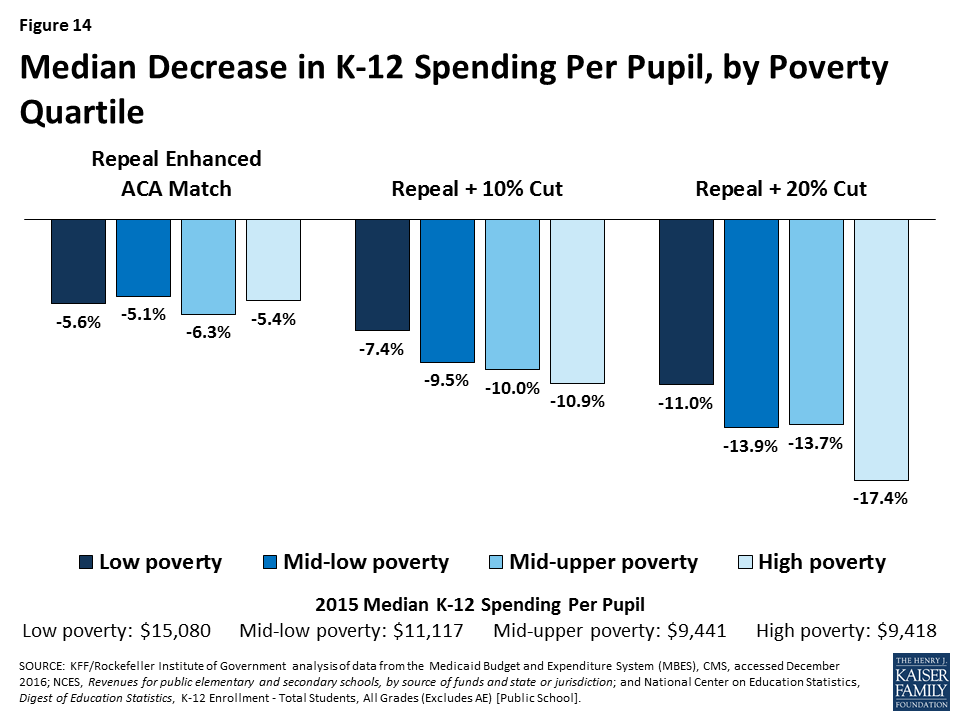
All of the scenarios would result in larger decreases in total K-12 per pupil spending for expansion states compared to non-expansion states (across states with Republican and Democratic governors). Mid- to high poverty states, could experience the largest reductions in per pupil spending to offset federal reductions in Medicaid. Figures 13 and 14 show estimated reductions in total spending for education to fill gaps in federal Medicaid funding.
For median results by group for each scenario, see Table 4. For state-by-state results of changes in K-12 education spending per pupil, see Figure 15 and Appendix Table 5.
| Table 4. Median Decrease in Spending for K-12 Education per Pupil by State Characteristics, 2015 | ||||||||
| State Aid for K-12 per pupil,2015 | Total K-12 Spending Per Pupil, 2015 | Repeal Enhanced ACA Match | Repeal + 10% Cut | Repeal + 20% Cut | ||||
| Decrease in State Aid for K-12 Per Pupil | Decrease in Total K-12 Spending Per Pupil | Decrease in State Aid for K-12 Per Pupil | Decrease in Total K-12 Spending Per Pupil | Decrease in State Aid for K-12 Per Pupil | Decrease in Total K-12 Spending Per Pupil | |||
| All States | $5,961 | $10,961 | -10.9% | -5.5% | -15.4% | -9.4% | -24.1% | -13.7% |
| By Expansion Status | ||||||||
| Expansion | $6,987 | $11,510 | -10.9% | -5.5% | -19.4% | -10.5% | -27.0% | -15.5% |
| Non-expansion | $4,555 | $9,077 | N/A | N/A | -9.4% | -5.1% | -18.8% | -10.2% |
| By Political Party of the Governor | ||||||||
| Democratic | $6,948 | $11,475 | -12.0% | -7.1% | -19.1% | -11.7% | -26.5% | -16.4% |
| Republican | $5,476 | $9,968 | -10.6% | -5.1% | -13.8% | -6.7% | -22.0% | -12.5% |
| Independent | $14,650 | $19,132 | -4.8% | -3.7% | -9.6% | -7.4% | -14.4% | -11.0% |
| By Region | ||||||||
| Northeast | $7,026 | $16,159 | -11.6% | -5.2% | -19.1% | -9.5% | -30.7% | -14.1% |
| South | $5,309 | $9,406 | -10.1% | -5.4% | -13.2% | -6.7% | -23.3% | -13.3% |
| Midwest | $6,380 | $11,243 | -8.4% | -4.9% | -13.9% | -7.9% | -21.0% | -13.0% |
| West | $6,127 | $9,842 | -12.4% | -7.4% | -20.2% | -10.3% | -27.6% | -14.5% |
| By Poverty Quartile | ||||||||
| Low Poverty | $8,209 | $15,080 | -10.5% | -5.6% | -11.5% | -7.4% | -15.8% | -11.0% |
| Low-Mid Poverty | $6,079 | $11,117 | -12.0% | -5.1% | -18.4% | -9.5% | -25.5% | -13.9% |
| Mid-Upper Poverty | $5,961 | $9,441 | -14.7% | -6.3% | -14.5% | -10.0% | -26.7% | -13.7% |
| High Poverty | $5,429 | $9,418 | -10.1% | -5.4% | -16.9% | -10.9% | -28.1% | -17.4% |
| By Expansion Status and Political Party of the Governor | ||||||||
| Expansion – Dem/Ind | $7,467 | $12,173 | -12.0% | -6.8% | -19.7% | -11.8% | -27.0% | -16.5% |
| Expansion – Rep | $6,879 | $11,262 | -10.6% | -5.1% | -19.2% | -10.2% | -27.8% | -14.6% |
| Non-expansion – Dem/Ind | $4,952 | $9,622 | N/A | N/A | -8.6% | -4.8% | -17.3% | -9.5% |
| Non-expansion – Rep | $4,535 | $9,077 | N/A | N/A | -9.4% | -5.1% | -18.8% | -10.2% |
| SOURCE: KFF/Rockefeller Institute of Government analysis of data from the Medicaid Budget and Expenditure System (MBES), CMS, accessed December 2016; NCES, Revenues for public elementary and secondary schools, by source of funds and state or jurisdiction; and National Center on Education Statistics, Digest of Education Statistics, K-12 Enrollment – Total Students, All Grades (Excludes AE) [Public School]. | ||||||||

Conclusion
The Congress is currently debating the American Health Care Act (AHCA), which would not only repeal and replace the Affordable Care Act (ACA) but also make far reaching changes to the structure and financing of Medicaid. The AHCA would use a per capita cap policy or block grants to cap federal funds to states for Medicaid. These reductions in federal Medicaid funding, could have implications for other areas of the state budget if states chose to offset the decreases in federal spending with state funds by raising taxes or reducing other state spending (like K-12 education). States could also reduce spending in Medicaid by finding savings but more likely by restricting eligibility or benefits.
This analysis found that under various scenarios of reductions in federal Medicaid funding in FFY 2015, states would have to increase their per resident state Medicaid spending by a median of 17.2% to 40.3% to maintain total Medicaid spending. To pay for these increases, states could increase total state tax revenue per resident by a median of 3.5% to 8.1% or decrease K-12 education funding per pupil by a median of 10.9% to 24.1%. Because states have different starting points for taxes and education spending, the effects could vary by state and by groups of states. However, due to assumptions about changes in the ACA enhanced match rate, states that have adopted the Medicaid expansion will experience larger implications from the federal Medicaid funding reductions; this is true across states with Republican and Democratic governors. This increased budget pressure could make it difficult for states to maintain the Medicaid expansion. Federal funding reductions could have a disproportionate effect on states that spend less per resident on Medicaid and education, and have lower tax revenues, typically high poverty states. The responses presented in the report are illustrative. In reality, each state would make different policy choices and states could implement a combination of approaches, or not completely offset the federal reductions. However, the results show that depending on the size of the gap to fill, the responses could be significant.
Methods
The following details the methods and data used to examine the outcomes for reductions in federal Medicaid spending.
- Estimated Reductions in federal Medicaid spending. FY 2015 spending for each state was obtained from the Medicaid Budget and Expenditure System (MBES). Adjustments were made for states that expanded mid-year in FY 2015 or in FY 2016. Since Indiana and Pennsylvania expanded early in FY 2015, spending for the expansion population was adjusted to represent a full year of spending. Enrollment data for Alaska (as of April 2017), Louisiana (as of February 2017), and Montana (as of October 2016) were obtained from state resources. The latest enrollment data for these three states were multiplied by the federal per enrollee spending across all Medicaid enrollees in the state to estimate spending for the expansion population.-Using the adjusted FY 2015 spending for the expansion group, we assumed a 90% match rate (the rate when the ACA is in full effect) and then took the difference between that match rate and spending assuming a state’s traditional match rate. For the other effects, we estimated a 10% and a 20% reduction in federal funding off of FY 2015 spending for the traditional Medicaid population. We did not estimate the specifics of per capita cap or block grant proposals.-(KFF analysis of Centers for Medicare and Medicaid Services, Expenditure Reports from MBES, https://www.medicaid.gov/medicaid/financing-and-reimbursement/state-expenditure-reporting/expenditure-reports/index.html; Centers for Medicare and Medicaid Services, Quarterly Medicaid Enrollment Report, https://www.medicaid.gov/medicaid/program-information/medicaid-and-chip-enrollment-data/enrollment-mbes/index.html; Alaska Department of Health and Social Services, Medicaid in Alaska Dashboard, accessed May 23, 2017, http://dhss.alaska.gov/HealthyAlaska/Pages/dashboard.aspx; Louisiana Department of Health, Medicaid Dashboard, accessed March 3, 2017, http://ldh.la.gov/healthyladashboard/; Montana Department of Public Health and Human Services, Monthly enrollments, accessed March 3, 2017, http://dphhs.mt.gov/StatisticalInformation.)
- Change in Medicaid spending per state resident: Medicaid cut divided by state population as of July 1, 2015. (U.S. Bureau of the Census, State Population Totals Tables: 2010-2016, https://www2.census.gov/programs-surveys/popest/tables/2010-2016/state/totals/nst-est2016-01.xlsx.)
- Change in state government taxes: The percentage increase in state government taxes that would be required if states were to raise taxes to offset Medicaid cuts. The calculation is the Medicaid cut as a percentage of state taxes, based upon state fiscal year 2015 state government tax collections. For the District of Columbia, which does not have a state government, we used District tax collections. (U.S. Bureau of the Census, 2015 Annual Survey of State Government Tax Collections, https://www.census.gov/govs/statetax/.)
- Change in largest state government tax: The percentage increase that would be required in a state’s largest state-government tax, if the state raised that tax to offset Medicaid cuts. The calculation is the Medicaid cut as a percentage of the state’s largest tax, where the largest tax is determined based upon detailed item-code data for state fiscal year 2015. For the District of Columbia, which does not have a state government, we used the largest District tax. (U.S. Bureau of the Census, 2015 Annual Survey of State Government Tax Collections, https://www.census.gov/govs/statetax/.)
- Change in state aid for K-12 education: The percentage cut in state aid for K-12 education that would be required if states were to cut this aid to offset Medicaid cuts. The calculation is the Medicaid cut as a percentage of state aid for K-12 education. Revenue of public schools from state governments is used as a proxy for state aid because data that explicitly measure state aid and that are both timely and comparable across states are not available. (Revenue from the state government may differ from what states show in their budgets for state aid. For example, Hawaii operates all of its schools, rather than providing aid to school districts. This approach treats revenue from the state of Hawaii as state aid.) For the District of Columbia, which does not have a state government, we used District revenue used to support schools. The latest available data for revenue of public schools is for 2014, from the National Center for Education Statistics NCES. (NCES, Revenues for public elementary and secondary schools, by source of funds and state or jurisdiction, https://nces.ed.gov/programs/digest/d16/tables/dt16_235.20.asp.) We estimated values for 2015 by adding one year of estimated growth to each state’s value for 2014, based on the compound annual growth rate for the prior five years (2009 to 2014).
- Change in K-12 education per-pupil spending: The cut that would be required in K-12 education spending per pupil if the entire Medicaid cut were offset by cuts in spending by school districts. The per-pupil cut is calculated as the Medicaid cut divided by the number of public school pupils in the state in the 2014-15 school year, excluding adult education enrollment. (National Center on Education Statistics, Digest of Education Statistics, K-12 Enrollment – Total Students, All Grades (Excludes AE) [Public School], http://nces.ed.gov/ccd/elsi.) To provide context for these numbers, we then compute this cut as a percentage of total public school expenditures per pupil (excluding adult education enrollment). The latest available data for revenue of public schools is for 2014, from the National Center for Education Statistics NCES. We estimated values for 2015 by adding one year of estimated growth to each state’s value for 2014, based on the compound annual growth rate for the prior five years (2009 to 2014).
Grouping States by Characteristics
- Medicaid expansion status: ACA Medicaid expansion status, as of January 2017. https://www.kff.org/health-reform/state-indicator/state-activity-around-expanding-medicaid-under-the-affordable-care-act/?currentTimeframe=0&sortModel=%7B%22colId%22:%22Location%22,%22sort%22:%22asc%22%7D
- Political party: Political party of the state governor or mayor, as of January 25, 2017 (in the case of the District of Columbia). https://www.nga.org/files/live/sites/NGA/files/pdf/GOVLIST.PDF
- Region: Major geographic divisions of the United States as defined by the Bureau of the Census http://www2.census.gov/geo/docs/maps-data/maps/reg_div.txt
- Poverty quartile: The poverty-rate quartile that each state is based upon the 2013-2015 three-year-average CPS poverty-rate. (U.S. Bureau of the Census, Historical Poverty Tables: People and Families – 1959 to 2015, Table 19. Percent of Persons in Poverty, by State, https://www2.census.gov/programs-surveys/cps/tables/time-series/historical-poverty-people/hstpov19.xls.)
State Tables
Appendix Table 1. State Characteristics, as of January 2017
| SOURCES: Kaiser Family Foundation’s State Health Facts, Status of State Action on the Medicaid Expansion Decision, as of January 1, 2017. National Governors Association, Governors Roster 2017, as of January 25, 2017. U.S. |
Appendix Table 2. Federal Medicaid Cuts by State, FFY 2015
| NOTE: Adjustments were made for the five states that expanded mid-year in FY15 or in FY16 (AK, IN, LA, MT, PA). Data are rounded to the nearest million and may not sum to the US total. SOURCE: KFF/Rockefeller Institute of Government analysis of data from the Medicaid Budget and Expenditure System (MBES), CMS, accessed December 2016. |
Appendix Table 3. Increase in State Medicaid Spending per Resident by State, 2015
| SOURCE: KFF/Rockefeller Institute of Government analysis of data from the Medicaid Budget and Expenditure System (MBES), CMS, accessed December 2016 and the U.S. Bureau of the Census, State Population Totals Tables: 2010-2016, accessed December 2016. |
Appendix Table 4. Increase in State Taxes per Resident by State, 2015
| SOURCE: KFF/Rockefeller Institute of Government analysis of data from the Medicaid Budget and Expenditure System (MBES), CMS, accessed December 2016; the U.S. Bureau of the Census, State Population Totals Tables: 2010-2016, accessed December 2016; and U.S. Bureau of the Census, 2015 Annual Survey of State Government Tax Collections, accessed December 2016. |
Appendix Table 5. Decrease in Spending for K-12 Education per Pupil by State, 2015
| SOURCE: KFF/Rockefeller Institute of Government analysis of data from the Medicaid Budget and Expenditure System (MBES), CMS, accessed December 2016; NCES, Revenues for public elementary and secondary schools, by source of funds and state or jurisdiction; and National Center on Education Statistics, Digest of Education Statistics, K-12 Enrollment – Total Students, All Grades (Excludes AE) [Public School]. |