Medicaid Work Requirements: Implications for Low Income Women’s Coverage

Published: Apr 30, 2025

Work requirements for Medicaid enrollees have once again resurfaced, now as part of a broader legislative package of potential changes for the Medicaid program aimed at reducing federal spending. Given that women make up over half of adult Medicaid enrollees and women’s well documented role taking on childcare and family responsibilities, Medicaid work requirements would heavily impact women in the program. Full details of the work requirements proposal are still unknown, but analysis of previous legislation from the Congressional Budget Office found that while national work requirements would lower federal spending, they would lead to a drop in Medicaid enrollment and an increase in the number of people who are uninsured but would not increase employment.

The first Trump Administration made a significant change to the Medicaid program by giving states the option to impose work requirements as a condition of Medicaid eligibility through Section 1115 waivers. While 13 states received approval for work requirement waivers, many were struck down in court and the Biden administration rescinded the remaining waivers. Today, only Georgia has a Medicaid work requirement in place for parents and childless adults with incomes below 100% of the federal poverty level (FPL) who are newly eligible through the state’s Pathways waiver. However, several states have submitted or are developing new 1115 waivers or considering legislation to condition Medicaid eligibility on meeting work and reporting requirements.

Medicaid, the nation’s health program for low-income people, provided health and long-term coverage to one in five adult women ages 19 to 64 in 2023. Imposing work requirements in Medicaid would heavily impact women on the program and could lead to Medicaid coverage losses not only for those who lose eligibility because they don’t work or meet an exemption but also among people who remain eligible for the program but lose coverage due to new administrative burdens or red tape. This data note documents differences by sex in the work status of adult Medicaid enrollees ages 19-64 who were not receiving Supplemental Security Income (SSI) and were not dually eligible for Medicare in 2023, and highlights differences by parent status.

What is the work status of women and men covered by Medicaid?

Over nine in ten women and men on Medicaid were working full or part-time for pay or were not working because of caregiving responsibilities, illness or disability, or school attendance in 2023 (Figure 1).1  More than half of men (54%) and more than a third of women (36%) on Medicaid worked full-time during the year. A larger share of women (24%) compared to men (15%) worked part-time. Four in ten (40%) women and three in ten (31%) men enrolled in Medicaid did not work for pay in 2023, most for reasons that would likely exempt them from work requirements.

Among Medicaid adults who are not working, women are more likely to cite caregiving responsibilities while men are more likely to report an illness or disability as reasons for not working. One in five (19%) women enrolled in Medicaid did not work in 2023 because of caregiving responsibilities, compared to 4% of men (Figure 1). One in ten (9%) women said they did not work because of an illness or disability and 6% did not work because they were going to school. Similar shares of men and women report school as the reason they did not work. All the leading reasons women cite for not working would likely qualify for exemptions from state-level Medicaid work requirements. Depending on how work requirement policies are crafted, women who are exempt may have to submit paperwork to document the reasons for their exemption to remain eligible for Medicaid coverage.

Among Those Enrolled in Medicaid, Six in Ten Women and Seven in Ten Men Worked in 2023

Many Medicaid enrollees are working in service jobs with few benefits, such as health insurance and paid sick days. The top industries that employ women with Medicaid are the restaurant and food service industry, schools, and hospitals, while men tend to work in construction, the restaurant and food service industry, and landscaping services (Appendix Table 2).

What are the reasons that some adults work part-time?

Women were more likely than men to cite family obligations and child care issues as reasons for working part-time. Almost one in four (24%) women with Medicaid worked part-time in 2023 compared to one in seven (15%) men (Figure 2). Women were more likely than men to report they worked part-time because of family or personal obligations (27% vs. 12%) or child care problems (12%; data for men suppressed because it did not meet the minimum standards for statistical reliability). Four in ten men and three in ten women said they worked part time because of slack work/business conditions, they could only find part-time work or because their work week was less than 35 hours. Similar shares of women and men with Medicaid coverage worked part-time because of school or training responsibilities or because of health or medical limitations. Individuals who are working part-time are often ineligible for benefits even if they are offered by their employers, particularly health insurance coverage.

Among Part-Time Workers, Childcare Problems and Family Obligations Are the Leading Reason for Part Time Work for Women

What is the work status of mothers and fathers with Medicaid coverage?

Parents with children under 18 – both mothers and fathers – with Medicaid were more likely to work for pay in 2023 than Medicaid adults without dependent children, but fathers were more likely to work than mothers. Just under half (48%) of women ages 19 to 64 with Medicaid have children under 18 as do one-third of men on the program. About two-thirds (64%) of women with children under 18 and 87% of men with children under 18 worked full or part-time compared to 56% of women and 59% of men without children under 18 (Figure 3). Fathers were more likely to work full-time compared to mothers (78% vs. 40%) in 2023. The leading reason cited by mothers for not working (28%) was they were taking care of children and family.

Among women and men without children, the leading reason for not working was an illness or disability (13% and 15%, respectively). One in ten women and men without children reported they were not working because they were going to school (10% and 9%, respectively). Notably, even among women without children, over one in ten (11%) said they were not working because of caregiving responsibilities, which could include caring for adult children or aging or ill parents (Figure 3). Caregiving responsibilities generally consume a lot of a person’s time and could make it difficult to meet paperwork requirements to file for exemptions from work requirements.

Three in Ten Women Enrolled in Medicaid with Children Under Age 18 Are Not Working Due to Caregiving Responsibilities

Appendix

Share of Working Adult Medicaid Enrollees by Demographic Characteristics and Sex, 2023

Top Industries and Occupations With the Largest Number of Workers With Medicaid Coverage by Sex, 2023
Percent of Working Adult Medicaid Enrollees by Sex and Parental Status, 2023
  1. This data note is based on KFF analysis of data from the Current Population Survey ASEC Supplement, which stratifies data by an individual’s sex as male or female. Throughout this brief we refer to “women” and “men” but recognize that not all people who are born as females identify as “women” and not all people who are born as male identify as “men.” ↩︎

5 Questions About the Idea of Default Enrollment into Medicare Advantage Plans

Published: Apr 29, 2025

President Trump has said he will not cut Medicare benefits. At the same time, key figures within the administration, policymakers, and some conservative groups have previously expressed support for boosting the role of Medicare Advantage within the Medicare program, which could include changing the Medicare enrollment process, making Medicare Advantage the default enrollment option rather than traditional Medicare. Under current law, people who sign up for Medicare Parts A and B are automatically enrolled in traditional Medicare, unless they affirmatively choose to enroll in a Medicare Advantage plan. In contrast, under a Medicare Advantage default enrollment approach, unless Medicare beneficiaries make an affirmative choice to enroll in either traditional Medicare or a specific Medicare Advantage plan, they would be automatically enrolled into a Medicare Advantage plan, with the option to switch plans or enroll in traditional Medicare.

This brief considers how default enrollment into Medicare Advantage might work, potential challenges with this approach, and implications for beneficiaries, insurers, providers, agents and brokers, and the federal budget.

How would default enrollment into Medicare Advantage differ from the current enrollment process?

In general, when eligible people first enroll in Medicare during their Initial Enrollment Period (IEP), they can sign up for Medicare Part A and Part B. Once enrolled, new Medicare beneficiaries have the option to get their benefits under traditional Medicare or a private Medicare Advantage plan. New Medicare beneficiaries are automatically covered under traditional Medicare unless they choose to enroll in a Medicare Advantage plan in their area. In 2025, beneficiaries have a choice of 34 Medicare Advantage plans with prescription drug coverage, on average.

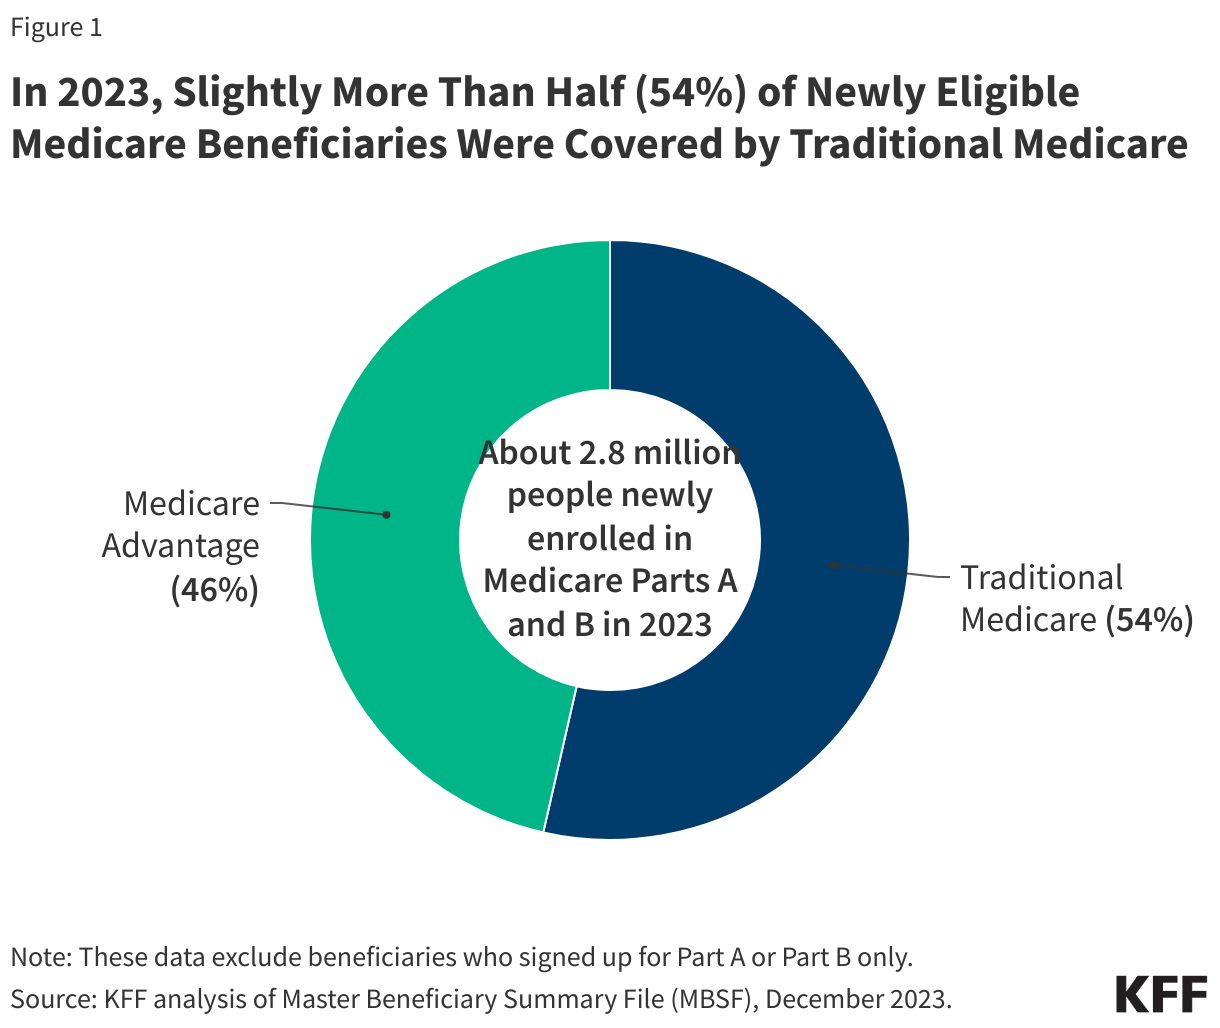
In 2023, about 2.8 million beneficiaries newly enrolled in Medicare, with slightly more than half (54%) or 1.5 million people covered by traditional Medicare and slightly less than half (46%) or 1.3 million enrolling in Medicare Advantage (Figure 1). For those covered by traditional Medicare when they newly enrolled in Medicare, it is possible that they made a change to their coverage and switched to a Medicare Advantage plan after their initial enrollment period. Defaulting individuals into a Medicare Advantage plan would be a change in the way most new Medicare beneficiaries get their coverage.

In 2022, Slightly More Than Half (56%) of Newly Eligible Medicare Beneficiaries Were Covered by Traditional Medicare

In contrast to the current approach, some have proposed to enroll newly eligible beneficiaries in Medicare Advantage by default, rather than traditional Medicare. Proposals vary in the level of detail, but in general, this process would involve assigning individuals to a specific Medicare Advantage plan based on certain criteria, such as patient-provider relationships or plan attributes, as discussed below.

Default options have been used across a variety of fields, including in the areas of retirement savings, organ donations, and electricity pricing programs. In these instances, defaulting people into certain programs with the option to opt out have shown to have a powerful effect on people’s choices, often resulting in a large share of people accepting the default option. In an analysis of default enrollment into Medicare Part D plans for certain low-income beneficiaries (as discussed in more detail below), the authors found that only 16% of individuals opted out of the plan they were randomly defaulted into and actively selected a new plan. The evidence on the impact of default enrollment on individual choices is one of the reasons proponents have put forward this approach for Medicare Advantage.

There are a number of questions about proposals to default beneficiaries into Medicare Advantage plans, along with tradeoffs, such as:

  • What criteria would be used to assign new Medicare beneficiaries to a specific Medicare Advantage plan offered in their area, and how would the assignment to a private plan affect the continuity of care between patients and their doctors (due to provider networks), the ability of beneficiaries to access drugs prescribed by their doctors (due to variations in plan formularies) or timely access to services (due to prior authorization requirements)?
  • Would the new system take into account special considerations such as whether the new Medicare beneficiary has a disability, is covered under both Medicare and Medicaid, or has a condition that requires access to specific medical providers or health care facilities within proximity to their home?
  • What information would be provided to beneficiaries who are default enrolled into a Medicare Advantage plan about other Medicare coverage options that are available to them, including other Medicare Advantage plans or traditional Medicare and stand-alone Part D prescription drug plans in their area? How much time would beneficiaries be given to make a change before being locked in until the next annual open enrollment period?
  • Will beneficiaries who wish to switch out of the Medicare Advantage plan in which they were enrolled and switch to traditional Medicare be provided a special enrollment period for Medigap, without pre-existing condition exclusions, if they choose to switch beyond the current 12-month “trial period” for people switching from Medicare Advantage to traditional Medicare regardless of the duration of their enrollment in Medicare Advantage?
  • How would this approach impact insurers that offer Medicare Advantage plans? Would insurers have the option to opt out of the default enrollment system and continue to enroll new Medicare beneficiaries? What would be the impact on insurance brokers?
  • What would be the impact of default Medicare Advantage enrollment on Medicare spending? While some claim this approach could achieve savings, the increase in Medicare Advantage enrollment that results from default enrollment would likely increase Medicare spending (and Part B premiums paid by all beneficiaries), without a change in current payment methodology. The Medicare Payment Advisory Commission (MedPAC) has consistently found that Medicare pays more for people enrolled in Medicare Advantage than for similar beneficiaries in traditional Medicare.

How would the government assign individuals to Medicare Advantage plans?

One of the main policy considerations for proposals that would default beneficiaries into specific Medicare Advantage plans is how the government would make this assignment. This is particularly challenging because plans vary across an array of features, including premiums, cost sharing for services, provider networks, drug coverage, plan quality (star ratings), extra benefits, and the frequency with which they impose prior authorization requirements and issue denials.

There are a number of different approaches that could be considered to implement default enrollment into Medicare Advantage:

  • Random assignment. The government could randomly assign new Medicare beneficiaries to one of the plans offered in their area. This would ensure more even distribution of enrollment across plans, without benefiting one plan (or insurer) over another. However, random assignment would not take into account any plan features that might matter to individual beneficiaries, such as premiums, cost sharing, the scope of extra benefits, existing relationships with providers, drugs taken by the individual, or quality ratings.
  • CMS currently uses random assignment for certain beneficiaries with LIS, a process which is intended to ensure a generally even distribution of beneficiaries among benchmark (premium-free) plans and to minimize selection bias for plans. However, this process does not match an individual’s prescription drugs with the list of drugs covered by plans, as opposed to a more targeted approach (“intelligent assignment” or “person-centered” assignment, which has been proposed by some advocates and policymakers) tries to align beneficiary needs with plan features. The possibility for greater discordance between an individual’s medical care needs and circumstances would likely arise with a random approach to default enrollment in Medicare Advantage plans, which would encompass more domains than just prescription drugs, such as continuity of coverage with primary care providers.
  • Preserve existing relationships with physicians, specialists and other health care providers. Some proposals would assign patients to plans based on their relationship with a primary care provider or a specific specialist. Being able to see preferred providers in-network is one of the plan elements that is a top priority for beneficiaries. However, this process might not be able to take into account relationships with all providers and may not account for relationships with providers that are most consequential to beneficiaries (e.g., for some beneficiaries it might be their primary care physician while for others it might be a certain specialty care physician). If there are also only one or two insurers offering plans in a certain area, any existing provider relationships may not be able to be prioritized at all if providers are not in plan networks. This process would also require a way to identify relationships with providers for individuals who are not yet covered by Medicare, which could prove challenging.
  • Challenges with preserving existing provider relationships for beneficiaries automatically assigned to plans were evident as part of the Financial Alignment Initiative (FAI) for beneficiaries enrolled in both Medicare and Medicaid. As part of this demonstration, states were required to try to assign enrollees to plans based on the individual’s most frequently utilized providers and medical facilities to best meet the individual’s current needs and circumstances. To do this, states could use the most recent 12 months of Medicare and Medicaid claims data, though this data was not always available. Beneficiaries automatically assigned to plans were able to opt-out, however, and there were high-opt out rates among beneficiaries, due to a number of factors, including enrollees being satisfied with existing care and not seeing the benefit of being in one of the demonstration plans and resistance from providers who refused to participate in the plan’s network and encouraged their patients not to participate. In California, for example, after the first evaluation of the demonstration, only about 50 percent of beneficiaries in the demonstration plans were able to retain their primary care providers, and those beneficiaries who were not able to maintain existing relationships with providers were more dissatisfied with the new plans. Similar issues could arise for Medicare Advantage default enrollment if the assignment process is not able to adequately match beneficiaries with their current providers.
  • Zero-dollar premiums (other than the Part B premium). Some proposals would assign beneficiaries to plans with a zero-dollar premium. Using this approach would prioritize a plan parameter that is often cited as a top reason for selecting a Medicare Advantage plan, making it very meaningful to potential enrollees. There are a small share of beneficiaries who do not have access to a plan with a zero-dollar premium – about 325,000 people in 2025 – and in those situations, assignment could be based on the lowest premium available in the area. However, nearly all beneficiaries (99%) have access to a Medicare Advantage plan with drug coverage with no additional monthly premium. Depending on the area, this plan parameter may not be enough to differentiate among plans.
  • Star ratings. Some proposals would base assignment on plan quality, placing Medicare beneficiaries in plans with star ratings of 4 or higher. According to CMS, 40% of Medicare Advantage plans with prescription drug coverage earned a star rating of 4 of higher for their 2025 rating, with 62% of Medicare Advantage enrollees currently in plans that will have stars of 4 or higher in 2025. Similar to zero-dollar premium plans, depending on the area, using the quality rating measure alone may not be enough to differentiate among plans. Further, MedPAC has recommended replacing the quality-bonus program which assigns stars because it asserts that this system does not provide a reliable indicator of quality, and Medicare focus groups have shown that few beneficiaries consider quality ratings when choosing a plan, so this approach alone may not adequately match enrollees with plans that meet their preferences.
  • Drug coverage. Individuals could be assigned to plans based on the drugs they take and whether those drugs are on the plan formulary. While coverage of prescription drugs is an important part of plan selection, implementing this kind of approach could prove challenging since it would require, at a minimum, identifying the list of prescription drugs used by people not yet covered by Medicare and could result in assigning people to plans that cover some but not all of their medications.Challenges in implementing this kind of approach have been apparent in the case of the LIS random assignment process, which has been used since the program’s beginning in 2006. Advocates and policymakers have called for using intelligent assignment or beneficiary-centered assignment instead of the current LIS random assignment process to minimize potential disruptions in access to specific medications for beneficiaries who become eligible for LIS. This approach would take into account enrollees’ current prescriptions and pharmacies. CMS previously considered modifying the current assignment process for LIS enrollees but did not implement any changes.
  • Preserve existing relationships with insurers. Assignment could be based on maintaining a relationship with an insurer based on the plan an individual was enrolled in before enrolling in Medicare. Medicare focus groups have shown that some beneficiaries choose their Medicare Advantage plan based on prior relationships with insurers because they feel comfortable with them. Continuing a plan with the same insurer could potentially preserve some relationships with providers or may be more likely to cover the drugs beneficiaries already take, but commercial plans may have different networks than Medicare plans, and provider networks change from year to year, as do formularies. It might also be difficult to identify insurance coverage for individuals prior to their enrolling in Medicare and in some areas, it may not be an option to continue coverage from a specific insurer if they do not sponsor Medicare Advantage plans.
  • Lowest cost plan. Assignment could also be based on the “lowest cost plan” offered in an area. If a goal of default enrollment into Medicare Advantage is to save money for the Medicare program, assigning beneficiaries to plans with the lowest “bid” to provide Medicare Part A and B services at the lowest cost in a specific area may be a way to achieve this. It could also encourage competition among insurers to provide care most efficiently. However, it might also mean enrollees assigned to the lowest-bid plan in an area end up with a less generous set of supplemental benefits, a more narrow network of providers, face higher cost-sharing requirements, or are subject to more utilization review requirements, than other available plans if a plan is trying to cut costs to be the lowest cost option.

What are the implications for beneficiaries, insurers, providers, and agents and brokers?

Beneficiaries. Proponents of default enrollment into Medicare Advantage observe that this approach would provide more individuals with access to benefits beyond those covered by traditional Medicare, such as dental, vision, and hearing benefits, lower cost sharing and an out-of-pocket limit. Beneficiaries would have access to all Medicare-covered and extra benefits, without needing a separate Part D plan or separate supplemental policy, such as Medigap, and Medicare Advantage plans have potential to provide better coordinated care than traditional Medicare.

At the same time, people who are newly eligible for Medicare may not be aware of the differences between traditional Medicare and Medicare Advantage and might accept default enrollment into a Medicare Advantage plan without understanding the potential implications. For example, while Medicare Advantage potentially offers coverage at lower costs with extra benefits not available in traditional Medicare, there are tradeoffs with Medicare Advantage plans, including more limited provider networks compared to traditional Medicare as well as the potential for denials or delays in care related to the use of prior authorization in Medicare Advantage. Default enrollment could also result in more enrollees experiencing cost-related problems than would be encountered by beneficiaries with traditional Medicare and other types of supplemental coverage, such as Medigap. Furthermore, only a small share of Medicare beneficiaries compare plans, meaning that once enrolled in a plan, beneficiaries are unlikely to review their coverage options, potentially leaving them in a plan that does not best meet their individual needs and preferences.

There are also tradeoffs and complications involved with the process of defaulting beneficiaries into Medicare Advantage plans, though the effects would vary on key policy decisions, such as the criteria used by the government to assign beneficiaries to specific Medicare Advantage plans, as discussed above. For example, if beneficiaries are assigned to a plan that does not have one or more of their doctors in network, the assignment could disrupt existing patient-provider relationships, which could be a particular concern for patients with serious medical conditions. Default enrollment algorithms may also not take into account beneficiaries’ health care needs and preferences, such as specific drugs on a formulary.

Insurers. Depending on how a default enrollment approach was structured, it would have implications for insurers, which could result in the realignment of the market in ways that would benefit some insurers but be negative for others. For example, if the assignment process gave priority to a previous insurer relationship, such as through a former employer, this could favor certain insurers who also offer private commercial insurance and disadvantage insurers who have a smaller presence in commercial insurance markets. A previous insurer relationship could also benefit insurers who have a strong presence in both Medicaid and Medicare, as millions of people on Medicaid ultimately become eligible for Medicare. If assignment was prioritized on certain metrics, such as preserving existing provider relationships, quality or premiums, this could favor established insurers who are more dominant in certain areas, rather than smaller insurers and newer entrants to the Medicare Advantage market. Conversely, a random assignment process could be more equitable in terms of allocating beneficiaries to all types of insurers. Some consideration would need to be given to the distribution of new beneficiaries if some insurers offered more plans than others, which would increase their share of new enrollees. Overall, most of these approaches would likely have adverse effects on insurers that have historically relied more heavily on brokers and marketing to attract new enrollees when they first sign up for Medicare.

Providers and Health Systems. Providers are likely to be impacted by a change in default enrollment for newly eligible Medicare beneficiaries. Recent news reports have indicated that some providers and health systems have dropped certain Medicare Advantage plans from their networks or are no longer taking Medicare Advantage altogether, due to what they claim are burdensome prior authorization requirements, slow payments from plans, and denied claims. Some health systems have also questioned whether they can afford to have Medicare Advantage plans in their networks based on reimbursement from these plans. For example, a recent study found that Medicare Advantage plans reimburse rural hospitals at just 90.6% of traditional Medicare rates on a cost basis. Further expansion of Medicare Advantage enrollment under a default enrollment approach could exacerbate tensions between providers and Medicare Advantage plans, which could disrupt access to care for both current and new Medicare Advantage enrollees.

Agents and Brokers. About one in three Medicare Advantage enrollees rely on insurance agents and brokers to help them select their Medicare Advantage coverage. Agents are paid a commission for signing up Medicare beneficiaries to plans and also receive compensation if enrollees renew their plan. Currently, for beneficiaries who do not select a Medicare Advantage plan and are default enrolled into traditional Medicare, agents do not play a role in their Medicare Parts A or B coverage, though they may help them select Part D prescription drug coverage and a Medigap supplemental policy. If instead new Medicare beneficiaries largely relied on a default enrollment system that auto-assigned them to a Medicare Advantage plan, rather than using an agent or broker to help them choose a plan, this change could disrupt business practices and revenues for insurance agents and brokers.

What are potential implications for the federal budget?

In 2025, MedPAC found that Medicare pays 20% more for enrollees in Medicare Advantage than it would cost to cover them in traditional Medicare, a total of $84 billion dollars in additional spending in 2025 alone. In the absence of any changes to Medicare Advantage payment policy to reduce expenditures, a default enrollment approach into Medicare Advantage would likely increase annual Medicare spending above currently projected levels. One study on default enrollment into Medicare Advantage estimates that federal outlays could increase by $189 billion to $269 billion over 10 years under different scenarios. This higher spending would affect taxpayers and beneficiaries themselves. Already, Medicare Advantage spending increases Part B premiums for all enrollees, including those not on Medicare Advantage, at a cost of $13 billion in 2025. Higher spending on benefits, including under Part B, would increase the amount of government contributions and beneficiary premiums required to cover this part of the program, so Part B premiums would likely further increase under this approach.

How could default enrollment into Medicare Advantage be adopted?

The Trump administration could take different approaches to implement a Medicare Advantage default enrollment system, including testing a model for default enrollment through the Center for Medicare and Medicaid Innovation (CMMI or Innovation Center), using Section 402 demonstration authority, or pursuing legislation through Congress.

CMMI. One approach would be testing a model through CMMI. As part of CMMI’s statutory requirements, the goal of a model must be reducing program spending while preserving or enhancing the quality of care or improving quality of care without increasing spending. Under CMMI rules, the Secretary has the authority to waive Medicare and other program requirements in order to develop and conduct these models, and this authority is not limited to reimbursement or payment related changes (in contrast to the Secretary’s waiver authority for Section 402 demonstrations, as discussed below). The testing, evaluation and expansion of CMMI models are also specifically exempted from the Paperwork Reduction Act, and specific features of models are not subject to administrative or judicial review. Implementing a model through CMMI would not require Congressional approval.

Some important questions that may arise when designing this model include (1) how to design a model that does not increase spending; (2) whether the model would require mandatory or voluntary participation; (3) whether it would be tested in certain regions or nationwide, and (4) whether it would apply broadly or to defined subgroups of the Medicare population, such as beneficiaries with both Medicare and Medicaid coverage (dual-eligible individuals).

Section 402. Another approach would be using Section 402 demonstration authority, which provides broad authority to the HHS Secretary to develop and implement demonstration projects to test new Medicare payment methodologies, and allows the Secretary to waive compliance with certain Medicare requirements only as long as they relate “to reimbursement or payment on the basis of reasonable cost, or (in the case of physicians) on the basis of reasonable charge.” While budget neutrality is not specified in statute or regulation, according to CMS’ Medicare Waiver Demonstration Application, “Medicare-waiver-only demonstrations must be budget neutral. Budget neutrality means that the expected costs under the demonstration cannot be more than the expected costs were the demonstration not to occur.” Although most demonstrations have generally conformed to the administrative practice of budget neutrality, there have been exceptions. Section 402 demonstrations also have typically been subject to certain types of review such as requirements under the Paperwork Reduction Act and administrative or judicial review. Similar to a CMMI model, a Section 402 demonstration does not have to be initiated or approved by Congress.

Legislation. Policymakers could also enact legislation to modify current law to make Medicare Advantage the default enrollment option, rather than traditional Medicare. While there is bipartisan support for Medicare Advantage, some policymakers have raised concerns recently about specific elements of the program, such as the Medicare Advantage payment system, as well as the use of prior authorization, leading to denials and delays in care. Traditional Medicare also continues to serve a larger share of beneficiaries in rural areas than Medicare Advantage. These issues might dampen support for legislative changes to the current Medicare enrollment process.

This work was supported in part by Arnold Ventures. KFF maintains full editorial control over all of its policy analysis, polling, and journalism activities.

Medicare Advantage Insurers Often Use Rewards and Incentives to Encourage Enrollees to Complete Health Risk Assessments (HRAs)

Published: Apr 28, 2025

Beginning in 2014, the Centers for Medicare & Medicaid Services (CMS) has permitted Medicare Advantage insurers to offer Rewards and Incentives Programs to their enrollees to encourage participation in activities that focus on improving health, preventing illness or injury, or promoting the efficient use of health resources. Two common ways these programs work include offering gift cards, as long as they are not redeemable for cash, or “points” or “tokens” that can then be used to acquire tangible items, such as gift cards or fitness accessories.

Completing a health risk assessment (HRA) is one of the activities for which insurers may provide a reward or incentive. HRAs are used to collect information about enrollees’ characteristics and health status. They may be conducted in the home, at a physician’s office, or via telehealth, and HRAs are also required as a component of an Annual Wellness Visit. As part of their role in ensuring coordination of care, Medicare Advantage plans must make a “best-effort” attempt to conduct an initial health risk assessment of all new enrollees within 90 days of enrollment, as well as annually.

While HRAs may be used to develop a personalized care plan and help with care management, they are also a source of diagnoses codes used to calculate a person’s risk score, and the Medicare Payment Advisory Commission (MedPAC) has estimated that Medicare Advantage plans received $15 billion in 2023 as a result of diagnoses captured during HRAs. Further, MedPAC and the Office of the Inspector General (OIG) have both found that some diagnoses are only supported by HRAs, meaning enrollees received no related care. These findings raise concerns that either these diagnoses are inaccurate, or enrollees are not receiving follow-up services for conditions documented in these assessments, while at the same time, boosting payments to plans.

Insurers are required to enter into a contract with CMS to offer Medicare Advantage plans, and each contract may offer multiple Medicare Advantage plans. Many Medicare Advantage requirements and data, such as those pertaining to network adequacy and star ratings measures, are evaluated and reported at the contract rather than the plan level. Using data submitted by Medicare Advantage insurers to CMS, this analysis examines the share of Medicare Advantage enrollees in contracts (which usually include multiple plans) that offered rewards or incentives for completing HRAs in 2023, as well as differences across Medicare Advantage insurers. (See methods for more details.) Because these data are at the contract level, we do not have data about whether individual plans offered rewards or incentives, though a review of the largest reward and incentive programs suggest these programs are broadly available.

In 2023, the majority of Medicare Advantage enrollees were in contracts that offered a reward or incentive for completing an HRA.

More than six in ten (62%) or 18.2 million Medicare Advantage enrollees, were in contracts that offered a reward or incentive specifically for completing an HRA to at least some of its enrollees in 2023 (Figure 1). These contracts may also include a reward or incentive for an Annual Wellness Visit, which is mandated to include an HRA, or other activities, but specifically include a reward for completing an HRA.

One in five enrollees (20%), or nearly 6 million people, were in contracts that offered rewards and incentives for completing an Annual Wellness Visit, but do not specify rewards for HRAs more broadly. About one in ten (9% or 2.5 million) were in contracts that offered rewards and incentives for other activities with no mention of HRAs or Annual Wellness Visits. The remaining 9% of enrollees, or 2.7 million people, were in contracts that did not offer any Rewards and Incentives Programs.

More Than Six in Ten (62%) Medicare Advantage Enrollees Were in Contracts That Offered a Reward or Incentive for Completing a Health Risk Assessment in 2023

Medicare Advantage insurers may offer a reward with a value intended to incentivize enrollee behavior but may not exceed the value of the health-related service. For example, a reward for completing a cancer screening cannot exceed the value of providing the screening itself. However, CMS has not identified explicit values for rewards, and it has not set a limit on how often rewards may be offered throughout the year. For 2023, rewards, typically in the form of gift cards, ranged from $10 to $100 for completing an HRA. Insurers are encouraged to offer enrollees a choice of gift cards to account for enrollees’ preferences and access to certain retailers, which may include, for example, IHOP, Chilis, Home Depot, Lowes, and CVS, among others.

The gift cards that Medicare Advantage enrollees receive for participating in certain health-related activities as described in this analysis are not the same as spending, debit, or “flex” cards that are offered by insurers to deliver extra benefits. These extra benefits include, but are not limited to, cards that help cover copays for dental, vision, and hearing benefits, and money toward over-the-counter products or food and produce.

The share of Medicare Advantage enrollees in contracts that offered a reward or incentive for completing an HRA varied by insurer.

Virtually all Medicare Advantage enrollees in Centene and CVS Health contracts (99%) and UnitedHealthcare contracts (98%) were offered a reward or incentive for completing an HRA. (Figure 2). Nearly two-thirds of enrollees in Blue Cross Blue Shield contracts (BCBS; 64%), and less than half of enrollees in Humana contracts (42%) were offered a reward or incentive for completing an HRA.

The Share of Medicare Advantage Enrollees in Contracts That Offered a Reward or Incentive for Completing an HRA was Higher Among Certain Insurers in 2023

Due to data constraints, we are unable to determine which individual plans offered rewards within a contract and how many enrollees actually received a reward for completing an HRA. However, for those enrollees that do complete an HRA and receive a reward, there is the potential for insurers to receive a high return on investment for providing that reward. For example, in a recent report, OIG found that for each HRA completed in the home, Medicare Advantage insurers generated $1,869 on average in estimated risk-adjusted payments. For those HRAs conducted in a facility – typically as part of Annual Wellness Visit – insurers generated $365 on average in estimated risk-adjusted payments.

Rewards and Incentives Programs are often unique to each insurer and may also vary by contract. For example, UnitedHealthcare uses its HouseCalls program to perform HRAs in the home. It also offers rewards for completing other eligible-health related activities, such as receiving a flu shot or engaging in certain fitness activities such as biking, jogging, and swimming. Humana uses its Go365 program to encourage enrollees to participate in health and fitness activities, such as Annual Wellness Visits, preventive screenings, or being active 12 days a month. Once members have earned at least $10 in rewards, they can redeem them for gift cards in the Go365 Mall at retailers such as Barnes and Noble, Macy’s, PetSmart, and Chipotle, among others.

The current reporting requirements make it difficult to understand the full scope of Rewards and Incentives Programs.

The current reporting requirements make it impossible to determine how many unique enrollees receive rewards, the amount insurers spend on these rewards, and the specific activities enrollees complete to earn a reward. Medicare Advantage insurers are required to submit data on rewards and incentives at the contract level rather than that at the plan level to CMS, and CMS does not specify any quality assurance procedures to identify outliers or potentially erroneous entries, as it does for some other data sets, such as prior authorization determinations. Most data fields are free text, which results in a lack of uniformity in reporting. Frequently, information on multiple rewards is entered on the same line (for example, Annual Wellness Exam, cancer screenings, and HRAs), making it difficult to determine how many individual rewards were distributed, as well as the dollar amount allocated to each reward.

Due to this complexity, it is not possible to calculate the total amount spent by insurers on the Rewards and Incentives Programs generally, nor for specific activities such as HRAs. This information would be useful to better understand how insurers use their budgets to increase the completion of HRAs and what the potential return on that investment is in the form of higher payments from CMS due to increased coding, as well as the potential to improve the quality of enrollees’ care and identify conditions early and prevent them from becoming more costly in the future.

This work was supported in part by Arnold Ventures. KFF maintains full editorial control over all of its policy analysis, polling, and journalism activities.

Methods

This analysis uses Rewards and Incentives Programs Part C data from the Centers for Medicare and Medicaid Services (CMS) Parts C and D Limited Data Set (LDS) for contract year 2023. Medicare Advantage insurers submit the required data at the contract level to CMS, but not at the plan level. It may be possible there are plans within a contract did not offer a particular Rewards and Incentives Program. CMS also does not specify any quality assurance procedures.

This analysis reflects data on rewards and incentives for health risk assessments (HRAs) though we were unable to determine the exact number of enrollees who qualified for a reward for completing an HRA. Special Needs Plans (SNPs) are included in the analysis and are required to complete HRAs for their enrollees. Similar to non-SNPs, SNPs are able to provide a reward for the completion of this required HRA.

The enrollment data are from the CMS Medicare Advantage enrollment file for March 2023 at the contract-plan-county level, which are aggregated to the contract level and merged with the rewards and incentives data. Contract-plan-county combinations are not included if there are fewer than 11 enrollees. 


Potential Implications of Immigration Restrictions on the U.S. Agricultural Workforce

Published: Apr 25, 2025

There are over 2.6 million people working on agricultural farms in the U.S. that play an important role in crop work and the nation’s food system. In addition to self-employed farmers and their unhired family members, these workers include 1 million hired workers, who are primarily noncitizen immigrants. The Trump administration’s restrictive immigration policies, including limits on entry at the border and increased interior enforcement efforts, may reduce the supply of immigrant workers available to fill these roles and increase fears among some immigrants about working. Reductions in the immigrant workforce to support agriculture could ultimately have negative impacts on the cost and availability of food. Moreover, increased fears among agricultural workers could compound health challenges and risks they already face.

Using data from the 2022 National Agricultural Workers Survey (NAWS), this analysis examines key characteristics of agricultural workers, including their citizenship status, health coverage, and access to health care. The analysis includes agricultural workers ages 14 years and older who are currently employed in crop and crop-related work (see Box 1 for more details). It does not include self-employed farm workers or their unpaid family members, agricultural workers with H-2A visas, or hired livestock workers. Key takeaways include the following:

  • Most agricultural workers are Hispanic, noncitizen immigrants. Overall, over seven in ten (73%) agricultural workers are Hispanic, and about two-thirds (66%) are noncitizen immigrants. This includes 18% who report having an immigration status with work authorization, such as lawful permanent status or a “green card,” and nearly half (47%) who say they lack work authorization. Additionally, one in five (19%) agricultural workers report household income below poverty.
  • Among agricultural workers, noncitizen immigrants are more likely than citizens to be Hispanic and to do field work. Nearly all (97%) noncitizen immigrant agricultural workers are Hispanic compared to three in ten (30%) of citizen agricultural workers. Noncitizen immigrant agricultural workers also are more likely to be employed in field work than their citizen counterparts, with about three in four of noncitizen immigrants with and without work authorization (78% and 74%, respectively) in a field work position compared to about half of citizens (52%). Field work involves all aspects of crop production and harvest, while work in nurseries, packing houses, or elsewhere typically takes place indoors. Agricultural workers engaged in field work may be at increased risk of climate-related adverse health effects given their routine exposure to heat stress.
  • More than half (53%) of agricultural workers are uninsured, with this share rising to 77% of noncitizen immigrants without work authorization compared to 41% of noncitizen immigrants with work authorization and 26% of citizens. Additionally, one in four (25%) noncitizen immigrant agricultural workers report not being able to access needed care in the past 12 months compared to 15% of those who are citizens. Going without needed care may have negative health implications, as roughly half of agricultural workers report ever being told by a doctor or nurse that they have a chronic health condition.

Box 1

The NAWS is a nationally representative survey of eligible hired agricultural workers ages 14 years and older who are currently employed in crop and crop-related work. The survey is conducted by the U.S. Department of Labor through face-to-face interviews with workers at randomly sampled workplaces from 12 regions throughout the year. These workplaces include farms, orchards, groves, greenhouses, and nurseries that are primarily engaged in growing crops, plants, vines, or trees and their seeds. Types of work include all phases of crop production (pre-harvest, harvest, and post-harvest), as well as supervising workers, operating machinery, and packing crops in certain cases. Other tasks include nursery work, grading and sorting, agricultural inspection, and farm supervision and management.

The NAWS sample includes both migrant and seasonal crop workers. The survey does not include self-employed farm workers or their unpaid family members, agricultural workers with H-2A visas, or hired livestock workers. People employed at eligible establishments who do not perform crop-related work, such as secretaries or mechanics, are also not included unless such workers also perform crop-related work.

Analysis was completed in R using code available from Analyze Survey Data for Free.

Overview of U.S. Agricultural Workers

As of 2022, there were over 2.6 million people working on farms in the U.S, consisting of a mix of self-employed farm operators, their family members, and over 1 million hired workers. Hired workers include agricultural workers ages 14 years and older who are employed in crop and crop-related work at places like farms, orchards, groves, greenhouses, and nurseries that grow crops and plants, and are typically employed in larger farms rather than smaller or family-operated farms. These agricultural workers are concentrated in certain labor-intensive sectors, such as fruit, tree nuts, vegetable, and specialty horticultural crops that are challenging to be automated by technology. Corn, soybeans, and wheat are the leading crops produced in the U.S., with 80% of all crops going into the U.S. food system and the remainder exported to other countries.

Most agricultural workers are Hispanic, noncitizen immigrants. Overall, more than seven in ten agricultural workers say they are Hispanic (73%), a quarter report they are White (25%), and the remaining 3% report another race or ethnicity. Nearly two in three (66%) agricultural workers say they are noncitizen immigrants, including 18% who report having work authorization, including lawful permanent residents or “green card” holders, and 47% who do not report having work authorization (Figure 1). The remaining roughly third (34%) of agricultural workers are citizens. Most immigrant agricultural workers first arrived in the U.S. ten or more years ago, and they predominantly come from Mexico.

Over Six in Ten Agricultural Workers are Noncitizen Immigrants

Agricultural workers who are noncitizen immigrants are more likely than those who are citizens to be Hispanic (97% vs. 30%) (Figure 2). Among agricultural workers who are noncitizen immigrants, 97% of those with and without work authorization say they are Hispanic, while among their citizen counterparts, over six in ten say they are White (64%), three in ten say they are Hispanic (30%), and the remaining 6% report another race or ethnicity.

Over Nine in Ten Noncitizen Immigrant Agricultural Workers Are Hispanic

Agricultural workers who are noncitizens also are more likely than those who are citizens to do field work (Figure 3). Overall, about two-thirds (67%) of agricultural workers do fieldwork while the remaining third (33%) work in nurseries or packing houses. Among noncitizen immigrant agricultural workers, 78% of those with work authorization and 74% of those without work authorization do field work, while among citizen agricultural workers, roughly half do either field work (52%) or work in nurseries or packing houses (48%). Field work involves all aspects of crop production and harvest, while work in nurseries and packing houses typically takes place indoors. Agricultural workers engaged in field work may be at increased risk of climate-related adverse health effects given their routine exposure to heat stress compared to other types of agricultural work that take place indoors more often.

Three in Four Noncitizen Immigrant Agricultural Workers Report Doing Field Work

Overall, agricultural workers have higher poverty rates than other workers. About one in five (19%) agricultural workers report household income below the federal poverty level (FPL) ($20,030 for a family of three as of 2022), higher than the share of all workers with income below poverty in 2022 (5%)1 .

Health Coverage and Care for Agricultural Workers

About half (53%) of all agricultural workers report being uninsured, with higher uninsured rates among those who are noncitizen immigrants, particularly those without work authorization (Figure 4). Agricultural workers have a nearly five times higher uninsured rate than the rate for all nonelderly adults (10%) nationwide in 2022. Among agricultural workers, noncitizen immigrants without work authorization have the highest uninsured rate with over three in four (77%) lacking coverage, compared to about four in ten (41%) noncitizen immigrants with work authorization and 26% of citizens. These higher uninsured rates reflect a combination of limited access to employer-sponsored coverage among agricultural workers overall and Medicaid eligibility restrictions for noncitizen immigrants, including the exclusion of undocumented immigrants from federally-funded health coverage programs.

Overall, one in five (21%) agricultural workers report not being able to get health care when they needed it in the past 12 months (Figure 4). Among agricultural workers, noncitizen immigrants (25%) are more likely to report not being able to access care than those who are citizens (15%). Barriers to care likely include their higher uninsured rates, cost, and limited provider access in rural areas. Language access and immigration-related fears may pose additional barriers for those who are immigrants seeking health care. Going without needed care may have negative health implications for agricultural workers as about half (51%) report ever being told by a doctor or nurse that they have a chronic illness, including asthma, diabetes, hypertension, or other conditions. Among agricultural workers, citizens (60%) are more likely to report having a chronic condition than noncitizen immigrants without work authorization (42%). This difference may, in part, reflect more limited access to health care among noncitizen immigrants. Additionally, research shows that, overall, noncitizen immigrants, particularly those who are undocumented, generally are younger and healthier than their U.S.-born citizen counterparts.

Noncitizen Immigrant Agricultural Workers Are More Likely to Be Uninsured and to Go Without Needed Care than Citizens
  1. Based on KFF analysis of 2022 Current Population Survey Annual Social and Economic Supplement (CPS-ASEC) ↩︎

A Medicaid Per Capita Cap on the ACA Expansion Population: State by State Estimates

Published: Apr 25, 2025

The concurrent budget resolution that passed the House and Senate includes instructions for the House to reduce federal Medicaid spending by up to $880 billion or more over the next decade. The Senate is expected to seek at least $1.5 trillion in overall spending cuts, including substantial cuts to Medicaid. Medicaid is the primary program providing comprehensive health and long-term care to one in five people living in the U.S. and accounts for nearly $1 out of every $5 spent on health care. Medicaid is administered by states within broad federal rules and jointly funded by states and the federal government, meaning restrictions in federal Medicaid spending could leave states with tough choices about how to offset reductions through cuts to Medicaid, cuts to other programs, or tax increases.

While the detailed proposals under consideration by Congress to achieve federal Medicaid spending reductions have yet to be released, there are several options raised earlier in 2025, including eliminating the enhanced match rate for the Affordable Care Act (ACA) expansion population and implementing a per capita cap on the federal share of Medicaid spending, which were both examined in previous KFF analyses. This analysis examines the potential impacts on states and Medicaid enrollees of implementing a per capita cap on the federal share of Medicaid spending for the ACA Medicaid expansion population only, which is another proposal that has been discussed by members of Congress. Other proposals to reduce federal Medicaid spending may also be under consideration, including work requirements, a reduced federal matching rate, limits on provider taxes to finance the state share of Medicaid spending, and repeal of certain Medicaid regulations issued by the Biden administration. To achieve spending reduction targets, multiple proposals may be considered together. Future KFF analyses will examine these proposals as well.

Key takeaways

The estimated effects of a per capita cap depend highly on what assumptions are made about policy specifications, future growth in Medicaid spending, and states’ responses to federal cuts. This analysis is designed to illustrate the magnitude of the impact of a per capita cap on the ACA expansion population if all states responded by maintaining their ACA expansion coverage and spending and picking up the new expansion costs. However, in practice, states may respond to the policy change differently, and many may ultimately drop their Medicaid expansion coverage over time as the magnitude of the federal spending cuts grows.

  • If states maintain their ACA expansion coverage and spending at current levels, a per capita cap on the expansion population tied to medical inflation would erode the effective enhanced federal match rate for the ACA expansion population over time. Assuming Medicaid spending grows as projected by the Congressional Budget Office, by FY 2034, the federal share of spending or the effective federal match rate for expansion enrollees would be 69%, a decrease of 21 percentage points from 90%, the current federal match rate for expansion enrollees.
  • The effective enhanced federal match rate for the ACA expansion population would eventually fall below states’ traditional match rates, assuming there is no limit or floor on the federal contribution to the expansion population. The effective federal match rate in FY 2034 of 69% is lower than the traditional match rate in five states, though eventually the effective federal match rate for the expansion population would be lower than the traditional match rate (which is 50% or more) in all states as the federal contribution decreases over time.
  • A per capita cap on the Medicaid expansion population could shift $246 billion in costs to states over the next ten years, with state spending increasing anywhere from 4% to 20% across expansion states.

As the effective FMAP for expansion enrollees declines, the pressure on states to eliminate ACA coverage would increase. Twelve states currently have “trigger” laws in place that would automatically end expansion or require changes if the federal match rate were to drop, but it is unclear how those trigger laws would treat a per capita cap that effectively lowers the federal match rate over time. If all states ultimately drop their Medicaid expansion coverage, up to 20 million Medicaid expansion enrollees could lose Medicaid coverage and the number of uninsured would increase.

What is the proposed policy change?

Like all other Medicaid spending, Medicaid spending on the ACA Medicaid expansion population is currently shared by states and the federal government without a cap; unlike most other spending, the federal government pays 90% of the costs of expansion enrollees. States that have implemented the ACA Medicaid expansion currently receive a 90% federal match rate or “FMAP” for adults covered through the expansion. The FMAP for services used by people eligible through traditional Medicaid is determined by a formula set in law designed to provide a higher federal match rate for states with lower per capita incomes and ranges from 50% to 77%. The ACA expanded Medicaid coverage to nearly all adults with incomes up to 138% of the Federal Poverty Level ($21,597 for an individual in 2025). However, a Supreme Court ruling effectively made the decision to implement the Medicaid expansion an option for states. Forty-one states (including DC) have since adopted Medicaid expansion, and Medicaid expansion enrollees represent nearly a quarter of Medicaid enrollment and one-fifth of total Medicaid spending.

This analysis estimates the impact of implementing a per capita cap on the federal share of Medicaid spending for the ACA expansion population. While specifics on the implementation of this policy would be included in a legislative proposal, details have yet to be released, and assumptions made here may differ from details included in any proposed legislation. To estimate a per capita (i.e., per enrollee) cap on the expansion group, this analysis first establishes FY 2025 per enrollee spending as the base year estimate; then, starting in FY 2027, the analysis limits federal spending growth for expansion adults to the consumer price index (CPI-U) plus 0.4 percentage points, which is KFF’s estimate of the difference between CPI-U and medical inflation (CPI-M) over the past 20 years (see Methods). Federal spending for all other eligibility groups remains as projected under current policy. There are a number of other Medicaid policy changes that have been suggested, and policy estimates would likely differ depending on the combination of policies and their interactive effects. The effects of a per capita cap on Medicaid spending and enrollment are also highly sensitive to policy design, inflation rates, and how states respond to the cuts; and estimates are highly sensitive to assumptions about those factors. We assume that Medicaid expansion spending per enrollee will grow at 5.9% per year on average over the 2027-2034 period, based on CBO projections. A cap based on CPI-U plus 0.4 percentage points is projected to grow by 2.6% per year on average over this period.

What is the potential impact on Medicaid spending?

This analysis does not make assumptions about specific state behavioral responses to a per capita cap on the ACA expansion population and instead examines the potential impact on Medicaid spending if all states maintained their ACA expansion coverage and spending at current levels in response to this policy change. This analysis assumes states would maintain expansion group per enrollee spending and eligibility at current levels, picking up new costs due to the federal cap on per enrollee spending. Enrollment and total spending would remain constant while costs would shift from the federal government to the states, and states would have to make offsetting cuts in other parts of Medicaid or in programs other than Medicaid or raise revenues. The analysis is designed to illustrate the magnitude of the impact of the policy change if states maintain their Medicaid expansion coverage and spending levels; however, in practice, state responses may vary. While some states may choose to continue ACA Medicaid expansion coverage with substantially reduced federal funding, many states may seek to restrain the growth in Medicaid expansion spending by reducing provider payment rates or eliminating the expansion altogether as the magnitude of the federal spending cuts compounds over time.

If states maintain ACA expansion coverage and spending at current levels, a per capita cap on the expansion population would erode the effective enhanced federal match rate for the expansion population over time (Figure 1). Per capita caps are typically designed to constrain federal Medicaid spending growth to a rate slower than is expected under current law, which is how they achieve federal savings. As time passes, the effects compound. If states maintain their ACA expansion coverage and spending, the federal share of Medicaid expansion spending would decrease while the state share of spending would increase to offset the loss of federal funds. By FY 2034, the final year in the analysis, the federal share of spending or the effective federal match rate for expansion enrollees would be 69%, a decrease of 21 percentage points from 90%, the current federal match rate for expansion enrollees.

A Per Capita Cap on the Expansion Population Would Erode the Effective Enhanced Federal Match Rate for the Expansion Population Over Time

Under these assumptions, the effective enhanced federal match rate for the expansion population would eventually fall below states’ traditional match rates. This analysis does not assume there is any kind of limit or floor on the federal contribution to the expansion population, meaning the federal share of spending on the expansion population would continue to decline over time. This would eventually result in the effective enhanced federal match rate for the expansion population falling below states’ traditional federal match rates. The effective federal match rate in FY 2034 of 69% is lower than the FY 2026 traditional match rate in five states: West Virginia (74%), New Mexico (72%), Kentucky (71%), District of Columbia (70%, which is set in statute), and Arkansas (69%). Another nine states have traditional match rates that are within 5 percentage points of 69%, including Louisiana (68%), Idaho (67%), Oklahoma (67%), Michigan (65%), Ohio (65%), Indiana (65%), North Carolina (65%), Missouri (64%), and Arizona (64%). The federal share of spending on the expansion population would continue to decline beyond FY 2034, resulting in more states where the effective federal match rate for the expansion population is lower than the traditional match rate over time.

The Effective Enhanced Federal Match Rate for the Expansion Population Would Eventually Fall Below States’ Traditional Match Rates

If states maintain their Medicaid expansion spending and coverage, a per capita cap on the Medicaid expansion population could shift $246 billion in costs to states over the next ten years. Federal Medicaid spending could decrease by 4% or $246 billion over the 10-year period, and states would pay those costs, increasing the state share by 7% across all states. All expansion states would be impacted, but the increase in state spending would vary across states, ranging from 4% in Massachusetts and South Dakota to 20% in Louisiana. States with larger shares of expansion enrollment and spending would experience the largest shifts in spending from the federal government to the state.

A Per Capita Cap on the Medicaid Expansion Population Could Increase State Spending By $246 Billion Overall or 4% to 20% Across Expansion States

What are other implications to consider?

As the effective FMAP for expansion enrollees declines, the pressure on states to eliminate ACA coverage would increase. As the effective ACA FMAP declines, states would face increasing difficulties raising the necessary state tax revenues or decreasing spending on non-Medicaid services such as education needed to offset federal cuts, resulting in increasing pressure to eliminate ACA expansion coverage.

Pressure to eliminate ACA expansion coverage might be greatest in the twelve states that currently have “trigger” laws in place that would automatically end expansion or require changes if the federal match rate were to drop. While not a direct change to the expansion FMAP, this change would reduce the federal contribution for expansion enrollees and could put people in states with trigger laws at greater risk of losing coverage. Amid the threat of changes to federal support for Medicaid expansion, some states are actively debating their Medicaid expansion trigger laws. Three states (South Dakota, Missouri, and Oklahoma) have passed constitutional amendments that require the state to cover the Medicaid expansion population, which means they could not easily drop their ACA expansion coverage and would have to find a way to offset the additional costs.

If all states ultimately drop their Medicaid expansion coverage, up to 20 million Medicaid expansion enrollees could lose Medicaid coverage and the number of uninsured would increase. Prior KFF analysis shows that if all states drop their Medicaid expansion coverage, federal Medicaid spending would decrease a quarter ($1.7 trillion) over a 10-year period and up to nearly a quarter of all Medicaid enrollees (20 million people) could lose Medicaid coverage. It’s unknown whether states would increase eligibility for other groups, such as parents and people with disabilities to offset some of the coverage losses associated with eliminating the expansion. While some people losing Medicaid would be eligible for ACA marketplace coverage (those with incomes 100-138% of the poverty level) and others may be able to obtain employer-sponsored health insurance, many expansion enrollees would become uninsured, with some enrollees with incomes below poverty falling into the coverage gap. A large body of prior research shows that Medicaid expansion has helped to reduce the uninsured rate and improve health care access, affordability, and financial security among the low-income population. More recent research shows improvements in health outcomes and continues to show positive effects for providers (particularly rural hospitals) and for sexual and reproductive health.

The effects of this policy change could be larger if paired with other Medicaid cuts, and there would be interactive effects across policies that affect the ACA expansion population, such as Medicaid work requirements. A number of House Republicans have expressed support for work requirements as a condition of eligibility for Medicaid. Work requirement proposals would likely apply to ACA Medicaid expansion enrollees as well as other adults. Prior estimates show that work requirements result in lower federal spending, an increase in the number of uninsured, and no increase in employment. Because work requirements and a per capita cap on expansion enrollees would target the same population, it is likely that these two policies would have substantial interactive effects resulting in spending and coverage implications for ACA expansion enrollees. In addition, if Congress does not extend enhanced ACA premium tax credits due to expire at the end of this year, ACA marketplace coverage would be less affordable for people who lose Medicaid expansion coverage but are eligible for ACA tax credits.

Appendix

Changes in State Medicaid Spending Due to a Per Capita Cap on the ACA Expansion Population, by State

Methods

Data: To project Medicaid enrollment, spending, and spending per enrollee by state and eligibility group, this analysis uses the Medicaid CMS-64 new adult group expenditure data collected through MBES for FY 2023 (downloaded in December 2024), Medicaid new adult group enrollment data collected through MBES for June 2024 (downloaded in December 2024), the 2019-2021 T-MSIS Research Identifiable Demographic-Eligibility and Claims Files, and the June 2024 Congressional Budget Office (CBO) baseline.

Overview of Approach:

  • Develop baseline projections of Medicaid enrollment, spending, and spending per enrollee by state and eligibility group from FY 2025 through FY 2034 (a 10-year period). This model estimates Medicaid enrollment and spending under the status quo with no policy changes.
  • Estimate Medicaid enrollment, spending, and spending per enrollee by state and eligibility group over the same 10-year period after accounting for the effects of proposed policy changes.
  • Calculate differences in Medicaid enrollment and spending in the policy change scenario relative to the baseline projections.
  • The estimates do not predict states’ responses to federal policy changes. We examine differences in Medicaid enrollment and spending under one state response scenario to build off prior KFF analyses and illustrate the potential effects of this policy change.

Definitions and Limitations:

  • At the time of publishing, CBO had released their January 2025 baseline. However, this analysis uses CBO’s June 2024 baseline because it was the most recent baseline with spending projections by Medicaid eligibility group.
  • The estimates assume that all states experience the same growth rates for Medicaid enrollment and spending; and that total spending grows at the same rate as federal spending.
  • FMAP calculations do not account for the other services that are matched at a higher rate, which include family planning, services received through an Indian Health Services facility, expenditures for Medicare beneficiaries enrolled in the “Qualifying Individuals” program, and health home services that are matched at a 90% rate. For this reason, the model may underestimate the federal share of spending in some states.
  • Estimates of total spending include all spending that is matched as medical assistance but exclude states’ administrative costs which are matched at a separate rate. Federal payments for administrative costs are less than 4% of total federal spending, according to the CBO June 2024 baseline.
  • The analysis does not account for secondary effects or people’s behavioral responses.
  • The analysis does not include policy effects for states that had not expanded Medicaid under the ACA as of February 2025 but would have done so in the absence of the policy change.
  • We implement the per capita cap in FY 2027; we assume it takes effect immediately.
  • To implement a per capita cap, this analysis uses CPI-U + 0.4% instead of CPI-M because projections of CPI-M are not available. Studies and data show that in any given year, either measure may be higher so it’s unclear whether savings would be larger or smaller using a different measure. We chose to add 0.4% to CPI-U because over the past 20 years, CPI-M was 0.4% higher than CPI-U.

We provide more details about the baseline model below.

1. Estimate initial Medicaid spending and enrollment by eligibility group using the most recent years’ data available (FY 2023 for spending data and FY 2024 for enrollment data).

  • First, we pull the quarterly Medicaid CMS-64 new adult group expenditure data collected through MBES for FY 2023 and aggregate total spending by state for enrollees in the ACA expansion group and for all other Medicaid enrollees. Spending reflects an accrual basis of accounting.
  • We exclude spending on DSH by calculating the share of spending on DSH from the FY 2023 CMS-64 Financial Management Report and reducing medical assistance among non-expansion enrollees by that share.
  • Separately, we pull the Medicaid new adult group enrollment data collected through MBES for June 2024. This data includes enrollment by state and is broken into ACA expansion group enrollees and all other Medicaid enrollees. MBES enrollment includes individuals enrolled in limited benefit plans and only includes individuals whose coverage is funded through Medicaid (not CHIP).
  • To obtain spending and enrollment estimates across the remaining eligibility groups (seniors, individuals with disabilities, children, and other adults), we apply the distribution of spending and enrollment across the groups and by state from T-MSIS to the FY 2023 spending data and June 2024 enrollment data. We use the average distribution from 2019 to 2021 to mitigate the impact of the continuous enrollment provision (data in states denoted as “unusable” for a given year by the DQ atlas were excluded from the averages).

2. Calculate initial spending per enrollee in FY 2024.

  • We grow Medicaid spending in FY 2023 by CBO’s growth rates for federal benefit payments by eligibility group to get Medicaid spending in FY 2024. The June 2024 enrollment data is used as our FY 2024 enrollment.
  • We divide Medicaid spending in FY 2024 by Medicaid enrollment in FY 2024 (for each state and eligibility group) to get Medicaid spending per enrollee in FY 2024.

3. Project total spending and spending per enrollee for fiscal years 2025 through 2034 using CBO growth rates and use those estimates to calculate future years’ enrollment.

  • Starting with spending data for FY 2024, we apply the CBO growth rates to estimate Medicaid spending in FY 2025 through FY 2034.
  • Starting with per enrollee spending in FY 2024, we apply the CBO growth rates for average federal spending on benefit payments per enrollee to estimate Medicaid spending in FY 2025 through FY 2034.
  • We calculate enrollment growth in FY 2025 through FY 2034 by dividing estimated Medicaid spending by estimated spending per enrollee.

4.     Split total Medicaid spending over the 10-year period into federal and state spending.

  • We calculate federal and state spending by using a 90% match rate for the ACA expansion group and the traditional state FMAPs for the remaining eligibility groups. We use the FY 2025 FMAPs for FY 2025 and FY 2026 FMAPs for FY 2026 and beyond.

We provide more details about the policy change scenario below.

1. Calculate Medicaid spending under a per capita cap if states maintain ACA expansion coverage and spending. This follows the methodology in KFF’s previous per capita cap analysis, though only applies the cap to the ACA expansion population.

  • Assume enrollment and total spending remain the same as the baseline model over the 10-year period.
  • Establish the base year of per capita spending as FY 2025. We chose FY 2025 because most per capita cap proposals use spending from the period prior to enactment of the law to prevent states from inflating their base estimates of per capita spending in response to the law. We assume the per capita cap takes effect in FY 2027, so FY 2025 and FY 2026 per enrollee spending are the same as baseline and FY 2027 per enrollee spending is the same as the base year for the ACA expansion group.
  • After FY 2027, growth in per enrollee spending for the ACA expansion group is capped at estimated medical inflation levels. To estimate medical inflation, we use CPI-U (Consumer Price Index for All Urban Consumers) + 0.4%, which is the difference in CPI-U and CPI-M (CPI Medical Care) over the past two decades.
  • Calculate new federal spending levels for the ACA expansion group based on the capped per enrollee amounts by first multiplying enrollment and new per enrollee levels and then calculating the federal share using the FMAP. Federal spending for all other eligibility groups remains as projected under current policy.
  • State spending on the ACA expansion group is calculated as the difference between baseline total spending (held constant) and new reduced federal spending levels. State spending for all other eligibility groups remains as projected under current policy.

2. Calculate differences in Medicaid enrollment and spending (including federal and state spending) relative to the baseline projections. 

5 Key Facts About Medicaid Expansion

Published: Apr 25, 2025

Congress has passed a budget resolution that targets up to $880 billion or more in federal spending cuts from Medicaid over ten years. While specific proposals are not yet known, policies under discussion could limit financing and coverage for the Affordable Care Act (ACA) expansion group. Recent KFF polling shows there is little support for cuts to federal Medicaid spending overall, and a majority of adults (59%) oppose eliminating the enhanced federal match rate for adults covered under Medicaid expansion specifically.

The ACA expanded Medicaid coverage to nearly all adults with incomes up to 138% of the Federal Poverty Level ($21,597 for an individual in 2025) and provided states with an enhanced federal matching rate (FMAP) of 90% for their expansion populations over time, which is greater than the matching rate for Medicaid generally. While federal funding finances 90% of spending on the expansion population, states are responsible for the remaining 10% of costs for enrollees eligible under Medicaid expansion. As a result of a Supreme Court ruling in 2012, the expansion is effectively optional for states, and as of April 2025, all but 10 states have adopted the expansion. While expansion has led to higher government spending on Medicaid, a large body of literature shows that it is linked to reduced rates of uninsurance, increased health care affordability, improvements in access and health and outcomes, and economic benefits for states and providers. KFF polling shows that of people living in non-expansion states, two-thirds (66%) said their state should expand Medicaid to cover more low-income uninsured people.

This issue brief examines Medicaid expansion enrollment and Medicaid spending in expansion and non-expansion states and describes the characteristics of adults covered by the Medicaid expansion.

1. Medicaid expansion is widely adopted by both red and blue states.

Over the past 11 years, Medicaid expansion has been broadly adopted. The 41 states including the District of Columbia that have adopted Medicaid expansion are split nearly evenly between states that voted for Trump (21 states) and those that voted for Harris (20 states) in the 2024 Presidential election (Figure 1). Over half (27) of states adopted Medicaid expansion in 2014, while 14 states have implemented expansion since 2014, with South Dakota and North Carolina adopting most recently in 2023. Most states adopted expansion through legislation; however, in seven states, the expansion was adopted via a ballot measure. As of June 2024, over 20 million people were enrolled through Medicaid expansion, representing nearly a quarter of total Medicaid enrollment across all states and 31% of total enrollment in expansion states.

Medicaid expansion is linked to gains in coverage, access, increased health care affordability, and economic benefits for states and providers. Although establishing direct causality between health insurance and health outcomes is complex, evidence generally shows Medicaid expansion is associated with improved health outcomes, including increased early-stage cancer diagnosis, improved disease management, and lower mortality rates for many chronic conditions.

Medicaid Expansion is Widely Adopted by Both Red and Blue States

2. Medicaid median income eligibility for children, pregnancy, and parents, and Medicaid spending per enrollee are higher in expansion states compared to non-expansion states.

Overall, per enrollee spending for the expansion group was higher than for other adults and children but well below per enrollee spending for enrollees over age 65 and people with disabilities. While some critics of Medicaid expansion have argued that expansion diverts resources away from other groups of Medicaid enrollees, including people with disabilities and children, data show that expansion states spend more per enrollee overall and on each eligibility group than non-expansion states. Per enrollee spending for people with disabilities in expansion states is nearly 2.5 times the spending in non-expansion states ($25,170 per enrollee vs. $10,494) (Figure 2). The difference in per-enrollee spending for expansion and non-expansion states holds true for more detailed eligibility pathways for people based on age or disability. Expansion states also spent nearly $2,000 more per child enrollee than non-expansion states ($6,001 vs $4,295). The differences in per enrollee spending may reflect state policy choices about benefits and eligibility, in addition to payment rates, regional variation in health care costs, and state demographics.

In addition to difference in spending, expansion states have higher median income-based eligibility limits compared to non-expansion states for children (266% FPL in expansion states compared to 234% in non-expansion states), pregnant individuals (213% FPL compared to 203% FPL), and parents (138% FPL compared to 33% FPL). There is substantial variation in adoption of optional eligibility and other policies for seniors and people with disabilities, with state expansion status not a strong predictor of these policy choices.

Per-Enrollee Spending in States That Expanded Medicaid Is Higher for All Eligibility Groups Than in Non-Expansion States

3. Nearly four in ten women of reproductive age and over six in ten 50-64 year olds enrolled in Medicaid are covered through Medicaid expansion.

Medicaid expansion provides coverage across age groups for those 19 to 64 (Figure 3). Many expansion adults are working; however, they work for employers and in industries that are less likely to offer health insurance, leaving them without affordable health coverage options. As discussed below, older enrollees are more likely to have chronic conditions and may face more barriers to work.

Medicaid expansion also provides an important eligibility pathway for women of reproductive age, covering 38% of women ages 19-49 enrolled in Medicaid. For those who become pregnant, Medicaid coverage prior to pregnancy can promote pre-pregnancy health care, which can lead to healthier pregnancies and help reduce the risk of complications. Previous KFF analyses show that in expansion states, pregnant individuals are more than twice as likely to be enrolled in Medicaid prior to pregnancy (59%) than in non-expansion states (26%) (the difference in income eligibility levels for pregnant adults vs. other adults is large in non-expansion states, explaining the difference in pre-pregnancy enrollment rates). Medicaid expansion can provide stable coverage to pregnant individuals after the postpartum coverage period ends. Medicaid expansion coverage of parents also increases enrollment of their children: evidence shows that if children are eligible for Medicaid or CHIP coverage but unenrolled, when their parents gain coverage through Medicaid expansion it has a spillover, or “welcome mat” effect, increasing the number of children who enroll in health coverage. Medicaid expansion also covers adults as they age – more than six in ten Medicaid enrollees ages 50-64 are covered through expansion – and before they become eligible for Medicare.

Three in Ten Women of Reproductive Age and Nearly Two-Thirds of 50-64 Year Olds Enrolled in Medicaid are Covered Through Medicaid Expansion

4. One third of Medicaid expansion enrollees have a chronic physical health condition and a quarter have a chronic behavioral health condition.

Nearly half (44%) of expansion adults have at least one chronic condition, including 33% that have a chronic physical condition and 24% that have a behavioral health condition. Of Medicaid enrollees with at least one chronic condition, 53% are enrolled through Medicaid expansion (data not shown). Similar to all adults on Medicaid, the share of expansion adults with at least one chronic physical condition increases with age (Figure 4). Nearly six in ten (57%) expansion adults ages 50-64 have at least one physical health condition compared to just 16% of expansion adults ages 19-26. While the share of expansion adults with physical health conditions increases with age, the share with behavioral health conditions remains relatively stable, ranging from 19% to 26% across age groups.

One Third of Medicaid Expansion Enrollees Have a Diagnosed Chronic Physical Health Condition and One in Four Have a Diagnosed Chronic Behavioral Health Condition

Research finds that expansion is associated with improved access to care and outcomes related to behavioral health conditions. For other chronic conditions, expansion has positive impacts on access to care and may improve certain health outcomes. Medicaid coverage helps expansion enrollees manage chronic conditions and supports workforce participation. Medicaid expansion also provides coverage to individuals who have chronic conditions or disabilities that may limit their ability to work. Although some people with disabilities qualify for Medicaid because they receive Supplemental Security Income, most are eligible for Medicaid through other pathways, including the expansion group. While many adults who need long-term care may qualify for coverage through other Medicaid pathways, Medicaid expansion covers some individuals with costly health needs who may otherwise be unable to afford care; two percent (2%) of expansion enrollees, or 395,000 individuals, use long-term care services (LTC) which support activities of daily living such as eating, bathing, or dressing (data not shown). Medicaid expansion is also the primary pathway for Medicaid coverage for people with HIV.

5. Policy changes targeting Medicaid expansion would reduce government spending but also could put coverage for 20 million enrollees at risk.

There are several options under consideration in Congress to reduce federal Medicaid spending that could have implications for enrollees in the expansion group, including work requirements and changes in financing for the expansion. Congress may debate federal legislation requiring states to impose work requirements as a condition of Medicaid coverage. Most adult Medicaid enrollees are already working without a work requirement; estimates of national work requirements show $109 billion in federal savings over 10 years, and an increase in the number of uninsured, but no increase in employment. Beyond legislative changes, a number of states are pursuing waivers to condition Medicaid expansion coverage on meeting work requirements since work requirement waivers were encouraged and approved during the first Trump administration.

Congress may also consider proposals that would alter the financing for the Medicaid expansion. Any approach to reduce federal Medicaid spending for the expansion would shift costs to states, forcing governors to make tough choices about whether to drop the ACA Medicaid expansion, provide alternative coverage options or make up the loss of federal funding by cutting other state programs or raising taxes. Twelve states have “trigger” laws in place that would automatically end expansion or require other changes if the share of federal funding drops below 90%, and two additional states, Ohio and South Dakota, are considering similar action. But all states, including those without trigger laws in place, would examine their ability to maintain the ACA Medicaid expansion if Medicaid expansion financing was altered. An analysis of the impact on Medicaid enrollment if all states eliminated the expansion shows the decline in enrollment would vary across states, ranging from 19% in Massachusetts, Minnesota, North Carolina, and South Dakota to 49% in Oregon (Figure 5).

Eliminating the ACA Expansion Match Rate Could Reduce Total Medicaid Enrollment By 19% to 49% Across Expansion States

If states eliminate the Medicaid expansion, individuals with incomes 100-138% FPL would be eligible for subsidies in the Marketplace, but could face barriers transitioning to Marketplace coverage and could face higher out of pocket costs, especially if the enhanced subsidies expire at the end of 2025. However, current Medicaid expansion enrollees with incomes below 100% FPL are not eligible for subsidies in the Marketplace and could fall into the “coverage gap” and become uninsured if they are unable to qualify for Medicaid under a different eligibility pathway, for example based on a disability. Currently, 1.4 million adults are in the coverage gap in the ten non-expansion states; however, that number would likely increase significantly under proposed policy changes targeting the Medicaid expansion. Eliminating the Medicaid expansion could have additional spillover effects, including children whose eligibility status is unchanged but become uninsured after their parents lose Medicaid coverage. People without insurance have more difficulty accessing care and are more likely to have medical debt, with almost one in four uninsured adults in 2023 not receiving needed medical treatment due to cost. Uninsured individuals are also less likely than those with insurance to receive preventive care and treatment for major health conditions and chronic diseases.

Methods

Medicaid Claims Data: This analysis uses the 2021 T-MSIS Research Identifiable Demographic-Eligibility and Claims Files (T-MSIS data) to identify Medicaid expansion enrollees, spending, and chronic conditions in Figures 2-4.

State Inclusion Criteria: 

  • Expansion states: Though Idaho and Virginia expanded Medicaid prior to 2021, adult expansion enrollees primarily show up in the traditional adult eligibility group. Therefore, those expansion states are excluded from Figures 2-4. West Virginia is excluded from Figure 2 (but included in Figures 3-4) of this analysis due to unusable spending data, according to quality assessments from the DQ Atlas.
  • Non-expansion states: Mississippi was also excluded from Figure 2-3 this analysis due to data quality concerns flagged by the DQ Atlas.

Enrollee Inclusion Criteria: Enrollees were included if they were ages 19-64, had full Medicaid coverage for at least one month, and were not dually enrolled in Medicare. Dually enrolled individuals were excluded from these calculations since they may not have had sufficient claims in T-MSIS to identify chronic conditions.

Calculating Spending (Figure 2): This figure reflects spending from all states except Idaho, Virginia, West Virginia, and Mississippi. Average annual per capita spending calculations include fee-for-service spending and payments to managed care plans. Spending was calculated by summing the total spending of all claims per enrollee in the T-MSIS claims files. Estimates here do not include prescription drug rebates and most supplemental payments to providers.

Defining Chronic Conditions (Figure 4): This figure reflects chronic conditions from all expansion enrollees in expansion states that expanded prior to 2021 except for Idaho and Virginia. This analysis used the CCW algorithm for identifying chronic conditions (updated in 2020). This analysis also included in its definition of chronic conditions substance use disorder, mental health, obesity, HIV, hepatitis C, and intellectual and developmental disabilities. In total, 35 chronic conditions were included and were further grouped into 3 broad categories: behavioral health, physical health, and cognitive impairment conditions. Specific conditions within these groupings include:

  • Behavioral health conditions: Any mental health condition and any substance use disorder. See KFF’s brief, “5 Key Facts About Medicaid Coverage for Adults with Mental Illness,” KFF brief “SUD Treatment in Medicaid: Variation by Service Type, Demographics, States and Spending,” and the Urban Institute, Behavioral Health Services Algorithm for additional details (Victoria Lynch, Lisa Clemans-Cope, Doug Wissoker, and Paul Johnson. Behavioral Health Services Algorithm. Version 4. Washington, DC: Urban Institute, 2024).
  • Physical health conditions: Hypertension, transient ischemic attack, acute myocardial infarction, hyperlipidemia, ischemic heart disease, atrial fibrillation, heart failure, obesity, chronic obstructive pulmonary disease, pneumonia, asthma, diabetes, arthritis, hip fracture, osteoporosis, cataracts, glaucoma, chronic kidney disease, colorectal cancer, endometrial cancer, urologic cancer, prostate cancer, lung cancer, breast cancer, hepatitis, HIV, anemia, hypothyroidism
  • Cognitive impairment conditions: Alzheimer’s, intellectual and developmental delay, Parkinson’s, and dementia

Appendix

Medicaid Expansion Enrollment
Medicaid Expansion Spending

Coverage of Breast Cancer Screening and Prevention Services

Published: Apr 24, 2025

Among women in the United States, breast cancer is the most diagnosed cancer and the second leading cause of cancer death. In 2021, an estimated 4 million women in the U.S. were living with breast cancer. The Affordable Care Act (ACA) and many state laws have provisions that assure that most women with private insurance, Medicaid, and Medicare have coverage for breast cancer screening services. This typically includes mammography but can also include genetic testing and preventive medications for high-risk women over the age of 35. This factsheet discusses breast cancer screening and prevention services and reviews the scope of private and public insurance coverage, as well as access to those services, for women in the U.S.

Breast Cancer in the United States

Breast cancer makes up about 16% of all new cancer diagnoses in the U.S., and approximately 1 in 8 women will be diagnosed with breast cancer during their lifetime. In 2025, there will be an estimated 316,950 new cases of female breast cancer and 42,170 deaths attributable to breast cancer in the U.S. Breast cancer is most often diagnosed among middle-aged and older women, with 71% of new cases diagnosed among women 55 and older (Figure 1).

Seven in Ten Cases of Breast Cancer in the United States are Diagnosed Among Women Age 55 and Older

Most breast cancers are diagnosed at an early stage. Sixty-six percent of breast cancers diagnosed are localized, meaning they are found only in the organ in which they started; 25% are regional, meaning the cancer has spread to surrounding organs; and 6% have metastasized, meaning the cancer has spread to other regions of the body. Risk factors for breast cancer include, but are not limited to, a personal or family history of breast cancer, genetic predispositions, breast density, obesity, drinking alcohol, early menstruation, and delayed menopause.

In the U.S., while white women have the highest incidence of breast cancer, black women have higher breast cancer mortality rates (Figure 2). These disparities are likely attributable to a combination of factors, such as differences in stage at diagnoses, as well as disparities in access to screening, follow-up care, and treatment.

Breast Cancer Incidence and Mortality Rates in the U.S., by Race/Ethnicity, 2017-2021

Although very rare (less than 1%), men can develop breast cancer. In 2025, there will be approximately 2,800 cases of male breast cancer diagnosed and 510 deaths.

Breast Cancer Preventive Services

While several health organizations issue guidelines for breast cancer screening and prevention, private insurance coverage of clinical preventive services under the ACA is governed by recommendations from the United States Preventive Services Task Force (USPSTF) and the Health Resources and Services Administration (HRSA). The Women’s Preventive Services Initiative (WPSI) is the group that works with HRSA by providing clinical recommendations for preventive services specific to women and makes coverage recommendations to HRSA for breast cancer screening. Under these guidelines, private group and individual insurance plans and state Medicaid expansion programs must cover the following breast cancer screening and prevention services at no cost to the consumer: 1) screening mammography at least every 2 years and as frequently as once a year for women ages 40 to 74 with average-risk for breast cancer; 2) genetic counseling and testing for mutation of the BRCA1 and BRCA2 genes in some women with a personal or family history of breast, ovarian, fallopian tube, or peritoneal cancer; 3) preventive medication for some women with elevated risk of breast cancer and at low risk for adverse medication effects (Table 1). Some medical professionals recommend other services for women at higher risk for breast cancer, but these services are not currently subject to the ACA’s preventive services coverage requirement. The ACA’s preventive services requirement is currently the subject of ongoing litigation in the case Kennedy v. Braidwood Management. Depending on the eventual outcome of that case, there could be changes to preventive services requirements in the future.

Breast Cancer Preventive Services Covered Without Cost-Sharing, as of April 2025

Mammography Utilization

Screening mammography is a low-dose x-ray that provides images of the internal structures of the breast and is the most common screening test for breast cancer.

Current HRSA guidelines—which define no-cost coverage standards for private insurance—and WPSI recommend biennial screening mammography to start no earlier than age 40 and no later than age 50 for average-risk women and continue through at least age 74, while the USPSTF breast cancer screening guidelines recommend biennial screening mammography for women aged 50 to 74, and states that starting mammography screening before age 50 should be an individual decision based on preference and patient values. The USPSTF also concludes that there is insufficient evidence to assess the benefits and harms of screening mammography for women 75 years and older.

In 2022, 77% of women ages 50-74 reported having had a mammogram in the past two years (Figure 3). Screening rates are higher among women with insurance (74%) compared to those without insurance (37%).

Mammography Rates Among Women in the U.S., 2022, by Select Characteristics from the Behavioral Risk Factor Surveillance System

Mammography use varies by state (Figure 4). Among women ages 50-74, Rhode Island reported the highest rate of mammography use (85.5%) whereas Wyoming reported the lowest rate (64%).

Mammography Rates in the U.S. by State, 2022, from the Behavioral Risk Factor Surveillance System

Breast Density

Breast density refers to the amount of fibrous and glandular tissue (or, fibroglandular tissue) in the breast compared to the amount of fatty tissue. Dense breasts have more fibroglandular tissue, while less dense breasts have more fatty tissue.  Although breast density is a risk factor for developing breast cancer, breast density changes naturally throughout one’s lifetime, and dense breasts are very common—nearly half of women over 40 years old who have had a mammogram have dense breasts. As of September 2024, the U.S. Food and Drug Administration (FDA) requires mammography facilities to report the presence of breast density detected by imaging to both patients and providers.

Mammograms are the most used imaging method for breast cancer screening, but dense breasts can be difficult to interpret with this technique. Fibroglandular tissue and masses in the breast appear similarly in mammogram images, meaning cancerous masses may go undetected in someone with dense breasts. Consequently, additional imaging such as ultrasound, MRI, or digital breast tomosynthesis (DBT) may be required to complete a breast cancer screening. However, follow up imaging for women with dense breasts is not currently required to be covered by insurance as preventive services.

Genetic Testing and Screening for BRCA 1/ BRCA 2 Mutations

Mutations to the tumor suppressor genes BRCA1 and BRCA2, increase the risk of female breast and ovarian cancers, as well as fallopian tube, peritoneum, pancreatic, and skin cancers. While almost 13% of women in the general population will develop breast cancer at some point in their lives, over 60% of women who have inherited a mutation in either BRCA1 or BRCA2 will develop breast cancer in their lifetime. Factors associated with an increased likelihood of having a harmful BRCA1 or BRCA2 mutation include: personal or family history of breast cancer diagnoses before age 50, cancer in both breasts, both breast and ovarian cancers in the same individual, reoccurring cases of breast cancer, family history of BRCA mutations, cases of male breast cancer, and being of Ashkenazi Jewish descent.

Currently, the USPSTF recommends that primary care providers use a familial risk assessment tool to screen women who have a personal or family history of breast, ovarian, tubal, or peritoneal cancers or have an ancestry associated with BRCA 1/2 gene mutations. It is also recommended that women with positive screenings receive genetic counseling and, if necessary, BRCA genetic testing. This screening is required to be covered by insurance plans without cost sharing as a preventive service due to the USPSTF recommendation.

Preventive Medication

The use of medications to help reduce the risk or delay the onset of cancer is called chemoprevention. Raloxifene and aromatase inhibitors are two medications used to reduce primary breast cancer risk in postmenopausal women, while tamoxifen reduces risk in premenopausal women and women who do not have a uterus. The USPSTF recommends that clinicians should discuss and offer to prescribe these risk-reducing medications to some women 35 and older who are at an increased risk for breast cancer and at low-risk for adverse medication effects. This is covered without cost-sharing for those with private insurance or under Medicaid expansion. While Medicare covers chemoprevention, patients may be subject to cost-sharing for these drugs. It is recommended that women who are not at an increased risk for breast cancer should not take these medications prophylactically.

Programs for Breast Cancer Services

Most women with public and private insurance have coverage for breast cancer screening services, but the scope of coverage can differ based on the type of insurance plan, how they qualify for Medicaid, and in the case of Medicare, where they live. While there are programs to assist uninsured and underserved women, these programs only reach a fraction of eligible women.

  • Private Individual and Group Insurance Plans—The ACA requires most private group and individual insurance plans (including most employer plans) to cover recommended preventive services with an “A” or “B” rating from the USPSTF, as well as preventive services recommended by HRSA, without consumer cost-sharing. In addition to covering the full cost of mammograms starting at age 40, plans must cover genetic screening and preventive medication for high-risk women. Currently, there is ongoing litigation over the scope of the preventive services requirement in the case, Braidwood Management Inc. v. Becerra, which could affect coverage policy of preventive health services in the future.
  • Medicaid— Under the ACA, women who qualify for Medicaid through their state’s Medicaid expansion are entitled to the same screening and preventive services as women who are covered by private insurance. Traditional Medicaid programs consider breast cancer screening and preventive services to be “optional” and the scope of coverage is determined by the state. A 2021 state survey of Medicaid programs, however, found that most states cover breast cancer screening and prevention services under both expansion and traditional eligibility pathways.
  • Medicare—Medicare Part B covers annual screening mammograms at no-cost for women 40 and over. Coverage for BRCA genetic testing is not required nationally, but may be covered in some regions based on local coverage determinations. Women enrolled in a Medicare Part D drug plan who are at high-risk for breast cancer may have coverage for chemoprevention drugs, but there is no requirement for Part D plans to cover these drugs without cost sharing.
  • TRICARE—TRICARE, the public program for military personnel and dependents, covers screening mammography for women 40 and older, BRCA genetic counseling, and chemoprevention, but is not required to offer coverage without cost-sharing. Out-of-pocket costs for consumers vary by an individual’s specific level of TRICARE coverage and active-duty status.
  • The National Breast and Cervical Cancer Early Detection Program (NBCCEDP)—The NBCCEDP is a CDC program that helps low-income, uninsured, and underinsured women access breast and cervical cancer screening, diagnostic, and treatment services. Uninsured and underinsured women are eligible for the program if they are at or below 250% Federal Poverty Level (FPL) and are between the ages of 40 to 64 for breast cancer screenings. In 2023, 273,989 women received NBCCEDP-funded breast cancer services, including mammograms, screening MRIs, clinical breast exams, and diagnostic services.
  • The Breast and Cervical Cancer Prevention and Treatment Act (BCCPTA)—Passed in 2000, the BCCPTA gives states the option to extend Medicaid coverage to uninsured women under 65 who are diagnosed with breast or cervical cancer through NBCCEDP-funded screening programs. Although all states and D.C. provide full Medicaid benefits to women who receive breast cancer treatment through the NBCCEDP, eligibility requirements may vary by state. In 2001, the Native American Breast and Cervical Cancer Treatment Technical Amendment Act was passed to extend eligibility to American Indian and Alaska Native women who qualify for health services through a tribal organization or the Indian Health Service.

VOLUME 21

Public Perception of Measles Vaccines and Unsubstantiated Treatment Claims


Summary

This Monitor shares new findings from the latest KFF Tracking Poll on Health Information and Trust and examines the false promotion of budesonide and clarithromycin for treating measles. It also explores misrepresentations of safe syringe programs and how prompting strategies can improve accuracy of AI chatbots when answering health-related questions.  


As the U.S. faces rising measles cases across multiple states and the highest number of cases since 2019, the latest KFF Tracking Poll on Health Information and Trust finds that most adults – including most parents – say they have heard at least one of several false claims about measles or the vaccine used to prevent it. About six in ten adults (63%) and a similar share of parents (61%) say they have read or heard the false claim that the measles, mumps, and rubella (MMR) vaccines have been proven to cause autism in children and one in five adults and similar shares of parents (17%) have heard the false claim that vitamin A can prevent measles infections. One in three adults (33%) say they have heard or read the false claim that the measles vaccines are more dangerous than being infected with measles, an increase of 15 percentage points from March 2024.

While fewer than 5% of adults say they think each claim is “definitely true,” less than half identify each as “definitely false.” Consistent with previous KFF polling, most adults express some uncertainty, saying it is either “probably true” or “probably false” that vitamin A can prevent measles infections (70%), that the MMR vaccines have been proven to cause autism in children (62%), or that measles vaccines are more dangerous than measles infections (54%). While at least half of adults express uncertainty, across partisans, Republicans and independents are more likely than Democrats to believe or lean toward believing each false claim about measles, with similar partisan gaps found among parents.

At Least Half of the Public are Uncertain When it Comes to False Claims About Measles, Saying Such Claims are Either Probably True or Probably False

Believing or leaning toward believing false claims about measles and MMR vaccines is associated with whether parents keep their children up to date on recommended vaccines. Among parents who say that at least one of the three false claims about measles is either “definitely” or “probably true,” a quarter (24%) say they have delayed or skipped some vaccines for their children, compared to about one in ten parents (11%) who say each of the three myths are “probably” or “definitely false.” The survey did not measure whether parents have specifically skipped the MMR vaccine for their children. 


Recent Developments

Some Health Professionals Use Budesonide and Clarithromycin to Treat Measles Without Evidence

Natalya Maisheva / Getty Images

As measles outbreaks continue to spread across the U.S., the measles, mumps, and rubella (MMR) vaccine remains the most effective form of prevention. There is no medical treatment for measles once infection occurs, but ongoing skepticism and misinformation about vaccine safety may discourage some from vaccinating themselves or their children. In some cases, individuals seeking alternatives to vaccination may turn to non-evidence-based treatment methods that can be harmful and may delay necessary clinical care. In Texas, hospitals have reported cases of pediatric patients admitted with both measles and vitamin A toxicity, following online promotion of high-dose vitamin A as a treatment, despite no medical consensus supporting its use.

At the same time, some health care providers in Texas have recently made misleading claims that measles can be effectively treated with budesonide, a steroid typically used for asthma and Crohn’s disease, and clarithromycin, an antibiotic. However, there is no evidence these drugs are effective for measles, and both carry risks. Medical experts, including Dr. Paul Offit of the Children’s Hospital of Philadelphia and Dr. Adam Ratner of the American Academy of Pediatrics, told NBC that steroids like budesonide can suppress the immune system and should not be used early in viral infections like measles. False claims about budesonide’s effectiveness for preventing viral infections have circulated before when it was also wrongly promoted as a treatment for COVID-19. Those claims were based on preliminary research from Oxford that showed a relief of symptoms in mild cases of COVID-19, but did not reduce risk of hospitalization and death. Clarithromycin is also ineffective against viruses and generally not used to treat any secondary bacterial infections that arise from measles, which often require intravenous antibiotics like vancomycin and ceftriaxone. Unnecessary use of broad-spectrum oral antibiotics like clarithromycin may also increase the risk of antibiotic resistance.

The inaccurate claim that budesonide and clarithromycin can treat measles gained further attention after Health and Human Services (HHS) Secretary Robert F. Kennedy Jr. shared a post on X calling physicians who used these drugs to treat measles patients “extraordinary healers.” His post claimed that about 300 children in Texas had been successfully treated with budesonide and clarithromycin, but he later stated that vaccines are the best way to prevent measles. Other anti-vaccine social media users  amplified these claims, including a medical doctor with approximately 1.2 million followers on X who shared an article suggesting that budesonide could have prevented the death of a child in Texas.

False Claims Undermine HIV Prevention Efforts in Maine

Radule Perisic / Getty Images

Misleading claims about syringe service programs (SSPs), or needle exchange programs, may complicate local public health efforts in Maine to contain an ongoing HIV outbreak primarily affecting people who inject drugs and/or are unhoused. Since October 2023, the Maine CDC has reported a total of 23 cases related to an outbreak in Penobscot County, a sharp increase from the county’s average of two new diagnoses per year over the past five years. In response, the agency says it is working with community partners to increase access to HIV and hepatitis C testing, provide HIV and sexually transmitted infection (STI) prevention services such as post-exposure prophylaxis (PEP) and pre-exposure prophylaxis (PrEP), and offer SSPs—community-based initiatives that provide sterile syringes and safe disposal of used ones.

Articles about the outbreak were shared on Facebook and Reddit, where many commenters disparaged SSPs. Some falsely claimed that the programs increase drug use and cause infectious disease outbreaks, despite research showing that they reduce the spread of HIV. Extensive research, including a 2022 systematic review published in International Journal of Drug Policy, found sufficient evidence that SSPs prevent HIV transmission among people who inject drugs. The review also found that SSPs are likely to reduce injection risk behaviors and do not appear to be associated with an increase in injection frequency. Continued misleading claims about the effectiveness of SSPs may undermine support for evidence-based interventions in communities facing stigma and barriers to care.


AI & Emerging Technology

Study Highlights How AI Prompting Can Influence Health Misinformation Risk 

Lourdes Balduque / Getty Images

As people turn to AI for health information, the way patients phrase their questions may affect whether they receive accurate answers. A study in JAMIA Open explored how neuro-oncology patients could most effectively use large language models (LLMs) to answer health-related questions when reviewing their doctor’s notes. One study author – a neuro-oncologist – and one of their patients evaluated three widely available LLMs on 8 dimensions, including accuracy and evidence, using questions based on a doctor’s note from a neuro-oncology visit. The chatbots were tested with and without a prompt to act like an expert oncologist, and the questions were presented either in the order that the information appeared in the doctor’s note or in random order. Both the neuro-oncologist and their patient rated the responses highest across all 8 dimensions when the chatbots were instructed to act as an expert oncologist. However, all models scored low in their use of evidence, which may pose risks if people rely on these tools without understanding their limitations. Unlike search engines, LLMs are trained on large datasets and generate responses based on patterns, rather than by directly referencing verifiable sources. Because of these limitations, the study authors note that involving patients in the development of ethical guidelines could help strengthen existing efforts – such as the transparency requirements set by the Assistant Secretary for Technology Policy/Office of the National Coordinator for Health Information Technology’s (ASTP/ONC) AI assurance labs – to better limit AI-generated misinformation.

About The Health Information and Trust Initiative: the Health Information and Trust Initiative is a KFF program aimed at tracking health misinformation in the U.S., analyzing its impact on the American people, and mobilizing media to address the problem. Our goal is to be of service to everyone working on health misinformation, strengthen efforts to counter misinformation, and build trust. 


View all KFF Monitors

The Monitor is a report from KFF’s Health Information and Trust initiative that focuses on recent developments in health information. It’s free and published twice a month.

Sign up to receive KFF Monitor
email updates


Support for the Health Information and Trust initiative is provided by the Robert Wood Johnson Foundation (RWJF). The views expressed do not necessarily reflect the views of RWJF and KFF maintains full editorial control over all of its policy analysis, polling, and journalism activities. The Public Good Projects (PGP) provides media monitoring data KFF uses in producing the Monitor.

Future Reform of PEPFAR: Exploring the Use of a Graduation Policy

Author: Jennifer Kates
Published: Apr 23, 2025

Overview

As the Trump administration and Congress look to reform PEPFAR, and other U.S. global health programs, in part to ensure that aid does not continue forever, one potential approach is the use of a graduation policy and criteria – that is, metrics for determining when a country is ready to transition away from U.S. support. To inform such efforts, this policy brief reviews the graduation policies of five institutions and programs. Overall, the review identifies the following graduation approaches and components:

  1. The use of country-income to target graduation process and threshold
  2. The use of other (non-income based) criteria to target graduation process and threshold
  3. Timeframes that allow for scale-down and predictability
  4. Allowing for re-eligibility for assistance
  5. Accommodating exceptions and emergencies
  6. Continue to monitor countries after graduation

Introduction

Starting on day one of his second term, President Trump began instituting several executive orders and other actions that have fundamentally altered the U.S. global health response. These included an executive order calling for a 90-day foreign aid review (which has been extended for 30 days) and the freezing of almost all program operations; steps to dissolve USAID, the government’s main global health implementing agency; and the cancellation of most global health projects. Thus far, these steps have been blunt, causing significant service disruption in health services and loss of health capacity globally. Now, with the foreign aid review period drawing to a close, the administration has notified Congress of its intent to restructure remaining global health programs and institute reforms, including seeking to establish a more transactional model of aid with time-bound arrangements to ensure that aid does not continue forever, a position of the first Trump administration.  Indeed, as part of its foreign aid review, a survey sent to all U.S. foreign aid recipients included a question about whether they had a plan for transitioning projects from U.S. support.

Should the administration and Congress seek to move in this direction for PEPFAR, as well as other U.S. global health programs, one potential approach for putting time limits on aid is the use of a “graduation” policy and criteria – that is, metrics for determining when a country is ready to transition from U.S. support, as well as a process and timeline for scaling down that support (another such reform is progressive co-financing, which we discuss here). Some have recommended such an approach for PEPFAR, including at a recent Congressional hearing. With limited exception, however, the U.S. government has not used formal graduation criteria or eligibility cut-offs for its bilateral global health programs, including for PEPFAR.

To help inform such efforts, this policy brief reviews the graduation policies of five institutions and programs, including three international institutions – Gavi, the Vaccine Alliance (Gavi), The Global Fund to Fight AIDS, Tuberculosis and Malaria (Global Fund), and the World Bank’s International Development Association (IDA) – and two U.S. programs – the Millennium Challenge Corporation (MCC) and USAID’s family planning program (due to the administration’s foreign aid review, the family program is currently not operating). Specifically, it looks at the measures used to initiate and conclude graduation processes, the timeframe for graduation, whether exceptions are made, and whether re-eligibility is allowed. Where data are available, it also identifies the number of countries that have graduated from assistance. Summary measures are provided in Table 1. Detailed information for each institution or program examined is provided in an Appendix.

Findings

Each of the five models examined uses varying criteria, timeframes, and processes for determining when a country is ready to transition from donor assistance. There are also some commonalities.

Table 1
Summary of Graduation Criteria and Process
Institution/ProgramIncome CriteriaOther CriteriaScale-down w/ economic growthTimeframe to Graduation After threshold Re-Eligibility Allowed Exceptions Allowed Number Graduated
GaviYesNoYes8 yrsYesYes19
Global FundYesYesYesAt least 3 yrsNoYes11
IDAYesNoYesAverage of 6 yrsYesYes46
MCCYesNoYesAt least 5 yrsYesYesUnknown
USAID FPNoYesUnknown2-6 yrsUnknownUnknown25
See Appendix for detailed information and sources. 
  1. Use of country-income to target graduation process and threshold. Four of the five models examined (Gavi, the Global Fund, IDA, and MCC) explicitly use country-income to determine in full or in part the threshold for ending assistance, and in most cases, to trigger a process for doing so. In addition, they each adjust their support downward as a country’s income rises but before it officially graduates (Gavi, the Global Fund, and MCC require increased co-financing and IDA tightens its financing terms). The Global Fund also uses an allocation formula that channels most funding to the lowest income countries. In PEPFAR’s case, while funding is provided to low and middle-income countries, there has been no policy to adjust or scale down financing as a country’s income increases. A graduation policy, using income as a criteria and scaling down support as income increases, would allow for a more defined and explicit way to move countries toward a graduation threshold and channel most support to countries with lower incomes.
  2. Use of other (nonincome based) criteria to target graduation process and threshold. Three of the five models examined (the Global Fund, IDA, and USAID’s family planning program) also use other, non-income-based criteria to assess graduation readiness (Gavi and MCC are the exceptions and only use income). The use of non-income-based measures, particularly in a health context, may be helpful for providing a fuller assessment of a country’s readiness for graduation and mitigating against negative health outcomes. The Global Fund, for example, also uses epidemiological criteria specific to each of the three diseases it targets (HIV, TB, and malaria). Thus, countries that reach upper middle-income status will only remain eligible if they also meet eligibility criteria for one of the disease components. IDA, in addition to income, also looks at “credit worthiness” (e.g., a country’s ability to service new external debt at market interest rates over the longer term) to help determine graduation readiness. The USAID family planning program only uses non-income-based criteria to trigger a graduation process, focused on two main measures: total fertility rate and modern contraceptive prevalence rate (other factors considered include access and quality measures and the extent which family planning products, services, and programs are financed domestically). PEPFAR has already been grouping countries into categories based on the status of their HIV epidemics, measures which could be incorporated into a graduation policy, in addition to income.
  3. Timeframes that allow for scale-down and predictability. Each of the models examined allows for a multi-year period from the time a country reaches the eligibility threshold until full graduation from assistance, rather than an abrupt eligibility cliff, an approach designed to support planning and predictability. For Gavi, once a country reaches the last of three phases of eligibility (after exceeding the World Bank’s low-income threshold, based on a 3-year average), it has eight years before assistance actually ends. For the Global Fund, once a country is no longer eligible for assistance (after exceeding the World Bank’s upper-middle income threshold and no longer meeting any disease component criteria), it may receive “transition funding” for one additional allocation period of three years. If a country’s disease component becomes ineligible during an allocation period, the country remains eligible for Global Fund support for the duration of that period. The Global Fund also publishes projected graduation dates for countries, allowing for longer term planning, and conducts graduation readiness assessments. For IDA, while there is no set timeframe for graduation, there is an expectation that once a country reaches the graduation eligibility threshold, it will transition “within a reasonable timeframe” (which has typically been two IDA replenishment cycles or six years). For the MCC, the income eligibility threshold applies only to initial selection for a five-year compact but once selected, the MCC can continue to develop and implement the program even if the country no longer meets income eligibility during this time or during the compact itself. This means that the period between when a country first surpasses the income eligibility threshold and when it graduates from MCC assistance is at least five years but may be longer. USAID’s family planning program did not specify a graduation timeframe but most countries that graduated did so between two and six years after they met the threshold for starting the graduation process.
  4. Allowing for re-eligibility for assistance. Three of the five models examined (Gavi, IDA, and MCC) explicitly allow for a country to become re-eligible for support should it meet eligibility criteria in the future. Gavi also allows some formerly eligible countries to receive support to prevent back-sliding in vaccine coverage and support the introduction of key missing vaccines, in certain cases, even if they do not meet eligibility criteria. On the other hand, the Global Fund does not allow for re-eligibility and USAID’s family planning policy does not specify whether a country could again qualify for support if it were to meet eligibility criteria. Permitting re-eligibility would allow PEPFAR to account for changing country circumstances that could affect service delivery and health outcomes, though it could also create unpredictability about the availability of U.S. resources in the future.
  5. Accommodating exceptions and emergencies. Three of the five models examined allow for exceptions to graduation policies and criteria. Exceptions generally allow for longer graduation periods and/or less stringent criteria. Gavi, the Global Fund and IDA, for example, all make such exceptions for Small Island Developing States, a group of states that face unique social, economic, and environmental vulnerabilities, which are provided longer graduation periods (and in some cases, higher income thresholds). Gavi also has a “Middle-Income Country (MIC) Approach”, a policy that enables former and never eligible countries, as well as certain others, to receive funding to prevent back-sliding in vaccine coverage and to support introduction of key missing vaccines, and to help those facing emergencies access support to maintain routine immunization. The Global Fund has several exceptions. First, it allows non-eligible countries facing emergencies that adversely impact progress against the three diseases to be granted exceptional funding, subject to Board approval and availability of funds. It also allows UMICs that no longer meet HIV eligibility to be eligible for support to directly finance NGOs and civil society organizations where there are barriers to reaching key populations in a country. Finally, the Global Fund allows countries that no longer meet eligibility criteria but are part of a multi-country application to be eligible if the majority of countries included are eligible for funding in their own right. IDA allows, on a case-by-case basis, for “exceptional temporary access” to assistance for countries facing emergencies, conflicts, or other challenging conditions. While the MCC does not have exceptions to its graduation threshold, it does allow for exceptions to its country contribution requirement, made on a case-by-case basis, to account for emergencies and conflict.
  6. Continuing to monitor countries after graduation. To varying extents, the institutions and programs examined continue to monitor countries after graduation, to assess whether they have been able to sustain program outcomes and identify potential backsliding due either to the loss of assistance or other factors. Gavi and the Global Fund, for example, have conducted evaluations of their sustainability policies and subsequently adjusted their graduation criteria and approach over time. IDA has also conducted such reviews to assess graduation policies, and there have been multiple analyses of USAID’s family planning graduation process, which also adjusted over time.

Potential Lessons for PEPFAR

These examples, including some from the U.S., may help point the way to the type of indicators and processes that could be used for PEPFAR, as well as other U.S. global health programs, should the administration and Congress seek to institute a graduation policy. Collectively, they suggest that income is a common criteria for determining a graduation threshold, as well as for scaling down resources with economic growth. They also suggest that combining income with disease or other health criteria may be a way to mitigate against negative health outcomes. Other policy components identified include relaxing graduation criteria and timeframes in exceptional or emergency situations and allowing for re-eligibility should a country once again meet eligibility criteria. Additionally, a common finding identified across all institutions examined is that graduation from assistance is not a short process and typically takes several years to plan for and complete.

Appendix

Graduation Criteria for Select Global Health and Development Organizations and Programs

Institution/ Program

Eligibility CriteriaGraduation Threshold Criteria Graduation Timeframe & Number Graduated Re-Eligibility & Exceptions
Gavi, the Vaccine Alliance (Gavi)Country eligibility based on income criteria, as calculated by the World Bank Atlas Method for determining gross national income per capita (GNI p.c.). Eligibility is divided into three phases, which determine the amount of co-financing required and the path toward graduation:
  • Initial self-financing (GNI p.c. less than or equal to the World Bank low-income threshold; co-finance of flat amount per vaccine)
  • Preparatory transition (GNI p.c. greater than the World Bank low-income threshold but less than accelerated transition phase, although in certain cases, this phase may be extended by two years; co-finance % of each vaccine, with 15% increase per year)
  • Accelerated transition (3-year average GNI p.c. and most recent GNI p.c. great than low-income threshold; co-financing at least 35% of vaccine costs).
After a country has been in the accelerated transition phase (in 2025, the income threshold was <= to $1,820) for 8 years, it is no longer eligible for Gavi support.

Gavi support is scaled down as a country’s income increases (co-financing requirements increase).


Accelerated transition (the final phase of eligibility) lasts for eight years (Small Island Developing States have twelve years).

After eight years, a country becomes fully self-financing and can no longer access new financial support.

19 countries have graduated from Gavi support since the graduation policy was first adopted in 2009.


Any formerly eligible country whose GNI p.c. drops below the low-income or Gavi-eligibility threshold, based on its most recent GNI p.c. in any given year, will be reclassified into the appropriate eligibility transition phase.

Exceptions are made (via the Middle Income Approach) for former eligible, never eligible, and some IDA eligible countries to receive support to prevent back-sliding, support introduction of missing vaccines, and, for those with emergencies, help maintain routine vaccination.

Global Fund to Fight AIDS, Tuberculosis and Malaria (Global Fund)Country eligibility based on both income criteria, as calculated by the World Bank Atlas Method for determining GNI p.c. (using the latest three-year average), and disease burden criteria:
  • All low and lower-middle income countries, as defined by GNI p.c., are eligible to receive support for HIV/AIDS, tuberculosis (TB) and malaria, regardless of disease burden.
  • Upper-middle income countries (UMICs) are eligible to receive support if they meet additional requirements by disease component and, for HIV, are on OECD DAC List of ODA recipients. If not, a country may be eligible for HIV support to directly finance NGOs and civil society organizations if there are demonstrated barriers to providing funding for interventions for key populations.
  • UMICs classified as IDA-eligible Small States, including Small Island Economies, are eligible regardless of national disease burden.
  • Countries with existing grants otherwise ineligible due to disease burden or income level that are experiencing conflict/challenges may continue to be eligible.
  • Multi-country applications are eligible if the majority (i.e., at least 51 percent) of countries included are eligible for funding in their own right.
Once a country reaches UMIC status, it is no longer eligible for funding if it does not meet any disease component requirements. Country disease components that become ineligible during an allocation period will remain eligible for the duration of that period. The Global Fund works with countries to plan for transition by conducting transition readiness assessments.

Global Fund support is scaled down as a country’s income increases (co-financing requirements increase).


When a country disease component becomes ineligible for Global Fund support, it may receive one additional allocation period (three years) of transition funding.

11 country disease components have graduated from Global Fund support since the graduation policy came into effect in 2017 (additional country components transitioned from support before the policy was implemented).

Once a country disease component receives transition funding or voluntarily transitions from Global Fund support, it is no longer eligible but will continue to be considered eligible for multi-country approaches provided it is not a high-income country.

Exceptions are made for non-eligible countries facing emergencies that adversely impact progress against HIV, TB and malaria may be granted exceptional funding, subject to Board approval and availability of funds. There may also be an exception made for countries with an unusual increase in malaria cases.

International Development Association (IDA)Country eligibility based on income criteria, as calculated by the World Bank Atlas Method for determining GNI p.c. and set below an IDA operational cut-off level adjusted annually. IDA is prohibited from assisting countries if it determines financing is available from private sources on reasonable terms or could be provided by IBRD. These “creditworthiness” determinations” are based on a country’s ability to service new external debt at market interest rates over the longer term.Once a country reaches the IDA operational cut-off level ($1,335 in 2025), there are three phases of graduation to IBRD-only financing:
  • Gap phase: countries above the IDA operational cut-off for over two years but not yet creditworthy for IBRD financing.
  • Blend phase: countries with a positive creditworthiness assessment by IBRD.
  • IBRD-only phase: countries no longer eligible for IDA.

For small island economies above the operational cutoff, an exception may be made to allow them to remain classified as IDA-only countries due to characteristics that affect their creditworthiness and access to finance.

IDA support is scaled down as a country’s income increases (financing terms are tightened).

No specific timeframe set and instead is dependent on several factors including individual country circumstances and access to financing from other bilateral and multilateral sources.

Expectation is that countries will transition from blend to IBRD-only status “within a reasonable timeframe” (typically has been two IDA replenishment cycles or six years).

46 countries have graduated from IDA support since its founding in 1960.

If a formal determination is made that an IBRD borrower previously assessed as creditworthy and graduated from IDA is subsequently confronted with adverse circumstances rendering it non-creditworthy for IBRD financing, it is once again eligible for IDA.

Exceptional temporary access to IDA has been provided on a case-by-case basis in the face of emergencies, conflicts, or other challenging conditions.


Millennium Challenge Corporation (MCC)Country eligibility based on income criteria, as calculated by the World Bank Atlas Method for determining GNI p.c., and set =< the World Bank threshold for initiating the IBRD graduation process for the fiscal year ($7,895 in 2025). In addition, countries must meet several, measurable good governance criteria to be eligible. Selection is competitive. If successful, country enters into five-year compact (the MCC also has a “threshold program” which assists promising candidate countries to become compact eligible). After five years, if a country remains eligible, there is a possibility to be considered for another compact (subject to more rigorous standards).Once country income surpasses the threshold, it is no longer eligible for MCC support. However, the income threshold for countries applies to initial selection for eligibility for an MCC compact program; once selected for a compact, the MCC can continue to develop and implement the program even if the country surpasses the income threshold during the development or implementation phase of the program.

MCC support is scaled down as a country’s income increases (co-financing requirements increase).

For a country that no longer meets the income criteria, graduation would occur only after the compact ends. This means that the period from initial eligibility for selection to compact completion and graduation would be at least five years (potentially including the time it took to be selected and prepare the compact).

Unknown how many have graduated after receiving support.

Any country that is below MCC’s income threshold in a given fiscal year can be considered for an MCC program, including countries that have previously graduated out of income pool.

Exceptions to country contributions may be made on a case-by-case basis and can take into account emergencies and conflict.

USAID Family Planning (FP) ProgramNone specified. The Foreign Assistance Act of 1961 and official guidance do not specify any formal eligibility criteria for development assistance, although most support has been provided to low- and middle-income countries. This has been the case for USAID’s family planning (FP) program, which began in the 1960s. The FP program further concentrated its efforts in countries that had high rates of unmet need for FP, prevalence of high-risk births, and low contraceptive use.A country is eligible for graduation once the following indicators have been reached:
  • Modern contraceptive prevalence rate of at least 51%
  • Total fertility rate at or below 3.1 children per woman
  • Other factors considered are:
  • At least 80% of the population can access at least three family planning methods
  • No more than 20% of family planning products, services and programs offered in the public and private sectors are subsidized by USAID
  • Major service providers in all sectors (public, non-governmental, commercial) can meet and maintain standards of informed choice and quality of care.
No specific timeframe set. Process could take 2-10 years, with

most countries graduating in 2-6 years.

25 countries had graduated from USAID family planning support since 1976 (as of 2020).


No country that has graduated from family planning assistance had backslid to a point where they might have been re-eligible.

Sources

 GAVI

Global Fund

IDA

MCC

USAID Family Planning Program

  • CRS, U.S. Bilateral International Family Planning and Reproductive Health Programs: Background and Selected Issues, 2020: https://www.congress.gov/crs-product/R46215
  • Angela K Shen AK, Farrell MM, Vandenbroucke MF, Fox E, Pablos-Mendez A, “Applying lessons learned from the USAID family planning graduation experience to the GAVI graduation process”, Health Policy and Planning, Volume 30, Issue 6, July 2015: https://doi.org/10.1093/heapol/czu045
  • USAID Graduation from Family Planning Assistance: Implications for Latin America, October 2011.

What Does the Future Hold for Ending the HIV Epidemic Initiative (EHE)?

Authors: Lindsey Dawson and Tenzin Dhondup
Published: Apr 23, 2025

The Ending the HIV Epidemic Initiative (EHE) is a federal effort to address the HIV epidemic in the United States, by bringing new resources aimed at reducing the number of infections. EHE set the ambitious goals of reducing HIV incidence by 75% in five years and by 90% in ten years by focusing activities within four “pillars”: diagnose, treat, prevent and respond. The effort prioritizes 48 counties that had the highest number of HIV diagnoses between 2016 and 2017, San Juan, Puerto Rico, Washington D.C., and seven states with a substantial rural burden. It was created by the first Trump Administration, announced during the 2019 State of the Union, and continued by the Biden Administration. While there has been no formal announcement, a leaked document detailing budget and restructuring plans for the Department of Health and Human Services (HHS) suggests there will be significant changes to the federal HIV response, including eliminating the EHE. The leaked document is not official policy and not a final budget request. While Congress could still theoretically fund the initiative, it appears the Trump Administration is not currently planning to champion the effort.

This analysis examines what EHE has done to date and what its future might look like under the new administration.

CEnding the HIV Epidemic (EHE) Priority Jurisdictions –  Local Jurisdictions

What has the EHE done?

Funding

One of the primary changes the EHE made to the federal HIV landscape was to increase funding to core HIV programs, particularly the Centers for Disease Control and Prevention’s (CDC) HIV prevention branch and the Health Resources and Services Administration’s (HRSA) Ryan White HIV/AIDS Program. For many years, HIV funding at these core programs had been relatively flat and not keeping pace with inflation, increasing biomedical costs, and increases in HIV prevalence. The EHE infused new federal funding into these programs, as well as to HIV efforts at HRSA’s Health Centers program, the National Institutes of Health (NIH), and the Indian Health Service (IHS). In its first year, 2019, a small amount of funding was reprogrammed from other accounts to support the EHE and in FY 2020, Congress provided new funding which has continued over time. In FY 2024, the last budget year with known appropriated levels, EHE funding totaled $573.25 million, with the largest allocations going to CDC for prevention ($220 million) and Ryan White for care and treatment ($165 million). While these amounts represented the first major increases for these and other programs, they represent a fairly small increase in overall budgets. With these small increases, recipient agencies were able to conduct a range of activities to support the four pillars as discussed below. (See KFF’s EHE Funding Tracker for details on EHE funding.) Loss of EHE funding would return these programs to funding levels of a decade ago.

CDC HIV Prevention Funding Increases Were Driven by EHE Funding, FY2014-FY024

EHE Activities

EHE funding has supported the following activities across a range of HHS agencies:

  • The Ryan White HIV/AIDS Program (within HRSA) is the nation’s HIV safety-net program providing care, treatment, and support services to about half of all people with HIV. EHE funding extends the reach of the program and especially focuses on engaging people who are newly diagnosed in HIV care and treatment and reengaging others who have fallen out-of-care. It also supports training activities. Specific outcomes from Ryan White EHE efforts inlcude:
    • The number of clients newly engaged in care and served by EHE-funded Ryan White providers nearly doubled between 2020 (11,792) and 2022 (22,001), an increase of 87%.
    • The estimated number of clients re-engaged in HIV care and served by EHE providers nearly tripled between 2020 (7,085) and 2022 (19,204), an increase of 171%.
    • EHE funding also afforded grantees greater flexibility to cover certain services more comprehensively, such as psychiatry, intensive case management, housing, and trauma-informed care, among others.
  • The health center program (also within HRSA) provides care to tens of millions of people, including for those with limited resources. Health centers have historically provided some HIV care and prevention services and EHE allowed them to extend their reach in this area. Specific outcomes from Health Center EHE efforts inlcude:
    • The number of patients served with PrEP services in EHE funded health centers increased by 26% (compared to a 4% increase across health centers nationwide) between 2021 and 2023.
    • The number of HIV tests conducted increased by 119% in EHE funded health centers (compared to a 62% increase across health centers nationwide) between 2020 and 2023 .
      • In 2022, 55% of clients (ages 15-65) in EHE funded health centers had ever been tested for HIV compared to 37% of clients in health centers that did not received EHE funding.
      • Between 2020 and 2023 the share of health center patients diagnosed with HIV for the first time increased by 52% among those served within EHE funded health centers, compared to 32% between nationwide.
    • In 2022, 86% of patients in EHE funded health centers were seen within 30 days of first HIV diagnosis, compared to 76% in non-EHE funded health centers.
    • The share of health center patients with an HIV diagnosis increased 6% between 2019 (196,218) and 2023 (207,970), likely reflecting increases in HIV testing and linkage to care. (Data from KFF analysis of the HHS/HRSA Uniform Data System (UDS) 2019-2023.)
  • The Centers for Disease Control and Prevention is the backbone of U.S. HIV prevention efforts and supports EHE funded jurisdictions in developing local implementation plans to meet specific local needs, culture, and environments and providing resources to implement those plans. As such jurisdictions plans differ from one another and therefore success metrics for how CDC funding is used vary within each location but can include increasing PrEP uptake, reducing testing barriers, leveraging telehealth, for example. Specific outcomes between 2021 and 2023 include the use of CDC EHE funds to:
    • Provide >600,000 free HIV self-test kits
    • Provide >1 million HIV tests, newly diagnosing 4,600 people with HIV
    • Link 84% of people newly diagnosed with HIV to care within 30 days
    • Provide PrEP to 61,000 people
  • The National Institutes of Health, home to most federal HIV research funding and efforts, plays a role in EHE as well, to inform HHS and partners on evidence-based practices and effectiveness, including through making awards to Centers for AIDS Research (CFARs) and AIDS Research Centers (ARC) with research ranging thematically across centers.
    • Between FY19-FY23 NIH funded 248 projects with EHE funding with about half of projects focusing on HIV prevention and others focusing on diagnosis, treatment, and response.
    • Research findings are disseminated through publications, meetings, presentations, trainings/workshops, town halls, and across government.
  • The Indian Health Services (IHS) also receives EHE funding to address the HIV and other syndemics within Indian Country. IHS EHE funding supports three-year cooperative agreements (Ending the HIV Epidemic in Indian Country (or ETHIC)) to seven tribal/urban Indian organizations for work aimed at eliminating the syndemics of HIV, hepatitis C, and STIs. Among other activities, EHE funding has allowed awardees to:
    • create the HIV/HCV/STI Branch within the Office of Clinical and Preventive Services at IHS Headquarters and hire clinical and administrative staff
    • increase HIV/HCV/STI testing (IHS EHE-supported sites performed over 20,000 HIV test)
    • increase linkage to care
    • attend HIV syndemic-related training

What Does the Future Hold for EHE?

While the EHE brought new funding for HIV services across the country and that funding has driven a range of new activities aimed at addressing HIV, it now appears the new Trump administration will discontinue funding these efforts. Ending EHE aligns with several administration actions which have sought to limit HIV funding and reduce the size of the HHS workforce, with those working in HIV related fields especially impacted. Multiple branches within the CDC’s Division of HIV Prevention were also eliminated and grantees have reported delays in receiving funding. In addition, recent reports that the administration seeks to cut CDC HIV prevention funding and the retraction of HIV related NIH grants also raises questions about its commitment to addressing HIV more broadly.  The administration is also seeking to conduct a reorganization within HHS, including with the creation of  a new agency, the Administration for a Healthy America (AHA). Per the press release, there are plans for AHA to consolidate activities from the Office of the Assistant Secretary for Health (OASH), HRSA, and other agencies. AHA will consist of multiple divisions, including one on HIV/AIDS. The leaked document appears to move the Office of Infectious Disease Policy (OIDP) at HHS to AHA. OIDP led on the EHE effort, providing coordination, management, and tracking progress, was thought to have initially been eliminated after all staff were let go in the earlier wave of firings. The Ryan White Program would also move to AHA and the document proposes eliminating the program’s EHE line as well as support for dental services, AIDS Education and Training Centers, demonstration programs, and the Minority AIDS Initiative.

While the leaked document is not formal policy, loss of EHE funding, federal coordination, leadership, expertise, and support, could reverse or stall recent successes. EHE jurisdictions would lose added flexibility that came with EHE funding at a time when state health budgets are strained and threats of Medicaid costs shifting to states loom. Such changes have the potential to lead to increases in new HIV infections, as well as disruptions in HIV care, both of which will have individual and population level impacts, setting back the recent gains made by the EHE.