Medicaid Covers at Least One in Five Hospital Inpatient Days in Nearly Every State

Published: May 5, 2025

The House and Senate are working on legislation to meet the requirements in the budget resolution, specifying cuts to Medicaid of up to $880 billion or more over 10 years. Large reductions in Medicaid spending are likely to have direct implications for the 83 million people covered by Medicaid, state budgets, and health care providers, including hospitals. Medicaid accounted for about one fifth (19%) of all spending on hospital care in 2023 and cuts to payments for care or loss of coverage could have implications for hospitals’ finances, the cost and quality of care, and people’s ability to access hospital services. There could be consequences for the broader economy too given that hospitals are the sixth largest employer in the country across industry subsectors.

To inform these discussions, this analysis describes the percent of inpatient hospital days that are covered by Medicaid (also referred to as the “Medicaid inpatient share”), nationally and by state. The analysis uses Medicare cost report data from 2023 (the most recent year available) and focuses on hospitals that are non-federal (see Methods for more details about the hospitals included and analysis).

Medicaid covered at least one in five inpatient hospital days in 48 states and the District of Columbia (hereafter referred to as a state) in 2023. Medicaid covered at least 25% of inpatient days in 30 states and at least 30% of days in 10 states (see Figure 1). The Medicaid share ranged from 11% in Wyoming to 37% in New Mexico. Medicaid covered about one in four (26% of) inpatient days nationally. Variation across states is driven by Medicaid eligibility levels—including whether a state has opted to expand under the Affordability Care Act—as well as demographics. Medicaid’s share of hospital use is likely higher than its share of hospital revenues in part because Medicaid payment rates are generally lower than what commercial insurers pay.

States with the highest Medicaid shares included a mixture of red and blue states. For example, among the 10 states with Medicaid shares of at least 30%, five were states that voted for President Trump in the 2024 election (Alaska, Kentucky, Louisiana, Nevada, and Oklahoma) and five were states that voted for Vice President Harris (California, Colorado, DC, New Mexico, and New York).

Medicaid covered about four in ten (41% of) births nationally in 2023, almost half (47%) of births in rural areas, and at least 40% of births in 26 states according to prior KFF analysis. The vast majority of births occur in hospitals.

Medicaid Covered 26% of Hospital Inpatient Days Nationally, and at Least 20% in Nearly All States

With hospital care accounting for about one third of Medicaid spending in 2023, large Medicaid cuts would be likely to affect hospitals. Some policy options under discussion would affect hospitals directly by reducing the payments made to hospitals through managed care organizations (by limiting what are known as state directed payments) or restricting states’ ability to fund Medicaid through provider taxes, which often support higher payments for hospitals. Also being considered are options to reduce federal spending on the Affordable Care Act (ACA) Medicaid expansion, which has helped improve hospital finances and may have especially benefited rural hospitals. The hospital industry has been lobbying Congress against proposed cuts, arguing that reductions in Medicaid spending would threaten access to hospital care for all patients—not just Medicaid beneficiaries—and the National Rural Health Association has argued that Medicaid spending reductions would lead rural hospitals to reduce or eliminate the services they offer or close altogether.

Also on the horizon is the expiration of the enhanced Affordable Care Act (ACA) subsidies in 2026; there would likely be implications for hospitals if the subsidies are allowed to expire, as the number of uninsured people would increase by 3.8 million per year on average according to Congressional Budget Office (CBO) projections.

This work was supported in part by Arnold Ventures. KFF maintains full editorial control over all of its policy analysis, polling, and journalism activities.

Methods

Data and Hospital Inclusion Criteria: This analysis relied on the RAND Hospital Data, a cleaned and processed version of the annual cost reports that Medicare-certified hospitals are required to submit to the federal government. The analysis included non-federal general short-term hospitals in the 50 states and the District of Columbia. The analysis excluded 47 hospitals that did not report total inpatient days, reported negative total Medicaid or inpatient days, or had a Medicaid share greater than 100%. These hospitals together represented 1% of non-federal general short-term hospitals in the 50 states and the District of Columbia (ranging from 0% in several states to 7% in Connecticut). The final sample included 4,400 hospitals.

We conducted a sensitivity analysis to assess how restricting to hospitals reimbursed under the inpatient prospective system (IPPS) would affect the results and found that it would have changed the results in each state by at most, one percentage point. Most IPPS hospitals directly report their Medicaid inpatient share, which is used for determining eligibility for Medicare disproportionate share hospital (DSH) status and the amount of DSH payments.

Calculation of Medicaid Shares: The analysis used the Medicaid inpatient share reported by hospitals to the federal government for the purposes of establishing Medicare DSH status and determining the amount of DSH payments for the 63% of hospitals in sample that reported that measure. For the 37% of hospitals that did not directly report their shares, the share was calculated from other lines in the cost reports. Medicaid days (the numerator) include Medicaid paid days and Medicaid eligible unpaid days. State shares reflect hospital shares weighted by the denominator (total inpatient days). When calculating shares or inpatient days, lines that were blank were treated as 0, including some instances where hospitals did not report any Medicaid days. Some hospitals had cost report periods that were less than or greater than 365 days, in which case days were scaled up or down to reflect a full year. Hospital data were sorted into fiscal year 2023 based on the mid-point of the reporting period.

Limitations: Cost report data are reported by hospitals and likely have some degree of inaccuracy. For example, it is possible that hospitals that are not part of the Medicare DSH program—which account for 41% of the hospitals in the sample and 7% of inpatient days—may have less incentive to fully account for Medicaid days, given that they do not receive Medicare DSH payments. In that case, the estimates in this analysis would be conservative. It is also possible that the data are inaccurate in other ways that could lead to this analysis overreporting shares, and reporting issues could vary by state.


White House Releases FY26 Budget Request

Published: May 2, 2025

On May 2, 2025, the White House released preliminary details of its FY26 budget request, including funding for global health activities at the State Department, U.S. Agency for International Development (USAID), Centers for Disease Control and Prevention (CDC), and the Fogarty International Center (FIC) at National Institutes of Health (NIH). While funding amounts for most areas (e.g., HIV, tuberculosis, maternal and child health, etc.) were not specified (more detailed budget information is expected later this month or in June), the proposed budget includes significant reductions in global health funding overall. It also includes proposed rescissions to prior year funding amounts. As specified in the request:

State/USAID:

  • Global Health Programs (GHP) account: Totals $3.8 billion, $6.2 billion below the FY25 amount ($10.0 billion).
  • States that the budget focuses on “lifesaving assistance and preventing infectious diseases from reaching the United States.”
  • President’s Emergency Plan for AIDS Relief (PEPFAR): States that funding is preserved for any current beneficiaries.
  • Family Planning & Reproductive Health (FP/RH): Suggests that the administration is proposing to eliminate funding for FP/RH programs in line with previous actions (see here and here).
  • World Health Organization (WHO): In line with the Trump Administration’s executive order Withdrawing The United States From The World Health Organization, “pauses” assessed and voluntary contributions to WHO.

Centers for Disease Control and Prevention (CDC): Eliminates the CDC’s Global Health Center, which was funded at $693 million in FY25.

Fogarty International Center (FIC): Eliminates FIC, which is at NIH and was funded at $95 million in FY25.

Table: KFF Analysis of Global Health Funding in the FY 2026 Budget Request
Department / Agency / ProgramFY25 CR (based on FY24 Final, millions)FY26 Request (millions) 1Difference (FY26 Request – FY25 CR, millions)Notes: 1
State Department & USAID
Global Health Programs (GHP)


$10,030.5


$3,797.5


-$6,232.5


The United States is the largest global contributor to programs that provide so-called family planning services through liberal NGOs, and have funded abortions. This stands in direct conflict with the President’s action reinstating the “Mexico City Policy.” The Budget protects life and prevents a proabortion agenda from being promoted abroad with taxpayer dollars. The Budget focuses on lifesaving assistance and preventing infectious diseases from reaching the United States. The U.S. President’s Emergency Plan for AIDS Relief funding is preserved for any current beneficiaries.
Family Planning & Reproductive Health (FP/RH) 2$607.5$0-$607.5
World Health Organization (WHO)3$118.9$0-$118.9The Budget pauses most assessed and all voluntary contributions to UN and other international organizations, including for the UN Regular Budget, UN Educational, Scientific and Cultural Organization, and the World Health Organization. This is consistent with Executive Order 14199, “Withdrawing the United States From and Ending Funding to Certain United Nations Organizations and Reviewing United States Support to All International Organizations.” To preserve maximum negotiating leverage, the President can choose to fund these international organizations out of the A1OF if he chooses.
Health & Human Services (HHS)
CDC Global Health Programs$692.8$0-$692.8The Budget refocuses CDC’s mission on core activities such as emerging and infectious disease surveillance, outbreak investigations, and maintaining the Nation’s public health infrastructure, while streamlining programs and eliminating waste. The Budget proposes merging multiple programs into one grant program and giving States more flexibility to address local needs. Specifically, the Budget proposes consolidating funding for Infectious Disease and Opioids, Viral Hepatitis, Sexually Transmitted Infections, and Tuberculosis programs into one grant program funded at $300 million.The Budget eliminates duplicative, DEI, or simply unnecessary programs, including: the National Center for Chronic Diseases Prevention and Health Promotion; National Center for Environmental Health; National Center for Injury Prevention and Control; the Global Health Center; Public Health Preparedness and Response, which can be conducted more effectively by States; and the Preventive Health and Human Services Block Grant, the purposes for which can be best funded by States. The Budget refocuses CDC on emerging and infectious disease surveillance, outbreak investigations, preparedness and response, and maintaining the Nation’s public health infrastructure. The Budget maintains more than $4 billion for CDC.
NIH Fogarty International Center (FIC)$95.16$0-$95.16The Administration is committed to restoring accountability, public trust, and transparency at the NIH. NIH has broken the trust of the American people with wasteful spending, misleading information, risky research, and the promotion of dangerous ideologies that undermine public health. While evidence of the origins of the COVID-19 pandemic leaking from a laboratory is now confirmed by several intelligence agencies, the NIH’s inability to prove that its grants to the Wuhan Institute of Virology were not complicit in such a possible leak, or get data and hold recipients of Federal funding accountable is evidence that NIH has grown too big and unfocused. Further, the NIH has been involved in dangerous gain-of-function research and failed to adequately address it, which further undermines public confidence in NIH. The NIH has also promoted radical gender ideology to the detriment of America’s youth. For example, the NIH funded a study titled “Psychosocial Functioning in Transgender Youth after 2 Years of Hormones,” in which two participants tragically committed suicide. The Budget proposes to reform NIH and focus NIH research activities in line with the President’s commitment to MAHA, including consolidating multiple overlapping and ill-focused programs into five new focus areas with associated spending reforms: the National Institute on Body Systems Research; National Institute on Neuroscience and Brain Research; National Institute of General Medical Sciences; National Institute of Disability Related Research; and National Institute on Behavioral Health. The Budget also eliminates funding for the National Institute on Minority and Health Disparities (-$534 million), which is replete with DEI expenditures, the Fogarty International Center (-$95 million), the National Center for Complementary and Integrative Health (-$170 million), and the National Institute of Nursing Research (-$198 million). NIH research would align with the President’s priorities to address chronic disease and other epidemics, implementing all executive orders, and eliminating research on climate change, radical gender ideology, and divisive racialism. This new structure retains the Advanced Research Projects Agency for Health. The Budget maintains $27 billion for NIH research.

1 – Based on information provided in the “Fiscal Year 2026 Discretionary Budget Request – Major Discretionary Funding Changes” released by OMB on May 2, 2025.

2 – The family planning & reproductive health total includes bilateral funding and U.S. contributions to the United Nations Population Fund (UNFPA).

3 – In addition to the assessed amounts, the U.S. provides voluntary contributions to WHO for specific projects/activities determined on an annual basis. These voluntary contributions are not represented here. The Trump Administration has indicated it is cancelling all contributions (assessed and voluntary) to WHO. The FY25 amounts are based on the FY24 levels, which are based on estimates listed in the FY25 Department of State, Foreign Operations, and Related Programs Congressional Budget Justification.

Responding to Federal Medicaid Reductions: Which States Are Most at Risk?

Published: May 2, 2025

Issue Brief

Medicaid Watch

The House and the Senate have now passed a budget resolution that implies big, but unspecified, cuts to Medicaid. The House Energy and Commerce Committee is instructed to reduce the federal deficit by at least $880 billion over 10 years, with nearly all those cuts expected to come from Medicaid. The targets in the Senate are less clear, but Senate Majority Leader John Thune has suggested the Senate will seek at least $1.5 trillion in overall spending cuts, which again would have to include substantial cuts to Medicaid.

Medicaid is the primary program providing comprehensive health and long-term care to one in five people living in the U.S and accounts for nearly $1 out of every $5 spent on health care. There are not yet detailed proposals under consideration by Congress to achieve federal Medicaid spending reductions. Because Medicaid financing is shared between the states and the federal government, any reduction in federal Medicaid spending would leave states with tough choices about how to offset reductions through tax increases or cuts to other programs, like education, corrections, and economic development. If states are not able to offset the loss of federal funds, they would have to make cuts to their Medicaid programs by reducing coverage, restricting benefits, or lowering provider reimbursement rates.

Because states have some flexibility to determine which populations and services to cover, how to deliver care, and how much to reimburse providers, there is significant variation in Medicaid per enrollee spending across states. Some notable differences in policy choices include whether states have implemented the Medicaid expansion under the Affordable Care Act (ACA) as well as decisions about optional coverage for children, pregnancy, people with disabilities and people who need long-term care. State flexibility to cover benefits deemed optional by the federal government leads to significant variation in covered services, particularly the adoption of optional home care benefits. Because of this variation in state policy choices, some states may be disproportionately impacted by federal cuts depending on the specific federal policy changes pursued. For example, the effects of federal policy changes to reduce federal spending for the ACA expansion group would be limited to expansion states while a cap on per enrollee spending for all eligibility groups would impact all states.

States’ ability to respond to federal spending reductions and how they will be affected by any cuts is complicated and depends on an array of factors. The cuts will be made in the context of states’ existing Medicaid programs, but other factors, including population demographic characteristics, health status of Medicaid enrollees, available revenue and state budget choices, and measures of health care costs and access to care, that drive demand for Medicaid as well as states ability to raise revenue or reduce spending will also play a role. This analysis examines a range of measures within these four broad categories to identify states that may have greater difficulty responding to federal Medicaid spending reductions (Figure 1).

The measures used in the analysis were selected from many possible data points because of the availability of state-level data and because they highlight both the capacity of states to respond to federal reductions and the possible implications of federal reductions and state responses on specific populations. Choosing different measures would likely lead to different state rankings. To identify states most at risk, states were ranked separately for each measure, with ties receiving the same rank. Rankings were then summed across each measure within a category to produce a cumulative score, which was used to determine each state’s aggregate ranking for the category. For the full state aggregate ranking for each category, see the Appendix tables. State specific data for these measures as well as other key Medicaid program characteristics can be found in a data collection on State Health Facts.

Measures to Identify States at Greater Risk if Federal Medicaid Spending Is Reduced

All states will likely face challenges responding to federal Medicaid cuts and caps to varying degrees, but states with certain characteristics are more at risk. Six states (Kentucky, Mississippi, Missouri, New Mexico, South Carolina, and West Virginia) rank in the top five for multiple risk categories and another nine states (Alabama, Alaska, Arkansas, District of Columbia, Louisiana, New York, Oklahoma, Pennsylvania, Washington) rank in the top five for at least one category of risk factors.

Fifteen States Rank in the Top Five for One or More Categories of Risk Factors for Responding to Federal Medicaid Reductions

Demographics

Higher rates of poverty and unemployment among state residents as well as a growing share of individuals over age 85, increase demand for Medicaid, making it more difficult for states to respond to federal Medicaid reductions. Because Medicaid serves low-income populations, states with higher shares of residents in poverty or higher unemployment rates would likely experience continued enrollment in Medicaid even as they make cuts in response to federal funding reductions. Similarly, Medicaid is the largest provider of long-term care services, and an aging population could contribute to increased need for these services. Medicaid also disproportionately covers people with disabilities and finances 41% of births overall so states with higher shares of people ages 18 to 64 who have a disability and higher shares of the female population of reproductive age who have low incomes could face more challenges making program cuts. New Mexico, Kentucky, Louisiana, South Carolina, Arkansas, and Mississippi rank in the top 5 for states with population demographics that could make it difficult to respond to federal Medicaid reductions.

The measures used to rank states on population demographics include:

  • Higher Share of Population Below 100% FPL
  • Higher Unemployment Rate, March 2025
  • Higher Projected 5-Year Change in Population Ages 85+
  • Higher Share of Female Population Ages 18-49 Who Have Income Below 200% FPL
  • Higher Disability Rate for Working-Age Adults (18-64)
Demographics

Health Status

Medicaid cuts in states with Medicaid enrollees who have higher health care needs could undermine efforts to improve overall health status. Because Medicaid is a key source of coverage for individuals with significant health care needs, states with higher shares of Medicaid enrollees who are children with special health care needs, who have a disability, serious mental illness, or multiple chronic conditions, or who need long-term care may face greater challenges in restricting program coverage or benefits. Additionally, any cuts to Medicaid programs in states with sicker Medicaid enrollees could have more negative effects on individuals’ health and potentially the health status of the overall population. Missouri, West Virginia, Kentucky, Pennsylvania, and Mississippi rank in the top 5 for states with poor Medicaid enrollee health status that could worsen in the face of Medicaid program cuts made in response to federal funding reductions.

The measures used to rank states based on the health status of Medicaid enrollees include:

  • Higher Share of Children with Special Health Care Needs Covered by Medicaid/CHIP
  • Higher Share of Medicaid Enrollees Who Reported a Disability
  • Higher Share of Medicaid Enrollees with Serious Mental Illness (SMI)
  • Higher Share of Medicaid Enrollees Using Long-Term Care
  • Higher Share of Medicaid Enrollees Who Have Three or More Chronic Conditions
Health Status

State Revenue and Budgets

States that are more reliant on federal Medicaid and other federal funding and those that have more limited ability to raise revenue may have a harder time responding to federal funding reductions. Medicaid financing is shared by states and the federal government. For states that have a higher federal medical match rate (FMAP) replacing lost federal funding will require more state dollars than for states with the minimum FMAP. With broader federal funding reductions at play, states that rely more heavily on federal funding beyond Medicaid could face even deeper reductions in federal funding. States that currently spend less per capita may have a harder time reallocating spending across programs to offset federal reductions. While it is difficult for all states to increase revenue by raising taxes, states with lower taxable resources or lower tax collections per capita could experience greater challenges offsetting cuts. Mississippi, Alabama, South Carolina, Missouri, and Oklahoma rank in the top 5 for states with high reliance on federal funding and limited ability to raise revenue or reduce spending that could make it difficult to offset federal Medicaid funding reductions.

The measures used to rank states on their ability to raise revenue or reduce spending include:

  • Higher Federal Medical Assistance Percentage (FMAP) for Medicaid and Multiplier
  • Higher Share of State Spending from Federal Funds
  • Lower Total State Expenditures per Capita
  • Lower Total Taxable Resources per Capita
  • Lower State Government Tax Collections per Capita
State Revenue and Budgets

Health Care Costs and Access

States that face higher health care costs and related access issues could have a harder time cutting Medicaid spending without exacerbating existing access to care and provider shortage issues. Medicaid operates within the broader health care system. In higher cost markets, states have to spend more to pay for health care services needed by Medicaid enrollees and can make it harder to reduce spending. High health care costs can also be a barrier to accessing needed care for people who are un- or underinsured. In states with higher shares of residents reporting access to care issues and larger numbers of people living in primary care shortage areas, cutting provider reimbursement rates or scaling back on coverage or benefits in response to federal Medicaid spending reductions could worsen these issues. Alaska, West Virginia, District of Columbia, New York, New Mexico, and Washington rank in the top 5 for states with high health care costs and access barriers that could make it difficult to respond to Medicaid reductions.

The measures used to rank states on overall health costs and access to care include:

  • Higher Health Care Expenditures per Capita by State of Residence
  • Higher Average Annual Family Premium per Enrolled Employee for Employer-Based Health Insurance
  • Higher Share of Children (Ages 3-17) Who Faced Difficulties Obtaining Mental Health Care
  • Higher Share of Adults Who Report Not Seeing a Doctor in the Past 12 Months Because of Cost
  • Higher Share of the Population in a Primary Care Health Professional Shortage Areas (HPSAs)
Health Care Costs and Access

Appendix Tables

Demographics

Health Status

State Revenue and Budgets

Health Care Costs and Access

Section 1115 Waiver Watch: Early Signs Point to New Directions Under Trump Administration

Published: May 2, 2025

1115 waivers generally reflect priorities identified by states as well as changing priorities from one presidential administration to another. The Biden administration encouraged states to propose waivers that expand coverage, address health-related social needs (or “HRSN”), and assist individuals with reentry from incarceration. In contrast, the first Trump administration focused on work requirements and eligibility restrictions with a limited focus on enrollee social determinants of health; however, the administration approved a first-of-its kind waiver in North Carolina that allowed the state to provide limited housing and nutrition supports to targeted Medicaid enrollees. In addition, the Biden administration expanded waiver financing tools that had been limited under the first Trump administration.

While the future direction of demonstration waivers is uncertain, recent actions from the Trump administration could signal efforts to curtail waivers related to social determinants of health and to limit waiver financing tools and flexibility. Two major changes demonstrate this shift: (1)  rescinding Biden-era guidance on covering health-related social needs (HRSN) services, and (2) phasing out federal funding for “Designated State Health Programs” (DSHP) in waivers. This waiver watch examines these recent actions in the context of the recent history of Medicaid waivers aimed at addressing enrollee social determinants of health and DSHP.

Use of 1115 Waivers to Address Social Determinants of Health Under Biden and Trump Administrations

The first Trump administration generally had a limited focus on enrollee social determinants of health. Historically states have had limited ability to use Medicaid to help address social determinants of health. Social determinants of health (SDOH) are the conditions in which people are born, grow, live, work and age. SDOH include but are not limited to housing, food, education, employment, healthy behaviors, transportation, and personal safety. Despite a limited focus in general on SDOH, in 2018 the first Trump administration approved North Carolina’s “Healthy Opportunities Pilots,” allowing the state to cover certain non-medical services that target social needs, including housing, nutrition, transportation, and interpersonal relationship supports to specific and limited enrollees. The Pilots operated in three regions of the state and did not go as far as to provide coverage of rent/temporary housing or meal supports equivalent to three meals a day. The Trump administration later released guidance in 2021 highlighting existing federal authorities and opportunities for states to use Medicaid to address enrollee social determinants of health, including under Section 1115 authority.

The Biden administration moved to a more expansive 1115 “health-related social needs” framework and approved 18 waivers authorizing evidence-based housing and nutrition services for specific high-need populations under this framework. (Figure 1). Under the Biden administration, the Centers for Medicare and Medicaid Services (CMS) released a series of guidance documents (which were updated in 2024) on a new waiver opportunity to expand the tools available to states to address enrollee health-related social needs (or “HRSN”). The guidance included federal guardrails and requirements related to expenditure limits, service delivery requirements, and monitoring and evaluation requirements. The HRSN framework allowed for coverage of rent/temporary housing and utilities for up to six months and meal support up to three meals per day, departing from longstanding prohibitions on payment of “room and board” in Medicaid. CMS indicated broadening the availability of HRSN services was “expected to promote coverage and access to care, improve health outcomes, reduce health disparities, and create long-term, more cost-effective alternatives or supplements to traditional medical services.” CMS stressed new HRSN initiatives were not intended to replace other federal, state, and local social service programs but rather to complement and coordinate with these efforts. One of the final Biden administration HRSN approvals was an extension of North Carolina’s waiver under the new HRSN-framework. Reflecting findings from the evaluations of the initial waiver (discussed below in Box 1), the renewal expands the Healthy Opportunities program statewide, introduces new HRSN-framework services (e.g., short-term rental assistance, nutrition supports that were equivalent to three meals a day), and includes new DSHP funding authority.

Box 1. Evidence from North Carolina

Evaluations of the North Carolina “Healthy Opportunity Pilots” waiver approved by the first Trump administration show lower costs over time and largely positive outcomes. At the time of the waiver evaluation study period (March 2022 – November 2023), over 13,000 individuals had been enrolled in the three pilot regions within the state (most recent state data shows enrollment has since increased to about 42,000 as of March 2025). Services are targeted; enrollees must have at least one qualifying behavioral or physical health condition and one qualifying “social risk factor” (e.g., housing insecurity, food insecurity) to qualify for covered housing, nutrition, transportation, or interpersonal violence services.

Nearly 200,000 services had been delivered at the time of the evaluation, with food services representing more than 85% of all services delivered. While housing services were a lower share of services delivered, the average amount billed per housing service was higher at $532, compared to $131 per food service, $199 per transportation service, and $105 per IPV/toxic stress service. Examples of covered services include home remediation services, one-time payment of first month’s rent, medically tailored home-delivered meals, and violence intervention services. Comparing those who received Pilot services to Medicaid enrollees who screened positive for social risks but lived in regions not covered by the Pilots, the interim evaluation found:

  • Spending (including both Pilot service spending and spending for medical care) was, on average, $85 less per Pilot participant per month. Even with an increase in spending at enrollment, HOP participation resulted in lower overall spending over time.
  • Emergency department visits decreased following Pilot enrollment (an estimated reduction of 6 emergency department visits per 1,000 beneficiary months). Inpatient hospitalizations also decreased for non-pregnant adults (an estimated reduction of two admissions per 1,000 beneficiary months).
  • Participation in the Pilots reduced the number of unmet housing, nutrition, and transportation needs reported by enrollees.
  • No significant change was found on the impact of Pilot enrollment on inpatient admissions for children and pregnant adults, outpatient visits, and prenatal and postpartum care use. Due to a lack of data on clinical outcomes, the interim evaluation was unable to investigate whether Pilot participation affected clinical outcomes (e.g., diabetes, hypertension); subsequent evaluations may provide more information.

Use of DSHP Under Biden and Trump Administrations

Spending on certain Designated State Health Programs (DSHP) have been used to draw down federal matching dollars, but support for this policy has varied across the Trump and Biden administrations. HHS has authorized states to access federal Medicaid matching funds for certain types of state-funded health programs in waivers pre-dating the first Trump administration. Generally, this policy may expand available resources by freeing up state funds to finance new Section 1115 waiver initiatives. These state health programs (called DSHPs) do not otherwise qualify for federal funding, must have existed prior to 1115 waiver implementation, and often provide safety-net health care services for low-income or uninsured individuals (such as addiction recovery treatment or support for individuals with intellectual and developmental disabilities). With DSHP authority, states can claim federal match (up to set limits) for state programs approved by CMS.

The first Trump administration announced in 2017 it would no longer accept state proposals for new or renewing 1115 demonstrations that rely on federal matching funds for DSHP. In the guidance, the administration noted oversight concerns and stated there was no “compelling case that federal DSHP funding is a prudent federal investment.” At the time, authority for DSHP in active / current demonstrations was not affected but they could not be extended or renewed. Prior to the Trump administration, DSHP was often used to help finance Delivery System Reform Incentive Payment (DSRIP) waivers, which provided states with significant federal funding to support hospitals and other providers in changing how they provide care to Medicaid beneficiaries. Along with phasing out DSHP funding, the first Trump administration reduced funding for DSRIP renewals and did not approve new DSRIP demonstrations.

The Biden administration rescinded the 2017 DSHP guidance and approved 1115 demonstrations in eight states (nine total demonstrations) that provide federal funding for DSHPs (Figure 1). CMS only approved DSHP expenditure authority in a subset of states with HRSN 1115 approval (in waivers including CalAIM, New York’s Medicaid Redesign, and MassHealth). CMS approved the use of “freed up” state funds for HRSN initiatives (in all states with DSHP expenditure authority) and approved limited other uses (e.g., reentry and workforce initiatives) that varied across state approvals. In waiver approvals, CMS notes that only new waiver initiatives that were determined to promote the objectives of the Medicaid program (such as by “improving access to high-quality covered services”) could be financed with freed up state funds; new DSHP-funded initiatives were expected to not supplant existing services or programs. DSHP authority was described as time-limited and states were expected to submit sustainability plans that describe the state’s strategy to fund and maintain these initiatives beyond the current demonstration approval period. With these DSHP approvals, the Biden administration also introduced new guardrails, including that federal funding for DSHPs could not exceed 1.5 percent of the state’s total Medicaid spending and that states must use non-federal funding sources for at least 15 percent of the state’s share of the cost of new waiver initiatives. Similar to its guidance for HRSN programs, as a condition of DSHP approval CMS required states to meet provider payment rate requirements for core Medicaid services.

Health-Related Social Needs (HRSN) Waivers Approved as of January 20, 2025

In recent months, the Trump administration rescinded HRSN guidance issued by the Biden administration and announced it would be phasing out DSHP funding authority. Neither action affects currently approved / existing waivers but both may limit new HRSN / SDOH state waiver requests or waiver extension requests. CMS indicates in its March 2025 letter that rescinding HRSN guidance does not nullify existing HRSN approvals but going forward they will consider HRSN / SDOH requests on a “case-by-case” basis. The Trump administration also announced in April 2025 that it does not intend to approve new or extend existing requests for federal matching funds for state expenditures for DSHP. The guidance also says it does not intend to renew a funding mechanism for state health programs specific to Tennessee’s waiver called “designated state investment programs” or DSIP, approved by the Trump administration in 2021 and renegotiated by the Biden administration in 2023. Similar to the 2017 letter, the 2025 letter notes that federal DSIP and DSHP funding have “appeared to serve primarily as a financing mechanism for states” rather than as an integral part of demonstrations. The CMS press release said that “DSHPs and DSIPs have grown from approximately $886 million in 2019 to nearly $2.7 billion in eligible expenditures in 2025, representing increasing costs to the federal government without a sustainable state contribution.” Phasing out DSHP authority may limit states’ ability to finance new 1115 initiatives.

Future waiver approvals and CMS guidance will provide additional insight into the waiver priorities and financing approach of the new Trump administration.  With regard to waiver financing, in addition to phasing out DSHP the first Trump administration made other changes to 1115 waiver budget neutrality policy in 2018 designed to limit the amount of federal funds that could be used for waiver spending. Limits included changing the amount of savings states can carry over between demonstrations and establishing new rules on spending trend rates used in budget neutrality calculations. The Biden administration made changes to Section 1115 budget neutrality policies that provided greater flexibility for states to design and implement 1115 demonstration programs, including HRSN initiatives (such as not requiring offsetting savings for HRSN services). More broadly, the first Trump administration’s Section 1115 waiver policy emphasized work requirements – which were challenged in court – and other eligibility restrictions and capped financing. Since the Trump administration has taken office, some states are again pursuing Medicaid work requirements through Medicaid demonstration waivers. Work requirements in Medicaid are also being considered as part of a broader federal legislative package of potential changes to Medicaid designed to significantly reduce federal Medicaid spending. The future of work requirement waivers may depend on the outcome of these legislative debates, as legislation may mandate work requirements.

Breaking Down the U.S. Global Health Budget by Program Area

Published: May 1, 2025
Note: Starting on the first day of his second term, President Trump issued several executive actions that have fundamentally changed foreign assistance. These included: an executive order which called for a 90-day review of foreign aid; a subsequent “stop-work order” that froze all payments and services for work already underway; the dissolution of USAID; and the cancellation of most foreign assistance awards. The Trump administration has also been working to restructure several government departments and agencies, many of which carry out U.S. global health activities. As a result, U.S. global health programs have been disrupted and, in some cases, ended. While Congress has provided FY 2025 funding to these global health programs through a continuing resolution (CR), which maintains funding at the FY 2024 level, it is important to note that the impacts of the Trump administration changes to foreign assistance are not fully clear. As such, the data presented below are based on Congressional appropriations.

This fact sheet provides a historical overview of U.S. funding for global health by program area over the past decade. Funding totals are based on amounts specified by Congress in annual appropriations bills, as well as some amounts that are determined at the agency level. See our Budget Tracker for more detail on historical funding and our Budget Summaries for the latest on ongoing appropriations discussions.

U.S. Global Health Budget: Overview

The U.S. Government is the largest donor to global health in the world and includes support for both disease (HIV, tuberculosis, malaria, and neglected tropical diseases) and population (maternal and child health, nutrition, and family planning and reproductive health) specific activities as well as global health security. Most U.S. funding for global health is provided bilaterally (approximately 80%). Of the multilateral share, the majority is provided to The Global Fund to Fight AIDS, Tuberculosis and Malaria (Global Fund). The U.S. investment in global health grew significantly in the early 2000s, largely due to the creation of new initiatives including the President’s Emergency Plan for AIDS Relief (PEPFAR) and the President’s Malaria Initiative (PMI). However, over the last decade, U.S. funding for global health has remained relatively flat, with spikes in some years due to emergency supplemental funding for disease outbreaks, including Ebola, Zika, and COVID-19. In FY 2025, global health funding was provided through a continuing resolution (CR) which maintained the prior year (FY 2024) amount of $12.4 billion.

Figure 1

U.S. Global Health Funding, FY 2016 - FY 2025

Figure 2

U.S. Global Health Funding (in millions), By Program Area, FY 2025

Table 1

Historical Funding by Agency for Global Health, in millions

Back to top


U.S. Global Health Budget: Global HIV Funding, Including PEPFAR

The U.S. first provided funding to address the global HIV epidemic in 1986. U.S. efforts and funding increased slowly over time until the launch of the U.S. President’s Emergency Plan for AIDS Relief (PEPFAR) in 2003, which initiated a period of significant increases and is the largest effort devoted to a single disease in the world. The majority of U.S. global HIV funding is for PEPFAR bilateral efforts (89%) with additional funding for UNAIDS and international HIV research activities. As part of its global HIV response, the U.S. also provides funding to the Global Fund (see below for details). PEPFAR funding is specified by Congress in annual appropriations bills and is largely provided to the Department of State, which is responsible, through the Bureau for Global Health Security and Diplomacy (GHSD), for coordinating all U.S. programs, activities, and funding for global HIV efforts. Other agencies that receive HIV funding under PEPFAR include the U.S. Agency for International Development (USAID), Centers for Disease Control and Prevention (CDC), and Department of Defense (DoD). In addition, the National Institutes of Health (NIH) supports international HIV research activities, (funding which is not counted as part of PEPFAR). Global HIV funding through regular appropriations1  has historically accounted for the largest share of the U.S. global health budget (ranging from 42% to 50% between FY 2016 and FY 2025). In FY 2025, global HIV funding was provided through a continuing resolution, which maintained the prior year (FY 2024) amount and totaled $5.4 billion, of which $4.9 billion is for PEPFAR2  ($4.8 billion for bilateral HIV and $50 million for UNAIDS), and approximately $575 million is for international HIV research activities at NIH.

Figure 3

U.S. Funding for Global HIV, FY 2016 - FY 2025

Table 2

Historical Funding by Agency and Account for Global HIV, in millions

Back to top


U.S. Global Health Budget: Tuberculosis (TB)

Since 1998, when the U.S. Agency for International Development (USAID) began a global tuberculosis (TB) control program, U.S. involvement in global TB efforts has grown and it is now one of the largest donors to global TB control in the world. U.S. bilateral TB funding is provided through USAID and includes U.S. contributions to the TB Drug Facility (additional U.S. support for TB activities is provided through its contribution to the Global Fund to Fight AIDS, Tuberculosis and Malaria). U.S. funding for TB has grown over the past decade, with much of the increase occurring in more recent years. U.S. funding for TB rose from $240 million in FY 2016 to $406 million in FY 2025 and currently accounts for approximately 3% of the U.S. global health budget. FY 2025 funding was provided through a continuing resolution, which maintained the prior year (FY 2024) amount.

Figure 4

U.S. Funding for Global Tuberculosis (TB), FY 2016 - FY 2025

Table 3

Historical Funding by Agency and Account for Global Tuberculosis (TB), in millions

Back to top


U.S. Global Health Budget: Malaria/PMI

The U.S. government has been involved in global malaria activities since the 1950s and, today, is the second largest donor to global malaria efforts in the world (the largest is the Global Fund to Fight AIDS, Tuberculosis and Malaria). The U.S. response to malaria is driven by the President’s Malaria Initiative (PMI), an interagency initiative to address global malaria that was led by the U.S. Agency for International Development (USAID), and co-implemented together with the Centers for Disease Control and Prevention (CDC), with additional activities provided by the National Institutes of Health (NIH) and Department of Defense (DoD). In addition to its bilateral programs, the U.S. also supports malaria programs through its contribution to the Global Fund to Fight AIDS, Tuberculosis and Malaria. U.S. bilateral funding for malaria increased over the past decade from $873 million in FY 2016 to approximately $1 billion in FY 2025; while funding increased over the period, it has been relatively flat in recent years. In FY 2025, malaria accounted for 9% of the U.S. global health budget. FY 2025 funding was provided through a continuing resolution, which maintained the prior year (FY 2024) amount.

Figure 5

U.S. Funding for Global Malaria, FY 2016 - FY 2025

Table 4

Historical Funding by Agency and Account for Global Malaria, in millions

Back to top


U.S. Global Health Budget: The Global Fund to Fight AIDS, Tuberculosis and Malaria

The Global Fund to Fight AIDS, Tuberculosis and Malaria (Global Fund) is an independent, public-private, multilateral institution which finances HIV, TB, and malaria programs in low- and middle-income countries. The Global Fund receives contributions from public and private donors and in turn provides funding to countries based on country-defined proposals. The U.S. provided the Global Fund with its founding contribution in 2001 and has since been its largest single donor (U.S. contributions to the Global Fund are counted as part of PEPFAR). However, Congress places a number of restrictions on U.S. contributions, including a funding match requirement that limits the amount the U.S. can contribute. The U.S. contribution to the Global Fund through regular appropriations has fluctuated over the past decade but reached its highest level to date ($2.0 billion) in FY 2023. In FY 2025, funding for the Global Fund was $1.7 billion, flat compared to the FY 2024 level, as funding was carried over due to the continuing resolution, and $375 million less than the FY 2023 level, though Congress stated the decline was due to the funding match requirement that limits the amount the U.S. can contribute. In addition to regular appropriations, Congress provided $3.5 billion in emergency supplemental funding to the Global Fund to address the impacts of COVID-19 on HIV programs in FY 2021.

Figure 6

U.S. Funding for The Global Fund, FY 2016 - FY 2025

Table 5

Interactive DataWrapper Embed

Back to top


U.S. Global Health Budget: Maternal & Child Health (MCH)

The U.S. has been involved in Maternal & Child Health (MCH) efforts since the 1960s (and is the largest donor government to MCH activities in the world). MCH funding, which includes funding for polio and U.S. contributions to Gavi, the Vaccine Alliance (GAVI) and the United Nations Children’s Fund (UNICEF), is provided through the U.S. Agency for International Development (USAID), Centers for Disease Control and Prevention (CDC), and the State Department. U.S. funding for MCH increased slightly from $1.14 billion in FY 2016 to $1.30 billion in FY 2025. This was primarily driven by increased funding to GAVI and polio during the period. In fact, when these are removed, bilateral MCH funding has remained relatively level for several years over the period. In FY 2025, MCH accounted for the third largest share of U.S. funding for global health (10%). FY 2025 funding was provided through a continuing resolution, which maintained the prior year (FY 2024) amount.

Figure 7

U.S. Funding for Global Maternal & Child Health (MCH), FY 2016 - FY 2025

Table 6

Historical Funding by Agency and Account for Global Maternal and Child Health (MCH), in millions

Back to top


U.S. Global Health Budget: Nutrition

The U.S. has a long history of supporting global efforts to improve nutrition and is the largest donor to nutrition efforts in the world. Historically, support for U.S. global nutrition activities was included as part of broader maternal and child health (MCH) funding; starting in 2010, Congress began to designate funding for nutrition activities, all of which is provided through the U.S. Agency for International Development (USAID).3  U.S. funding for nutrition increased from $144 million in FY 2016 to $165 million in FY 2025 and has accounted for approximately 1% of the total U.S. global health budget over the period. FY 2025 funding was provided through a continuing resolution, which maintained the prior year (FY 2024) amount.

Figure 8

U.S. Funding for Global Nutrition, FY 2016 - FY 2025

Table 7

Historical Funding by Agency and Account for Global Nutrition, in millions

Back to top


U.S. Global Health Budget: Family Planning & Reproductive Health (FP/RH)

The U.S. has been involved in Family Planning & Reproductive Health (FP/RH) efforts since the 1960s and is currently the largest donor to global FP/RH in the world. The majority of U.S. FP/RH funding is provided through the U.S. Agency for International Development (USAID) for bilateral activities, with additional funding provided through the State Department for the U.S. contribution to the United Nations Population Fund (UNFPA).4  U.S. funding for FP/RH rose steadily in its first two decades5  and more recently, has remained relatively flat at just about $600 million, accounting for approximately 5-6% of the U.S. global health budget each year from FY 2016-FY 2025. FY 2025 funding was provided through a continuing resolution, which maintained the prior year (FY 2024) amount.

Figure 9

U.S. Funding for International Family Planning/Reproductive Health (FP/RH), FY 2016 - FY 2025

Table 8

Historical Funding by Agency and Account for International Family Planning and Reproductive Health (FP/RH), in millions

Back to top


U.S. Global Health Budget: Global Health Security

Since the 1990s, there has been growing concern about new infectious diseases that threaten human health including, in more recent years, the emergence and spread of threats such as Ebola, Zika, H1N1 influenza, COVID-19, and antibiotic resistance. U.S. global health security efforts aim to reduce the threat of emerging infectious diseases by supporting preparedness, detection, and response capabilities worldwide. Funding designated by Congress for global health security through both emergency and regular appropriations has fluctuated over time, rising largely in response to outbreaks, including Ebola, Zika, and COVID-19.6  The share of global health funding that global health security represents has increased over time, rising from 4% in FY 2016 to 10% in FY 2025. In FY 2025, funding for global health security was $1.3 billion. FY 2025 funding was provided through a continuing resolution, which maintained the prior year (FY 2024) amount.

Figure 10

U.S. Funding for Global Health Security, FY 2016 - FY 2025

Table 9

Historical Funding by Agency and Account for Global Health Security, in millions

Back to top


U.S. Global Health Budget: Neglected Tropical Diseases (NTDs)

NTDs are a group of parasitic, bacterial, and viral infectious diseases that primarily affect the most impoverished and vulnerable populations in the world. The U.S. Congress first designated funding to address NTDs in 2006, through the U.S. Agency for International Development (USAID).7  Funding was flat at around $100 million for several years before rising to a peak of $115 million in FY 2023 and remained flat in FY 2024 and FY 2025. Funding for NTDs accounts for a relatively small share of the U.S. global health budget (1% in FY 2025). FY 2025 funding was provided through a continuing resolution, which maintained the prior year (FY 2024) amount.

Figure 11

U.S. Funding for Global Neglected Tropical Diseases (NTDs), FY 2016 - FY 2025

Table 10

Historical Funding by Agency and Account for Neglected Tropical Diseases (NTDs), in millions

Back to top

  1. In addition to regular appropriations, Congress provided $250 million in emergency supplemental funding to address the impacts of COVID-19 on U.S. bilateral HIV programs in FY 2021. ↩︎
  2. Total PEPFAR funding in FY 2025 is $6.5 billion ($4.8 billion for bilateral HIV, $50 million for UNAIDS, and $1.7 billion for the Global Fund). ↩︎
  3. Totals do not include funding provided through Food for Peace (FFP) due to the unique nature of the program. ↩︎
  4. Under current law, any U.S. funding withheld from UNFPA is to be made available to other family planning, maternal health, and reproductive health activities (see the KFF fact sheet on U.S. government international family planning and reproductive health statutory requirements and policies). ↩︎
  5. PAI. Cents and Sensibility: U.S. International Family Planning Assistance from 1965 to the Present. Accessed September 2022 at https://pai.org/cents-and-sensibility. ↩︎
  6. In FY15, Congress provided $5.4 billion in emergency funding to address the Ebola outbreak, of which $909.0 million was specifically designated for global health security. In FY16, Congress provided $1.1 billion in emergency funding to address the Zika outbreak, of which $145.5 million was specifically designated for global health security. In FY18, Congress provided $100 million in unspent Emergency Ebola funding for “programs to accelerate the capabilities of targeted countries to prevent, detect, and respond to infectious disease outbreaks.” In FY19, Congress provided $38 million in unspent Emergency Ebola funding for “programs to accelerate the capacities of targeted countries to prevent, detect, and respond to infectious disease outbreaks.” In FY20, Congress provided $1.235 billion in emergency COVID-19 funding to “prevent, prepare for, and respond to coronavirus” globally, and in FY21, Congress provided $9.4 billion in emergency COVID-19 funding “to prevent, prepare for, and respond to coronavirus, including for vaccine procurement and delivery.” While none of the FY20 funding was designated for global health security, all of the FY21 funding provided through CDC ($750 million) was designated by CDC as global health security. ↩︎
  7. Additional NTD funding is used for NTD research at the Centers for Disease Control and Prevention (CDC) and National Institutes of Health (NIH), although this funding is not specified by Congress. ↩︎
Poll Finding

KFF Health Tracking Poll April 2025: Public’s View on Major Cuts to Federal Health Agencies

Published: May 1, 2025

Findings

Key Takeaways

  • Amid sweeping overhauls of federal health agencies in the first 100 days of President Trump’s second term, majorities of the public oppose major cuts to staff and spending at these agencies (61%) and say recent actions by the administration and Elon Musk’s Department of Government Efficiency (DOGE) have gone too far (54%). In addition, six in ten (59%) say the administration is “recklessly making broad cuts to programs and staff, including some that are necessary for agencies to function,” while a smaller share (41%) say “the administration is carefully making cuts to programs and staff to reduce fraud and waste, and to improve government efficiency.”
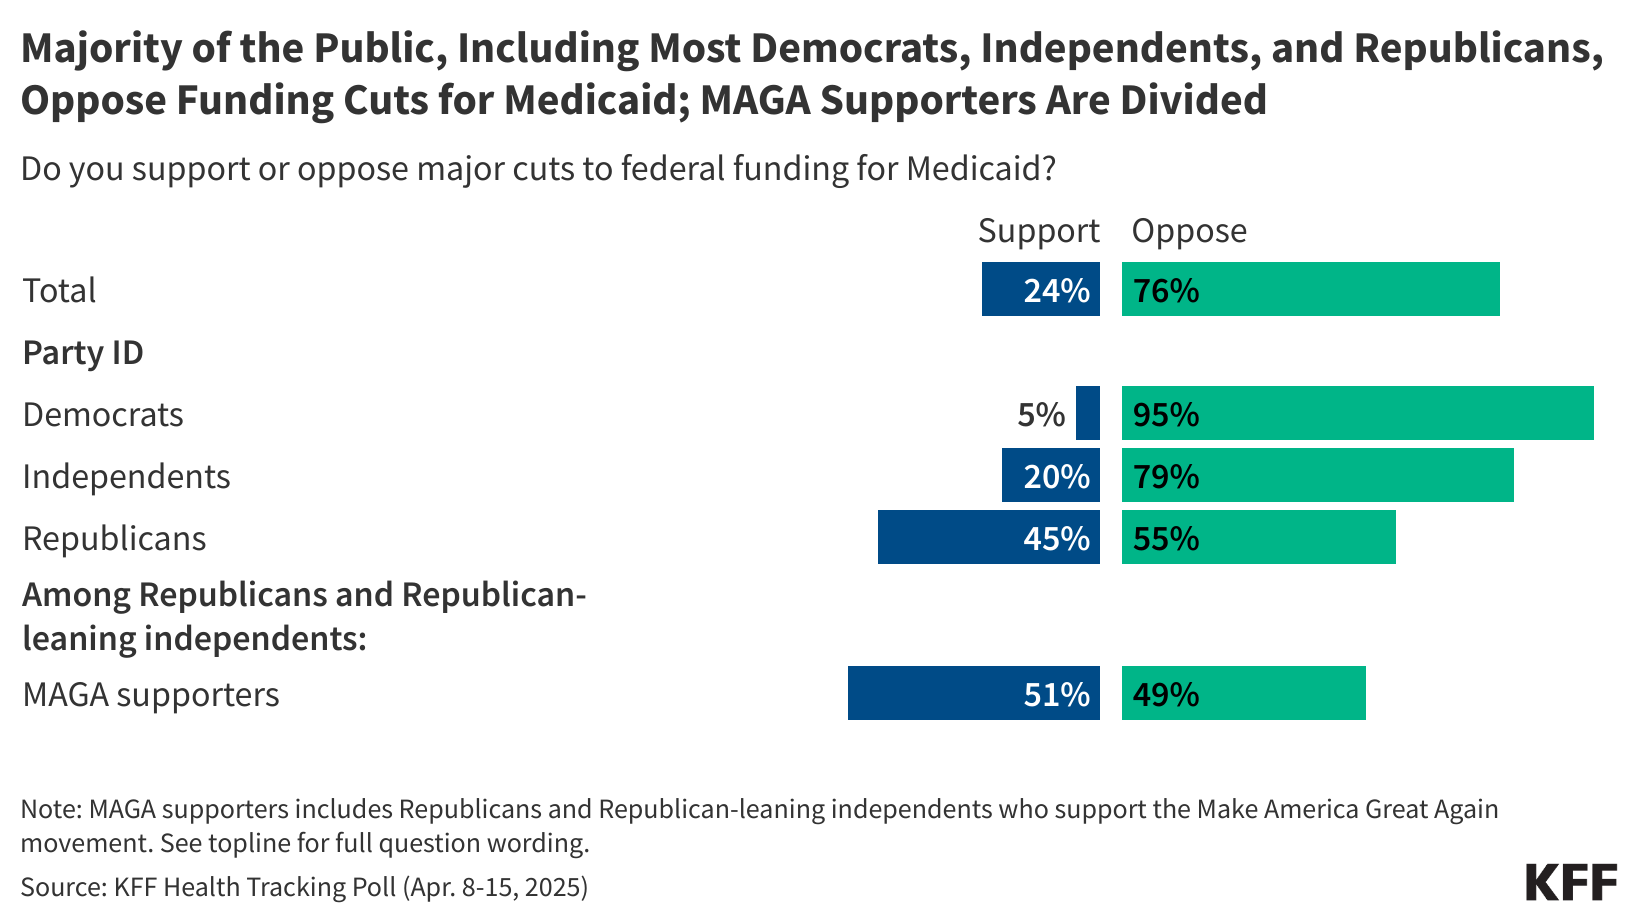
  • Views of cuts to staff and spending are largely partisan with most Democrats and independents opposing the cuts and thinking they go “too far,” while a majority of Republicans support the cuts and six in ten (63%) say the extent has been “about right.” In addition, nine in ten Democrats and two-thirds of independents categorize the cuts as reckless while eight in ten Republicans think the administration is carefully making the cuts. Across the board, the strongest proponents of these cuts are MAGA supporters, a group that constitutes about three-quarters of all Republicans and Republican-leaning independents. Large majorities of MAGA supporters say they support the cuts and a quarter say the cuts haven’t gone far enough. Much smaller shares of Republicans and Republican-leaning independents whose views don’t align with the MAGA movement approve of the current actions by the Trump administration.
  • Most of the public also see the negative consequences from these cuts, with majorities saying cuts to staff and spending at federal health agencies will have a negative impact on health care for veterans, research to find cures and treatments for cancer and other diseases, efforts to combat the spread of infectious diseases, and food safety. Once again, views are partisan with most Democrats and independents saying the cuts will have a negative impact in these areas while Republicans are more likely to say the cuts won’t have an impact.
  • There is partisan agreement when it comes to funding cuts to Medicare, Medicaid, and Social Security with more than nine in ten Democrats, eight in ten independents, and more than half of Republicans opposing federal funding cuts to each of the three government programs. In addition, majorities across partisanship oppose funding cuts to states for mental health and addiction prevention services and for tracking infectious disease outbreaks. Another seven in ten oppose cuts to federal funding for research at universities and medical centers, including nine in ten (92%) Democrats, seven in ten (69%) independents, and almost half (44%) of Republicans. Overall, two-thirds (65%) oppose cutting funding to help people who purchase health coverage through the ACA to pay their premiums (65%), but about six in ten Republicans support major cuts in this area.
  • Most of the public agree with the Trump administration that fraud, waste, and abuse are a problem in health care in the U.S., yet partisans disagree on whether the cuts will make any difference and on who is responsible for it. Roughly four in ten (43%) of the public say cuts to staff and spending at government health agencies will negatively impact reducing fraud, waste, and abuse in health care, which is similar to the share (38%) who say there will be a positive impact. Additionally, while majorities (57%) think fraud, waste and abuse are a “major problem” in private health insurance plans, fewer – about half – think fraud is a problem in Medicaid (52%), Social Security (51%), and Medicare (50%). Half of Democrats identify private health insurance companies as the group most responsible for fraud, waste, and abuse in government health programs while four in ten Republicans place the blame on government employees running the programs.

Most Oppose Trump Administration Cuts to Federal Health Agencies

The first few months of President Donald Trump’s second term have been punctuated by a wave of cuts to the federal workforce and government funded programs, especially in health care agencies. At least 20,000 jobs have been lost from the Department of Health and Human Services and its sub-agencies since Robert F. Kennedy Jr. assumed his job as secretary of the agency.

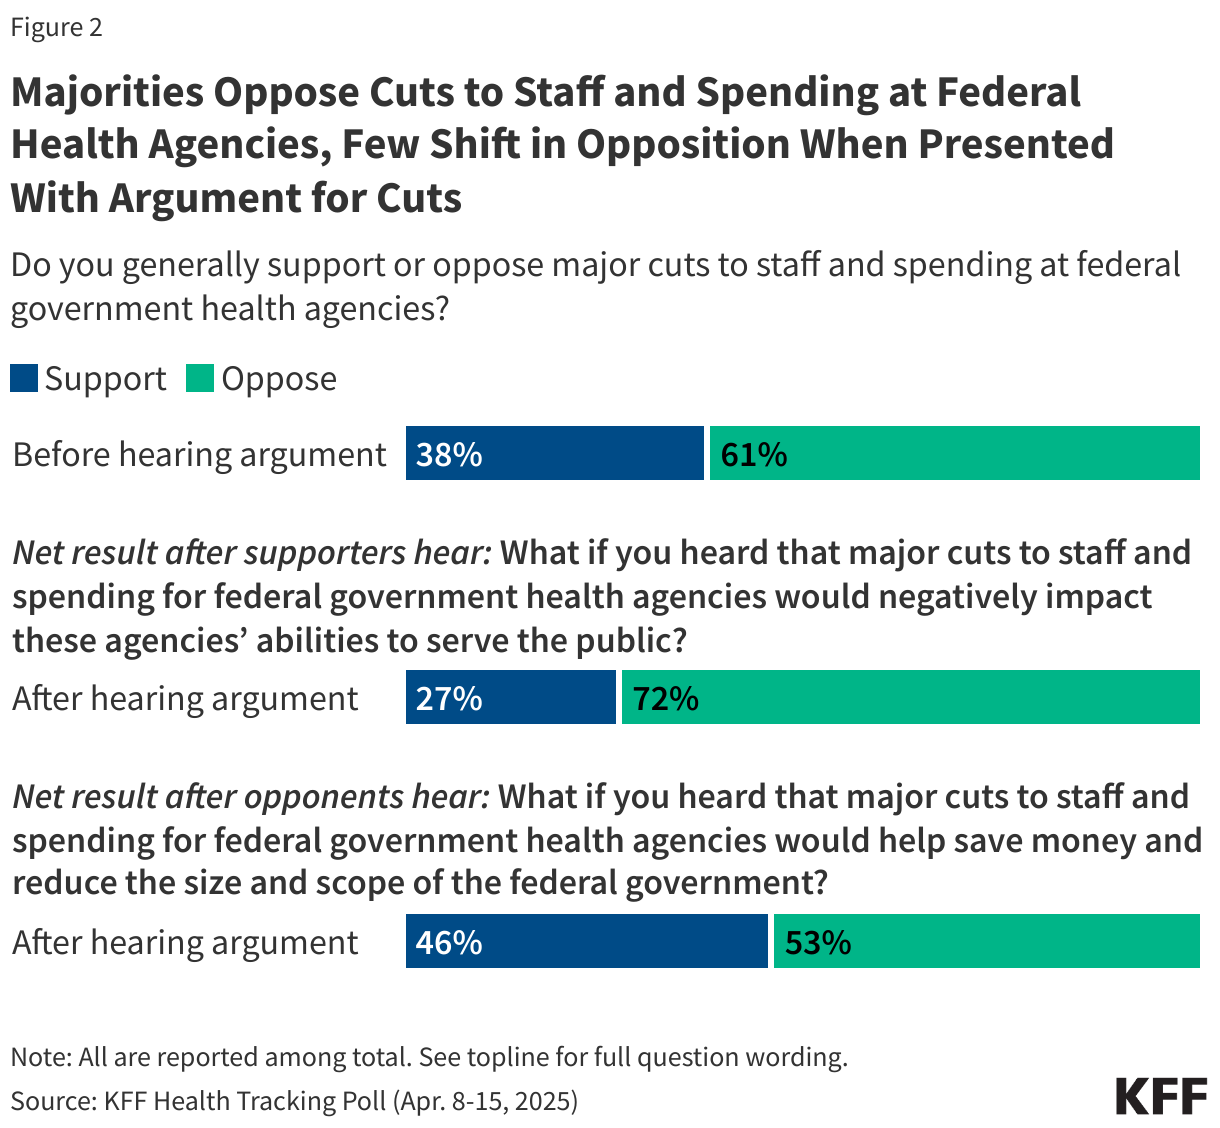
Most of the public (61%) oppose major cuts to staff and spending at federal health agencies, while two in five (38%) support such cuts. Views on the cuts to staff and spending are expectedly partisan, with the majority of Republicans supporting major cuts (72% support, 27% oppose), while nine in ten Democrats oppose the cuts (89% oppose, 10% support). Two-thirds of independents oppose the cuts (67%) while a third are in support (32%).

Support for major changes at federal government health agencies is driven by the most enthusiastic segment of President Trump’s political base – Republicans and Republican-leaning independents who identify as supporters of the Make America Great Again (MAGA) movement. This group, which makes up 75% of Republicans and leaners (31% of total U.S. adults) are demographically similar to other Republicans and Republican-leaning independents when it comes to race/ethnicity, gender, and income, but tend to be older. Roughly eight in ten MAGA-aligned Republicans say they generally support major cuts to staff and spending at federal health agencies, while non-MAGA Republicans are more divided (48% support and 52% oppose).

Six in Ten Oppose Major Cuts to Staff and Spending at Federal Health Agencies, With Nearly Nine in Ten Democrats in Opposition

Perhaps a reflection of the entrenched partisan views, hearing arguments for and against major cuts to staff and spending for federal government health agencies causes few people to change their views. When those who support cuts to the agencies hear that the cuts would negatively impact these agencies’ abilities to serve the public, about a quarter change their view, dropping overall support for the cuts to agencies nine percentage points, from 38% to 27%.

When opponents of the major cuts to federal government health agencies hear that it would help save money and reduce the size and scope of the federal government, about one in ten change their view, increasing overall support eight percentage points to about half (46%) of the public, while 53% remain opposed to the change. On many health issues, polls find that arguments can lead to large shifts in opinion, but that doesn’t seem to be the case here, with majorities continuing to oppose cuts in the face of arguments for them.

Majorities Oppose Cuts to Staff and Spending at Federal Health Agencies, Few Shift in Opposition When Presented With Argument for Cuts

Most of the public (54%) say cuts to staff and spending at federal government health agencies by the Trump administration and Musk’s Department of Government Efficiency (DOGE) go “too far” while three in ten (31%) think the cuts are “about right” and 14% say the cuts haven’t gone far enough. Republicans are largely in favor of the level of cuts at the federal government health agencies with six in ten (63%) saying the cuts have been “about right.” This is in stark comparison to the nine in ten Democrats (90%) and six in ten independents (57%) who say the cuts to health agencies have gone “too far.” MAGA Republicans are also much more likely than non-MAGA Republicans to say the cuts to staff and spending at federal government health agencies so far are “about right”, (64% vs. 46%). In fact, one-third (33%) of non-MAGA Republicans think the cuts have gone “too far.”

Half of Adults Say They Think Cuts to Federal Health Agencies Have Gone Too Far, Including One in Three Non-MAGA Republicans

In addition to believing the cuts have gone “too far,” the public expresses generally negative views about the manner in which the administration has approached these cuts. Asked which comes closer to their view, six in ten (59%) say “the administration is recklessly making broad cuts to programs and staff, including some that are necessary for agencies to function,” while a smaller share (41%) say “the administration is carefully making cuts to programs and staff to reduce fraud and waste, and to improve government efficiency.” Overall sentiment on this question is largely driven by partisanship. Large majorities of both Democrats (92%) and independents (65%) say the cuts have been reckless, while this view is shared by only one in five Republicans (18%). On the other hand, eight in ten (82%) Republicans think the administration is carefully making the cuts. MAGA supporters are much more likely to say that the administration is “carefully making cuts to programs and staff to reduce fraud and waste, and to improve government efficiency” compared to non-MAGA Republicans and Republican-leaning independents (87% vs. 57%). Notably, four in ten non-MAGA Republicans (42%) say the cuts have been reckless.

Six in Ten Adults Say the Trump Administration Is Recklessly Making Cuts to Federal Health Agencies, but Views Are Polarized Across Partisan Lines

There is Large Opposition to Funding and Staff Cuts at Government Health Agencies

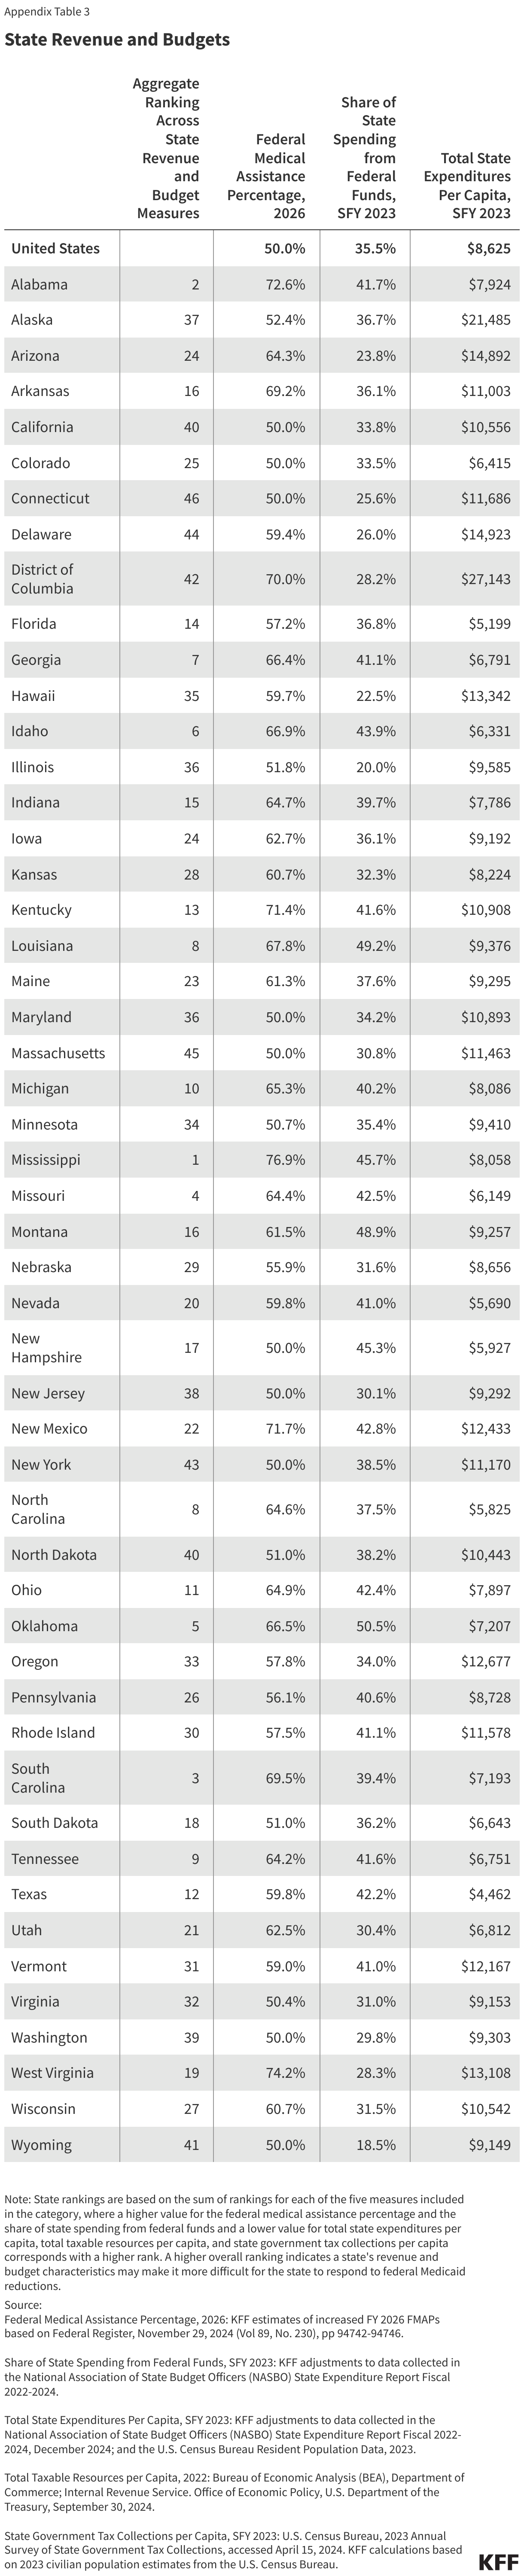
With tepid support for cuts generally, very few also support major cuts to federal funding for specific programs such as Medicaid, Medicare, and Social Security. The House budget resolution is targeting federal cuts to Medicaid for up to $880 billion or more over the next 10 years, representing 29% of state-financed Medicaid spending per resident. Trump has promised not to cut Social Security, Medicare, and Medicaid benefits.

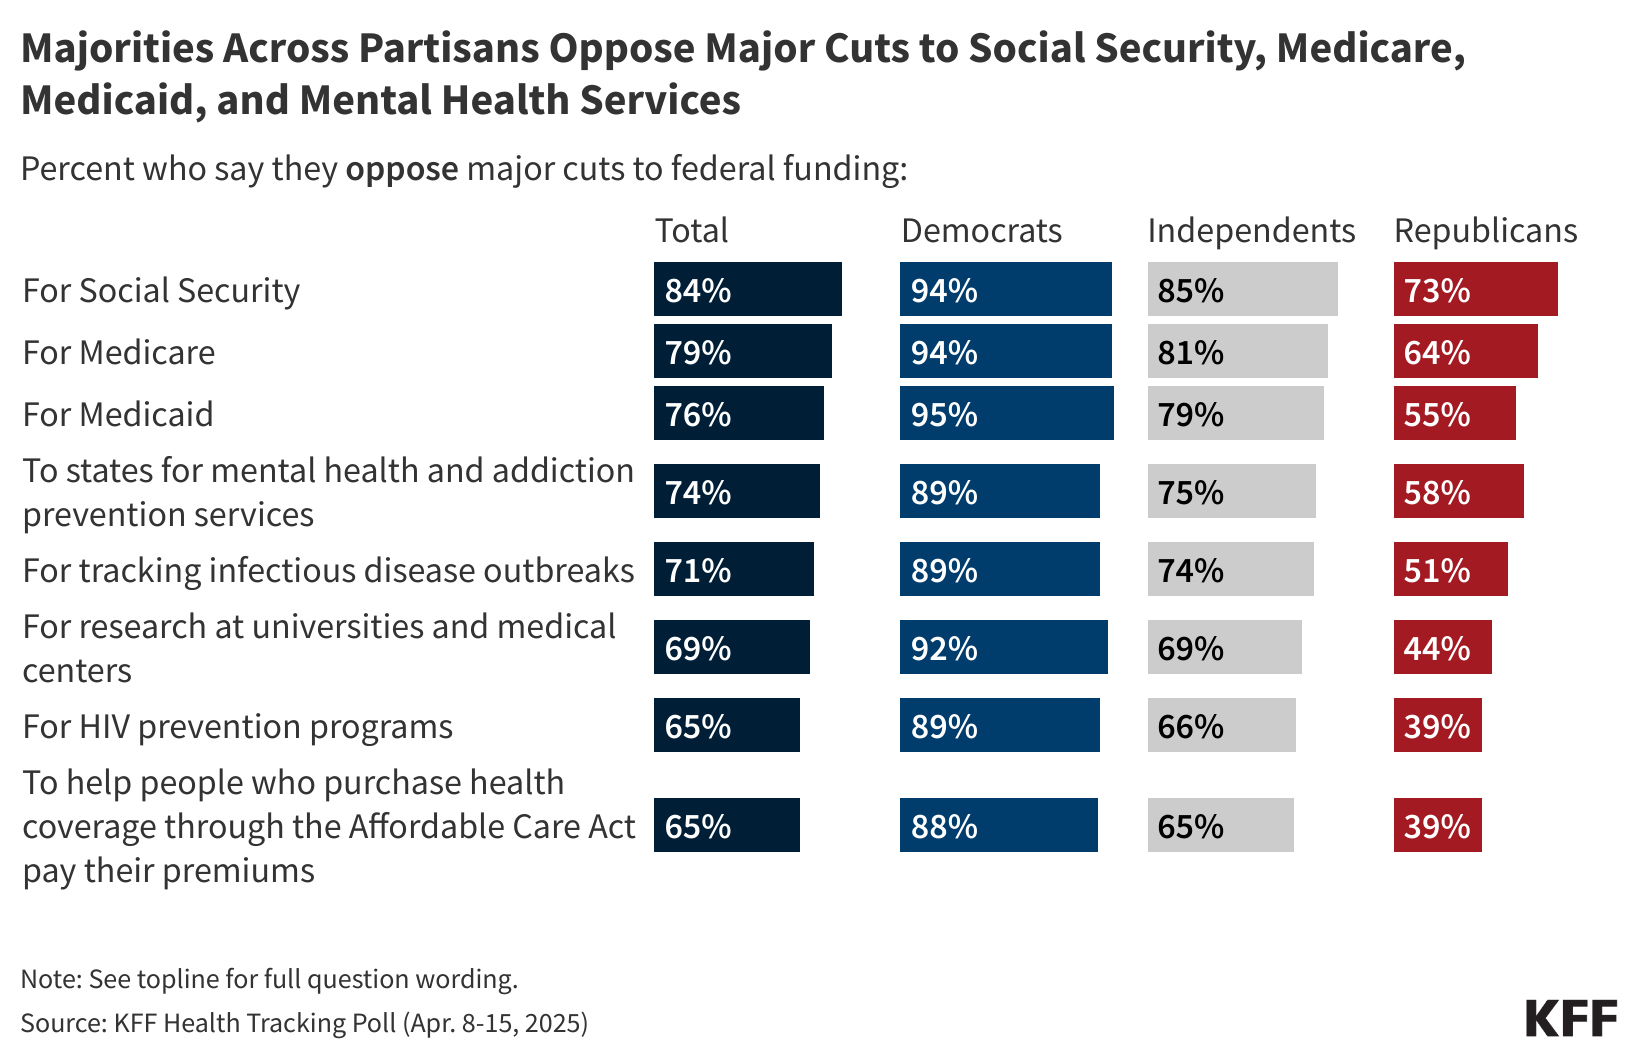
At least three-quarters of the public oppose major cuts to funding for Social Security (84%), for Medicare (79%), and for Medicaid (76%). Beyond these major programs, large shares of the public also oppose cuts in other areas of public health, research, and disease prevention. At least two-thirds oppose cutting funding to states for mental health and addiction prevention services (74%), for tracking infectious disease outbreaks (71%), for research at universities and medical centers (69%), for HIV prevention programs (65%), and to help people who purchase health coverage through the ACA to pay their premiums (65%). About one-third or fewer support major cuts to federal funding in each of these areas.

Majorities Oppose Major Cuts to Federal Funding for Public Health Programs, With at Least Three in Four Opposing Cuts to Social Security, Medicare, and Medicaid

Views on cuts to federal health spending are predictably partisan, with about nine in ten Democrats and at least two-thirds of independents opposed to funding cuts in each area included on the survey. On the other hand, about six in ten Republicans support major cuts to federal funding to help people who purchased coverage through the ACA to pay their premiums (61%) and for HIV prevention programs (61%), while about half of Republicans support cutting funding for research at universities and medical centers (56%) and for tracking infectious disease outbreaks (49%).

But majorities of Republicans oppose major cuts to funding for Social Security (73%), Medicare (64%), and Medicaid (55%). Additionally, a majority of Republicans (58%) oppose cuts to funding to states for mental health and addiction prevention services.

Majorities Across Partisans Oppose Major Cuts to Social Security, Medicare, Medicaid, and Mental Health Services

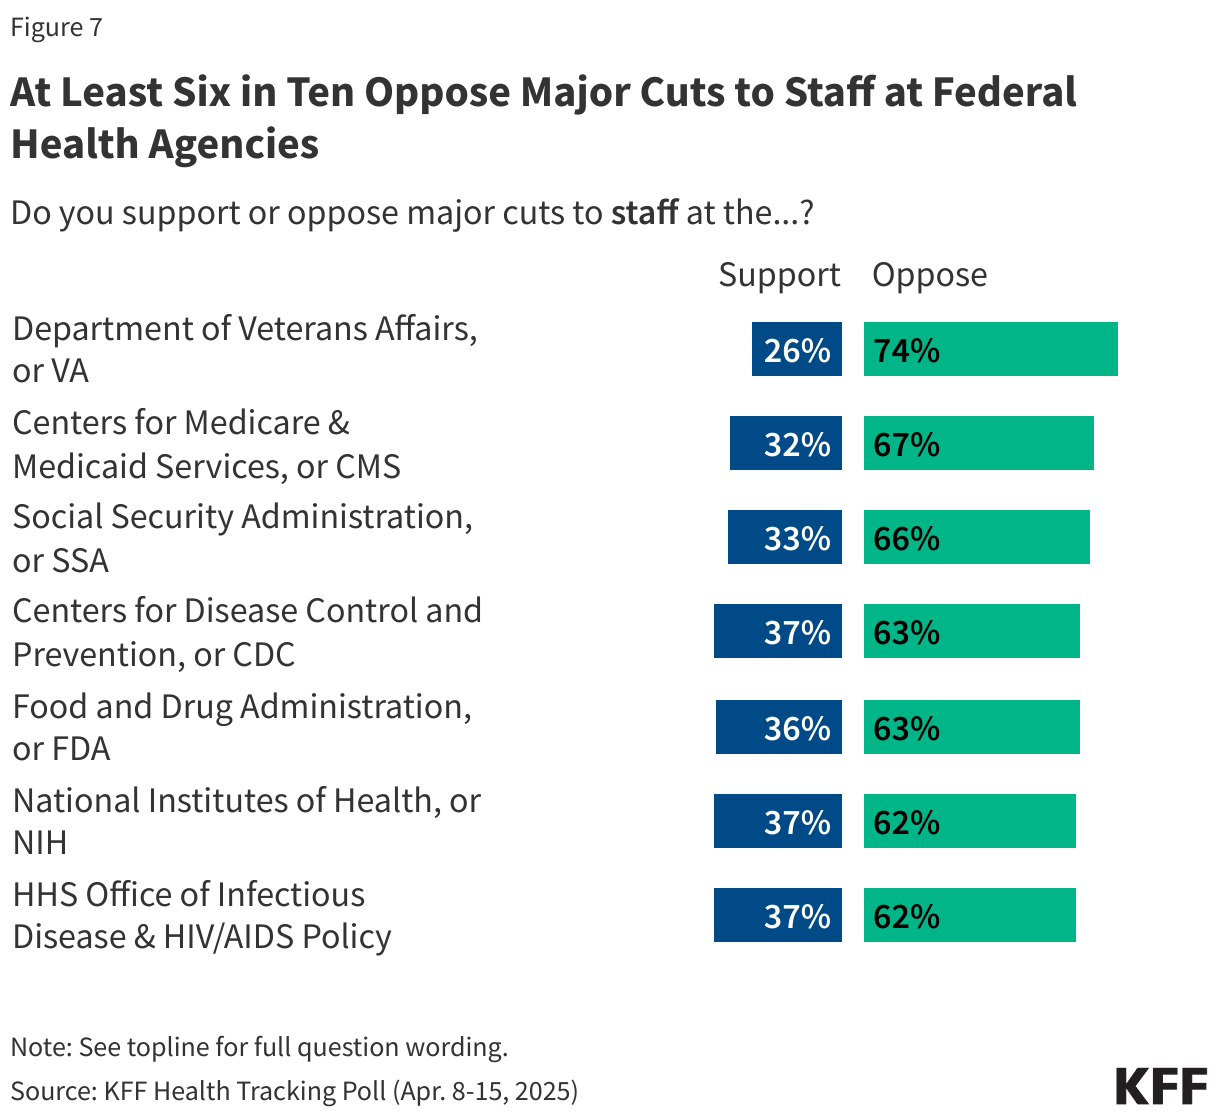
Many agencies have already undergone major staffing cuts under the Trump administration, including the Department of Veterans Affairs, or VA, which announced a plan to cut 83,000 jobs in March. Majorities of the public oppose major staffing cuts at government agencies with responsibilities in health. The largest opposition is to staffing cuts at the VA, which three-quarters of the public oppose.

At least six in ten of the public also oppose cuts to staff at the Centers for Medicare and Medicaid Services, or CMS (67%), the Social Security Administration, or SSA (66%), the Food and Drug Administration, or FDA (63%), the Centers for Disease Control and Prevention, or CDC (63%), HHS Office of Infectious Disease & HIV/AIDS Policy (62%), and the National Institute of Health, or NIH (62%).

At Least Six in Ten Oppose Major Cuts to Staff and Spending at Federal Health Agencies

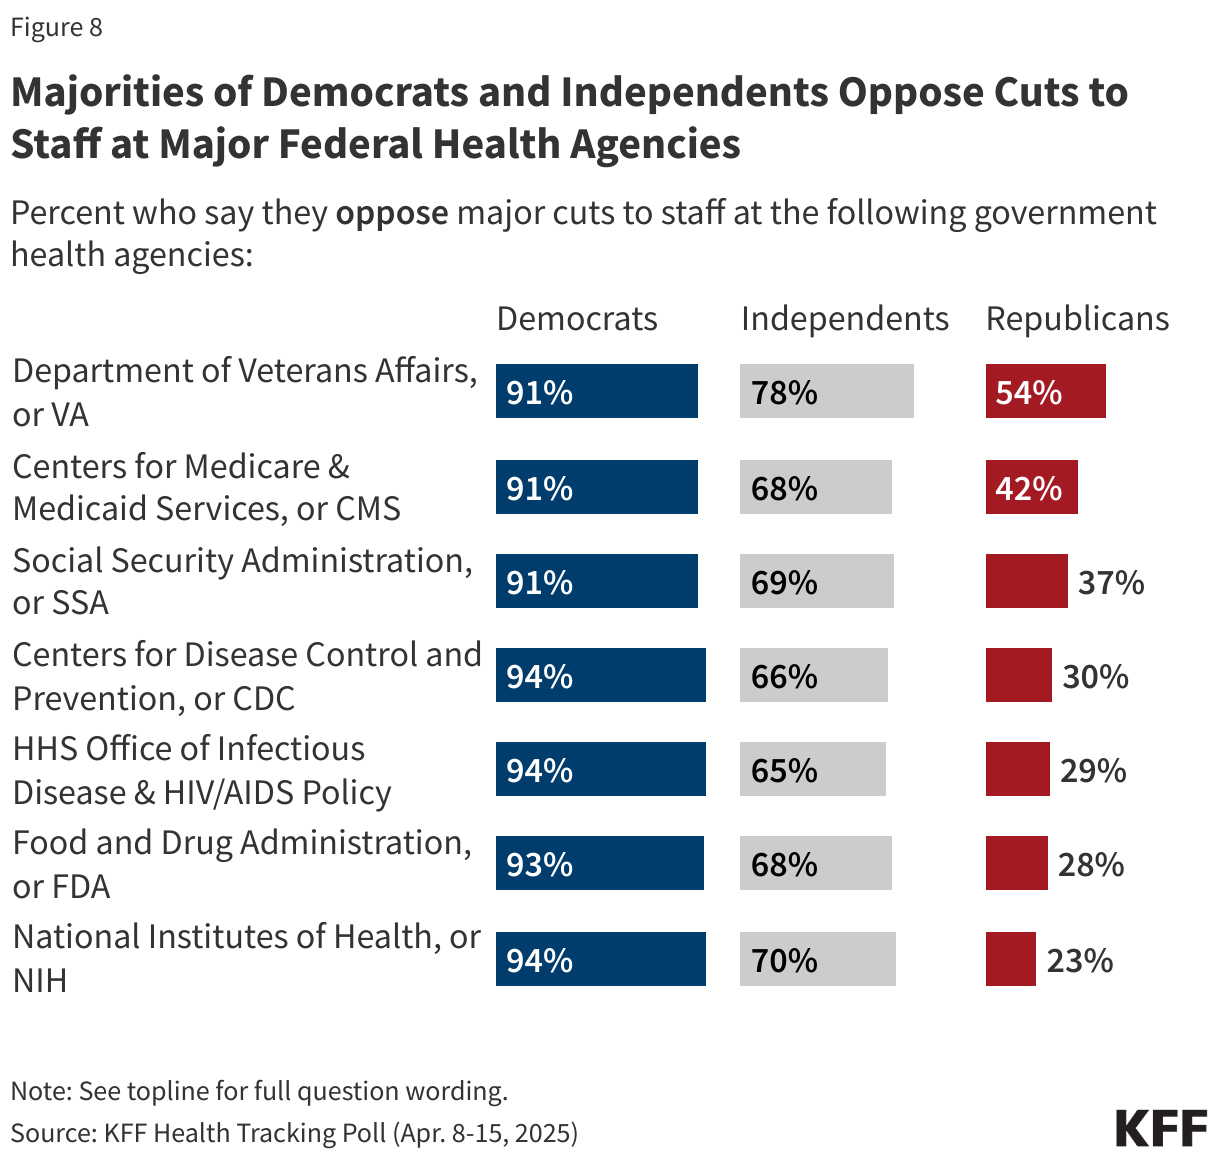
At least nine in ten Democrats oppose major staffing cuts at each of the health agencies included in the survey, while majorities of Republicans (between 58% and 77%) approve of such cuts at most agencies. One exception is staffing cuts at the Department of Veterans Affairs, or VA, with Republicans divided on the issue, with half supporting the cuts (46%) and half (54%) opposing.

Majorities of Democrats and Independents Oppose Cuts to Staff at Major Federal Health Agencies

Republicans and Republican-leaning independents who support the MAGA movement largely support the cuts to federal funding and staff, with a few notable exceptions.

Majorities of MAGA Republicans support major cuts to federal funding for HIV programs (66%), to help pay ACA premiums (64%), and for research at universities and medical centers (62%). About half support major cuts for tracking infectious disease outbreaks (51%), for Medicaid (51%), and to states for mental health and addiction prevention services (46%). Yet, fewer than four in ten MAGA Republicans support cutting funding for Medicare (38%) and just three in ten support cutting funding for Social Security.

When it comes to cutting staff, three-quarters support major cuts to staff at the HHS Office of Infectious Disease & HIV/AIDS policy (78%), CDC (78%), NIH (77%), and the FDA (75%). Another two-thirds support major cuts to staff at SSA (65%) and CMS (65%). Notably, less than half of MAGA-supporting Republicans (47%) support cuts to the VA.

Large Shares of MAGA Supporters Favor Many Cuts, But Mixed On Others

Concerns About Fraud, Waste, and Abuse in Federal Health Programs

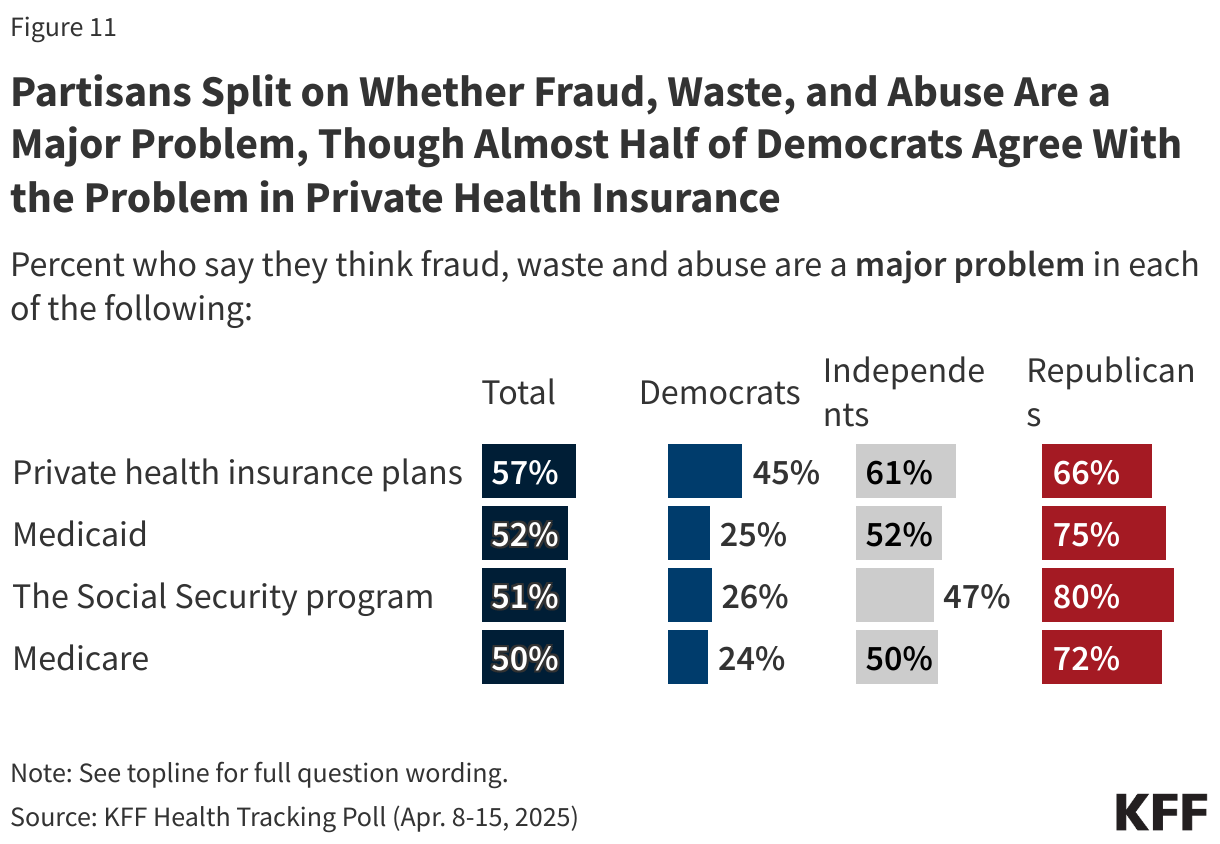
The Trump administration and DOGE have framed the cuts occurring throughout the federal government as eliminating “fraud, waste, and abuse”, implementing DOGE’s cost efficiency initiative. Large majorities of the public think fraud, waste, and abuse are a major problem facing our country’s health care programs, though most don’t view the problem as being limited to public health insurance programs. About six in ten (57%) think fraud, waste and abuse are a “major problem” in private health insurance plans, while about half say the same about Medicaid (52%), Social Security (51%), and Medicare (50%). Close to a third say fraud, waste, and abuse are a “minor problem” in each of these, while about one in ten say fraud, waste, and abuse are “not a problem”.

About Half of Adults Say They Think Was, Fraud and Abuse Are a Major Problem in Private Insurance Plans, Medicare, Medicaid and the Social Security Program

Republicans are about three times as likely as Democrats to say fraud, waste, and abuse are a major problem in Social Security (80% vs. 26%), Medicaid (75% vs. 25%) and Medicare (72% vs. 24%). There is a much smaller partisan difference in the share seeing fraud, waste, and abuse as a major problem in private health insurance, with two-thirds of Republicans (66%), six in ten independents (61%), and nearly half of Democrats (45%) sharing this view. MAGA-supporting Republicans are much more likely than non-MAGA Republicans to say fraud, waste, and abuse are major problem in private health insurance plans (69% vs. 58%), Medicaid (80% vs. 57%), Social Security (84% vs. 54%), and Medicare (77% vs. 53%).

Partisans Split on Whether Fraud, Waste, and Abuse Are a Major Problem, Though Almost Half of Democrats Agree With the Problem in Private Health Insurance

Adults in the U.S. are divided when identifying culprits of fraud, waste, and abuse in government health programs. One in three (33%) say that private health insurance companies are most often responsible for fraud, waste, and abuse in government health programs, with a similar share (29%) saying government employees running the programs are most responsible. One in five (20%) think hospitals, doctors, and other health care providers are responsible for most fraud, waste, and abuse in government health programs, while one in six (17%) say the same about people enrolled in the programs.

Less than a quarter across partisans blame people enrolled in the programs or hospitals, doctors, and health care providers for fraud, waste, and abuse in government health programs. Instead, half (49%) of Democrats identify private health insurance companies as the group most responsible for fraud, waste, and abuse while four in ten (42%) Republicans place the blame on government employees running the programs.

One in Three Say They Think Private Health Insurance Companies Are Most Responsible for Fraud, Waste, and Abuse in Government Health Programs

The Public Is Concerned How Cuts May Impact Services, but Some Think They Will Reduce Fraud and Waste and Bring Down the Deficit

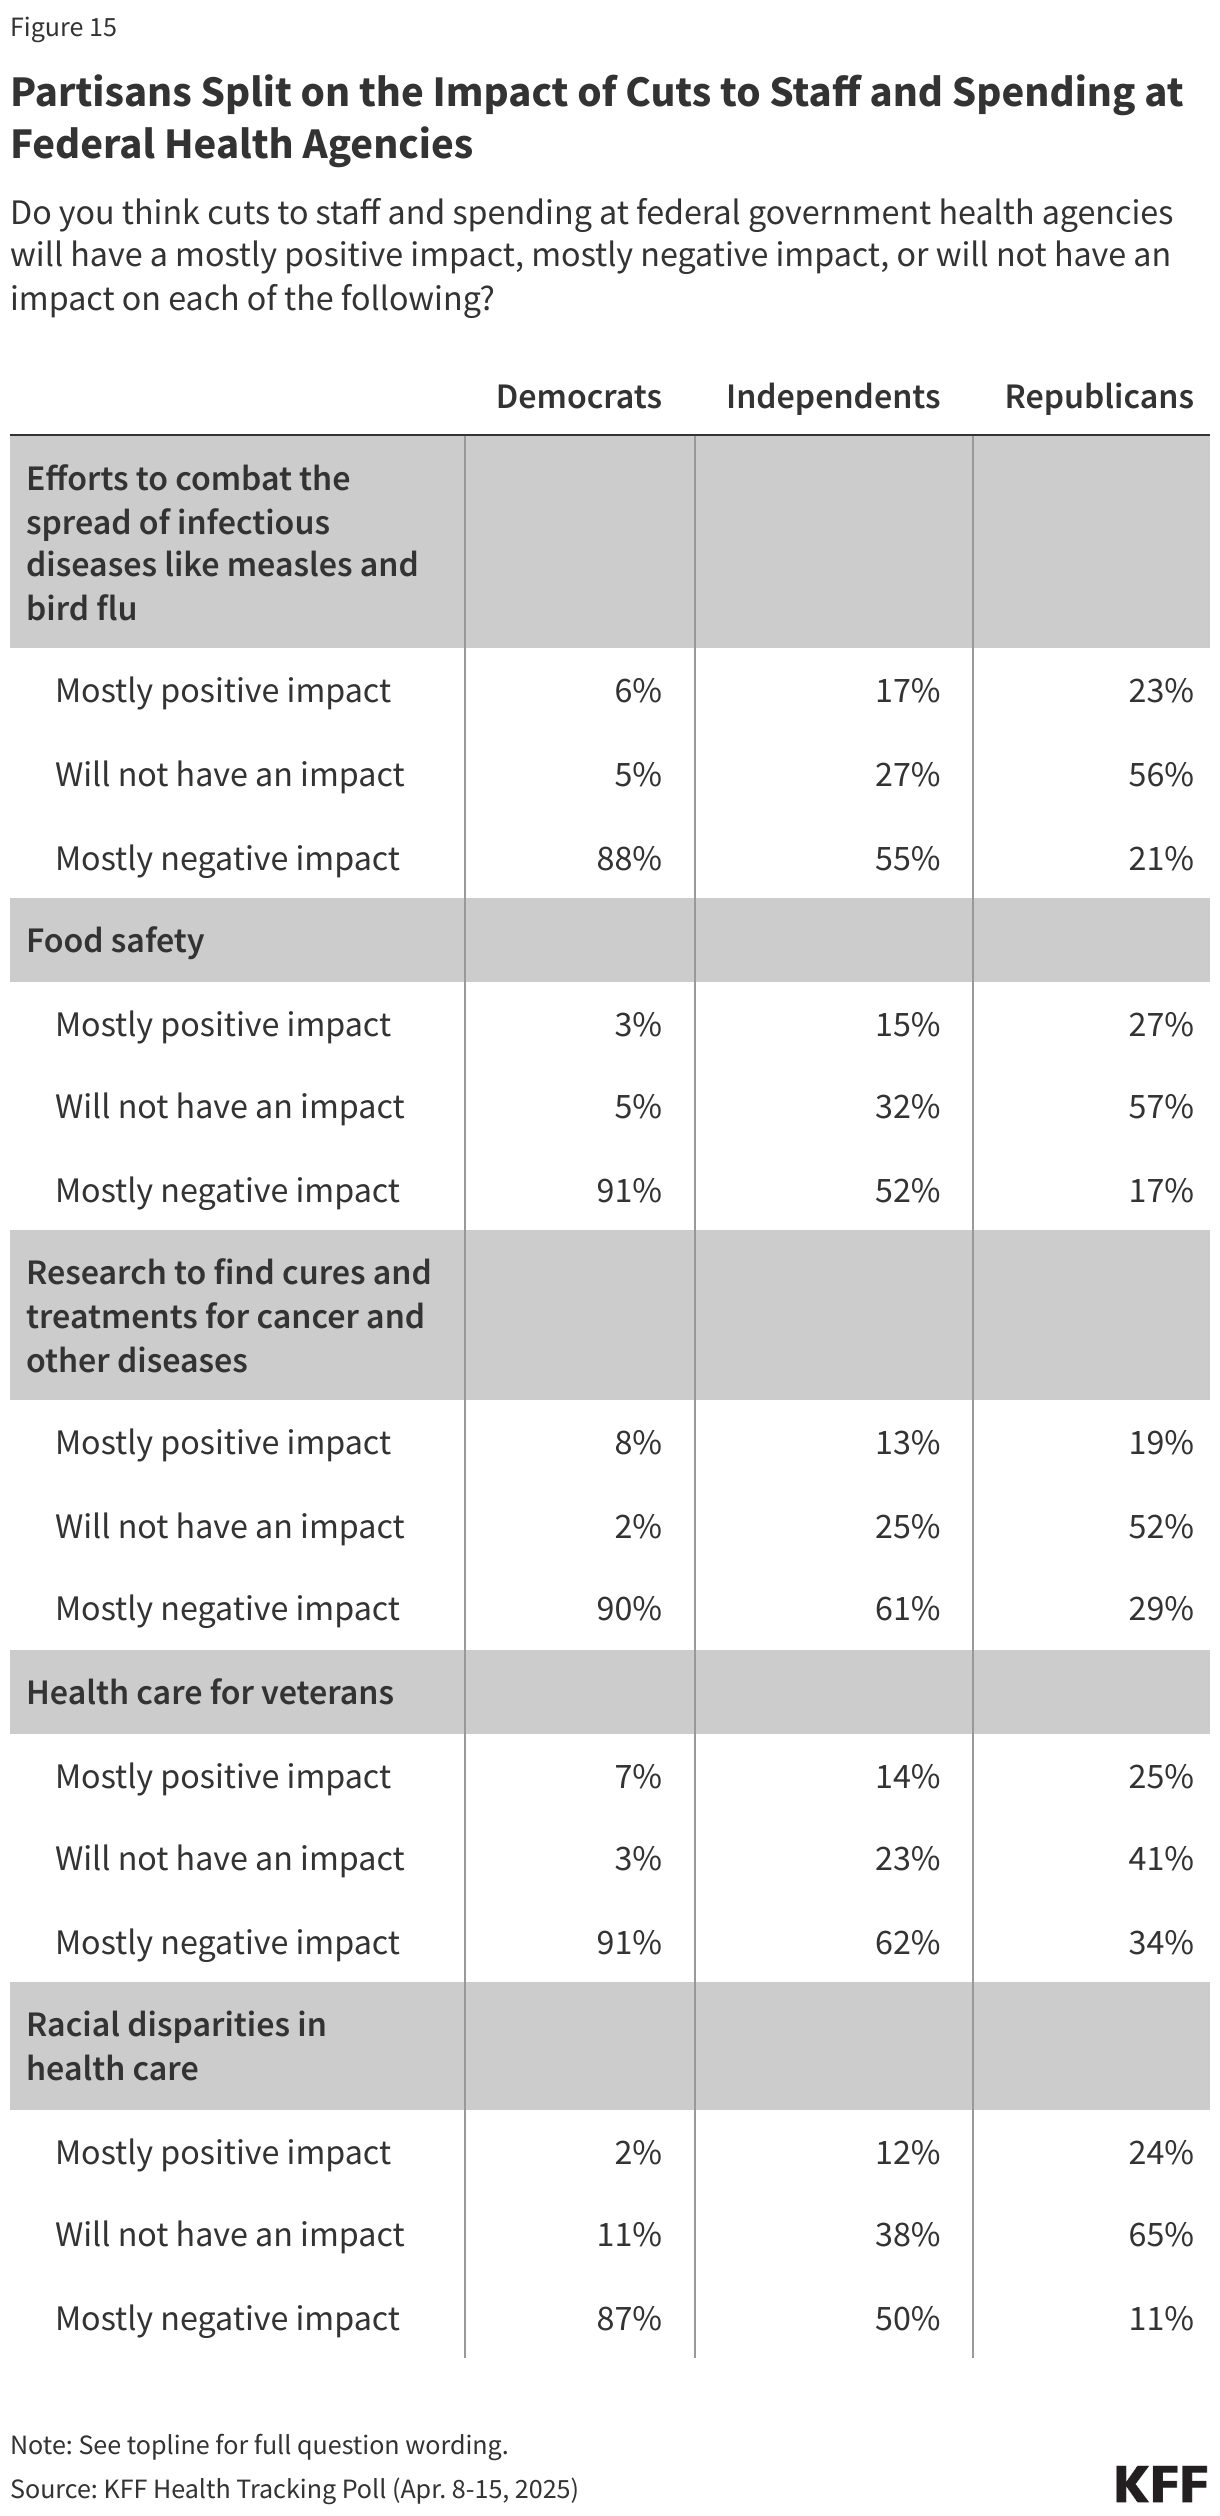
Majorities of the public believe that cuts to staff and spending at federal health agencies will have negative impacts in a variety of areas. Six in ten say these cuts will have a “mostly negative” impact on health care for veterans (62%) and on research to find cures and treatments for cancer and other diseases (60%). More than half of adults say there will be “mostly negative” impacts on efforts to combat the spread of infectious diseases like measles and bird flu (55%) as well as food safety (53%). Half believe the cuts will have a negative impact on racial disparities in health care. Fewer than one in six expect the cuts to have positive impacts in any of these areas.

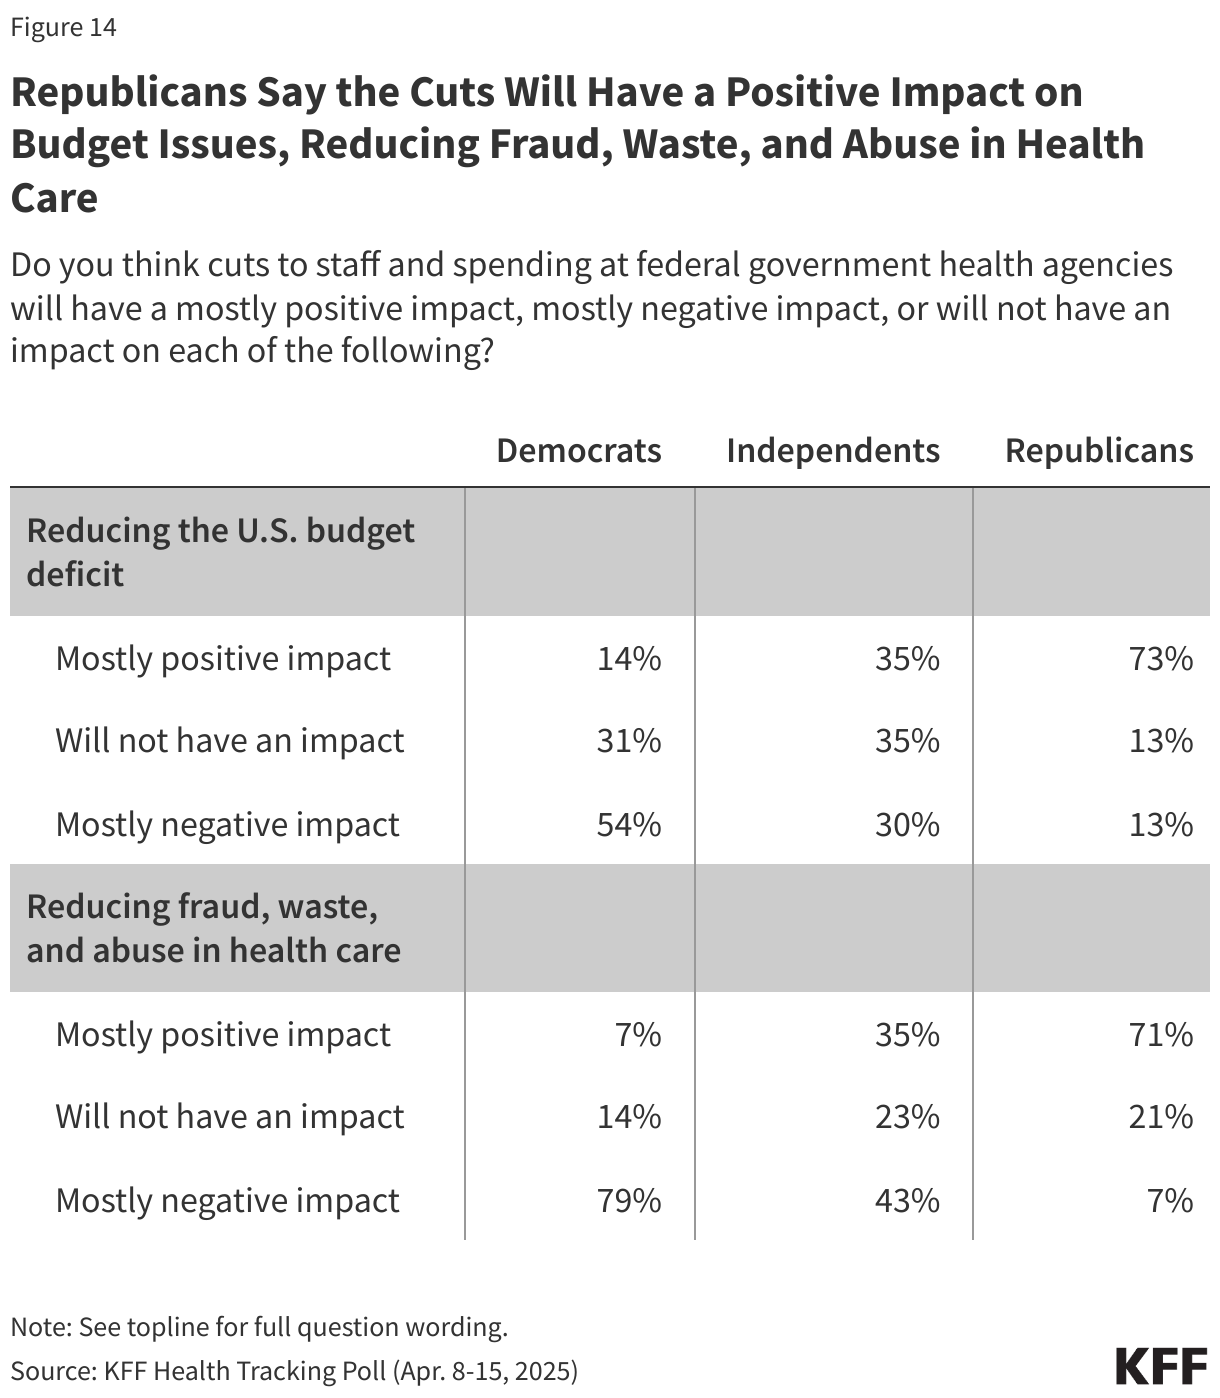
While President Trump and Elon Musk have framed many of the recent cuts as necessary to curb fraud and waste and reduce the federal budget deficit, the public is divided in their views of whether these goals are likely to be achieved. About four in ten (38%) say staff and spending cuts at federal health agencies will have a “mostly positive” impact on reducing fraud, waste, and abuse in health care, but a similar share (43%) say these cuts will have a “mostly negative” impact on reducing fraud, waste, and abuse. Similarly, while four in ten say cuts will have a positive impact on reducing the U.S. budget deficit, nearly as many (34%) say they will have a “mostly negative” impact.

Half or More Think Cuts to Staff and Spending at Federal Health Agencies Will Have Negative Impacts on Most Aspects, but Remain Split on the Impact Cuts Will Have on Budget

Most Democrats say the cuts to staff and spending will negatively impact health care for veterans (91%), food safety (91%), research to find cures and treatments for cancer and other diseases (90%), efforts to combat the spread of infectious diseases like measles and bird flu (88%), and racial disparities in health care (87%).

Republicans are more positive about how the cuts will impact the budget and waste in health care, with at least seven in ten saying the cuts will have a “mostly positive” impact on reducing the U.S. budget deficit (73%) and reducing fraud, waste, and abuse in health care (71%). Most Democrats say the cuts to staff and spending will have a “mostly negative” impact in these areas while independents are divided in how they think the cuts will impact fraud and waste as well as reducing the U.S. budget deficit.

Republicans Say the Cuts Will Have a Positive Impact on Budget Issues, Reducing Fraud, Waste, and Abuse in Health Care

Republicans are also more likely than both independents and Democrats to think that the cuts to staff and spending will not have any impact on the areas that affect public health, like racial disparities in health care (65%), food safety (57%), efforts to combat infectious disease (56%), and research to find cures for treatments for cancer and other diseases (52%). Majorities of independents and Democrats think the cuts will have “mostly negative” impacts in each of these areas.

Partisans Split on the Impact of Cuts to Staff and Spending at Federal Health Agencies

Methods

This KFF Health Tracking Poll/KFF Tracking Poll on Health Information and Trust was designed and analyzed by public opinion researchers at KFF. The survey was conducted April 8-15, 2025, online and by telephone among a nationally representative sample of 1,380 U.S. adults in English (1,322) and in Spanish (58). The sample includes 1,022 adults (n=48 in Spanish) reached through the SSRS Opinion Panel either online (n=997) or over the phone (n=25). The SSRS Opinion Panel is a nationally representative probability-based panel where panel members are recruited randomly in one of two ways: (a) Through invitations mailed to respondents randomly sampled from an Address-Based Sample (ABS) provided by Marketing Systems Groups (MSG) through the U.S. Postal Service’s Computerized Delivery Sequence (CDS); (b) from a dual-frame random digit dial (RDD) sample provided by MSG. For the online panel component, invitations were sent to panel members by email followed by up to three reminder emails.

Another 358 (n=17 in Spanish) adults were reached through random digit dial telephone sample of prepaid cell phone numbers obtained through MSG. Phone numbers used for the prepaid cell phone component were randomly generated from a cell phone sampling frame with disproportionate stratification aimed at reaching Hispanic and non-Hispanic Black respondents. Stratification was based on incidence of the race/ethnicity groups within each frame. Among this prepaid cell phone component, 194 were interviewed by phone and 164 were invited to the web survey via short message service (SMS).

Respondents in the prepaid cell phone sample who were interviewed by phone received a $15 incentive via a check received by mail. Respondents in the prepaid cell phone sample reached via SMS received a $10 electronic gift card incentive. SSRS Opinion Panel respondents received a $5 electronic gift card incentive (some harder-to-reach groups received a $10 electronic gift card). In order to ensure data quality, cases were removed if they failed two or more quality checks: (1) attention check questions in the online version of the questionnaire, (2) had over 30% item non-response, or (3) had a length less than one quarter of the mean length by mode. Based on this criterion, no cases were removed.

The combined cell phone and panel samples were weighted to match the sample’s demographics to the national U.S. adult population using data from the Census Bureau’s 2024 Current Population Survey (CPS), September 2023 Volunteering and Civic Life Supplement data from the CPS, and the 2024 KFF Benchmarking Survey with ABS and prepaid cell phone samples. The demographic variables included in weighting for the general population sample are sex, age, education, race/ethnicity, region, civic engagement, frequency of internet use, political party identification by race/ethnicity, and education. The weights account for differences in the probability of selection for each sample type (prepaid cell phone and panel). This includes adjustment for the sample design and geographic stratification of the cell phone sample, within household probability of selection, and the design of the panel-recruitment procedure.

The margin of sampling error including the design effect for the full sample is plus or minus 3 percentage points Numbers of respondents and margins of sampling error for key subgroups are shown in the table below. For results based on other subgroups, the margin of sampling error may be higher. Sample sizes and margins of sampling error for other subgroups are available on request. Sampling error is only one of many potential sources of error and there may be other unmeasured error in this or any other public opinion poll. KFF public opinion and survey research is a charter member of the Transparency Initiative of the American Association for Public Opinion Research.

GroupN (unweighted)M.O.S.E.
Total1,380± 3 percentage points
Parents of children under 18457± 6 percentage points
Party ID
Democrats469± 6 percentage points
Independents466± 5 percentage points
Republicans361± 6 percentage points
News Release

Most of the Public Oppose Major Federal Cuts to Health Agencies and Programs and Say They Have Been Made “Recklessly”

The Public, Including Most Republicans, Oppose Medicaid Cuts; MAGA Supporters Are Divided

Published: May 1, 2025

As the Trump administration and Congress pursue broad cuts to federal health agencies and budgets, most of the public, including some Republicans, oppose deep budget and staffing cuts to federal health programs and agencies, a new KFF Health Tracking Poll finds.

Across a range of questions, large majorities of Democrats and independents oppose the Trump administration’s major cuts to federal health agencies and programs, while Republicans are more supportive. Those who identify with President Trump’s Make America Great Again movement are even more supportive of cuts to health agency’s staff and budget but still split on cuts to funding for Medicaid and a few other programs.

For example, most of the public (61%), including large shares of Democrats (89%) and independents (67%), oppose major health spending and staff cuts at federal health agencies. In contrast, MAGA supporters overwhelmingly support such cuts (78%), while Republicans and Republican-leaning independents who don’t align with MAGA are divided (48% support the cuts, 52% oppose).

Similarly, most (59%) of the public, including large majorities of Democrats (92%) and independents (65%), say the Trump administration and its Department of Government Efficiency (DOGE) have been “recklessly making broad cuts to programs and staff.”  

In contrast, the vast majority of MAGA supporters (87%), and a narrower majority of non-MAGA Republicans and Republican leaners (57%), say that the administration is “carefully making cuts to programs and staff to reduce fraud and waste.”

On Medicaid, a contentious issue as the Trump administration and Congressional Republicans weigh budget cuts to help finance tax cuts, three quarters (76%) of the public say they oppose major federal funding cuts.

A narrow majority of Republicans (55%), as well as larger majorities of Democrats (95%) and independents (79%), oppose major Medicaid cuts. MAGA supporters are closely divided on major funding cuts to Medicaid, with similar shares in favor (51%) and opposed (49%) to major cuts.

Large Majorities Oppose Specific Cuts to Federal Health Programs and Agencies

The poll also gauges the public’s views on federal funding cuts for other health programs. In each case, more than six in 10 oppose specific federal health cuts.  For example:

  • About three quarters (74%) oppose major cuts to states for mental health and addiction prevention services. This includes a narrow majority of Republicans (58%), and large majorities of Democrats (89%) and independents (75%).
  • Most (71%) oppose major cuts to funding to track infectious disease outbreaks. This includes half of Republicans (51%), and large majorities of Democrats (89%) and independents (74%).
  • Seven in 10 (69%) oppose major cuts to research at universities and medical centers. This includes large majorities of Democrats (92%) and independents (69%). In contrast, most Republicans (56%) favor such cuts.
  • Nearly two thirds (65%) oppose reduced federal funding to help people pay the premiums for health coverage purchased through the Affordable Care Act marketplaces. This includes large majorities of Democrats (88%) and independents (65%). In contrast, most Republicans, (61%) favor such cuts.

Most of the public also opposes major staffing cuts to key federal health agencies such as the Department of Veteran Affairs (74% oppose), Centers for Medicare & Medicaid Services (67%), the Centers for Disease Control and Prevention (63%), the Food and Drug Administration (63%), and the National Institutes of Health (62%).

Republicans and MAGA supporters narrowly oppose major staffing cuts for Veterans Affairs but favor them at each of the other agencies.

Partisans See Different Drivers of Fraud and Waste in Government Health Program

About half of the public say that fraud, waste, and abuse are a major problem in Medicaid (52%), Social Security (51%), and Medicare (50%), and a slightly larger majority say it is a major problem in private health insurance (57%).

Partisans choose different groups when asked who is most responsible for fraud, waste, and abuse in government health programs. About half of Democrats (49%) say private health insurers are most responsible, while Republicans most often name government workers (42%). Fewer across partisans blame people enrolled in the programs or hospitals, doctors and other health providers.

Designed and analyzed by public opinion researchers at KFF, this survey was conducted April 8-15, 2025, online and by telephone among a nationally representative sample of 1,380 U.S. adults in English and in Spanish. The margin of sampling error is plus or minus 3 percentage points for the full sample. For results based on other subgroups, the margin of sampling error may be higher.

Medicaid Work Requirements: Implications for Low Income Women’s Coverage

Published: Apr 30, 2025

Work requirements for Medicaid enrollees have once again resurfaced, now as part of a broader legislative package of potential changes for the Medicaid program aimed at reducing federal spending. Given that women make up over half of adult Medicaid enrollees and women’s well documented role taking on childcare and family responsibilities, Medicaid work requirements would heavily impact women in the program. Full details of the work requirements proposal are still unknown, but analysis of previous legislation from the Congressional Budget Office found that while national work requirements would lower federal spending, they would lead to a drop in Medicaid enrollment and an increase in the number of people who are uninsured but would not increase employment.

The first Trump Administration made a significant change to the Medicaid program by giving states the option to impose work requirements as a condition of Medicaid eligibility through Section 1115 waivers. While 13 states received approval for work requirement waivers, many were struck down in court and the Biden administration rescinded the remaining waivers. Today, only Georgia has a Medicaid work requirement in place for parents and childless adults with incomes below 100% of the federal poverty level (FPL) who are newly eligible through the state’s Pathways waiver. However, several states have submitted or are developing new 1115 waivers or considering legislation to condition Medicaid eligibility on meeting work and reporting requirements.

Medicaid, the nation’s health program for low-income people, provided health and long-term coverage to one in five adult women ages 19 to 64 in 2023. Imposing work requirements in Medicaid would heavily impact women on the program and could lead to Medicaid coverage losses not only for those who lose eligibility because they don’t work or meet an exemption but also among people who remain eligible for the program but lose coverage due to new administrative burdens or red tape. This data note documents differences by sex in the work status of adult Medicaid enrollees ages 19-64 who were not receiving Supplemental Security Income (SSI) and were not dually eligible for Medicare in 2023, and highlights differences by parent status.

What is the work status of women and men covered by Medicaid?

Over nine in ten women and men on Medicaid were working full or part-time for pay or were not working because of caregiving responsibilities, illness or disability, or school attendance in 2023 (Figure 1).1  More than half of men (54%) and more than a third of women (36%) on Medicaid worked full-time during the year. A larger share of women (24%) compared to men (15%) worked part-time. Four in ten (40%) women and three in ten (31%) men enrolled in Medicaid did not work for pay in 2023, most for reasons that would likely exempt them from work requirements.

Among Medicaid adults who are not working, women are more likely to cite caregiving responsibilities while men are more likely to report an illness or disability as reasons for not working. One in five (19%) women enrolled in Medicaid did not work in 2023 because of caregiving responsibilities, compared to 4% of men (Figure 1). One in ten (9%) women said they did not work because of an illness or disability and 6% did not work because they were going to school. Similar shares of men and women report school as the reason they did not work. All the leading reasons women cite for not working would likely qualify for exemptions from state-level Medicaid work requirements. Depending on how work requirement policies are crafted, women who are exempt may have to submit paperwork to document the reasons for their exemption to remain eligible for Medicaid coverage.

Among Those Enrolled in Medicaid, Six in Ten Women and Seven in Ten Men Worked in 2023

Many Medicaid enrollees are working in service jobs with few benefits, such as health insurance and paid sick days. The top industries that employ women with Medicaid are the restaurant and food service industry, schools, and hospitals, while men tend to work in construction, the restaurant and food service industry, and landscaping services (Appendix Table 2).

What are the reasons that some adults work part-time?

Women were more likely than men to cite family obligations and child care issues as reasons for working part-time. Almost one in four (24%) women with Medicaid worked part-time in 2023 compared to one in seven (15%) men (Figure 2). Women were more likely than men to report they worked part-time because of family or personal obligations (27% vs. 12%) or child care problems (12%; data for men suppressed because it did not meet the minimum standards for statistical reliability). Four in ten men and three in ten women said they worked part time because of slack work/business conditions, they could only find part-time work or because their work week was less than 35 hours. Similar shares of women and men with Medicaid coverage worked part-time because of school or training responsibilities or because of health or medical limitations. Individuals who are working part-time are often ineligible for benefits even if they are offered by their employers, particularly health insurance coverage.

Among Part-Time Workers, Childcare Problems and Family Obligations Are the Leading Reason for Part Time Work for Women

What is the work status of mothers and fathers with Medicaid coverage?

Parents with children under 18 – both mothers and fathers – with Medicaid were more likely to work for pay in 2023 than Medicaid adults without dependent children, but fathers were more likely to work than mothers. Just under half (48%) of women ages 19 to 64 with Medicaid have children under 18 as do one-third of men on the program. About two-thirds (64%) of women with children under 18 and 87% of men with children under 18 worked full or part-time compared to 56% of women and 59% of men without children under 18 (Figure 3). Fathers were more likely to work full-time compared to mothers (78% vs. 40%) in 2023. The leading reason cited by mothers for not working (28%) was they were taking care of children and family.

Among women and men without children, the leading reason for not working was an illness or disability (13% and 15%, respectively). One in ten women and men without children reported they were not working because they were going to school (10% and 9%, respectively). Notably, even among women without children, over one in ten (11%) said they were not working because of caregiving responsibilities, which could include caring for adult children or aging or ill parents (Figure 3). Caregiving responsibilities generally consume a lot of a person’s time and could make it difficult to meet paperwork requirements to file for exemptions from work requirements.

Three in Ten Women Enrolled in Medicaid with Children Under Age 18 Are Not Working Due to Caregiving Responsibilities

Appendix

Share of Working Adult Medicaid Enrollees by Demographic Characteristics and Sex, 2023

Top Industries and Occupations With the Largest Number of Workers With Medicaid Coverage by Sex, 2023
Percent of Working Adult Medicaid Enrollees by Sex and Parental Status, 2023
  1. This data note is based on KFF analysis of data from the Current Population Survey ASEC Supplement, which stratifies data by an individual’s sex as male or female. Throughout this brief we refer to “women” and “men” but recognize that not all people who are born as females identify as “women” and not all people who are born as male identify as “men.” ↩︎

5 Questions About the Idea of Default Enrollment into Medicare Advantage Plans

Published: Apr 29, 2025

President Trump has said he will not cut Medicare benefits. At the same time, key figures within the administration, policymakers, and some conservative groups have previously expressed support for boosting the role of Medicare Advantage within the Medicare program, which could include changing the Medicare enrollment process, making Medicare Advantage the default enrollment option rather than traditional Medicare. Under current law, people who sign up for Medicare Parts A and B are automatically enrolled in traditional Medicare, unless they affirmatively choose to enroll in a Medicare Advantage plan. In contrast, under a Medicare Advantage default enrollment approach, unless Medicare beneficiaries make an affirmative choice to enroll in either traditional Medicare or a specific Medicare Advantage plan, they would be automatically enrolled into a Medicare Advantage plan, with the option to switch plans or enroll in traditional Medicare.

This brief considers how default enrollment into Medicare Advantage might work, potential challenges with this approach, and implications for beneficiaries, insurers, providers, agents and brokers, and the federal budget.

How would default enrollment into Medicare Advantage differ from the current enrollment process?

In general, when eligible people first enroll in Medicare during their Initial Enrollment Period (IEP), they can sign up for Medicare Part A and Part B. Once enrolled, new Medicare beneficiaries have the option to get their benefits under traditional Medicare or a private Medicare Advantage plan. New Medicare beneficiaries are automatically covered under traditional Medicare unless they choose to enroll in a Medicare Advantage plan in their area. In 2025, beneficiaries have a choice of 34 Medicare Advantage plans with prescription drug coverage, on average.

In 2023, about 2.8 million beneficiaries newly enrolled in Medicare, with slightly more than half (54%) or 1.5 million people covered by traditional Medicare and slightly less than half (46%) or 1.3 million enrolling in Medicare Advantage (Figure 1). For those covered by traditional Medicare when they newly enrolled in Medicare, it is possible that they made a change to their coverage and switched to a Medicare Advantage plan after their initial enrollment period. Defaulting individuals into a Medicare Advantage plan would be a change in the way most new Medicare beneficiaries get their coverage.

In 2022, Slightly More Than Half (56%) of Newly Eligible Medicare Beneficiaries Were Covered by Traditional Medicare

In contrast to the current approach, some have proposed to enroll newly eligible beneficiaries in Medicare Advantage by default, rather than traditional Medicare. Proposals vary in the level of detail, but in general, this process would involve assigning individuals to a specific Medicare Advantage plan based on certain criteria, such as patient-provider relationships or plan attributes, as discussed below.

Default options have been used across a variety of fields, including in the areas of retirement savings, organ donations, and electricity pricing programs. In these instances, defaulting people into certain programs with the option to opt out have shown to have a powerful effect on people’s choices, often resulting in a large share of people accepting the default option. In an analysis of default enrollment into Medicare Part D plans for certain low-income beneficiaries (as discussed in more detail below), the authors found that only 16% of individuals opted out of the plan they were randomly defaulted into and actively selected a new plan. The evidence on the impact of default enrollment on individual choices is one of the reasons proponents have put forward this approach for Medicare Advantage.

There are a number of questions about proposals to default beneficiaries into Medicare Advantage plans, along with tradeoffs, such as:

  • What criteria would be used to assign new Medicare beneficiaries to a specific Medicare Advantage plan offered in their area, and how would the assignment to a private plan affect the continuity of care between patients and their doctors (due to provider networks), the ability of beneficiaries to access drugs prescribed by their doctors (due to variations in plan formularies) or timely access to services (due to prior authorization requirements)?
  • Would the new system take into account special considerations such as whether the new Medicare beneficiary has a disability, is covered under both Medicare and Medicaid, or has a condition that requires access to specific medical providers or health care facilities within proximity to their home?
  • What information would be provided to beneficiaries who are default enrolled into a Medicare Advantage plan about other Medicare coverage options that are available to them, including other Medicare Advantage plans or traditional Medicare and stand-alone Part D prescription drug plans in their area? How much time would beneficiaries be given to make a change before being locked in until the next annual open enrollment period?
  • Will beneficiaries who wish to switch out of the Medicare Advantage plan in which they were enrolled and switch to traditional Medicare be provided a special enrollment period for Medigap, without pre-existing condition exclusions, if they choose to switch beyond the current 12-month “trial period” for people switching from Medicare Advantage to traditional Medicare regardless of the duration of their enrollment in Medicare Advantage?
  • How would this approach impact insurers that offer Medicare Advantage plans? Would insurers have the option to opt out of the default enrollment system and continue to enroll new Medicare beneficiaries? What would be the impact on insurance brokers?
  • What would be the impact of default Medicare Advantage enrollment on Medicare spending? While some claim this approach could achieve savings, the increase in Medicare Advantage enrollment that results from default enrollment would likely increase Medicare spending (and Part B premiums paid by all beneficiaries), without a change in current payment methodology. The Medicare Payment Advisory Commission (MedPAC) has consistently found that Medicare pays more for people enrolled in Medicare Advantage than for similar beneficiaries in traditional Medicare.

How would the government assign individuals to Medicare Advantage plans?

One of the main policy considerations for proposals that would default beneficiaries into specific Medicare Advantage plans is how the government would make this assignment. This is particularly challenging because plans vary across an array of features, including premiums, cost sharing for services, provider networks, drug coverage, plan quality (star ratings), extra benefits, and the frequency with which they impose prior authorization requirements and issue denials.

There are a number of different approaches that could be considered to implement default enrollment into Medicare Advantage:

  • Random assignment. The government could randomly assign new Medicare beneficiaries to one of the plans offered in their area. This would ensure more even distribution of enrollment across plans, without benefiting one plan (or insurer) over another. However, random assignment would not take into account any plan features that might matter to individual beneficiaries, such as premiums, cost sharing, the scope of extra benefits, existing relationships with providers, drugs taken by the individual, or quality ratings.
  • CMS currently uses random assignment for certain beneficiaries with LIS, a process which is intended to ensure a generally even distribution of beneficiaries among benchmark (premium-free) plans and to minimize selection bias for plans. However, this process does not match an individual’s prescription drugs with the list of drugs covered by plans, as opposed to a more targeted approach (“intelligent assignment” or “person-centered” assignment, which has been proposed by some advocates and policymakers) tries to align beneficiary needs with plan features. The possibility for greater discordance between an individual’s medical care needs and circumstances would likely arise with a random approach to default enrollment in Medicare Advantage plans, which would encompass more domains than just prescription drugs, such as continuity of coverage with primary care providers.
  • Preserve existing relationships with physicians, specialists and other health care providers. Some proposals would assign patients to plans based on their relationship with a primary care provider or a specific specialist. Being able to see preferred providers in-network is one of the plan elements that is a top priority for beneficiaries. However, this process might not be able to take into account relationships with all providers and may not account for relationships with providers that are most consequential to beneficiaries (e.g., for some beneficiaries it might be their primary care physician while for others it might be a certain specialty care physician). If there are also only one or two insurers offering plans in a certain area, any existing provider relationships may not be able to be prioritized at all if providers are not in plan networks. This process would also require a way to identify relationships with providers for individuals who are not yet covered by Medicare, which could prove challenging.
  • Challenges with preserving existing provider relationships for beneficiaries automatically assigned to plans were evident as part of the Financial Alignment Initiative (FAI) for beneficiaries enrolled in both Medicare and Medicaid. As part of this demonstration, states were required to try to assign enrollees to plans based on the individual’s most frequently utilized providers and medical facilities to best meet the individual’s current needs and circumstances. To do this, states could use the most recent 12 months of Medicare and Medicaid claims data, though this data was not always available. Beneficiaries automatically assigned to plans were able to opt-out, however, and there were high-opt out rates among beneficiaries, due to a number of factors, including enrollees being satisfied with existing care and not seeing the benefit of being in one of the demonstration plans and resistance from providers who refused to participate in the plan’s network and encouraged their patients not to participate. In California, for example, after the first evaluation of the demonstration, only about 50 percent of beneficiaries in the demonstration plans were able to retain their primary care providers, and those beneficiaries who were not able to maintain existing relationships with providers were more dissatisfied with the new plans. Similar issues could arise for Medicare Advantage default enrollment if the assignment process is not able to adequately match beneficiaries with their current providers.
  • Zero-dollar premiums (other than the Part B premium). Some proposals would assign beneficiaries to plans with a zero-dollar premium. Using this approach would prioritize a plan parameter that is often cited as a top reason for selecting a Medicare Advantage plan, making it very meaningful to potential enrollees. There are a small share of beneficiaries who do not have access to a plan with a zero-dollar premium – about 325,000 people in 2025 – and in those situations, assignment could be based on the lowest premium available in the area. However, nearly all beneficiaries (99%) have access to a Medicare Advantage plan with drug coverage with no additional monthly premium. Depending on the area, this plan parameter may not be enough to differentiate among plans.
  • Star ratings. Some proposals would base assignment on plan quality, placing Medicare beneficiaries in plans with star ratings of 4 or higher. According to CMS, 40% of Medicare Advantage plans with prescription drug coverage earned a star rating of 4 of higher for their 2025 rating, with 62% of Medicare Advantage enrollees currently in plans that will have stars of 4 or higher in 2025. Similar to zero-dollar premium plans, depending on the area, using the quality rating measure alone may not be enough to differentiate among plans. Further, MedPAC has recommended replacing the quality-bonus program which assigns stars because it asserts that this system does not provide a reliable indicator of quality, and Medicare focus groups have shown that few beneficiaries consider quality ratings when choosing a plan, so this approach alone may not adequately match enrollees with plans that meet their preferences.
  • Drug coverage. Individuals could be assigned to plans based on the drugs they take and whether those drugs are on the plan formulary. While coverage of prescription drugs is an important part of plan selection, implementing this kind of approach could prove challenging since it would require, at a minimum, identifying the list of prescription drugs used by people not yet covered by Medicare and could result in assigning people to plans that cover some but not all of their medications.Challenges in implementing this kind of approach have been apparent in the case of the LIS random assignment process, which has been used since the program’s beginning in 2006. Advocates and policymakers have called for using intelligent assignment or beneficiary-centered assignment instead of the current LIS random assignment process to minimize potential disruptions in access to specific medications for beneficiaries who become eligible for LIS. This approach would take into account enrollees’ current prescriptions and pharmacies. CMS previously considered modifying the current assignment process for LIS enrollees but did not implement any changes.
  • Preserve existing relationships with insurers. Assignment could be based on maintaining a relationship with an insurer based on the plan an individual was enrolled in before enrolling in Medicare. Medicare focus groups have shown that some beneficiaries choose their Medicare Advantage plan based on prior relationships with insurers because they feel comfortable with them. Continuing a plan with the same insurer could potentially preserve some relationships with providers or may be more likely to cover the drugs beneficiaries already take, but commercial plans may have different networks than Medicare plans, and provider networks change from year to year, as do formularies. It might also be difficult to identify insurance coverage for individuals prior to their enrolling in Medicare and in some areas, it may not be an option to continue coverage from a specific insurer if they do not sponsor Medicare Advantage plans.
  • Lowest cost plan. Assignment could also be based on the “lowest cost plan” offered in an area. If a goal of default enrollment into Medicare Advantage is to save money for the Medicare program, assigning beneficiaries to plans with the lowest “bid” to provide Medicare Part A and B services at the lowest cost in a specific area may be a way to achieve this. It could also encourage competition among insurers to provide care most efficiently. However, it might also mean enrollees assigned to the lowest-bid plan in an area end up with a less generous set of supplemental benefits, a more narrow network of providers, face higher cost-sharing requirements, or are subject to more utilization review requirements, than other available plans if a plan is trying to cut costs to be the lowest cost option.

What are the implications for beneficiaries, insurers, providers, and agents and brokers?

Beneficiaries. Proponents of default enrollment into Medicare Advantage observe that this approach would provide more individuals with access to benefits beyond those covered by traditional Medicare, such as dental, vision, and hearing benefits, lower cost sharing and an out-of-pocket limit. Beneficiaries would have access to all Medicare-covered and extra benefits, without needing a separate Part D plan or separate supplemental policy, such as Medigap, and Medicare Advantage plans have potential to provide better coordinated care than traditional Medicare.

At the same time, people who are newly eligible for Medicare may not be aware of the differences between traditional Medicare and Medicare Advantage and might accept default enrollment into a Medicare Advantage plan without understanding the potential implications. For example, while Medicare Advantage potentially offers coverage at lower costs with extra benefits not available in traditional Medicare, there are tradeoffs with Medicare Advantage plans, including more limited provider networks compared to traditional Medicare as well as the potential for denials or delays in care related to the use of prior authorization in Medicare Advantage. Default enrollment could also result in more enrollees experiencing cost-related problems than would be encountered by beneficiaries with traditional Medicare and other types of supplemental coverage, such as Medigap. Furthermore, only a small share of Medicare beneficiaries compare plans, meaning that once enrolled in a plan, beneficiaries are unlikely to review their coverage options, potentially leaving them in a plan that does not best meet their individual needs and preferences.

There are also tradeoffs and complications involved with the process of defaulting beneficiaries into Medicare Advantage plans, though the effects would vary on key policy decisions, such as the criteria used by the government to assign beneficiaries to specific Medicare Advantage plans, as discussed above. For example, if beneficiaries are assigned to a plan that does not have one or more of their doctors in network, the assignment could disrupt existing patient-provider relationships, which could be a particular concern for patients with serious medical conditions. Default enrollment algorithms may also not take into account beneficiaries’ health care needs and preferences, such as specific drugs on a formulary.

Insurers. Depending on how a default enrollment approach was structured, it would have implications for insurers, which could result in the realignment of the market in ways that would benefit some insurers but be negative for others. For example, if the assignment process gave priority to a previous insurer relationship, such as through a former employer, this could favor certain insurers who also offer private commercial insurance and disadvantage insurers who have a smaller presence in commercial insurance markets. A previous insurer relationship could also benefit insurers who have a strong presence in both Medicaid and Medicare, as millions of people on Medicaid ultimately become eligible for Medicare. If assignment was prioritized on certain metrics, such as preserving existing provider relationships, quality or premiums, this could favor established insurers who are more dominant in certain areas, rather than smaller insurers and newer entrants to the Medicare Advantage market. Conversely, a random assignment process could be more equitable in terms of allocating beneficiaries to all types of insurers. Some consideration would need to be given to the distribution of new beneficiaries if some insurers offered more plans than others, which would increase their share of new enrollees. Overall, most of these approaches would likely have adverse effects on insurers that have historically relied more heavily on brokers and marketing to attract new enrollees when they first sign up for Medicare.

Providers and Health Systems. Providers are likely to be impacted by a change in default enrollment for newly eligible Medicare beneficiaries. Recent news reports have indicated that some providers and health systems have dropped certain Medicare Advantage plans from their networks or are no longer taking Medicare Advantage altogether, due to what they claim are burdensome prior authorization requirements, slow payments from plans, and denied claims. Some health systems have also questioned whether they can afford to have Medicare Advantage plans in their networks based on reimbursement from these plans. For example, a recent study found that Medicare Advantage plans reimburse rural hospitals at just 90.6% of traditional Medicare rates on a cost basis. Further expansion of Medicare Advantage enrollment under a default enrollment approach could exacerbate tensions between providers and Medicare Advantage plans, which could disrupt access to care for both current and new Medicare Advantage enrollees.

Agents and Brokers. About one in three Medicare Advantage enrollees rely on insurance agents and brokers to help them select their Medicare Advantage coverage. Agents are paid a commission for signing up Medicare beneficiaries to plans and also receive compensation if enrollees renew their plan. Currently, for beneficiaries who do not select a Medicare Advantage plan and are default enrolled into traditional Medicare, agents do not play a role in their Medicare Parts A or B coverage, though they may help them select Part D prescription drug coverage and a Medigap supplemental policy. If instead new Medicare beneficiaries largely relied on a default enrollment system that auto-assigned them to a Medicare Advantage plan, rather than using an agent or broker to help them choose a plan, this change could disrupt business practices and revenues for insurance agents and brokers.

What are potential implications for the federal budget?

In 2025, MedPAC found that Medicare pays 20% more for enrollees in Medicare Advantage than it would cost to cover them in traditional Medicare, a total of $84 billion dollars in additional spending in 2025 alone. In the absence of any changes to Medicare Advantage payment policy to reduce expenditures, a default enrollment approach into Medicare Advantage would likely increase annual Medicare spending above currently projected levels. One study on default enrollment into Medicare Advantage estimates that federal outlays could increase by $189 billion to $269 billion over 10 years under different scenarios. This higher spending would affect taxpayers and beneficiaries themselves. Already, Medicare Advantage spending increases Part B premiums for all enrollees, including those not on Medicare Advantage, at a cost of $13 billion in 2025. Higher spending on benefits, including under Part B, would increase the amount of government contributions and beneficiary premiums required to cover this part of the program, so Part B premiums would likely further increase under this approach.

How could default enrollment into Medicare Advantage be adopted?

The Trump administration could take different approaches to implement a Medicare Advantage default enrollment system, including testing a model for default enrollment through the Center for Medicare and Medicaid Innovation (CMMI or Innovation Center), using Section 402 demonstration authority, or pursuing legislation through Congress.

CMMI. One approach would be testing a model through CMMI. As part of CMMI’s statutory requirements, the goal of a model must be reducing program spending while preserving or enhancing the quality of care or improving quality of care without increasing spending. Under CMMI rules, the Secretary has the authority to waive Medicare and other program requirements in order to develop and conduct these models, and this authority is not limited to reimbursement or payment related changes (in contrast to the Secretary’s waiver authority for Section 402 demonstrations, as discussed below). The testing, evaluation and expansion of CMMI models are also specifically exempted from the Paperwork Reduction Act, and specific features of models are not subject to administrative or judicial review. Implementing a model through CMMI would not require Congressional approval.

Some important questions that may arise when designing this model include (1) how to design a model that does not increase spending; (2) whether the model would require mandatory or voluntary participation; (3) whether it would be tested in certain regions or nationwide, and (4) whether it would apply broadly or to defined subgroups of the Medicare population, such as beneficiaries with both Medicare and Medicaid coverage (dual-eligible individuals).

Section 402. Another approach would be using Section 402 demonstration authority, which provides broad authority to the HHS Secretary to develop and implement demonstration projects to test new Medicare payment methodologies, and allows the Secretary to waive compliance with certain Medicare requirements only as long as they relate “to reimbursement or payment on the basis of reasonable cost, or (in the case of physicians) on the basis of reasonable charge.” While budget neutrality is not specified in statute or regulation, according to CMS’ Medicare Waiver Demonstration Application, “Medicare-waiver-only demonstrations must be budget neutral. Budget neutrality means that the expected costs under the demonstration cannot be more than the expected costs were the demonstration not to occur.” Although most demonstrations have generally conformed to the administrative practice of budget neutrality, there have been exceptions. Section 402 demonstrations also have typically been subject to certain types of review such as requirements under the Paperwork Reduction Act and administrative or judicial review. Similar to a CMMI model, a Section 402 demonstration does not have to be initiated or approved by Congress.

Legislation. Policymakers could also enact legislation to modify current law to make Medicare Advantage the default enrollment option, rather than traditional Medicare. While there is bipartisan support for Medicare Advantage, some policymakers have raised concerns recently about specific elements of the program, such as the Medicare Advantage payment system, as well as the use of prior authorization, leading to denials and delays in care. Traditional Medicare also continues to serve a larger share of beneficiaries in rural areas than Medicare Advantage. These issues might dampen support for legislative changes to the current Medicare enrollment process.

This work was supported in part by Arnold Ventures. KFF maintains full editorial control over all of its policy analysis, polling, and journalism activities.

Medicare Advantage Insurers Often Use Rewards and Incentives to Encourage Enrollees to Complete Health Risk Assessments (HRAs)

Published: Apr 28, 2025

Beginning in 2014, the Centers for Medicare & Medicaid Services (CMS) has permitted Medicare Advantage insurers to offer Rewards and Incentives Programs to their enrollees to encourage participation in activities that focus on improving health, preventing illness or injury, or promoting the efficient use of health resources. Two common ways these programs work include offering gift cards, as long as they are not redeemable for cash, or “points” or “tokens” that can then be used to acquire tangible items, such as gift cards or fitness accessories.

Completing a health risk assessment (HRA) is one of the activities for which insurers may provide a reward or incentive. HRAs are used to collect information about enrollees’ characteristics and health status. They may be conducted in the home, at a physician’s office, or via telehealth, and HRAs are also required as a component of an Annual Wellness Visit. As part of their role in ensuring coordination of care, Medicare Advantage plans must make a “best-effort” attempt to conduct an initial health risk assessment of all new enrollees within 90 days of enrollment, as well as annually.

While HRAs may be used to develop a personalized care plan and help with care management, they are also a source of diagnoses codes used to calculate a person’s risk score, and the Medicare Payment Advisory Commission (MedPAC) has estimated that Medicare Advantage plans received $15 billion in 2023 as a result of diagnoses captured during HRAs. Further, MedPAC and the Office of the Inspector General (OIG) have both found that some diagnoses are only supported by HRAs, meaning enrollees received no related care. These findings raise concerns that either these diagnoses are inaccurate, or enrollees are not receiving follow-up services for conditions documented in these assessments, while at the same time, boosting payments to plans.

Insurers are required to enter into a contract with CMS to offer Medicare Advantage plans, and each contract may offer multiple Medicare Advantage plans. Many Medicare Advantage requirements and data, such as those pertaining to network adequacy and star ratings measures, are evaluated and reported at the contract rather than the plan level. Using data submitted by Medicare Advantage insurers to CMS, this analysis examines the share of Medicare Advantage enrollees in contracts (which usually include multiple plans) that offered rewards or incentives for completing HRAs in 2023, as well as differences across Medicare Advantage insurers. (See methods for more details.) Because these data are at the contract level, we do not have data about whether individual plans offered rewards or incentives, though a review of the largest reward and incentive programs suggest these programs are broadly available.

In 2023, the majority of Medicare Advantage enrollees were in contracts that offered a reward or incentive for completing an HRA.

More than six in ten (62%) or 18.2 million Medicare Advantage enrollees, were in contracts that offered a reward or incentive specifically for completing an HRA to at least some of its enrollees in 2023 (Figure 1). These contracts may also include a reward or incentive for an Annual Wellness Visit, which is mandated to include an HRA, or other activities, but specifically include a reward for completing an HRA.

One in five enrollees (20%), or nearly 6 million people, were in contracts that offered rewards and incentives for completing an Annual Wellness Visit, but do not specify rewards for HRAs more broadly. About one in ten (9% or 2.5 million) were in contracts that offered rewards and incentives for other activities with no mention of HRAs or Annual Wellness Visits. The remaining 9% of enrollees, or 2.7 million people, were in contracts that did not offer any Rewards and Incentives Programs.

More Than Six in Ten (62%) Medicare Advantage Enrollees Were in Contracts That Offered a Reward or Incentive for Completing a Health Risk Assessment in 2023

Medicare Advantage insurers may offer a reward with a value intended to incentivize enrollee behavior but may not exceed the value of the health-related service. For example, a reward for completing a cancer screening cannot exceed the value of providing the screening itself. However, CMS has not identified explicit values for rewards, and it has not set a limit on how often rewards may be offered throughout the year. For 2023, rewards, typically in the form of gift cards, ranged from $10 to $100 for completing an HRA. Insurers are encouraged to offer enrollees a choice of gift cards to account for enrollees’ preferences and access to certain retailers, which may include, for example, IHOP, Chilis, Home Depot, Lowes, and CVS, among others.

The gift cards that Medicare Advantage enrollees receive for participating in certain health-related activities as described in this analysis are not the same as spending, debit, or “flex” cards that are offered by insurers to deliver extra benefits. These extra benefits include, but are not limited to, cards that help cover copays for dental, vision, and hearing benefits, and money toward over-the-counter products or food and produce.

The share of Medicare Advantage enrollees in contracts that offered a reward or incentive for completing an HRA varied by insurer.

Virtually all Medicare Advantage enrollees in Centene and CVS Health contracts (99%) and UnitedHealthcare contracts (98%) were offered a reward or incentive for completing an HRA. (Figure 2). Nearly two-thirds of enrollees in Blue Cross Blue Shield contracts (BCBS; 64%), and less than half of enrollees in Humana contracts (42%) were offered a reward or incentive for completing an HRA.

The Share of Medicare Advantage Enrollees in Contracts That Offered a Reward or Incentive for Completing an HRA was Higher Among Certain Insurers in 2023

Due to data constraints, we are unable to determine which individual plans offered rewards within a contract and how many enrollees actually received a reward for completing an HRA. However, for those enrollees that do complete an HRA and receive a reward, there is the potential for insurers to receive a high return on investment for providing that reward. For example, in a recent report, OIG found that for each HRA completed in the home, Medicare Advantage insurers generated $1,869 on average in estimated risk-adjusted payments. For those HRAs conducted in a facility – typically as part of Annual Wellness Visit – insurers generated $365 on average in estimated risk-adjusted payments.

Rewards and Incentives Programs are often unique to each insurer and may also vary by contract. For example, UnitedHealthcare uses its HouseCalls program to perform HRAs in the home. It also offers rewards for completing other eligible-health related activities, such as receiving a flu shot or engaging in certain fitness activities such as biking, jogging, and swimming. Humana uses its Go365 program to encourage enrollees to participate in health and fitness activities, such as Annual Wellness Visits, preventive screenings, or being active 12 days a month. Once members have earned at least $10 in rewards, they can redeem them for gift cards in the Go365 Mall at retailers such as Barnes and Noble, Macy’s, PetSmart, and Chipotle, among others.

The current reporting requirements make it difficult to understand the full scope of Rewards and Incentives Programs.

The current reporting requirements make it impossible to determine how many unique enrollees receive rewards, the amount insurers spend on these rewards, and the specific activities enrollees complete to earn a reward. Medicare Advantage insurers are required to submit data on rewards and incentives at the contract level rather than that at the plan level to CMS, and CMS does not specify any quality assurance procedures to identify outliers or potentially erroneous entries, as it does for some other data sets, such as prior authorization determinations. Most data fields are free text, which results in a lack of uniformity in reporting. Frequently, information on multiple rewards is entered on the same line (for example, Annual Wellness Exam, cancer screenings, and HRAs), making it difficult to determine how many individual rewards were distributed, as well as the dollar amount allocated to each reward.

Due to this complexity, it is not possible to calculate the total amount spent by insurers on the Rewards and Incentives Programs generally, nor for specific activities such as HRAs. This information would be useful to better understand how insurers use their budgets to increase the completion of HRAs and what the potential return on that investment is in the form of higher payments from CMS due to increased coding, as well as the potential to improve the quality of enrollees’ care and identify conditions early and prevent them from becoming more costly in the future.

This work was supported in part by Arnold Ventures. KFF maintains full editorial control over all of its policy analysis, polling, and journalism activities.

Methods

This analysis uses Rewards and Incentives Programs Part C data from the Centers for Medicare and Medicaid Services (CMS) Parts C and D Limited Data Set (LDS) for contract year 2023. Medicare Advantage insurers submit the required data at the contract level to CMS, but not at the plan level. It may be possible there are plans within a contract did not offer a particular Rewards and Incentives Program. CMS also does not specify any quality assurance procedures.

This analysis reflects data on rewards and incentives for health risk assessments (HRAs) though we were unable to determine the exact number of enrollees who qualified for a reward for completing an HRA. Special Needs Plans (SNPs) are included in the analysis and are required to complete HRAs for their enrollees. Similar to non-SNPs, SNPs are able to provide a reward for the completion of this required HRA.

The enrollment data are from the CMS Medicare Advantage enrollment file for March 2023 at the contract-plan-county level, which are aggregated to the contract level and merged with the rewards and incentives data. Contract-plan-county combinations are not included if there are fewer than 11 enrollees.