What Does the Future Hold for Ending the HIV Epidemic Initiative (EHE)?

Authors: Lindsey Dawson and Tenzin Dhondup
Published: Apr 23, 2025

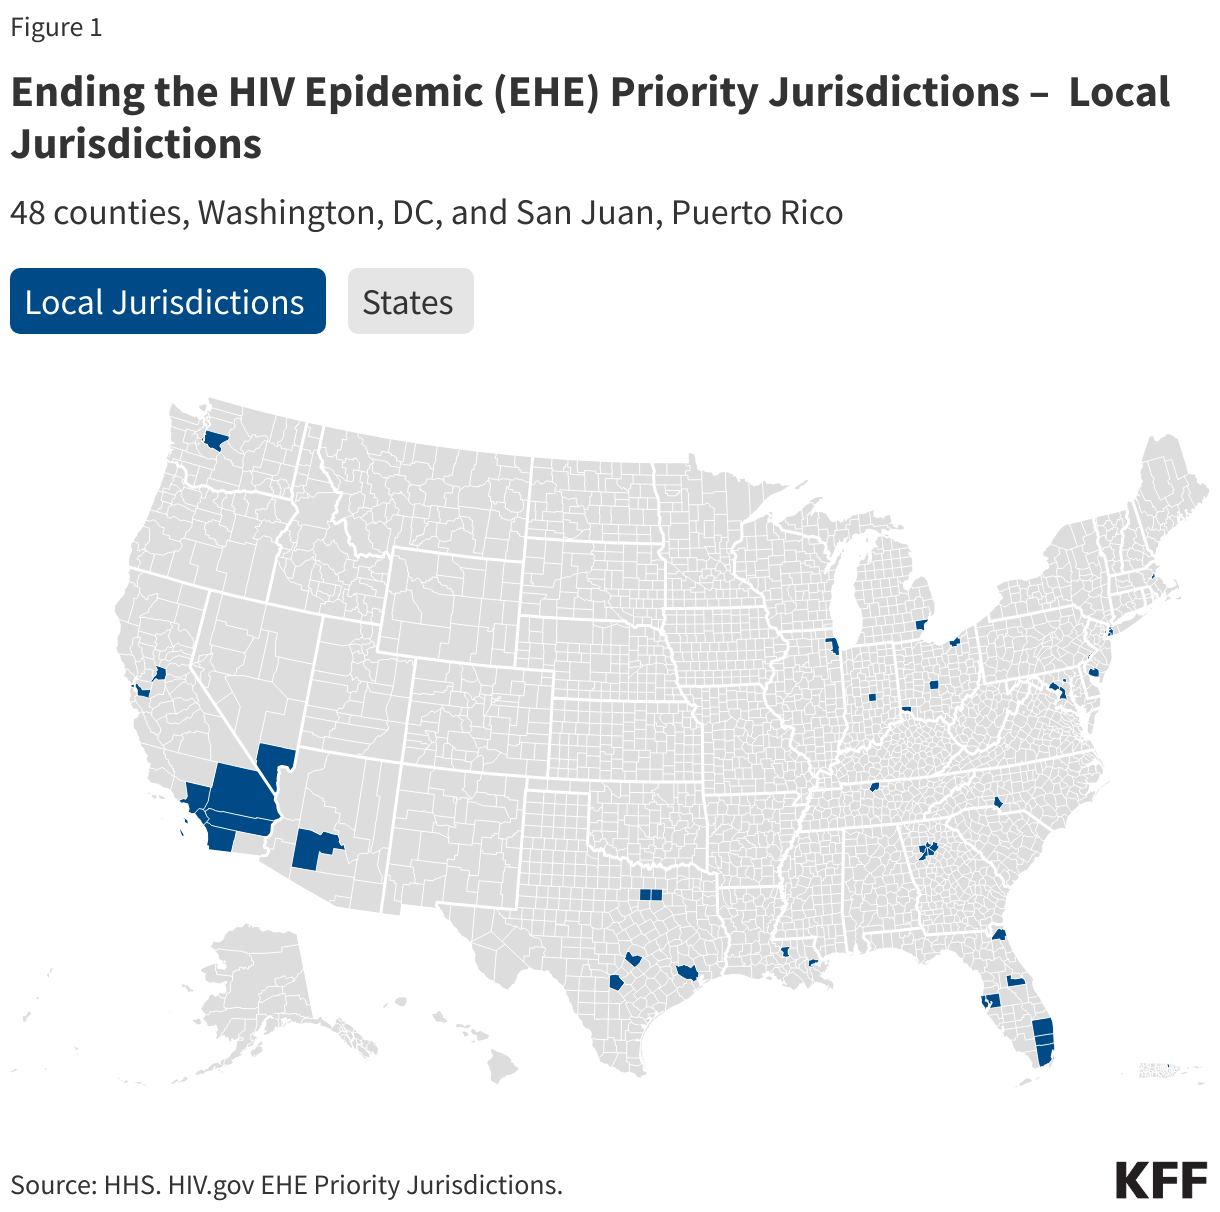
The Ending the HIV Epidemic Initiative (EHE) is a federal effort to address the HIV epidemic in the United States, by bringing new resources aimed at reducing the number of infections. EHE set the ambitious goals of reducing HIV incidence by 75% in five years and by 90% in ten years by focusing activities within four “pillars”: diagnose, treat, prevent and respond. The effort prioritizes 48 counties that had the highest number of HIV diagnoses between 2016 and 2017, San Juan, Puerto Rico, Washington D.C., and seven states with a substantial rural burden. It was created by the first Trump Administration, announced during the 2019 State of the Union, and continued by the Biden Administration. While there has been no formal announcement, a leaked document detailing budget and restructuring plans for the Department of Health and Human Services (HHS) suggests there will be significant changes to the federal HIV response, including eliminating the EHE. The leaked document is not official policy and not a final budget request. While Congress could still theoretically fund the initiative, it appears the Trump Administration is not currently planning to champion the effort.

This analysis examines what EHE has done to date and what its future might look like under the new administration.

CEnding the HIV Epidemic (EHE) Priority Jurisdictions –  Local Jurisdictions

What has the EHE done?

Funding

One of the primary changes the EHE made to the federal HIV landscape was to increase funding to core HIV programs, particularly the Centers for Disease Control and Prevention’s (CDC) HIV prevention branch and the Health Resources and Services Administration’s (HRSA) Ryan White HIV/AIDS Program. For many years, HIV funding at these core programs had been relatively flat and not keeping pace with inflation, increasing biomedical costs, and increases in HIV prevalence. The EHE infused new federal funding into these programs, as well as to HIV efforts at HRSA’s Health Centers program, the National Institutes of Health (NIH), and the Indian Health Service (IHS). In its first year, 2019, a small amount of funding was reprogrammed from other accounts to support the EHE and in FY 2020, Congress provided new funding which has continued over time. In FY 2024, the last budget year with known appropriated levels, EHE funding totaled $573.25 million, with the largest allocations going to CDC for prevention ($220 million) and Ryan White for care and treatment ($165 million). While these amounts represented the first major increases for these and other programs, they represent a fairly small increase in overall budgets. With these small increases, recipient agencies were able to conduct a range of activities to support the four pillars as discussed below. (See KFF’s EHE Funding Tracker for details on EHE funding.) Loss of EHE funding would return these programs to funding levels of a decade ago.

CDC HIV Prevention Funding Increases Were Driven by EHE Funding, FY2014-FY024

EHE Activities

EHE funding has supported the following activities across a range of HHS agencies:

  • The Ryan White HIV/AIDS Program (within HRSA) is the nation’s HIV safety-net program providing care, treatment, and support services to about half of all people with HIV. EHE funding extends the reach of the program and especially focuses on engaging people who are newly diagnosed in HIV care and treatment and reengaging others who have fallen out-of-care. It also supports training activities. Specific outcomes from Ryan White EHE efforts inlcude:
    • The number of clients newly engaged in care and served by EHE-funded Ryan White providers nearly doubled between 2020 (11,792) and 2022 (22,001), an increase of 87%.
    • The estimated number of clients re-engaged in HIV care and served by EHE providers nearly tripled between 2020 (7,085) and 2022 (19,204), an increase of 171%.
    • EHE funding also afforded grantees greater flexibility to cover certain services more comprehensively, such as psychiatry, intensive case management, housing, and trauma-informed care, among others.
  • The health center program (also within HRSA) provides care to tens of millions of people, including for those with limited resources. Health centers have historically provided some HIV care and prevention services and EHE allowed them to extend their reach in this area. Specific outcomes from Health Center EHE efforts inlcude:
    • The number of patients served with PrEP services in EHE funded health centers increased by 26% (compared to a 4% increase across health centers nationwide) between 2021 and 2023.
    • The number of HIV tests conducted increased by 119% in EHE funded health centers (compared to a 62% increase across health centers nationwide) between 2020 and 2023 .
      • In 2022, 55% of clients (ages 15-65) in EHE funded health centers had ever been tested for HIV compared to 37% of clients in health centers that did not received EHE funding.
      • Between 2020 and 2023 the share of health center patients diagnosed with HIV for the first time increased by 52% among those served within EHE funded health centers, compared to 32% between nationwide.
    • In 2022, 86% of patients in EHE funded health centers were seen within 30 days of first HIV diagnosis, compared to 76% in non-EHE funded health centers.
    • The share of health center patients with an HIV diagnosis increased 6% between 2019 (196,218) and 2023 (207,970), likely reflecting increases in HIV testing and linkage to care. (Data from KFF analysis of the HHS/HRSA Uniform Data System (UDS) 2019-2023.)
  • The Centers for Disease Control and Prevention is the backbone of U.S. HIV prevention efforts and supports EHE funded jurisdictions in developing local implementation plans to meet specific local needs, culture, and environments and providing resources to implement those plans. As such jurisdictions plans differ from one another and therefore success metrics for how CDC funding is used vary within each location but can include increasing PrEP uptake, reducing testing barriers, leveraging telehealth, for example. Specific outcomes between 2021 and 2023 include the use of CDC EHE funds to:
    • Provide >600,000 free HIV self-test kits
    • Provide >1 million HIV tests, newly diagnosing 4,600 people with HIV
    • Link 84% of people newly diagnosed with HIV to care within 30 days
    • Provide PrEP to 61,000 people
  • The National Institutes of Health, home to most federal HIV research funding and efforts, plays a role in EHE as well, to inform HHS and partners on evidence-based practices and effectiveness, including through making awards to Centers for AIDS Research (CFARs) and AIDS Research Centers (ARC) with research ranging thematically across centers.
    • Between FY19-FY23 NIH funded 248 projects with EHE funding with about half of projects focusing on HIV prevention and others focusing on diagnosis, treatment, and response.
    • Research findings are disseminated through publications, meetings, presentations, trainings/workshops, town halls, and across government.
  • The Indian Health Services (IHS) also receives EHE funding to address the HIV and other syndemics within Indian Country. IHS EHE funding supports three-year cooperative agreements (Ending the HIV Epidemic in Indian Country (or ETHIC)) to seven tribal/urban Indian organizations for work aimed at eliminating the syndemics of HIV, hepatitis C, and STIs. Among other activities, EHE funding has allowed awardees to:
    • create the HIV/HCV/STI Branch within the Office of Clinical and Preventive Services at IHS Headquarters and hire clinical and administrative staff
    • increase HIV/HCV/STI testing (IHS EHE-supported sites performed over 20,000 HIV test)
    • increase linkage to care
    • attend HIV syndemic-related training

What Does the Future Hold for EHE?

While the EHE brought new funding for HIV services across the country and that funding has driven a range of new activities aimed at addressing HIV, it now appears the new Trump administration will discontinue funding these efforts. Ending EHE aligns with several administration actions which have sought to limit HIV funding and reduce the size of the HHS workforce, with those working in HIV related fields especially impacted. Multiple branches within the CDC’s Division of HIV Prevention were also eliminated and grantees have reported delays in receiving funding. In addition, recent reports that the administration seeks to cut CDC HIV prevention funding and the retraction of HIV related NIH grants also raises questions about its commitment to addressing HIV more broadly.  The administration is also seeking to conduct a reorganization within HHS, including with the creation of  a new agency, the Administration for a Healthy America (AHA). Per the press release, there are plans for AHA to consolidate activities from the Office of the Assistant Secretary for Health (OASH), HRSA, and other agencies. AHA will consist of multiple divisions, including one on HIV/AIDS. The leaked document appears to move the Office of Infectious Disease Policy (OIDP) at HHS to AHA. OIDP led on the EHE effort, providing coordination, management, and tracking progress, was thought to have initially been eliminated after all staff were let go in the earlier wave of firings. The Ryan White Program would also move to AHA and the document proposes eliminating the program’s EHE line as well as support for dental services, AIDS Education and Training Centers, demonstration programs, and the Minority AIDS Initiative.

While the leaked document is not formal policy, loss of EHE funding, federal coordination, leadership, expertise, and support, could reverse or stall recent successes. EHE jurisdictions would lose added flexibility that came with EHE funding at a time when state health budgets are strained and threats of Medicaid costs shifting to states loom. Such changes have the potential to lead to increases in new HIV infections, as well as disruptions in HIV care, both of which will have individual and population level impacts, setting back the recent gains made by the EHE.

Stand-Alone Drug Plans Cover a Larger Share of Medicare Part D Enrollees Living in the Most Rural Areas Than Medicare Advantage Plans

Authors: Juliette Cubanski, Tricia Neuman, and Anthony Damico
Published: Apr 23, 2025

The growing role of Medicare Advantage has been a defining feature of Medicare in recent years, with Medicare Advantage plans now covering more than half of all eligible Medicare beneficiaries. While most Medicare Advantage enrollees (and most people with Medicare overall) live in urban areas, as of 2024, most Medicare beneficiaries who live in the nation’s most rural counties are enrolled in traditional Medicare, not Medicare Advantage. This means that reliance on Medicare’s stand-alone prescription drug plans (PDPs) for coverage of the Medicare Part D prescription drug benefit is likely to be greater among Medicare beneficiaries living in the most rural parts of the country.

Concerns about the stability of the Medicare Part D stand-alone drug plan market have arisen recently as changes to the Part D benefit have taken effect that have increased plan costs, including a new $2,000 out-of-pocket spending cap. These costs have a greater impact on premiums for stand-alone drug plans because Medicare Advantage plans can use rebate dollars to reduce or eliminate Part D premiums, which is not an option for PDPs. To address these concerns, the Biden Administration implemented a demonstration program in 2024 to help stabilize the PDP market and prevent large year-over-year premium increases through the availability of enhanced premium subsides, designed to last for up to three years. While the demonstration helped limit premium increases in 2025, the number of PDPs dropped considerably and substantial variation in monthly PDP premiums persisted.

The Trump administration has not provided a clear signal as to whether it will continue the premium stabilization demonstration for 2026 and if so what the specific parameters will be. However, President Trump issued an executive order that, among other provisions, seeks recommendations from the Department of Health and Human Services and the Office of Management and Budget on ways to stabilize and reduce Part D premiums, without specifically mentioning stand-alone drug plans. Scaling back the PDP premium stabilization demonstration to a large degree could result in continued increases in PDP premiums and further reductions in PDP availability, which would have implications for access to and affordability of Part D drug coverage among Medicare beneficiaries enrolled in PDPs, including those living in the nation’s most rural areas.

To understand the role of Medicare Part D stand-alone PDPs in serving rural Medicare beneficiaries, this data note analyzes 2025 Part D enrollment in PDPs and Medicare Advantage drug plans by geographic area nationally and at the state level. The analysis defines geographic areas using Urban Influence Codes published by the U.S. Department of Agriculture. (See Methods for details.)

Nearly 6 in 10 Medicare Part D enrollees living in the nation’s most rural areas are enrolled in stand-alone PDPs in 2025. Among Medicare Part D enrollees who live in the most rural areas in 2025, nearly 6 in 10 (58%) are enrolled in stand-alone PDPs, while the remainder (42%) are enrolled in Medicare Advantage drug plans (MA-PDs) (Figure 1). This compares to 46% of Part D enrollees living in rural areas adjacent to urban areas enrolled in PDPs and 41% of Part D enrollees living in urban areas in PDPs.

Nearly 6 in 10 Medicare Part D Enrollees Who Live in the Nation's Most Rural Areas Are Enrolled in Stand-Alone Prescription Drug Plans

In 27 states, at least half of Medicare Part D enrollees living in the most rural areas are enrolled in stand-alone PDPs. This includes 8 states with 75% or more of Part D enrollees in the most rural areas in PDPs (Nevada, Alaska, Massachusetts, California, Kansas, Wyoming, Nebraska, and South Dakota) (Figure 2). More limited participation of local providers in Medicare Advantage plan provider networks is likely to factor into lower overall Medicare Advantage (and MA-PD) enrollment and higher PDP enrollment in some rural areas.

In 27 States, At Least Half of Medicare Part D Enrollees Living in the Most Rural Areas Are Enrolled in Stand-alone PDPs

In most states, a larger share of Medicare Part D enrollees living in the most rural areas are enrolled in PDPs than those who live in less rural or urban areas. In 35 states, a larger share of Medicare Part D enrollees living in the most rural areas of the state are enrolled in PDPs compared to those who live in less rural areas and in urban areas (Figure 3). For example, in Kansas, 84% of Part D enrollees in the most rural areas are enrolled in PDPs compared to 53% of those in urban areas; in California, 91% of Part D enrollees in the most rural areas are enrolled in PDPs compared to 39% of Part D enrollees in urban areas; in Idaho, 62% of Part D enrollees in the most rural areas are in PDPs compared to 36% of those in urban areas.

Additionally, in 15 states (Alaska, Massachusetts, Kansas, Wyoming, Nebraska, South Dakota, North Dakota, Iowa, Montana, Vermont, Illinois, New Hampshire, New Jersey, Delaware, and Maryland) and the District of Columbia, PDPs cover half or more of Part D enrollees living in all geographic areas in the state.

In Most States, A Larger Share of Medicare Part D Enrollees Who Live in the Most Rural Areas Are Enrolled in Stand-alone PDPs Than Those Who Live in Less Rural or Urban Areas

This work was supported in part by Arnold Ventures. KFF maintains full editorial control over all of its policy analysis, polling, and journalism activities.

Juliette Cubanski and Tricia Neuman are with KFF. Anthony Damico is an independent consultant.

Methods

This analysis uses March 2025 Medicare Part D enrollment data from the Centers for Medicare & Medicaid Services to analyze the share of Medicare Part D enrollees who are enrolled in stand-alone prescription drug plans and Medicare Advantage drug plans in counties that are part of urban or rural areas, using the 2024 Urban Influence Codes published by the U.S. Department of Agriculture. To examine the role of urban influence, which affects access to infrastructure, including for the delivery of health care services, rural counties are further classified as adjacent to or not adjacent to an urban (metropolitan) area.

This analysis categorizes the 9 Urban Influence Codes as follows:

Urban

1: Large metro (in a metro area with at least 1 million residents)

4: Small metro (in a metro area with fewer than 1 million residents)

Rural non-adjacent

2: Micropolitan, adjacent to a large metro area

3: Noncore, adjacent to a large metro area

5: Micropolitan, adjacent to a small metro area

6: Noncore, adjacent to a small metro area

Rural non-adjacent

7: Micropolitan, not adjacent to a metro area

8: Noncore, not adjacent to a metro area and contains a town of at least 5,000 residents

9: Noncore, not adjacent to a metro area and does not contain a town of at least 5,000 residents

In this analysis, large and small metropolitan areas (Urban Influence Codes 1 and 4) are referred to as “urban” areas; rural counties not adjacent to an urban (metropolitan) area (Urban Influence Codes 7, 8, and 9) are referred to as the “most rural” areas, and rural counties adjacent to an urban (metropolitan) area (Urban Influence Codes 2, 3, 5, and 6) are referred to as “less rural” areas.

The denominator for this analysis is Medicare Part D enrollees, which can include those with either Part A or Part B or both parts. A separate KFF analysis examines the share of eligible Medicare beneficiaries with coverage under traditional Medicare and Medicare Advantage, which includes those with both Part A and Part B and is therefore a different denominator than that which is used in this analysis. In addition, not all Medicare beneficiaries are enrolled in a Part D plan.


News Release

Amid Growing Measles Outbreak, More Americans Are Encountering False Claims About the Measles Vaccine, and Many Aren’t Sure What to Believe

Parents Who Lean Toward Believing False Claims about Measles are Less Likely to Keep Their Children Up to Date on Routine Vaccinations

Published: Apr 23, 2025

With health officials reporting 800 measles cases in multiple states already this year, most of the public – and most parents – report hearing at least one false claim about measles or the vaccine for it, and many of them aren’t sure what to believe, the latest KFF Tracking Poll on Health Information and Trust finds.

The poll gauges whether the public has heard, and whether they believe, three false statements related to measles circulating amid the outbreak, some of which have been amplified by Health and Human Services Secretary Robert F. Kennedy Jr.: that the measles, mumps and rubella (MMR) vaccines have been proven to cause autism in children, that getting the measles vaccine is more dangerous than becoming infected with measles, and that vitamin A can prevent measles infections.

Fewer than 5% of adults say that each of the three claims is “definitely true,” and fewer than half say each is “definitely false.”  That leaves at least half of people expressing some uncertainty about whether to believe each claim, describing each as either “probably true” or “probably false.”

Of the three false claims, the most common is the one suggesting a proven link between the MMR vaccine and autism, which most adults (63%) and most parents (61%) report having heard. A third of adults (33%) and parents (33%) say they’ve heard the false claim about the measles vaccine being more dangerous than the disease – an increase of about 15 percentage points since March 2024. About a fifth of adults (20%) and parents (17%) say they’ve heard the false claim about vitamin A preventing measles.

While most people express some level of uncertainty about the false claims, a quarter of adults (25%) and a third of parents (33%) say that it is “definitely” or “probably” true that there’s a proven link between the MMR vaccine and autism.

Notably, a quarter (24%) of parents who lean toward believing at least one of the three false claims about measles say that they have delayed or skipped some recommended vaccines for their children. That’s more than double the share who report opting out of vaccines among parents who say all three claims are “definitely” or “probably” false (11%).

Despite the prevalence of false claims about the vaccines, large majorities of adults (83%) and of parents (78%) say they are very or somewhat confident that the vaccines for measles, mumps and rubella are safe.

Confidence in the vaccines is higher among Democrats (96%) and Democratic-leaning parents (95%) than among Republicans (79%) and especially Republican-leaning parents (69%), of whom 31% say they are not confident in the safety of the vaccines.

Other findings include:

  • About half (51%) of the public says that they are at least somewhat worried about the ongoing measles outbreak. Concern is highest among Democrats (76%), Hispanic adults (62%) and Black adults (61%).
  • Most adults (56%) and about half of parents (48%) are aware that there are more measles cases in the U.S. than in recent years. There are large partisan differences, with Democrats (71%) and Democratic-leaning parents (64%) much more likely than Republicans (49%) and Republican-leaning parents (37%) to know measles cases are higher this year.

Most adults (56%) and about half of parents (48%) are aware that there are more measles cases in the U.S. than in recent years. There are large partisan differences, with Democrats (71%) and Democratic-leaning parents (64%) much more likely than Republicans (49%) and Republican-leaning parents (37%) to know measles cases are higher this year.

Designed and analyzed by public opinion researchers at KFF, this survey was conducted April 8-15, 2025, online and by telephone among a nationally representative sample of 1,380 U.S. adults in English and in Spanish. The margin of sampling error is plus or minus 3 percentage points for the full sample. For results based on other subgroups, the margin of sampling error may be higher.

Poll Finding

KFF Tracking Poll on Health Information and Trust: The Public’s Views on Measles Outbreaks and Misinformation

Published: Apr 23, 2025

Findings

Key Findings

  • As the U.S. grapples with rising measles cases across multiple states and the highest number of cases since 2019, about half of adults (51%) and parents (47%) say they are at least “somewhat worried” about the outbreak of measles, including roughly one in seven adults who are “very worried” (14% of all adults, 13% of parents). Concern is notably higher among Black and Hispanic adults – six in ten of each group express worry compared to 46% of White adults. Roughly half of adults (56%) and parents with children under 18 (48%) are aware that the number of U.S. measles cases is higher this year than in recent years.
  • Partisanship plays a major role in whether people are aware that measles cases are on the rise and whether they are worried about the most recent outbreak. Democrats are much more likely than Republicans to say they are worried about the outbreak of measles in the U.S. (76% v. 28%), and to know measles cases are up this year compared to recent years (71% v. 49%). Similar partisan gaps exist among parents as well, with Democratic and Democratic-leaning parents more than twice as likely as Republican and Republican-leaning parents to express worry over the outbreak of measles (73% v. 26%) and more likely to know the number of cases is currently higher than in past years (64% v. 37%).
  • Most adults and parents say they have read or heard some false claims about measles or the measles, mumps, rubella (MMR) vaccines, some of which have been amplified by Robert F. Kennedy Jr., the U.S. Secretary for Health and Human Services. The most pervasive myth is the false link between autism and the measles vaccines, with about six in ten adults (63%) and a similar share of parents (61%) saying they have read or heard the false claim that the MMR vaccines have been proven to cause autism in children.
  • The share of adults who report having heard or read the false claim that the measles vaccines are more dangerous than being infected with measles has increased by 15 percentage points in the past year. One in three adults now say they have heard or read the false claim that getting the measles vaccine is more dangerous than becoming infected with measles, up from 18% in March 2024. The shares who report having heard this false claim have also increased across partisans in the past year and more than doubled among Democrats (40% now compared to 17% in 2024).
  • When it comes to false claims that the MMR vaccines have been proven to cause autism, that vitamin A can prevent measles infections, or that getting the measles vaccine is more dangerous than becoming infected with measles, less than 5% of adults say they think these claims are “definitely true,” and much larger shares say they are “definitely false.” However, at least half of adults are uncertain about whether these claims are true or false, falling in the “malleable middle” and saying each claim is either “probably true” or “probably false.” While at least half of adults express some level of uncertainty, partisans differ in the shares who say each of these false claims is definitely or probably true, with Republicans and independents at least twice as likely as Democrats to believe or lean towards believing each false claim about measles. One-third of Republicans (35%) and a quarter (26%) of independents say it is “definitely” or “probably true” that the MMR vaccines have been proven to cause autism, compared to one in ten Democrats; three in ten Republicans (29%) and independents (28%) say it is “definitely” or “probably true” that vitamin A can prevent measles infections compared to 14% of Democrats; and one in five Republicans (20%) and independents (21%) believe or lean toward believing that the measles vaccine is more dangerous than measles infections compared to about one in ten (11%) Democrats.
  • Even amid widespread exposure to false claims about measles, large majorities of the public (83%) and parents (78%) say they are “very” or “somewhat confident” that the MMR vaccines are safe. However, confidence in the safety of MMR vaccines is lower among Republican and Republican-leaning parents, with about three in ten (31%) expressing a lack of confidence in the safety of MMR vaccines, including about one in six (17%) who say they are “not at all confident” the MMR vaccine is safe.

Awareness and Worry About Measles Outbreaks in the U.S.

As of late April, the U.S. has confirmed 800 measles cases in 2025 across more than 20 states – already more than double the amount of cases reported in 2024. KFF’s latest Tracking Poll on Health Information and Trust finds that most adults (56%) and about half of parents of children under 18 (48%) are aware that the number of measles cases in the U.S. is higher this year than in recent years. This leaves about four in ten adults who are unaware that measles cases are on the rise in the U.S., either incorrectly saying cases are lower or about the same as compared to recent years (16%), or that they are “not sure” (28%).

Awareness of the rise in measles cases differs across partisans, as Democrats are much more likely than Republicans to know that measles cases are higher this year than recent years (71% v. 49%), with a similar partisan gap occurring among parents who are Democrats or lean Democrat and those who are Republicans or lean Republican (64% v. 37%). Overall, college graduates are more likely than those without a college degree to know that measles cases are up this year compared to recent years (72% vs. 47%), but partisan differences in knowledge hold even when controlling for education. For example, among adults without a college degree, a larger share of Democrats than Republicans are aware that measles cases are higher now than in recent years (61% v. 43%). These partisan differences may be related to messaging from the Trump administration as Health and Human Services Secretary Robert F. Kennedy Jr. has recently claimed this year’s outbreak in the U.S. is “not unusual” even as measles cases in the U.S. are currently at their highest point since 2019.

Most of the Public is Aware Measles Cases are Currently Higher Than in Previous Years, But Awareness is Lower Among Republican and Republican-Leaning Parents

Half of adults (51%) and a similar share of parents (47%) say they are at least “somewhat worried” about the outbreak of measles in the U.S., including 14% of adults and 13% of and parents who say they are “very worried.” Concern about measles is also higher among Black adults and Hispanic adults, with about six in ten of each group saying they are worried compared to about half (46%) of White adults. Just as Democrats are more aware of the rise in measles cases, they are also more worried about the current outbreak. Democrats are more than twice as likely as Republicans to say they are worried about the outbreak of measles in the U.S. (76% v. 28%), while a similar partisan split exists among parents (73% v. 26%). These large partisan differences persist when controlling for education; among both college graduates and those without a degree, the share who express worry is at least twice as large among Democrats as among Republicans.

About Half of the Public Say They are Worried About the Outbreak of Measles in the U.S., Including Larger Shares of Democrats, Black Adults, and Hispanic Adults

Misinformation About Measles and Vaccines

As attitudes toward childhood vaccination shift alongside declining childhood vaccination rates, false and misleading statements about measles and the measles, mumps, rubella (MMR) vaccines have continued to spread. While current Health and Human Services Secretary Robert F. Kennedy Jr. has recently recommended people get the MMR vaccines, he has also recently claimed the MMR vaccines cause the same illnesses that measles itself causes and touted vitamin A as a potential remedy for measles, which has led to concerns that some may turn to supplements in lieu of vaccination. Kennedy also has a history of linking vaccines and autism, a claim associated with a since-retracted study in the 1990s.

The latest KFF Tracking Poll on Health Information and Trust finds most adults and parents say they have read or heard some false claims about measles or the MMR vaccines – with the link between the MMR vaccine and autism the most prevalent. About six in ten adults (63%) and parents (61%) say they have read or heard the false claim that the MMR vaccines have been proven to cause autism in children. The share of adults and parents who say they have heard this false claim has remained persistent and largely unchanged since 2023. About seven in ten White adults (72%) say they have heard the false claim linking the MMR vaccines with autism, compared to fewer Black adults (53%) and Hispanic adults (45%). The share of adults who report hearing this false claim includes majorities across gender, age and partisanship.

One-third of adults and parents have heard or read the false claim that getting the measles vaccine is more dangerous than becoming infected with measles, and one in five adults and similar shares of parents (17%) have heard or read the false claim that Vitamin A can prevent measles infections. About a quarter of Democrats (26%) and independents (23%) say they have heard that vitamin A can prevent measles infections compared to fewer Republicans (13%); however, among parents, similar shares across partisans report having heard this claim.

Most Adults Have Heard the Myth That Measles Vaccines Cause Autism, At Least One in Five Have Heard False Claims About the Danger of Measles Vaccines or Vitamin A Preventing Measles

Notably, the shares of adults and parents who have heard the false claim that the measles vaccine is more dangerous than getting infected with measles has increased by 15 percentage points since March 2024, when about one in five adults (18%) and parents (19%) reported having heard this claim. The share who reports having heard this claim has also increased across partisans since 2024 and doubled among Democrats (40% now compared to 17% in 2024).

The Share of Adults Who Say They Have Heard the False Claim That Measles Vaccines are More Dangerous Than Measles Has Increased Since 2024

Belief in False Claims About Measles and Vaccines

Even with widespread exposure to some false claims about measles, less than 5% of adults say they think each claim is “definitely true.” Yet, less than half of adults say each of these claims is “definitely false,” with larger shares expressing some doubt. Similar to what previous KFF polls have found on a wide range of health misinformation topics, many adults fall into a “malleable middle” category, expressing uncertainty about the veracity of these claims. At least half the public fall into this malleable middle category when it comes to false statements about measles, saying it is either “probably true” or “probably false” that vitamin A can prevent measles infections (70%), that the MMR vaccines have been proven to cause autism in children (62%), or that measles vaccines are more dangerous than measles infections (54%).

At Least Half of the Public are Uncertain When it Comes to False Claims About Measles, Saying Such Claims are Either Probably True or Probably False

While most people express some level of uncertainty, there are differences by partisanship, education and race/ethnicity in the shares who believe or lean toward believing each of these false claims. A quarter of adults and one-third of parents (33%) say the false claim that MMR vaccines have been proven to cause autism in children is either “definitely true” or “probably true.” Similarly, a quarter of adults (24%) and about three in ten parents (31%) say it is “definitely” or “probably true” that vitamin A can prevent measles infections. Fewer, but still notable shares (19% of adults, 27% of parents), endorse the claim that MMR vaccines are more dangerous than measles infections.

At least one in five Republicans and independents say they think each of the three false claims about measles are either “definitely” or “probably true” compared to smaller shares of Democrats, including that the MMR vaccines have been proven to cause autism in children (35% of Republicans and 26% of independents compared to 10% of Democrats), that vitamin A can prevent measles infections (29% of Republicans and 28% of independents v. 14% of Democrats), and that the measles vaccine is more dangerous than measles infections (20% of Republicans and 21% of independents v. 11% of Democrats). These partisan divisions also hold among parents, with Republican or Republican-leaning parents consistently more likely than Democratic or Democratic-leaning parents to say the false claims are “definitely” or “probably true.”

While adults without a college degree are about twice as likely as those with a college degree to believe or lean toward believing each false claim, partisan differences hold even when controlling for education in most cases. For example, among adults without a college degree, Republicans are three times as likely as Democrats to say it is “definitely” or “probably true” that the MMR vaccines are proven to cause autism (41% v. 13%), and among those with a college degree, Republicans continue to be more likely than Democrats to believe or lean toward believing the myth (25% v. 5%).

Hispanic adults are more likely than Black adults and White adults to say it is “definitely” or “probably true” that the measles vaccine is more dangerous than becoming infected with measles (34% of Hispanic adults v. 19% of Black adults and 15% of White adults) or that Vitamin A can prevent measles infections (43% of Hispanic adults v. 25% of Black adults and 18% of White adults). Similar shares across race and ethnicity say it is “definitely” or “probably true” that the MMR vaccines are known to cause autism.

The share of adults who say it is “definitely true” or “probably true” that the MMR vaccines are linked to autism in children or that the MMR vaccines are more dangerous than measles has not changed since 2023 or 2024, respectively, including among parents and across partisan groups.

Republicans and Independents are More Likely Than Democrats to Say False Claims About Measles are Definitely or Probably True, With Similar Partisan Splits Among Parents

Believing or leaning toward believing false claims about measles and MMR vaccines is associated with parents’ actions when it comes to vaccinating their children. Among parents who say that at least one of the three false claims about measles is either “definitely” or “probably true,” a quarter (24%) say they have delayed or skipped some vaccines for their children, compared to about one in ten parents (11%) who say each of the three measles myths are “probably” or “definitely false.” While belief in false claims about measles is associated with parents delaying or skipping some vaccines for their children, the survey did not measure whether they have skipped the MMR vaccine specifically.

Parents Who Say False Claims About Measles are Definitely or Probably True are More Likely To Have Skipped Some Recommended Vaccines for Their Child

Views on the Safety of MMR Vaccines

Even amid widespread exposure to some false information about the MMR vaccines, large majorities of adults and parents are confident the measles, mumps, rubella (MMR) vaccines are safe, though confidence is notably lower among Republican and Republican-leaning parents. At least eight in ten adults (83%) and parents (78%) say they are either “very” or “somewhat confident” that vaccines for measles, mumps, and rubella are safe, with over nine in ten Democrats (96%) and eight in ten independents (80%) and Republicans (79%) expressing confidence. While confidence in MMR vaccine safety is high among Democratic and Democratic-leaning parents (95%), far fewer Republican and Republican-leaning parents are confident in the safety of the MMR vaccines (69%) – leaving three in ten Republican parents who say they are not confident in the safety of the measles vaccines, including about one in six who say they are “not at all confident” (17%). The MMR vaccines have been proven to be both safe and effective in providing protection against measles.

Eight in Ten Adults and Parents Say They Are Confident MMR Vaccines are Safe, But Fewer Republican Parents Express Confidence

Methodology

This KFF Tracking Poll on Health Information and Trust was designed and analyzed by public opinion researchers at KFF. The survey was conducted April 8-15, 2025, online and by telephone among a nationally representative sample of 1,380 U.S. adults in English (1,322) and in Spanish (58). The sample includes 1,022 adults (n=48 in Spanish) reached through the SSRS Opinion Panel either online (n=997) or over the phone (n=25). The SSRS Opinion Panel is a nationally representative probability-based panel where panel members are recruited randomly in one of two ways: (a) Through invitations mailed to respondents randomly sampled from an Address-Based Sample (ABS) provided by Marketing Systems Groups (MSG) through the U.S. Postal Service’s Computerized Delivery Sequence (CDS); (b) from a dual-frame random digit dial (RDD) sample provided by MSG. For the online panel component, invitations were sent to panel members by email followed by up to three reminder emails.

Another 358 (n=17 in Spanish) adults were reached through random digit dial telephone sample of prepaid cell phone numbers obtained through MSG. Phone numbers used for the prepaid cell phone component were randomly generated from a cell phone sampling frame with disproportionate stratification aimed at reaching Hispanic and non-Hispanic Black respondents. Stratification was based on incidence of the race/ethnicity groups within each frame. Among this prepaid cell phone component, 194 were interviewed by phone and 164 were invited to the web survey via short message service (SMS).

Respondents in the prepaid cell phone sample who were interviewed by phone received a $15 incentive via a check received by mail. Respondents in the prepaid cell phone sample reached via SMS received a $10 electronic gift card incentive. SSRS Opinion Panel respondents received a $5 electronic gift card incentive (some harder-to-reach groups received a $10 electronic gift card). In order to ensure data quality, cases were removed if they failed two or more quality checks: (1) attention check questions in the online version of the questionnaire, (2) had over 30% item non-response, or (3) had a length less than one quarter of the mean length by mode. Based on this criterion, no cases were removed.

The combined cell phone and panel samples were weighted to match the sample’s demographics to the national U.S. adult population using data from the Census Bureau’s 2024 Current Population Survey (CPS), September 2023 Volunteering and Civic Life Supplement data from the CPS, and the 2024 KFF Benchmarking Survey with ABS and prepaid cell phone samples. The demographic variables included in weighting for the general population sample are sex, age, education, race/ethnicity, region, civic engagement, frequency of internet use, political party identification by race/ethnicity, and education. The weights account for differences in the probability of selection for each sample type (prepaid cell phone and panel). This includes adjustment for the sample design and geographic stratification of the cell phone sample, within household probability of selection, and the design of the panel-recruitment procedure.

The margin of sampling error including the design effect for the full sample is plus or minus 3 percentage points Numbers of respondents and margins of sampling error for key subgroups are shown in the table below. For results based on other subgroups, the margin of sampling error may be higher. Sample sizes and margins of sampling error for other subgroups are available on request. Sampling error is only one of many potential sources of error and there may be other unmeasured error in this or any other public opinion poll. KFF public opinion and survey research is a charter member of the Transparency Initiative of the American Association for Public Opinion Research.

GroupN (unweighted)M.O.S.E.
Total1,380± 3 percentage points
Parents of children under 18457± 6 percentage points
Party ID
Democrats469± 6 percentage points
Independents466± 5 percentage points
Republicans361± 6 percentage points

5 Key Facts About Children with Special Health Care Needs and Medicaid

Published: Apr 18, 2025

Options under consideration in Congress to reduce Medicaid spending to help pay for tax cuts could have major implications for children with special health care needs. Medicaid provides comprehensive health coverage to about 4 in 10 children nationwide, including over 8 in 10 children in poverty, and is a major source of coverage for children with special health care needs. Medicaid also accounts for over half of all long-term care spending, including home care, which can provide the support children with special health care needs require to live at home with their families. Major cuts to federal Medicaid funding would put states at significant financial risk, forcing them to make tough choices about reducing the number of people covered, covering fewer benefits, or reducing payment rates for physicians, hospitals, nursing homes, and other providers. Proposals to limit federal spending on Medicaid could potentially result in reductions in eligibility or coverage or make it more difficult for children with special health care needs to access the care they need. Amid debates to limit federal Medicaid support, this brief analyzes key characteristics of children with special health care needs and explores how Medicaid provides coverage for them.

1. Medicaid is a major source of coverage for children with special health care needs.

Children with special health care needs (CSHCN) are “children who have chronic physical, developmental, behavioral, or emotional conditions and who require health and related services of a type or amount beyond that required by children generally”. An estimated 19 million or more than one-quarter of children have special health care needs in the US (Appendix Table 1).

Medicaid (in addition to CHIP) covers more than four in ten children with special health care needs compared with one-third of children without special health care needs (Figure 1). Medicaid is the only source of coverage for one in three children with special health care needs, while another 9% have Medicaid to supplement private insurance. Medicaid covers services that private insurance typically does not, including long-term care and home care, and has cost-sharing protections that help keep health care more affordable for families. Further, when compared with children without special health care needs, larger shares of children with special health care needs are White or Black, while smaller shares are Hispanic or Asian, and a larger share of children with special health care needs are male compared with children without special health care needs.

Children with special health care needs utilize more health care services, including inpatient, outpatient, emergency, and specialty care, and account for a larger share of health care expenditures compared with children without special health care needs. KFF analysis also shows Medicaid spending per child enrolled through an eligibility pathway for children with disabilities (known as the Katie Beckett pathway) was almost six times higher ($17,500) than Medicaid spending per child overall ($3,023).

Medicaid is a Major Source of Health Coverage for Children With Special Health Care Needs

2. The share of children with special health care needs covered by Medicaid varies by state.

The share of children with special heath care needs covered by Medicaid (in addition to CHIP) ranges from under 30% in Utah, Hawaii, and Illinois to 60% or higher in Mississippi, Louisiana, and Arkansas (Figure 2, Appendix Table 1). This includes children covered by Medicaid alone as well as those with Medicaid to supplement private insurance.

Factors that can contribute to state Medicaid programs covering more children with special health care needs include Medicaid income eligibility limits in the state and the state’s disability-related eligibility pathway options. Children with special health care needs may be eligible for Medicaid on the basis of age and income alone or through pathways that are specific to people with disabilities. Federal Medicaid rules require states cover children with household incomes up to 138% of the federal poverty level (FPL), but all states opt to expand financial eligibility to higher income levels. As of January 2025, the median financial eligibility level for Medicaid/CHIP children nationally was 255% FPL ($67,957/year for a family of three) but ranged from 190% to 405% FPL across states. States are also generally required to cover children who receive Supplemental Security Income, which provides monthly income to low-income children whose physical or mental impairments result in marked and severe functional limitations and are expected to last for at least 12 months or result in death.

States may choose to offer other disability-related pathways, which have higher income limits. There are two pathways that are specific to children. Children who qualify for Medicaid through those pathways may have both Medicaid and private health insurance, which reflects the fact that private insurance often does not cover all of the services that children with I/DD typically need. Under the Katie Beckett option, 43 states cover children under age 19 who are disabled and living at home and who would be eligible for Medicaid if they were living in an institution. Available in 9 states, the Family Opportunity Act pathway is an optional program for states to adopt that provides coverage to children with significant disabilities living at home. This program allows children with disabilities whose family income is below 300% FPL to buy into Medicaid.

Managed care is the dominant delivery system for people enrolled in Medicaid, and most states cover at least some children with special health care needs through comprehensive, risk-based managed care organizations (MCOs). However, how managed care plans structure their health care delivery for children with special health care needs varies by state.

The Share of Children With Special Health Care Needs Covered by Medicaid Varies by State

3. Children with special health care needs covered by Medicaid have greater health care needs compared with private insurance.

Children with special health care needs covered by Medicaid are more likely to have an intellectual or developmental disability (I/DD) compared with children with special health care needs covered by private insurance alone (Figure 3). I/DD are typically diagnosed during childhood and include a number of conditions (see Methods). Just under half (44%) of children with Medicaid alone and over half (56%) with Medicaid and private insurance have an I/DD compared with 28% of private insurance. Rates of physical health conditions among children with special health care needs are similar across Medicaid alone (66%), Medicaid and private (67%), and private insurance alone (63%). Rates of behavioral health conditions are similar for Medicaid alone (57%) and private insurance alone (55%) but higher for children with both Medicaid and private insurance (61%).

Children with special health care needs covered by Medicaid are also more likely to have multiple chronic conditions and report functional difficulties compared with private insurance alone. One-third (33%) of children with Medicaid alone and almost half of children (47%) with Medicaid and private insurance report having four or more chronic conditions, compared with almost one-fifth (18%) of those covered by private insurance. Children with special health care needs and Medicaid also report more functional difficulties (one or more, two or more, four or more functional difficulties) compared with children with private insurance only. Functional difficulties impact the day-to-day life of children with special health care needs and can include challenges such as difficulty concentrating, walking or climbing stairs, dressing or bathing, or problems with hearing or vision. Children with both Medicaid and private insurance typically have the greatest health care needs, with larger shares of children with Medicaid and private reporting multiple co-occurring chronic conditions (data not shown) as well as four or more chronic conditions.

Children With Special Health Care Needs Covered by Medicaid Have Greater Health Care Needs Compared With Private Insurance

4. EPSDT helps children with special health care needs meet their health care needs and protects them from high out-of-pocket costs.

Medicaid’s benefit package for children, Early and Periodic Screening, Diagnostic and Treatment (EPSDT), provides a set of comprehensive health care services to Medicaid enrollees under age 21. Under EPSDT, states are required to cover all screening services for children as well as any services “necessary… to correct or ameliorate” a child’s physical or mental health condition. Through the EPSDT benefit, Medicaid provides more comprehensive coverage for these children than the typical private insurance plan and increases access to needed services that improve the quality of daily life. Under EPSDT, states provide primary care and screenings for developmental and behavioral health conditions, as well as for vision, hearing, and dental conditions. States also cover needed therapies, long-term care and home care, assistive technology, and non-emergency medical transportation. Some children with special health care needs covered by Medicaid also receive services and supports from Title V agencies, which can include the coordination of EPSDT with other federal programs like supplemental food programs.

Due in part to the EPSDT benefit, children with special health care needs and Medicaid alone are more likely to report that their benefits are adequate to meet their needs and that they can see needed providers compared with children with private insurance alone (Figure 4). Medicaid generally protects beneficiaries from high out-of-pocket costs; parents of children with special health care needs and Medicaid alone are more likely to report their out-of-pocket costs are reasonable and under $1000 compared with those with private insurance alone.

Children with special health care needs can encounter barriers to coverage and care when transitioning out of children’s Medicaid eligibility pathways and the EPSDT benefit. Families of children with special health care needs who are aging out of child benefits report that there is frequently a lack of clear information available to them and that they are often unprepared for the transition. Medicaid eligibility for children generally and for children with disabilities is typically more expansive than that of adults, meaning some children with special health care needs could lose Medicaid coverage when they age out (especially in states that have not expanded Medicaid under the Affordable Care Act). Adult Medicaid benefits are typically more limited than EPSDT, resulting in potential decreases in services relative to what is available to children with special health care needs.

EPSDT Helps Children With Special Health Care Needs Meet Their Health Care Needs and Protects From High Out-of-Pocket Costs

5. Medicaid coverage can facilitate access to care for children with special health care needs in school.

There are an estimated 7 million children, or 10% of all children in the U.S., who currently have special education plans, and over two-thirds of these children have special health care needs. This includes children receiving special education services under a special education or early intervention plan (often an Individualized Education Plan (IEP) or Individualized Family Service Plan). Medicaid covers half of all children with special education plans compared with one-third of children without special education plans (Figure 5). The share varies by state, ranging from about 30% in New Jersey, Utah, and DC to about 70% in West Virginia, Arkansas, and Kentucky (Appendix Table 1). If a child is eligible for both special education services and Medicaid, federal law requires state Medicaid programs to pay for services that are both educationally and medically necessary. This is an exception to the general rule that usually makes Medicaid the payer of last resort when other sources of coverage are available. If a device or service included in a child’s special education plan under the Individuals with Disabilities Education Act (IDEA) is also medically necessary, then Medicaid is obliged to pay before the school district (see 34 CFR Sections 300.301-300.306).

School-based Medicaid supports can include reimbursement for medically necessary services that are part of a student’s IEP as well as reimbursement for eligible health services provided more broadly for students with Medicaid coverage. Medicaid may cover a range of health services provided to children in schools including health screening services, speech or physical therapy for children with disabilities, and a range of medically necessary physical, mental health, and SUD services. As youth mental health concerns have grown in recent years, both the federal government and states have worked to increase access to behavioral health services by expanding school-based care for students. This includes leveraging Medicaid to improve and address gaps in school-based behavioral health services.

Medicaid Coverage Can Facilitate Access to Care for Children With Special Health Care Needs in School

Appendix

Share of Children with Special Health Care Needs or a Special Education Plan Covered by Medicaid in 2023, by State

Methods

Data: This analysis uses the 2023 National Survey of Children’s Health (NSCH), the most current data available.

Defining CSHCN: The NSCH continues to use the CSHCN Screener to identify children with special health care needs. To meet the criteria for having a special health care need, a child must experience a health consequence that is due to a medical or other health condition that has lasted or is expected to last for 12 months or longer. However, research has shown that some children with special health care needs may be excluded from this definition, and, in 2024, the definition of CSHCN was slightly broadened to incorporate more children who may need supportive services. The CSHCN screener remains in use and is the basis of the expanded definition, which is used in this analysis. Using the original definition, 15 million or 21% of children ages 0-17 have special health care needs compared with 19 million or 26% of children using the expanded definition.

Identifying chronic conditions: This analysis identifies any chronic condition as having one or more conditions from a list of 24 health conditions asked about in the 2023 survey (following methodology from the Data Resource Center). Those 24 health conditions were then categorized into three groups: physical, behavioral, and I/DD. To the extent possible across data sources, these definitions align with other KFF analysis of chronic conditions.

  • Physical: Allergies, asthma, autoimmune disease, cerebral palsy, type 2 diabetes, epilepsy or seizure disorder heart condition, frequent/severe headaches/migraines, blood disorders, cystic fibrosis, hearing problems, and vision problems.
  • Behavioral: Tourette syndrome, anxiety problems, depression, behavioral or conduct problems, and ADD/ADHD.
  • I/DD: Down syndrome, developmental delay, intellectual disability, speech or other language disorder, learning disability, autism or ASD, and fetal alcohol spectrum disorder.

Limitations: The NSCH is based on parent recollection, and studies have shown there can be differences between self-reported survey data and claims data. This analysis breaks down indicators by health insurance coverage status for children with special health care needs but does not include estimates for uninsured children or children who did not report coverage status. This is due to many of the estimates for these children not meeting the minimum standards for reliability.

Analysis of USAID’s Active and Terminated Awards List: How Many Are Global Health?

Published: Apr 17, 2025

The U.S. is the largest donor government to global health and has prioritized health within its foreign assistance activities to a greater degree than other donor governments. In addition to being the largest donor, the U.S. operates programs, provides technical assistance, participates in international health organizations, conducts research, and more. Since the start of his second term, President Trump has taken numerous actions impacting U.S. global health efforts including pausing foreign aid while conducting of review of existing programs, elimination of the U.S. Agency for International Development (USAID), which manages the majority of U.S. global health funding, and signing several executive actions placing restrictions on U.S. global health activities. These efforts have significant implications for existing U.S. programs and left large gaps in the donor landscape.

Most recently, as part of its foreign aid review, the Trump administration notified Congress of the number of USAID awards it intends to terminate and those it will continue. The list included more than 6,200 awards, of which more than 5,300 were listed as terminated and almost 900 as remaining active. These awards total more than $36.0 billion in un-obligated funding, including $27.7 billion in terminated awards and $8.3 billion for awards remaining active. While it is unknown whether this will be the final list, it provided the first official indication of the administration’s plans for the U.S. foreign assistance portfolio, including for global health activities. A recent KFF analysis examined some of the questions raised by the list. This analysis provides an assessment of the number of active and terminated global health project awards (detailed methods are provided below).

Findings

Global health awards account for 12% of all awards on the list but the majority (53%) of all unobligated funding. Of the more than 6,200 awards on the list, 770 (12%) are identifiable as global health awards. These awards represent an estimated $19.1 billion in unobligated funding (defined by the administration as the difference between the total award value1  and the amount already obligated), or 53% of all unobligated funding.

80% of global health awards are listed as terminated, totaling $12.7 billion in unobligated funding. Of the 770 global health awards identified, 615 (80%) are listed as terminated, slightly below the share of all awards terminated (86%). These terminated awards include support for polio vaccination programs, activities aimed at improving maternal and child health (MCH), efforts to strengthen infectious disease detection systems around the world, HIV treatment projects, family planning support, and more. Collectively, terminated health awards total $12.7 billion in unobligated funding, or 67% of unobligated funding for global health ($19.1 billion). The remaining 155 global health awards remain active, totaling $6.3 billion, or 33%, of the global health unobligated funding total.

Many global health awards are multi-sectoral, spanning more than one global health area, with HIV/AIDS accounting for the greatest number. Of the 770 awards identified, 289 specify activities that address more than one of the six main global health sub-sectors, which include: HIV/AIDS; tuberculosis (TB); malaria; maternal and child health (MCH); family planning/reproductive health (FPRH); and nutrition. Awards that included HIV/AIDS activities accounted for the greatest number (379), followed by MCH (266), and FP/RH (233) (see Figure 1).

Total Number of Global Health Awards, by Sub-sector

By sub-sector activity, the share of awards terminated range between 71% for HIV and 86% for MCH and nutrition. Most of the awards for each sub-sector activity were terminated. MCH and nutrition had the largest share of terminated awards (86% for both sub-sectors), followed by FPRH (85%), malaria (80%), tuberculosis (79%), and HIV (71%) (see Figure 2).

Terminated share of Global Health Awards, by Sub-sector

Methodology

To assess which awards on the deduplicated USAID list were health-related, we first attempted to match award IDs for all awards on the list (6,232) with activity project numbers in https://www.foreignassistance.gov/, the US government’s database of all foreign assistance funding. This database includes the U.S. government sector area for awards (e.g., health, education, agriculture, etc.) and sub-sectors within each of these (e.g., HIV, TB, malaria), allowing for official coding of the data for any matched award. Of the total, 3,129 awards matched. For the 3,103 that did not match, we first excluded any award on the list issued by USAID’s Bureau for Humanitarian Assistance (BHA) and Bureau for Democracy, Conflict and Humanitarian Assistance (DCHA), which are considered humanitarian assistance awards but not health assistance, leaving awards issued by all other offices, including the Bureau for Global Health (GH), and individual USAID missions. Of these, we reviewed their award text descriptions to determine whether the award included identifiable health activities and if there was information to further identify the sub-sector activities of the award, including HIV, tuberculosis (TB), malaria, maternal and child health (MCH), nutrition, and family planning and reproductive health (FPRH). An award that included HIV/TB activities was coded as HIV. We did not include awards for water, sanitation, and hygiene (WASH) as health because these awards can include infrastructure projects, water management programs, and other activities that are not included under U.S. global health programs.2  Where an award description included activities in more than one sub-sector (either in https://www.foreignassistance.gov/ or in our hand-coding), all of these sub-sectors were counted, resulting in a larger number of award activities by health sub-sector than the total number of health awards. Our approach likely understates the total number of global health awards (and associated funding amount) due to the limited nature of the information included in the description for many awards that did not match with https://www.foreignassistance.gov/ data. For example, there were many awards for ocean freight contracts that did not indicate what was being shipped, which could have included items for global health programs, as well as many awards listing individual consultant names or construction projects, some of which also could be related to health. Our analysis of health sub-sectors also is limited in that it is possible that for those spanning more than one sector, only part of the award was kept active (or terminated), and our approach would include all sub-sectors. Lastly, if an award was listed twice, each with the same status (both were listed as either active or terminated), one of the duplicated lines was removed (one instance for global health); if an award was listed twice, each with a different status (one active and one terminated), both were removed from the list (one instance for global health).

  1. It is not clear how the total award value was calculated. In some cases, the award value seems to capture anticipated appropriations by Congress for future fiscal years, and therefore may overstate the value of the award as well as the unobligated balance. ↩︎
  2. The Trump administration has indicated it will not be providing any funding for bilateral FP/RH activities or for the United Nations Population Fund (UNFPA). ↩︎

How has the Burden of Chronic Diseases in the U.S. and Peer Nations Changed Over Time?

Authors: Imani Telesford, Matt McGough, Delaney Tevis, Lynne Cotter, and Cynthia Cox
Published: Apr 16, 2025

Chronic, non-communicable diseases are the leading cause of death worldwide and make up 8 of the 10 top causes of death in the U.S. Across several chronic diseases, the U.S. has a higher burden of illness than peer nations. The reasons why are complex and include differences in how health care is managed, poverty, diet and exercise, and more.

This chart collection compares rates of chronic diseases, such as obesity, hypertension, diabetes, asthma, kidney disease, depression, chronic obstructive pulmonary disease (COPD), and cancer in the U.S. to other countries of similar size and wealth, including Australia, Austria, Belgium, Canada, France, Germany, Japan, the Netherlands, Sweden, Switzerland, and the U.K.

The analysis is available through the Peterson-KFF Health System Tracker, an information hub dedicated to monitoring and assessing the performance of the U.S. health system.

The Effect of Delaying the Selection of Small Molecule Drugs for Medicare Drug Price Negotiation

Published: Apr 16, 2025

President Trump has just signed an executive order outlining several proposals related to prescription drug prices, including efforts to “improve upon” the Inflation Reduction Act, a law signed by President Biden in 2022 with several provisions to lower prescription drug costs for people with Medicare and reduce drug spending by the federal government. In the new executive order, the Secretary of HHS is directed to work with Congress to implement a change in the Medicare Drug Price Negotiation Program to delay negotiation of so-called “small molecule” drugs beyond 7 years after FDA approval under current law. This change would mean that small molecule drugs would be on the market longer before they are eligible to be selected for Medicare drug price negotiation, which could lead to higher Medicare prescription drug spending, higher prices, and potentially higher Medicare Part D premiums.

Under current law, high-spending drugs can be selected for negotiation if they are brand-name drugs or biological products without generic or biosimilar equivalents, and at least 7 years (for small molecule drugs) or 11 years (for biologics) past their FDA approval or licensure date when the list of drugs selected for negotiation is published by the Centers for Medicare & Medicaid Services (CMS). This translates into 9 years for small molecule drugs or 13 years for biologics following FDA approval when Medicare’s negotiated prices take effect. Consistent with the new Trump administration executive order, some members of Congress have proposed legislation supported by the pharmaceutical industry to exempt small molecule drugs from selection for negotiation for an additional 4 years so that both types of drugs would be on the market for 11 years prior to being eligible for selection and for 13 years prior to Medicare’s negotiated prices taking effect.

Compared to biologics, small molecule drugs, which often take the form of pills or tablets, are typically cheaper and easier to manufacturer, easier for patients to take, and less expensive on average. Consequently, the shorter timeframe for selection of small molecule drugs has been characterized by its critics as a so-called “pill penalty,” with the pharmaceutical industry claiming that making small molecule drugs eligible for negotiation sooner than biologics will discourage investment in these drugs. However, changing the law to further delay the selection of small molecule drugs for Medicare price negotiation would come at a cost to Medicare and beneficiaries by giving drug companies 4 additional years of setting their own prices on these drugs prior to being eligible for negotiation by the federal government, unless combined with other changes to prevent higher spending.

If Medicare was not allowed to negotiate prices for small molecule drugs until 11 years after FDA approval, rather than 7 years, more than half of the Part D drugs that were selected for price negotiation in the first or second rounds – 13 out of 25 – would not have been eligible at the time drugs were selected. During the first round of negotiation (for negotiated prices taking effect in 2026), 5 of the 10 selected Part D drugs would not have been eligible for negotiations, based on the number of years since they were approved by the FDA. For the second round of negotiation (for negotiated prices taking effect in 2027), 8 of the 15 drugs would not have been selected (Figure 1, ‘Selected drugs’ tab and Table 1).

A 4-year delay in selecting small molecule drugs for price negotiation would have exempted several drugs with high total gross Medicare Part D spending in the first and second rounds of negotiation. For example, Eliquis and Jardiance, 2 of the top 3 drugs based on total gross Medicare Part D spending selected in the first round, would have been ineligible that year based on their FDA approval dates. Similarly, 2 of the top 3 drugs selected in the second round, Ozempic/Rybelsus/Wegovy (semaglutide) and Trelegy Ellipta, would have been ineligible for selection based on their approval dates. (Despite having an injectable form like many biologics, Ozempic has a molecular structure that enables it to be regulated and approved under the same pathway as small molecule drugs.)

To illustrate the implications of this potential change, under current law, small molecule drugs qualified for selection in round two of negotiation if they were approved by the FDA at least 7 years before the February 1, 2025 publication date of the list of selected drugs, or February 1, 2018, which translates to 9 years before the round two negotiated prices take effect in 2027. Ozempic was approved on December 15, 2017, which is more than 7 years before February 1, 2025, and was eligible for selection in round two under current law. However, if selection of small molecule drugs had been delayed an additional 4 years, as has been proposed, Ozempic would have been ineligible for selection. By extending the period from 7 years to 11 years after FDA approval before small molecule drugs can be selected for negotiation, Ozempic would not be eligible for negotiation until after December 5, 2028, and would have 13 years following FDA approval before Medicare’s negotiated price took effect.

If Medicare Was Unable to Negotiate Prices for Small Molecule Drugs Until 13 Years After FDA Approval, Rather Than 9 Years, More Than Half of the Previously Selected Drugs, With Total Gross Part D Spending of $61 Billion, Would Not Have Qualified

The 13 drugs that would have been ineligible to be selected for negotiations during the first and second rounds under a 4-year delay for small molecule drugs accounted for two-thirds of total gross Medicare Part D spending on the 25 selected drugs, or $61 billion out of $91 billion. The 5 small molecule drugs that would have been ineligible for selection during the first round of negotiations account for $32.4 billion (64%) of the $50.5 billion total gross Part D spending on all 10 selected drugs. This is based on spending between June 2022 and May 2023, the period used to determine gross Part D spending to select drugs for the first round of price negotiation (Figure 1, ‘Spending’ tab).

The 8 drugs that would have been ineligible for selection in the second round account for $28.7 billion (71%) of the $40.7 billion in total gross Part D spending on all 15 selected drugs. This is based on spending between November 2023 and October 2024, the period used to determine gross Part D spending to select drugs for the second round of price negotiations.

If small molecule drugs had been subject to an additional 4-year delay from their FDA approval date prior to being eligible for selection in the first two rounds of Medicare drug price negotiation, Medicare would have had to select several other drugs with lower total gross Part D spending in order to round out the list of selected drugs in each year. This suggests that enacting this change in law could increase Medicare spending relative to current law due to lower savings associated with drug price negotiation, with potentially higher drug prices and premiums for Part D enrollees. While the Trump administration’s executive order suggests that other reforms could be implemented to prevent an increase in overall costs to Medicare and beneficiaries associated with this policy change, it did not specify the details of those changes.

Of the 25 Medicare Part D Drugs Selected for Price Negotiation for 2026 and 2027, 13 Drugs Would Have Been Ineligible If Negotiated Prices Were Unavailable for Small Molecule Drugs Until 13 Years After FDA Approval, Rather Than 9 Years

This work was supported in part by Arnold Ventures. KFF maintains full editorial control over all of its policy analysis, polling, and journalism activities.

How States Verify Citizenship and Immigration Status in Medicaid

Published: Apr 16, 2025

Note: This brief was updated on April 17, 2025 to clarify the groups that are exempt from the five-year waiting period in Medicaid and CHIP.

Medicaid is the primary program providing comprehensive coverage of health and long-term care to 83 million low-income people in the U.S. Medicaid is jointly financed by states and the federal government but administered by states within broad federal rules. In addition to meeting federal and state income and residency requirements, eligibility for coverage under Medicaid and the Children’s Health Insurance Program (CHIP) is limited to U.S. citizens and certain lawfully present immigrants. Federal Medicaid funds cannot be used to cover undocumented immigrants. Undocumented immigrants also are excluded from other federally-funded health programs, including Medicare and the Affordable Care Act Marketplaces.

On February 19, 2025, the Trump administration issued an executive order to “end taxpayer subsidization of open borders”, which includes language calling for enhanced verification systems to ensure taxpayer-funded benefits exclude unauthorized immigrants and requires federal agencies to identify sources of federal funding for undocumented immigrants. Current federal rules require states to verify an eligible immigration status through the Department of Homeland Security (DHS) as part of the process for determining Medicaid eligibility. Despite these requirements, Republicans in Congress have submitted legislation to prohibit state Medicaid programs from covering undocumented immigrants. Public confusion about immigrants’ eligibility for federal programs also persists, with slightly less than half of adults either unsure or incorrectly believing undocumented immigrants are eligible for health insurance programs paid for the federal government. This brief describes federal citizenship and immigration status eligibility and eligibility verification requirements for Medicaid.

What are Medicaid eligibility requirements for immigrants?

Federal rules limit Medicaid and Children’s Health Insurance Program (CHIP) eligibility to U.S. citizens and certain lawfully present immigrants; undocumented immigrants are not eligible for federally-funded coverage. In general, in addition to meeting other eligibility requirements, lawfully present immigrants must have a “qualified non-citizen” status to be eligible for Medicaid or CHIP (Table 1), and many, including most lawful permanent residents or “green card” holders, must wait five years after obtaining qualified status before they may enroll. These immigrants may enroll in Marketplace coverage and receive subsidies during this five-year waiting period. Some immigrants with qualified status, such as asylees and refugees, do not have to wait five years to enroll in Medicaid and CHIP coverage. Some immigrants, such as those with temporary protected status, are lawfully present but do not have a qualified status and are not eligible for Medicaid and CHIP coverage even after a five-year wait. Individuals with Deferred Action for Childhood Arrivals (DACA) status are not eligible for Medicaid or CHIP, and implementation of a Marketplace coverage expansion for them remains subject to ongoing litigation. States have the option to cover lawfully residing children and pregnant people in Medicaid or CHIP without the five-year waiting period otherwise known as the Immigrant Children’s Health Improvement Act (ICHIA) option. States can also provide prenatal care and pregnancy related benefits to targeted low-income children beginning at conception through the CHIP From-Conception-to-End-of-Pregnancy (FCEP) option regardless of their parent’s citizenship or immigration status. Some states provide fully state-funded coverage to fill gaps in coverage for immigrants, including lawfully-present immigrants and undocumented immigrants.

Immigration Status and Eligibility for Medicaid/CHIP

Emergency Medicaid reimburses hospitals for emergency care provided to individuals ineligible for Medicaid due to their immigration status. Emergency Medicaid spending reimburses hospitals for emergency care they are obligated to provide to individuals who meet other Medicaid eligibility requirements (such as income) but do not have an eligible immigration status, including undocumented immigrants and lawfully present immigrants who remain ineligible for Medicaid or CHIP. Emergency services include those requiring immediate attention to prevent death, serious harm or disability, although states have some discretion to determine reimbursable services. Spending on Emergency Medicaid accounts for less than 1% of total Medicaid expenditures. Without Emergency Medicaid, the costs of emergency care would be shifted to hospitals that are required to treat individuals in emergency situations or fully to states.

How do states verify citizenship and immigration status to determine Medicaid eligibility?

States must verify citizenship and immigration status with the Social Security Administration (SSA) and DHS to determine eligibility for Medicaid coverage at the initial application. Applicants who are U.S. citizens must provide documentation of citizenship, or states must verify the applicant’s Social Security number with the SSA. Applicants who are not U.S. citizens must provide documentation showing that they have a qualified immigration status eligible for Medicaid coverage (Figure 1). States verify immigration status through the DHS Systematic Alien Verification for Entitlements (SAVE) system, which can provide automatic real-time verification. If the system cannot provide real-time verification, DHS employees conduct an additional review and request documentation of eligible immigration status. Applicants cannot self-attest to having an eligible immigration status without documentation for the state, with the exception of qualified immigrants exempt from the five-year wait due to a military connection. Current federal rules prohibit states from requiring applicants to disclose the immigration status of non-applicants, such as household members, which is not relevant to eligibility determination, and the SAVE system cannot be used for non-criminal immigration enforcement.

States are required to provide Medicaid benefits to applicants during a “reasonable opportunity period” of 90 days while their immigration status is being verified, if they otherwise meet all eligibility criteria. The reasonable opportunity period is allowed when the SAVE system cannot verify immigration status in real-time and the state needs to conduct additional review and collect additional documentation to verify the qualified immigration status. This period gives applicants the opportunity to correct information in SAVE or submit additional documentation in support of their application. States may extend the period if they need more time to complete verification or if applicants are attempting to correct issues with documentation. States are entitled to receive federal matching funds for expenditures for Medicaid services provided to individuals during the reasonable opportunity period, regardless of whether eligibility ultimately is verified. If states determine an applicant ineligible for Medicaid coverage due to their immigration status at any point during the reasonable opportunity period, they must terminate eligibility within 30 days. This may also occur if applicants do not provide additional requested documentation or correct any discrepancies in the application. Applicants have the right to dispute the state’s decision in a fair hearing process, but states are not required to provide Medicaid benefits during this time.

In some cases, states need to reverify immigration status as part of Medicaid annual redetermination of eligibility processes. States do not need to re-verify immigration status for most enrollees during the annual renewal if that status is unlikely to change (e.g., the enrollee is a lawful permanent resident). However, immigrant children and pregnant people who have been lawfully residing in the U.S. for less than five years receiving coverage through the ICHIA option must have their immigration status re-verified at renewal. If, at any point during the coverage period, the state receives information about a change in an enrollee’s immigration status that might affect ongoing eligibility, the state is required to act on that change in circumstance to review eligibility and request additional documentation from the enrollee if needed.

The Impact of Medicaid and Title X on Planned Parenthood

Published: Apr 16, 2025

This data note was updated on April 30, 2025 to correct the number of sites participating in Title X and affected by the Title X funding freeze.

Medicaid and Title X, the federally funded family planning program, reimburse or fund Planned Parenthood clinics to provide contraceptive care, STI testing, pregnancy testing, and gynecological services to low-income and uninsured individuals. Over the past decade, policy makers who oppose abortion have attempted to block Planned Parenthood sites from obtaining state or federal funds largely due to their provision of abortion services. However, federal Medicaid dollars can only be used to pay for abortions under Hyde exceptions: rape, incest, and life endangerment and the Title X statute specifies that no federal funds appropriated under the program “shall be used in programs where abortion is a method of family planning.” A loss of Medicaid and Title X funding will likely mean that affected Planned Parenthood clinics will have fewer resources to serve low-income clients, could have longer wait times for those who seek care, and low-income patients could face limits to contraceptive access and STI screening. Ultimately, some of the clinics may be forced to close with impacts in many communities across the county.

Planned Parenthood and Medicaid

The Supreme Court of the United States is currently considering a case, Medina v. Planned Parenthood South Atlantic, that could ultimately have implications on whether states can disqualify Planned Parenthood clinics from their network of Medicaid participating providers. This would directly impact Medicaid beneficiaries who rely on Planned Parenthood for a broad range of sexual and reproductive health services. Based on claims from the 2021 Transformed Medicaid Statistical Information System (T-MSIS) data, one in ten (11%) reproductive age women covered by Medicaid who received family planning services got their care at a Planned Parenthood clinic (Figure 1). All state Medicaid programs are required to cover family planning services, which include contraception, STI services, Pap smears, and pelvic and breast exams free of cost-sharing to all their beneficiaries. The share of Medicaid beneficiaries using family planning services who rely on Planned Parenthood ranges from three in ten women with Medicaid in California (29%), to no women in in North Dakota and Wyoming where Planned Parenthood does not have a presence. Texas officially excluded Planned Parenthood from the state’s Medicaid program on March 10, 2021, so a limited number of claims were identified.

Planned Parenthood Clinics Provide Family Planning Services to Medicaid Beneficiaries in Almost All States

While Planned Parenthood clinics have been targeted because many provide abortion services, the majority of people go to Planned Parenthood clinics for contraceptive services, STI testing, pregnancy testing, and gynecological services. Nearly nine in ten female Medicaid beneficiaries ages 15 to 49 who got family planning care at a Planned Parenthood clinic in 2021 received contraceptive services and over half received STI services (Figure 2). Nearly half also got gynecological services like a Pap smear, HPV screening, or a pregnancy test.

The Majority of Medicaid Beneficiaries Who Received Family Planning Services at a Planned Parenthood Clinic Received Contraceptive and STI Services

Planned Parenthood and Title X

The Title X program supports a network of approximately 4,000 clinics across the country to offer free or reduced cost family planning services to low-income and uninsured people. Nationally, 297 Planned Parenthood clinics in 34 states and DC, over half (54%) of Planned Parenthood clinics nationwide, participate in the Title X program (Figure 3). Planned Parenthood grantees applied for and qualified to receive a total of $20.6 million to provide services to low-income and uninsured women and men, accounting for 8% of the total $261 million awarded nationally for Title X funding. Other Title X grantees also include Planned Parenthood sites in their network of clinics.

Figure 3

The same week oral arguments were heard for Medina v. Planned Parenthood South Atlantic, the US Department of Health and Human Services (HHS) announced that they were withholding Title X awards from 16 of the 86 Title X grantees across the country, which include all of the Planned Parenthood grantees. Additionally, the funding freeze impacted other organizations that include Planned Parenthood sites in their networks of clinics. While the funding freezes do not impact all Planned Parenthood clinics, overall, 144 Planned Parenthood clinics in 20 states are directly affected by the freeze. Title X grantees that were not affected by the funding freeze received partial FY2025 awards.

Figure 4

Methods

Data: This analysis used the 2021 Release 1 T-MSIS Research Identifiable Files, specifically the other services (OT) claims files merged with the demographic-eligibility (DE) files, limiting to females ages 15 to 49.

Identifying Planned Parenthood Providers: To identify family planning services provided at a Planned Parenthood clinic the NPPES NPI Registry was used to search for Planned Parenthood and PPFA in the Organization Name field to create a list of Planned Parenthood organization NPIs.

Identifying Family Planning Services: Diagnosis and procedure codes in the other services header and line claims files were used to identify the following family planning services: contraceptive services, STI services, gynecological services including Pap smear and HPV testing, as well as pregnancy testing. A family planning diagnosis was required for inclusion. A list of diagnosis and procedure codes is available upon request.

State exclusion criteria: GA, IL, and MS were excluded due to data quality concerns. These states had unusable data in the following categories according to the DQATLAS: GA’s Billing Provider NPI data and MS’s Service Users – OT. There were no Planned Parenthood providers identified in IL despite their extensive network of Planned Parenthood clinics, which leads us to believe there is an issue with the Billing Provider NPI.