Medicare Advantage 2014 Spotlight: Enrollment Market Update
Trends in Enrollment by Plan Type
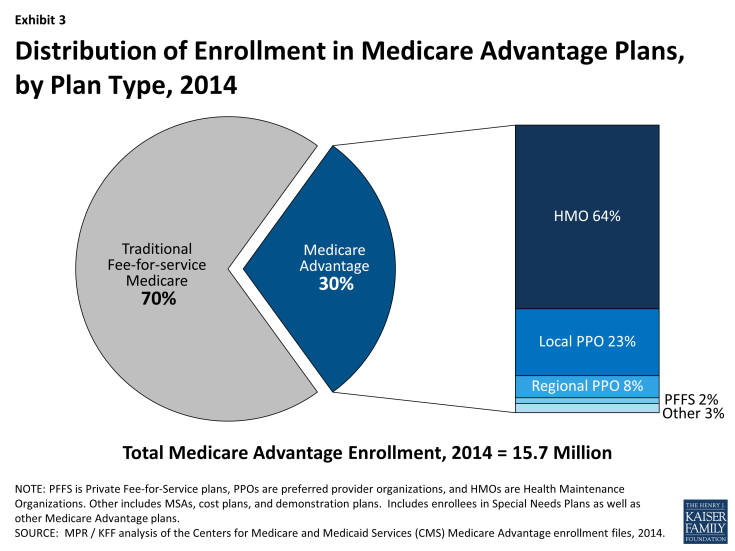
Nationwide Trends. HMOs, which were the original form of Medicare Advantage plan, account for almost two-thirds (64 percent) of Medicare Advantage enrollment in 2014, with 23 percent in local PPOs, 8 percent in regional PPOs, 2 percent in Private fee-for-service (PFFS) plans, and 3 percent in other types of plans (Exhibit 3). While the HMO market share has remained relatively stable in recent years, PPOs (especially local PPOs) have replaced the PFFS product as the dominant alternative plan attracting enrollees.
- HMOs. In 2014, 10.1 million Medicare beneficiaries were enrolled in HMOs, up from 9.3 million in 2013, an 8.6 percent increase (Exhibit 4). Nearly two-thirds of all Medicare Advantage enrollees are in an HMO in 2014 (64%), similar to each year since 2007.
- PPOs. In 2014, nearly one-third (31%) of Medicare Advantage enrollees are in either a local or regional PPO, with significantly higher enrollment in local than regional PPOs. Local PPOs have been authorized since the Balanced Budget Act of 1997 and regional PPOs have been authorized since 2006 under the MMA of 2003. However, enrollment in PPOs of any form has been relatively limited until recent years. Between 2007 and 2014, total PPO enrollment grew from about 500,000 to 4.9 million. A key difference between an HMO and a PPO is that the latter provides enrollees with the flexibility to see providers outside of the plan’s provider network, although cost sharing associated with out-of-network providers typically is substantially higher than for providers in a plan’s network.
- Local PPOs. Roughly three of four Medicare Advantage PPO enrollees are in a local PPO in 2014 (3.7 of 4.9 million). Local PPOs, like HMOs, are open to beneficiaries who live in specified counties. Since 2007, enrollment among Medicare beneficiaries in local PPOs has increased from 0.4 million to 3.7 million enrollees, up from 3.1 million in 2013.
- Regional PPOs. In contrast to the relatively rapid growth of local PPO enrollment, enrollment in regional PPOs has increased more slowly. In 2014, 1.2 million beneficiaries were enrolled in regional PPOs, up from 1.0 million in 2013 and 0.8 million in 2010. Regional PPOs are required to serve areas defined by one or more states with a uniform benefit package across the service area. The MMA of 2003 authorized the introduction of Regional PPOs to encourage more plans to serve rural areas Thus far, Regional PPOs have had limited traction nationwide, although they account for a not insignificant share of the market in a small number of states (Table A1).1
- PFFS. Enrollment in PFFS plans continued to decline in 2014, with only around 300,000 enrollees. This is one-quarter lower than in 2013, and considerably lower than the high of 2.2 million enrolled in 2009. The decline in enrollment in PFFS plans reflects a deliberate policy change included in the Medicare Improvements for Patients and Providers Act (MIPPA) of 2008 that required PFFS plans (with some county-specific exceptions) to have networks of providers by 2011. Such provider networks, legislators believed, were critical to creating the value sought from the Medicare Advantage program. The MIPPA requirements led to a dramatic decline in the number of PFFS plans offered, some of which were offered by companies that only offered PFFS plans and may not have thought that it was in their business interest to form networks.2 PFFS plans were the primary alternative to HMOs from 2007 through 2009 but their role in the Medicare Advantage market has now been more than eclipsed by that of PPOs.3
Geographic Variation in Trends by Plan Type. The distribution of Medicare Advantage enrollees, by plan type, varies across states (Table A1). HMOs account for 90 percent or more of Medicare Advantage enrollment in three states (AZ, CA, and NV), but less than one-third of total enrollment in 14 states (AK, GA, IN, KY, MN, MT, ND, NH, SC, SD, VT, WV, and WY) plus the District of Columbia. In states where HMOs are less dominant, local PPOs are most common, but in some states, beneficiaries tend to gravitate toward regional PPOs (SC, SD, VT), PFFS plans (WY,ND, SD) or cost plans (MN, DC). In Florida, most enrollees are in HMOs, but the state also has the largest number of regional PPO enrollees in the nation (almost 340,000). In Minnesota, more than 60 percent of private plan enrollees are in what is called a cost plan; Minnesota’s cost plan enrollees accounts for 58 percent of all cost plan enrollees nationwide. Policies that affect specific plan types will therefore have a differential effect from market to market, and across states.


