Medicare Advantage 2014 Spotlight: Enrollment Market Update
Overall Trends in Enrollment
Nationwide Enrollment. There are 15.7 million beneficiaries – 30 percent of the Medicare population – enrolled in a Medicare Advantage plan in 2014 (Exhibit 1).1 Between 2013 and 2014, total Medicare Advantage enrollment grew by almost 1.4 million, or 9 percent; since 2010, Medicare Advantage enrollment has increased by 4.6 million beneficiaries or 41 percent from 2010 to 2014. This pattern continues the rapid growth in enrollment that occurred concurrently with the introduction of Part D (prescription drug coverage) in 2006 and other changes in the Medicare Advantage program authorized by the Medicare Prescription Drug, Improvement and Modernization Act (MMA) of 2003. Medicare enrollment has continued to grow despite the fact that the average number of plans available to enrollees nationwide declined from a high of 48 plans in 2009 to 20 plans in 2012 and to 18 in 2014, as firms made changes to plans offered under their Medicare Advantage contracts.2
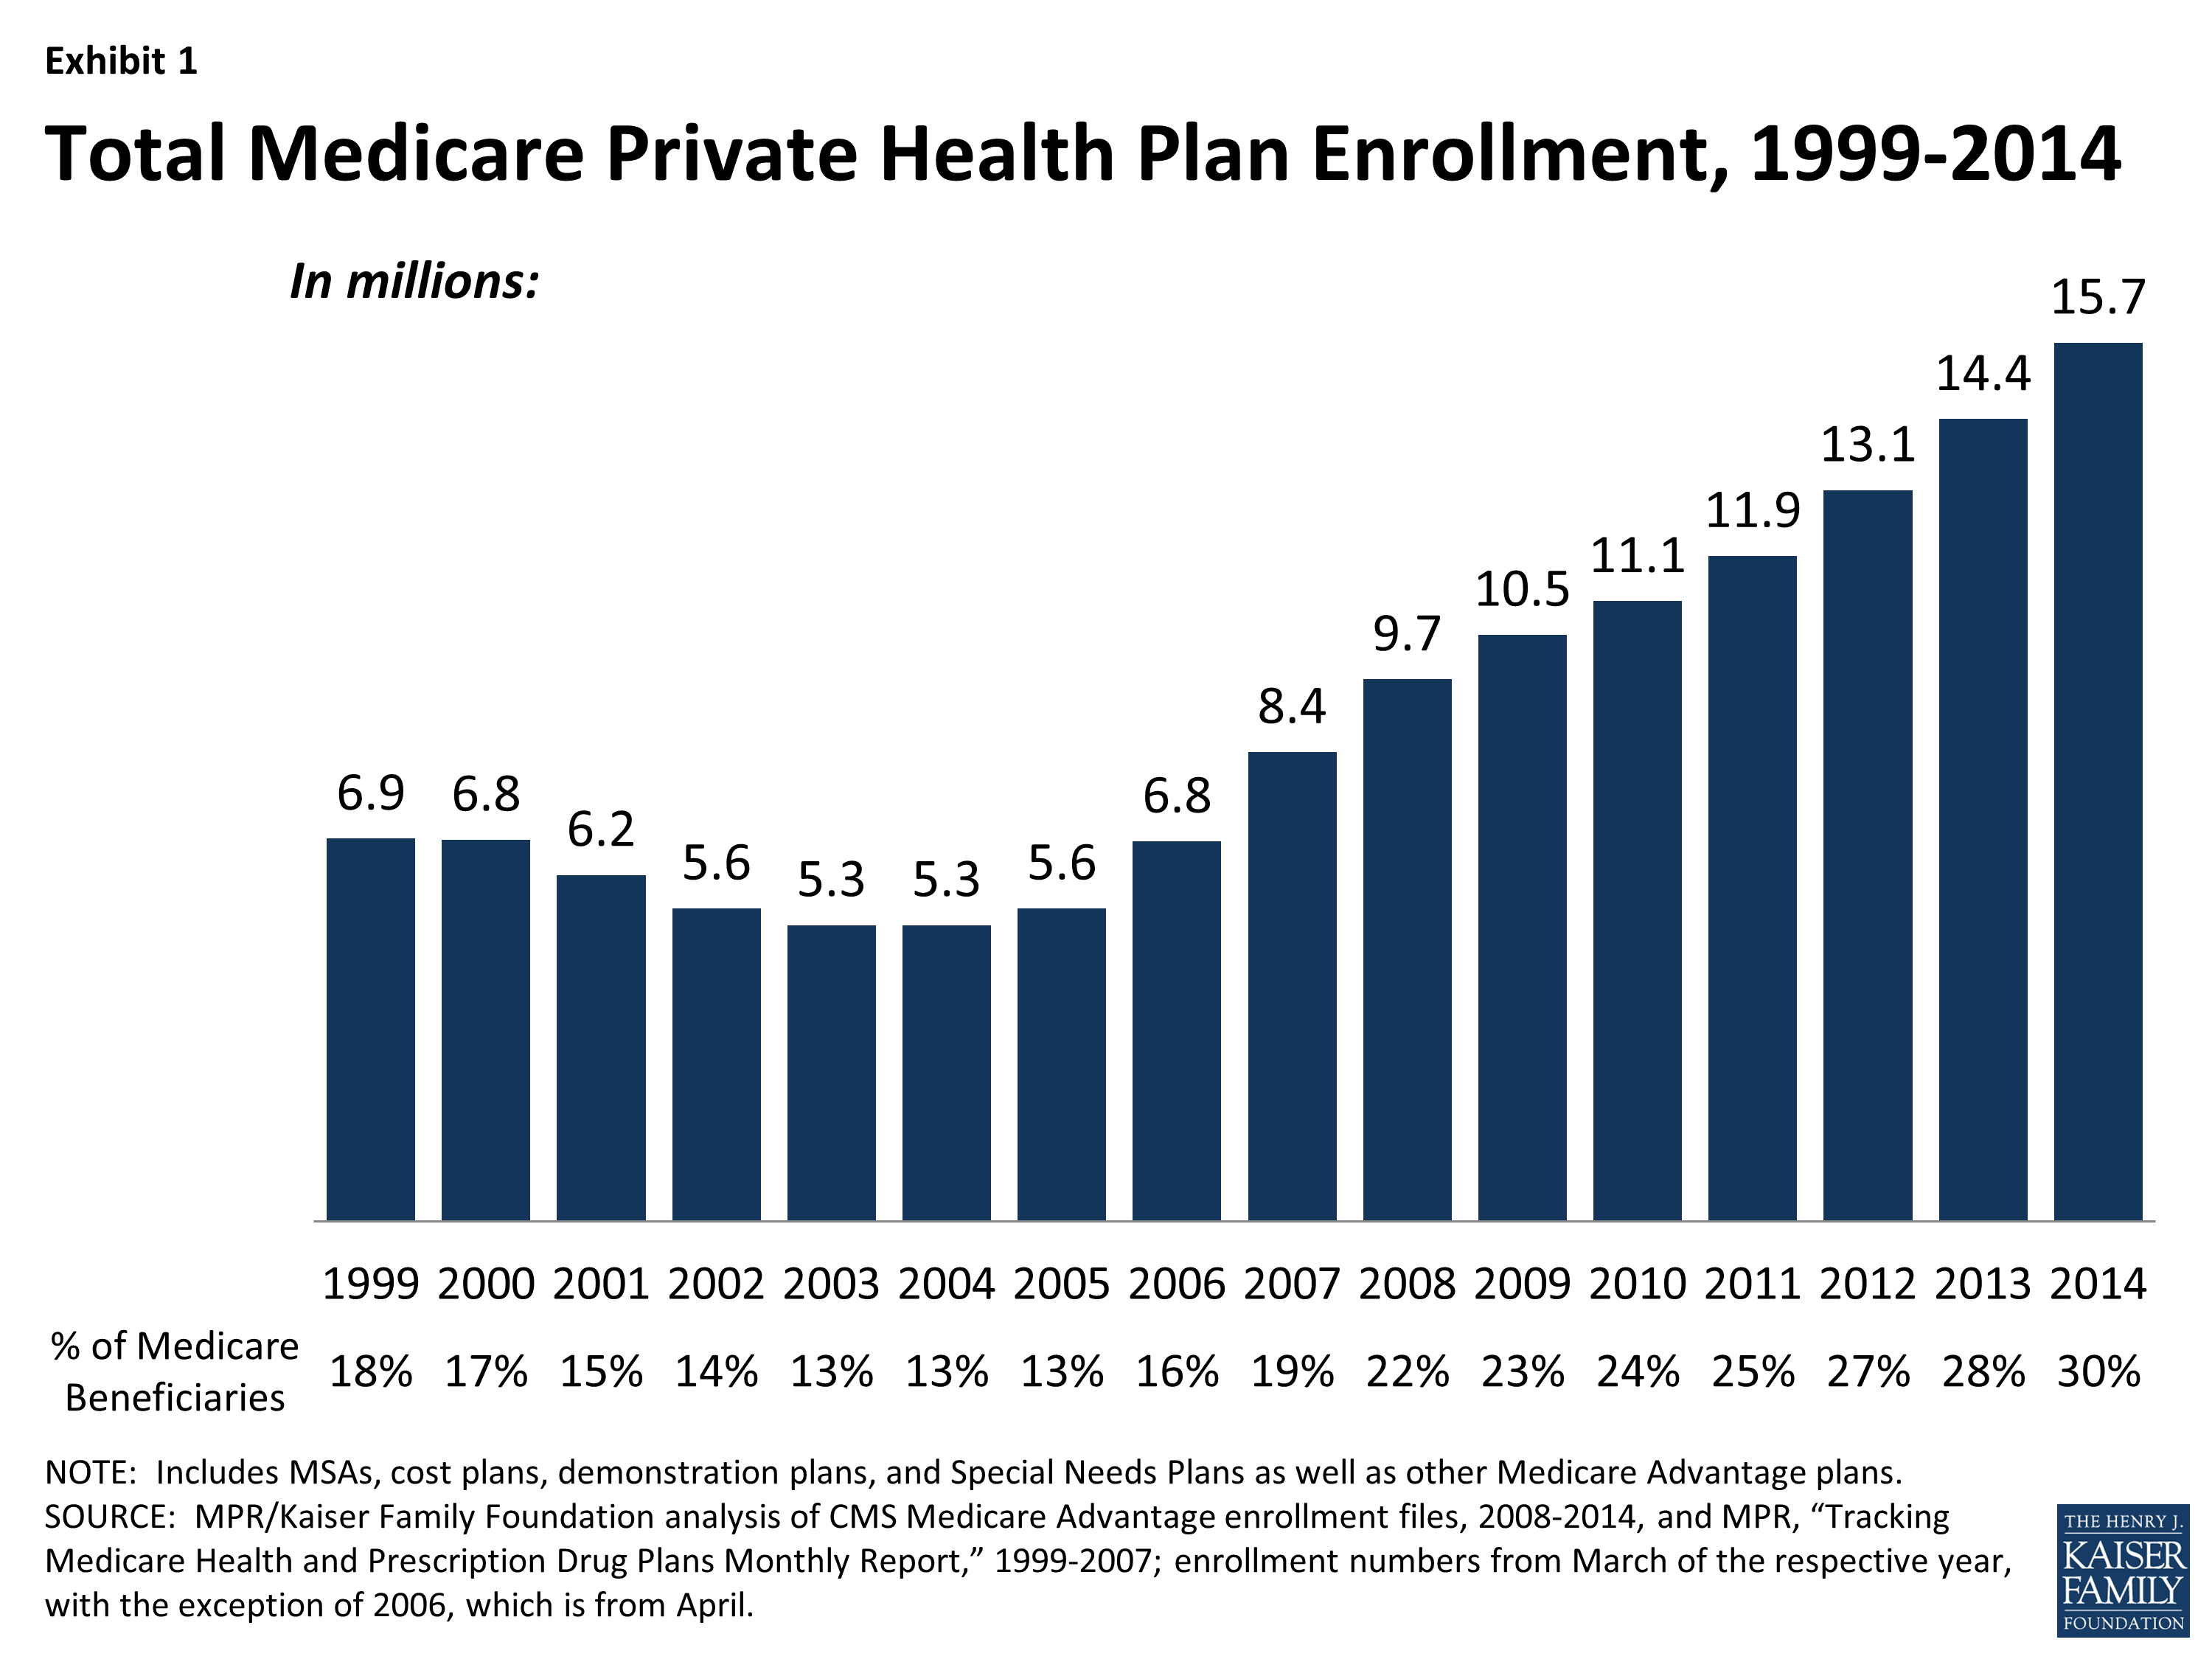
Exhibit 1: Total Medicare Private Health Plan Enrollment, 1999-2014
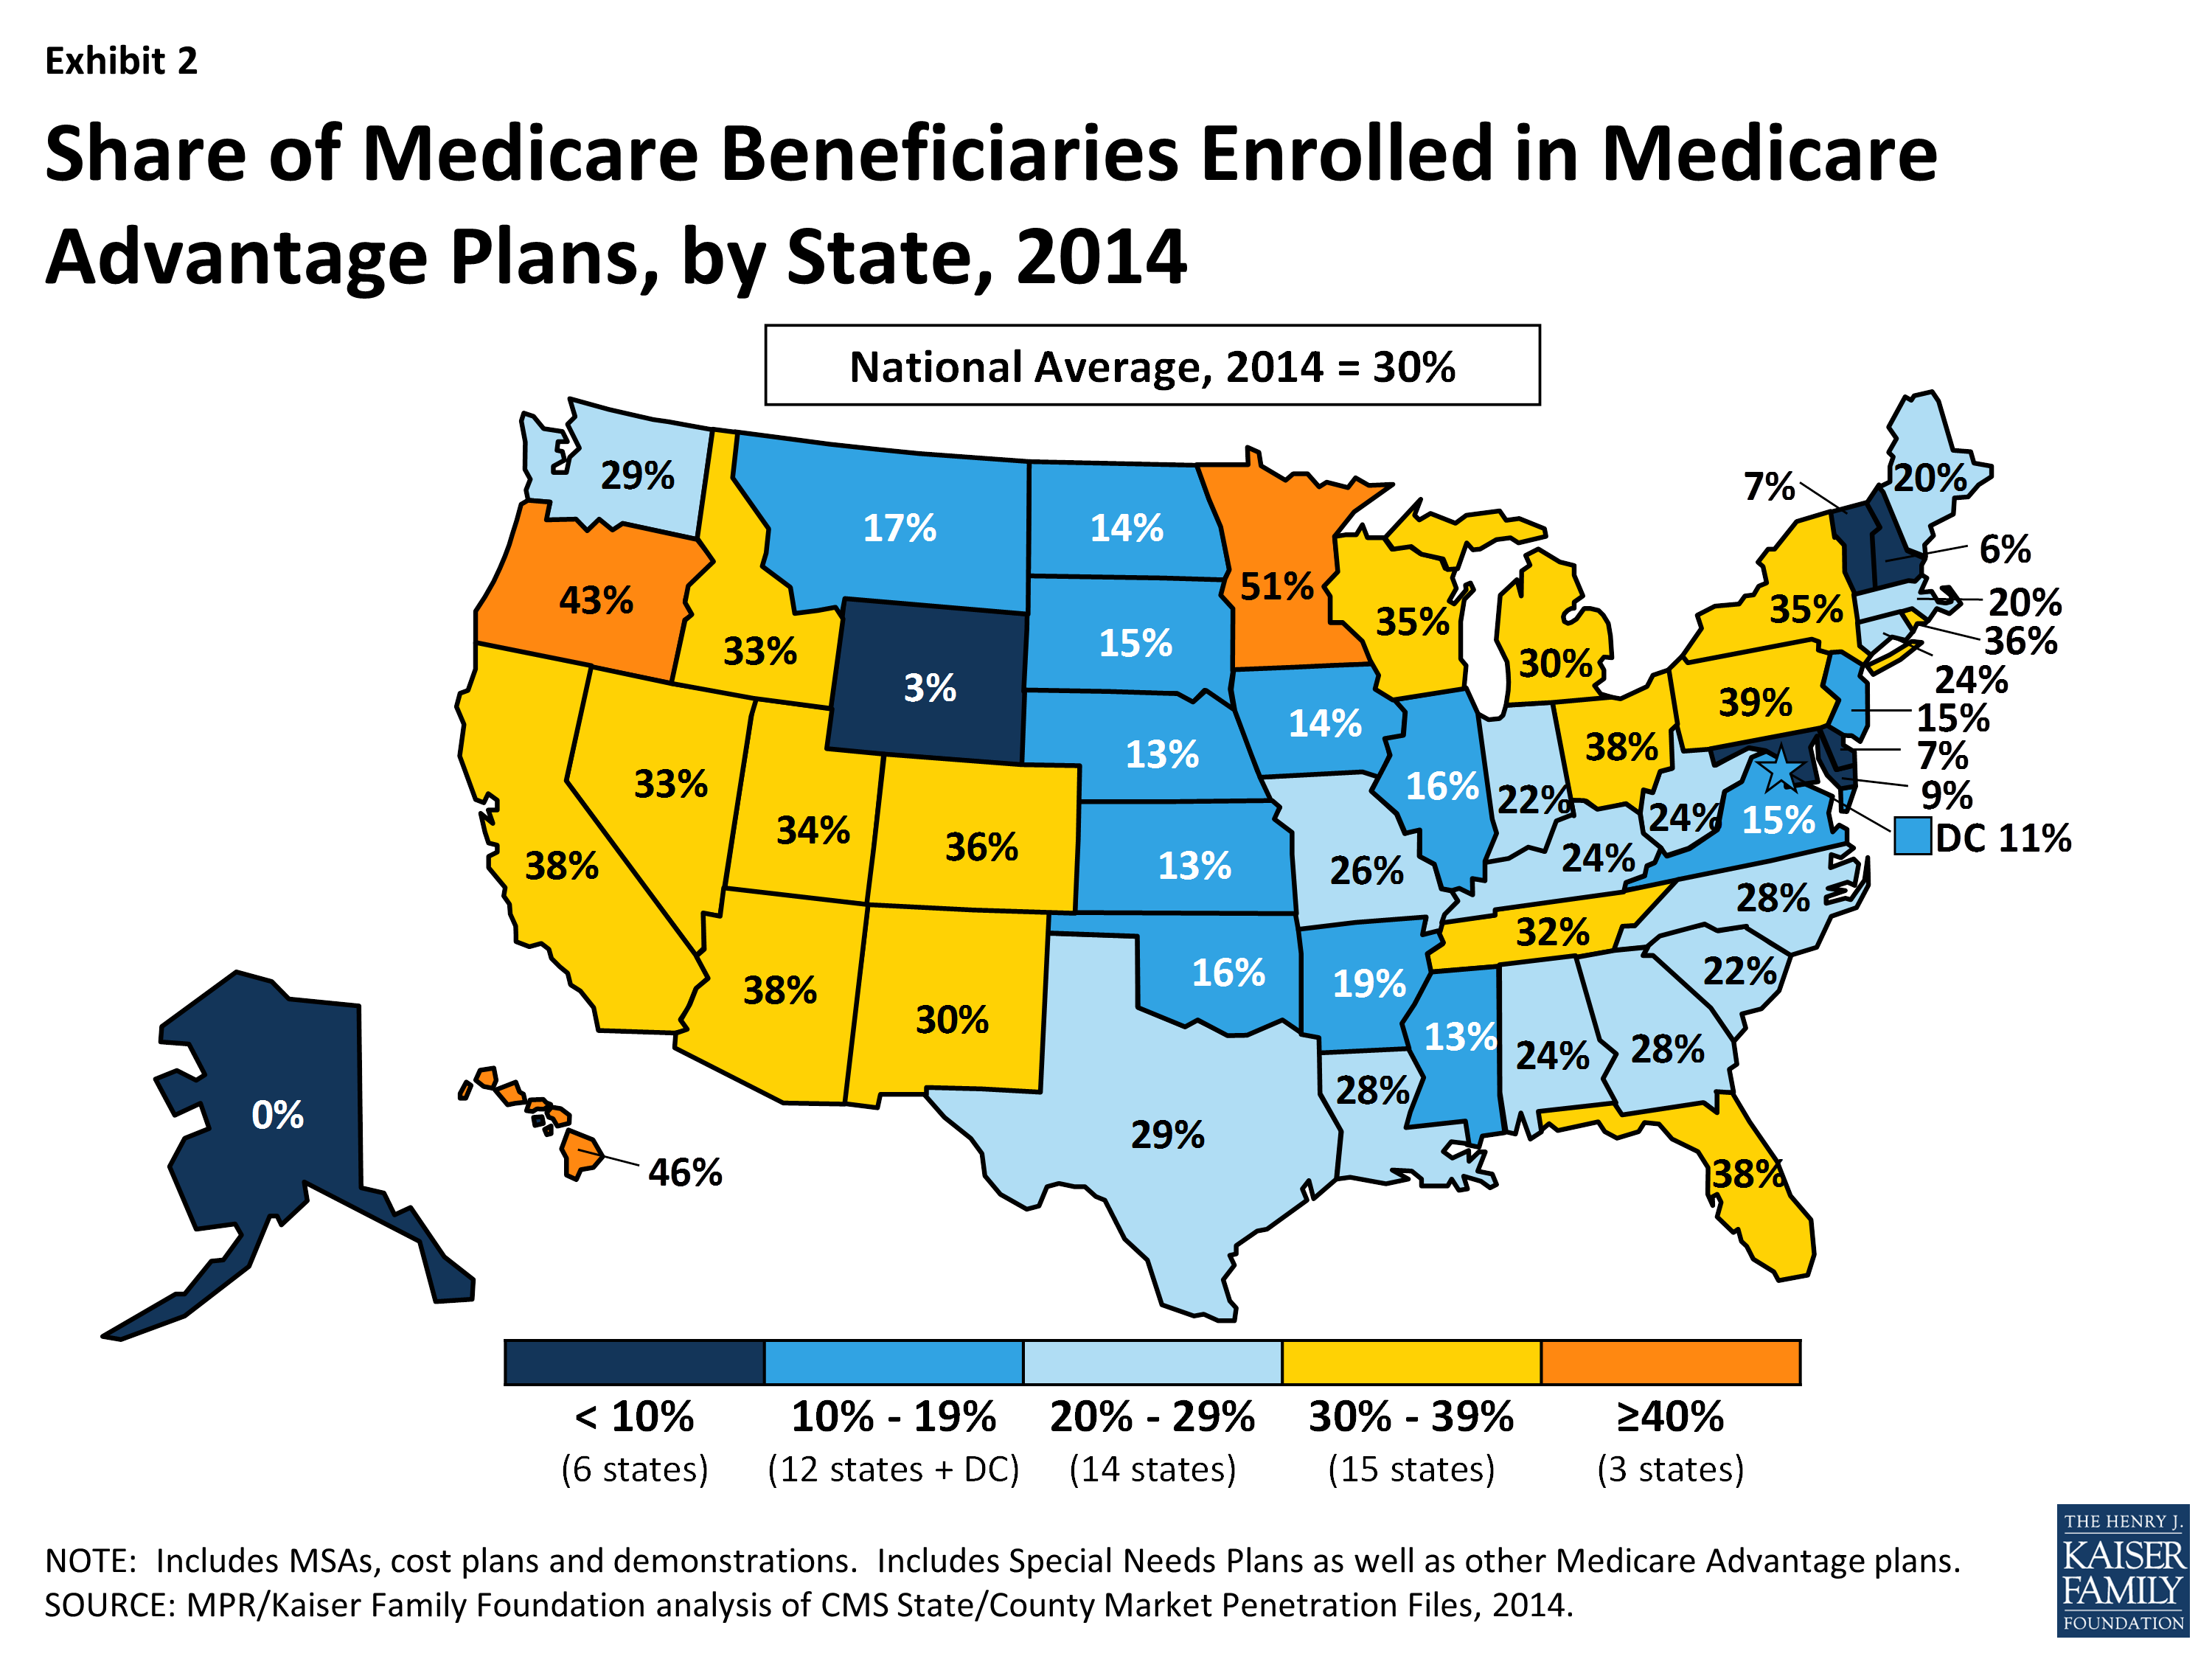
Exhibit 2: Share of Medicare Beneficiaries Enrolled in Medicare Advantage Plans, by State, 2014
Enrollment by State. Medicare Advantage enrollment continues to vary geographically (Table 1). In 2014, as in at least the prior two years, 6 states (AK, DE, MD, NH, VT and WY) had less than 10 percent of Medicare beneficiaries in Medicare Advantage plans (Exhibit 2). In contrast 18 states (versus 15 in 2013) have 30 percent or more of their beneficiaries enrolled in Medicare Advantage plans, including 3 (MN, OR, and HI) with 40 percent or more enrolled in Medicare Advantage plans. This variation reflects the urban origins of health maintenance organizations (HMOs) in Medicare Advantage and other factors, such as the history of managed care in the state and the prevalence of employer sponsored insurance for retirees.
Despite such variation, enrollment increased in virtually all states in 2014, with the exception of New Jersey where enrollment declined 2 percent. Among other states, 13 states experienced a growth in enrollment of 5 percent or less In 19 states, enrollment grew by 6-10 percent, in 9 states enrollment grew by 11-15 percent and in 7 states enrollment grew by 16 percent or more between 2013 and 2014. Very high rates of growth (such as 56 percent in Illinois and 45 percent in North Carolina) reflect the influence of the group market, and illustrate how a single change in coverage for an employment-based retiree group can move relatively large numbers of people within a state. Each of these states added over 100,000 group enrollees to Medicare Advantage between March 2013 and 2014. In most other states, enrollment in group plans had a far more modest effect on the growth in Medicare Advantage enrollment.
| Table 1. Medicare Advantage Enrollment and Penetration Rate, by State, 2013-2014 | ||||||
| State | 2013 Total Enrollment | 2014 Total Enrollment | Change in Total Enrollment, 2013-2014 | Percent Change in Enrollment, 2013-2014 | 2013 Penetration Rate | 2014 Penetration Rate |
| Total U.S. | 14,361,615 | 15,732,081 | 1,370,466 | 10% | 28% | 30% |
| Alabama | 203,951 | 220,640 | 16,689 | 8% | 22% | 24% |
| Alaska | N/A | N/A | N/A | N/A | N/A | N/A |
| Arizona | 384,851 | 401,626 | 16,775 | 4% | 38% | 38% |
| Arkansas | 98,322 | 107,713 | 9,391 | 10% | 17% | 19% |
| California | 1,937,350 | 2,061,617 | 124,267 | 6% | 37% | 38% |
| Colorado | 244,356 | 263,788 | 19,432 | 8% | 35% | 36% |
| Connecticut | 137,253 | 146,372 | 9,119 | 7% | 23% | 24% |
| Delaware | 10,941 | 12,623 | 1,682 | 15% | 7% | 7% |
| District of Columbia | 8,654 | 9,714 | 1,060 | 12% | 10% | 11% |
| Florida | 1,318,740 | 1,438,325 | 119,585 | 9% | 36% | 38% |
| Georgia | 350,142 | 404,628 | 54,486 | 16% | 25% | 28% |
| Hawaii | 103,346 | 108,143 | 4,797 | 5% | 46% | 46% |
| Idaho | 74,871 | 81,440 | 6,569 | 9% | 30% | 33% |
| Illinois | 209,200 | 326,678 | 117,478 | 56% | 11% | 16% |
| Indiana | 224,875 | 244,970 | 20,095 | 9% | 21% | 22% |
| Iowa | 74,520 | 77,032 | 2,512 | 3% | 14% | 14% |
| Kansas | 54,329 | 59,018 | 4,689 | 9% | 12% | 13% |
| Kentucky | 178,945 | 198,052 | 19,107 | 11% | 22% | 24% |
| Louisiana | 193,638 | 213,280 | 19,642 | 10% | 26% | 28% |
| Maine | 49,347 | 58,234 | 8,887 | 18% | 17% | 20% |
| Maryland | 73,239 | 76,464 | 3,225 | 4% | 8% | 9% |
| Massachusetts | 209,147 | 229,400 | 20,253 | 10% | 18% | 20% |
| Michigan | 478,923 | 547,372 | 68,449 | 14% | 27% | 30% |
| Minnesota | 415,638 | 448,301 | 32,663 | 8% | 49% | 51% |
| Mississippi | 64,000 | 69,962 | 5,962 | 9% | 12% | 13% |
| Missouri | 257,164 | 285,066 | 27,902 | 11% | 24% | 26% |
| Montana | 27,229 | 31,125 | 3,896 | 14% | 15% | 17% |
| Nebraska | 33,228 | 33,507 | 279 | 1% | 12% | 13% |
| Nevada | 126,441 | 135,599 | 9,158 | 7% | 32% | 33% |
| New Hampshire | 12,554 | 15,905 | 3,351 | 27% | 5% | 6% |
| New Jersey | 223,161 | 219,494 | -3,667 | -2% | 16% | 15% |
| New Mexico | 98,198 | 107,064 | 8,866 | 9% | 29% | 30% |
| New York | 1,062,329 | 1,151,620 | 89,291 | 8% | 33% | 35% |
| North Carolina | 328,020 | 475,432 | 147,412 | 45% | 20% | 28% |
| North Dakota | 13,716 | 15,202 | 1,486 | 11% | 12% | 14% |
| Ohio | 755,580 | 794,226 | 38,646 | 5% | 37% | 38% |
| Oklahoma | 102,224 | 106,706 | 4,482 | 4% | 16% | 16% |
| Oregon | 286,306 | 305,794 | 19,488 | 7% | 42% | 43% |
| Pennsylvania | 939,496 | 971,144 | 31,648 | 3% | 39% | 39% |
| Rhode Island | 68,306 | 70,627 | 2,321 | 3% | 35% | 36% |
| South Carolina | 167,292 | 193,641 | 26,349 | 16% | 20% | 22% |
| South Dakota | 18,781 | 22,242 | 3,461 | 18% | 13% | 15% |
| Tennessee | 338,124 | 376,577 | 38,453 | 11% | 29% | 32% |
| Texas | 889,551 | 990,399 | 100,848 | 11% | 27% | 29% |
| Utah | 101,751 | 107,139 | 5,388 | 5% | 33% | 34% |
| Vermont | 8,199 | 8,368 | 169 | 2% | 7% | 7% |
| Virginia | 181,455 | 196,993 | 15,538 | 9% | 15% | 15% |
| Washington | 305,289 | 329,087 | 23,798 | 8% | 28% | 29% |
| West Virginia | 83,922 | 96,604 | 12,682 | 15% | 21% | 24% |
| Wisconsin | 324,912 | 352,842 | 27,930 | 9% | 33% | 35% |
| Wyoming | 1,940 | 1,997 | 57 | 3% | 3% | 3% |
| NOTE: Includes employer-sponsored plans, special needs plans, and other private plans. N/A indicates too few (less than 50) enrollees to report. Total U.S. includes Puerto Rico. SOURCE: MPR/Kaiser Family Foundation analysis of CMS Medicare Advantage enrollment and Landscape files, 2013-2014. |
||||||