An Early Assessment of Hurricane Harvey’s Impact on Vulnerable Texans in the Gulf Coast Region: Their Voices and Priorities to Inform Rebuilding Efforts
Section 1: The Big Picture: Who Was Affected by Harvey and How?
Housing, Property Damage, Employment, and Income Effects
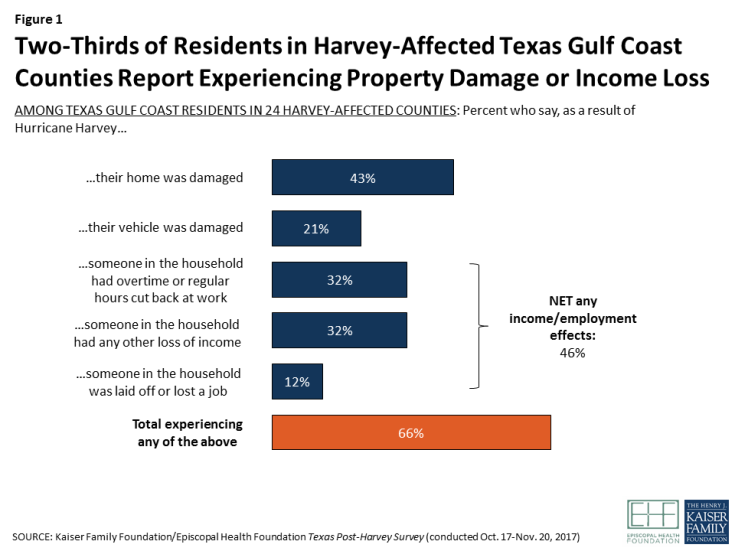
Hurricane Harvey left a trail of physical destruction along the Texas Gulf Coast, and the survey finds that a large share of area residents felt the effects in their own lives. Overall, two-thirds of adults in the 24 Texas Gulf Coast counties surveyed say they were adversely affected by the hurricane, either because their home or vehicle was damaged or because they or a family member in their household experienced the loss of a job, decreased wages, or other lost income.
More specifically, more than four in ten residents (43 percent) report that their home was damaged, including one in five who say their home had major damage (16 percent) or was completely destroyed (3 percent). About one in five (21 percent) also say they owned a vehicle that was damaged or destroyed by Harvey. Nearly half (46 percent) say they or someone in their household experienced employment-related effects of the hurricane, including losing a job or being laid off (12 percent), having hours cut back at work (32 percent), or some other loss of income such as from a small business or unpaid missed days of work (32 percent).

Figure 1: Two-Thirds of Residents in Harvey-Affected Texas Gulf Coast Counties Report Experiencing Property Damage or Income Loss
For more detail on residents’ housing and transportation situation, see Section 4
For more detail on residents’ employment and financial situation, see Section 5
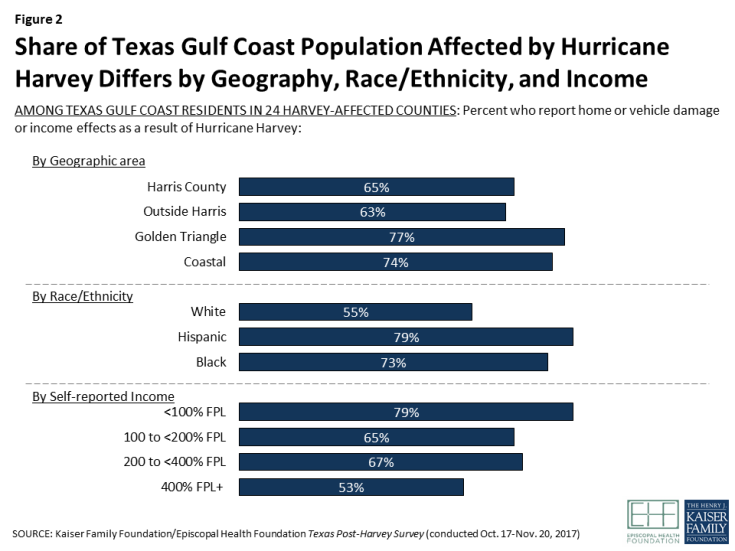
The effects of Hurricane Harvey were felt more heavily in some communities than others. Geographically, those in the Golden Triangle (77 percent) and Coastal counties (74 percent) were more likely to report being affected than those in Harris County and the counties that surround it (65 percent and 63 percent, respectively), with differences largely driven by higher rates of property damage. Effects were also distributed unevenly across demographic groups, with Black and Hispanic residents and those with lower incomes more likely to report being affected. For Hispanics, this disparity is largely driven by higher rates of employment- related effects, while for Blacks it is driven both by employment effects and by higher rates of damage to their homes and vehicles. Not surprisingly, those with lower incomes – who are less likely to hold salaried jobs and more likely to work on an hourly or contract basis – are more likely to report adverse effects on employment and income as a result of the storm. However, the income disparity is not limited to employment effects; lower- and middle-income individuals are also more likely to report damage to their homes compared to those with higher incomes.

Figure 2: Share of Texas Gulf Coast Population Affected by Hurricane Harvey Differs by Geography, Race/Ethnicity, and Income
| Table 1: Detailed Effects of Hurricane Harvey by Geographic Region, Race/Ethnicity, and Income | |||||||||||
| Percent who report the following as a result of Hurricane Harvey: | Geographic Region | Race/Ethnicity | Self-reported Income (% of FPL) |
||||||||
| Harris County | Outside Harris | Golden Triangle | Coastal | White | Black | Hisp. | <100 | 100 to <200 | 200 to <400 | 400+ | |
| Home was damaged (NET) | 38% | 42% | 62% | 64% | 38% | 55% | 45% | 53% | 44% | 44% | 32% |
| Major damage/ destroyed | 15 | 22 | 35 | 23 | 21 | 23 | 16 | 22 | 20 | 19 | 17 |
| Minor damage | 23 | 19 | 26 | 40 | 16 | 32 | 29 | 31 | 24 | 24 | 14 |
| Vehicle was damaged | 24 | 15 | 32 | 14 | 16 | 30 | 23 | 25 | 23 | 20 | 18 |
| Someone in household experienced income/job loss | 49 | 40 | 46 | 44 | 31 | 46 | 65 | 59 | 50 | 48 | 29 |
| NET Affected in any of above ways | 65 | 63 | 77 | 74 | 55 | 73 | 79 | 79 | 65 | 67 | 53 |
Since race and income are correlated, it can be difficult to determine whether the disparities in storm-related effects are driven more by one factor or the other. Our analysis indicates that both race/ethnicity and income play a role, but that some racial and ethnic differences persist regardless of income. For example, Hispanic residents at both higher and lower income levels are more likely than their white counterparts to say someone in their household experienced employment-related disruptions as a result of the storm – specifically having hours cut back at work. Nearly six in ten (58 percent) Hispanics who report incomes below 200 percent of the federal poverty level (FPL) say this happened, compared with three in ten lower-income Blacks (31 percent) and two in ten lower-income whites (19 percent). And for those with self-reported incomes above 200 percent of poverty, Hispanics are almost twice as likely as whites to say a family member had their hours cut back (37 percent versus 20 percent).1
| Table 2: Percent Reporting Different Effects from Hurricane Harvey by Race and Income | |||||
| Percent who report the following as a result of Hurricane Harvey: | Self-reported Income <200% FPL | Self-reported Income 200% FPL or higher | |||
| White | Hispanic | Black | White | Hispanic | |
| Home was damaged | 46% | 48% | 59% | 35% | 42% |
| Vehicle was damaged | 16 | 25 | 32* | 17 | 20 |
| Someone in household was laid off or lost a job | 14 | 17 | 22 | 5 | 6 |
| Someone in household had hours cut back at work | 19 | 58* | 31* | 20 | 37* |
| Someone in household had other loss of income | 31 | 45* | 37 | 19 | 36* |
| NET Affected in any of above ways | 61 | 82* | 74* | 53 | 71* |
| Note: * indicates statistically significant difference from white residents in the same income category. | |||||
Effects on Physical and Mental Health
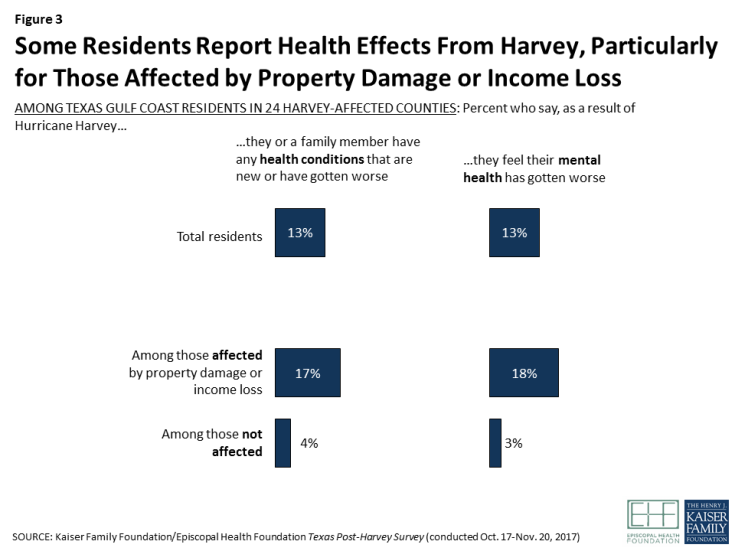
In addition to the reported effects on people’s finances and living situations, some residents also report problems with their physical and mental health as a result of Hurricane Harvey. Overall, 13 percent of residents in the 24-county area (including 17 percent of those who suffered property damage or income losses and 4 percent of those who did not) say someone in their household has a health condition that is new or has gotten worse as a result of Harvey. Similarly, 13 percent of all residents (including 18 percent of those who suffered property or income losses and 3 percent of those who did not) feel that their own mental health has gotten worse as a result of the hurricane.

Figure 3: Some Residents Report Health Effects From Harvey, Particularly for Those Affected by Property Damage or Income Loss
For more detail on residents’ health care challenges, see Section 6
