News Release

10 Prescription Drugs Accounted for $48 Billion in Medicare Part D Spending in 2021, or More Than One-Fifth of Part D Spending That Year  

Published: Jul 12, 2023

A new KFF analysis finds that the 10 top-selling prescription drugs under Medicare Part D comprised less than 1 percent of all covered drugs in 2021, but accounted for 22 percent, or $48 billion, of gross Medicare Part D drug spending that year.

The analysis provides context for understanding the federal government’s new authority under the Inflation Reduction Act to negotiate prices for some high-spending drugs covered by Part D, Medicare’s outpatient prescription drug benefit program, and Part B, which covers physician and outpatient services, including drugs administered by physicians and other providers.

All of the 10 top-selling Medicare Part D drugs in 2021 were brand-name drugs. Five of them were diabetes drugs, including Ozempic, which belongs to a class of medications that lately have gained attention because they are also effective for weight loss. Other drugs in the top 10 included Eliquis, a blood thinner that was the No. 1 selling drug in 2021, followed by Revlimid, a treatment for multiple myeloma, and Xarelto, a blood thinner.

Total Gross Sending on The Top 10 Medicare Part D Drugs in 2021 Ranged from $2.6 Billion for Ozempic, a Diabetes Drug, to $12.6 Billion for Eliquis, a Blood Thinner

While the drug price negotiations begin modestly with 10 drugs in the first year, KFF’s research shows that even a relatively small number of drugs can command a substantial share of spending in Medicare. The number of drugs subject to price negotiation will grow in subsequent years and may include drugs covered under Part B beginning in 2028. Drugs will be selected for negotiation from among those with the highest gross prescription drug costs under Medicare.

It is important to note that this analysis, based on 2021 data from the Centers for Medicare and Medicaid Services (CMS), is not designed to identify which drugs are likely to be subject to price negotiation for 2026. CMS will use more current spending data and consider several factors, including FDA approval date and generic availability, in making that determination. CMS will publish the names of the first 10 Part D drugs selected for price negotiation by September 1, 2023.

In 2021, Part D covered more than 3,500 prescription drug products, with total gross spending of $216 billion, not accounting for rebates paid by drug manufacturers to pharmacy benefit managers. Total Part B drug spending was $40 billion on more than 600 covered drugs in 2021, but Part B drugs will not be subject to price negotiation until 2028.

A Small Number of Drugs Account for a Large Share of Medicare Part D Spending

Published: Jul 12, 2023

The Inflation Reduction Act requires the federal government to negotiate the price of certain high-spending drugs covered by Medicare Part D, Medicare’s outpatient prescription drug benefit program, and Medicare Part B, which covers physician and outpatient services, including drugs administered by physicians and other providers. Under the new Medicare Drug Price Negotiation Program, the number of drugs subject to price negotiation will be limited to 10 Part D drugs for 2026, another 15 Part D drugs for 2027, another 15 Part D and Part B drugs for 2028, and another 20 Part D and Part B drugs for 2029 and later years. The number of drugs with negotiated prices available will accumulate over time.

The 10 Part D drugs that will be selected for price negotiation for 2026 will be published by September 1, 2023. These 10 drugs will be chosen from the top 50 negotiation-eligible Part D drugs with the highest total Medicare Part D expenditures (defined as total gross covered prescription drug costs). Subject to specific exclusions and exceptions, drugs qualify for price negotiation if they are single-source brand-name drugs or biological products without therapeutically-equivalent generic or biosimilar alternatives, and are at least 7 years (for small-molecule drugs) or 11 years (for biologics) past their FDA approval or licensure date, as of the date that the list of drugs selected for negotiation is published.

This analysis provides context for understanding the potential impact of negotiating prices for a limited number of Medicare-covered drugs by identifying the 10 top-selling drugs in 2021, measuring the share of total Medicare Part D drug spending accounted for by top-selling drugs that year, and examining changes in spending and use of these drugs since 2018 (the first year that all 10 of the drugs were covered under Part D). We focus on drugs covered under Part D, rather than Part B, since negotiation will be limited to Part D drugs for the first two years of the negotiation program. We ranked drugs by total gross spending in 2021 since that is the measure that will be used to rank drug products in the negotiation program. Our analysis is based on Centers for Medicare & Medicaid Services’ data on Medicare Part D spending by drug.

It is important to note that this analysis is not designed to identify which drugs are likely to be subject to price negotiation for 2026, since we do not take into account all of the factors that determine whether a drug is negotiation-eligible and we do not have access to the more current spending data that CMS will use in selecting drugs for price negotiation.

A small number of drugs account for a disproportionate share of Medicare Part D prescription drug spending, with the 10 top-selling drugs accounting for nearly one-fourth of gross Part D spending in 2021

In 2021, Medicare Part D covered more than 3,500 prescription drug products, with total gross spending of $216 billion, not accounting for rebates paid by drug manufacturers to pharmacy benefit managers (PBMs). The 10 top-selling Part D drugs accounted for 0.3% of covered drugs and 22% of total gross Medicare drug spending in 2021 (Figure 1). The top 100 drugs, representing just 3% of covered drugs, accounted for 61% of total gross spending that year.

Relatively Few Drugs Account for a Large Share of Medicare Part D Spending

Total gross spending on the top 10 Medicare Part D drugs in 2021 ranged from $2.6 billion for Ozempic, a diabetes drug, to $12.6 billion for Eliquis, a blood thinner

In the aggregate, gross Medicare drug spending on the top 10 Part D drugs in 2021 was $48 billion. Eliquis, a blood thinner manufactured by Bristol Myers Squibb, was the top-selling drug, accounting for a quarter of this total, or $12.6 billion (Figure 2). Gross Medicare Part D spending exceeded $5 billion for both Revlimid, a treatment for multiple myeloma also manufactured by Bristol Myers Squibb, and Xarelto, a blood thinner manufactured by Janssen.

Total Gross Sending on The Top 10 Medicare Part D Drugs in 2021 Ranged from $2.6 Billion for Ozempic, a Diabetes Drug, to $12.6 Billion for Eliquis, a Blood Thinner

Five of the 10 top-selling Part D drugs in 2021 are diabetes drugs: Trulicity, Januvia, Jardiance, Lantus Solostar, and Ozempic. Notably, Ozempic belongs to a class of medications that have gained attention in recent months because they are highly effective weight loss agents. Manufactured by Novo Nordisk, Ozempic was approved by the FDA in 2017 as a treatment for type 2 diabetes. While Medicare does not cover Ozempic when prescribed off-label for weight loss due to the current law prohibition on Medicare coverage of drugs when used for weight loss, it is covered as a diabetes drug. Gross Part D spending on Ozempic, used by 0.5 million Part D enrollees in 2021, totaled $2.6 billion.

Also included in the top 10 is Imbruvica, a cancer treatment manufactured by Pharmacyclics, with gross Medicare spending of $3.2 billion in 2021, and Humira Citrate-free (Cf) pen, a treatment for rheumatoid arthritis (among other conditions), manufactured by Abbvie, with gross Medicare spending of $2.9 billion in 2021. (While the original version of Humira was approved in 2002, Abbvie launched the citrate-free version in 2018). Gross Medicare spending across all formulations of Humira totaled $4.7 billion in 2021, including the citrate-free and original versions and various formulations and dosages of each version approved for different indications and populations.

In the aggregate, gross Medicare spending for the 10 top selling Part D drugs more than doubled between 2018 and 2021

Between 2018 and 2021, aggregate gross spending on the 10 top-selling drugs in 2021 increased from $22 billion to nearly $48 billion. The increase in gross spending on these 10 drugs alone accounted for more than half of the increase in gross Medicare spending across all covered Part D drugs over these years. In the aggregate, gross Part D spending rose from $166 billion in 2018 to $216 billion in 2021.

Over these years, total gross Part D spending on Eliquis, the top selling drug in Medicare Part D in 2021, increased by 2.5 times from $5 billion in 2018 to $12.6 billion in 2021; gross spending for the diabetes drug Trulicity more than tripled from $1.4 billion to $4.7 billion; and gross spending on the diabetes drug Jardiance increased more than five times from $0.7 billion to $3.7 billion (Figure 3). For all of these drugs, the percentage increase in gross spending between 2018 and 2021 outpaced the percentage increase in the number of users over these years (data not shown, see Figure 2 for number of users per drug in 2018 and 2021).

Spending on Each of the Top 10 Medicare Part D Drugs in 2021 Has Increased Since 2018

Conclusion

The Medicare drug price negotiation program established by the Inflation Reduction Act is designed to target high-spending drugs that have been on the market for several years and lack generic or biosimilar competition. CBO estimates nearly $100 billion in Medicare savings between 2026 and 2031 from the drug negotiation program. Our analysis shows that Medicare Part D spending is highly concentrated among a small share of covered brand-name drugs, and that increases in gross spending on the 10 top-selling drugs have contributed to a substantial increase in overall Medicare drug spending in recent years.

While this analysis is not designed to identify which drugs will be selected for negotiation for 2026, two of the 10 top-selling Part D drugs in 2021 would not be eligible for selection based on when they were approved (Trulicity, a biologic approved in 2014, and Ozempic, a small-molecule drug approved in 2017) and three would not be eligible for selection based on generic or biosimilar availability in 2023 (Revlimid, Humira, and Lantus). The final list will be determined based on more current spending data than is publicly available and consideration of several factors not included here. While all of the 10 top-selling Part D drugs in 2021 will not be included on the list of 10 drugs selected for price negotiation this year, this analysis suggests that targeting negotiation on a small number of high-spending drugs could affect a disproportionate share of Medicare drug spending in the future.

This work was supported in part by Arnold Ventures. KFF maintains full editorial control over all of its policy analysis, polling, and journalism activities.

Methods

This analysis is based on 2021 Medicare Part D Spending by Drug data from the Centers for Medicare & Medicaid Services (CMS). The data includes spending for beneficiaries in both traditional Medicare and Medicare Advantage who are enrolled in Medicare Part D plans.

Drug spending metrics for Part D drugs presented in the CMS data are based on the gross drug cost, which represents total spending for the prescription claim, including Medicare, plan, and beneficiary payments. The Part D spending metrics do not reflect manufacturer rebates or other price concessions, because CMS is prohibited from publicly disclosing such information.

We sorted the list of drugs in the Part D dashboard in 2021 (n=3,566) by total spending and calculated the percent of total spending accounted for by each drug, summing across the top 10, 15, 20, 50, and 100 drugs ranked by total spending.

We used the FDA’s Drugs@FDA database to identify FDA approval dates for the top 10 drugs by Part D gross spending in 2021.

Donor Government Funding for HIV in Low- and Middle-Income Countries in 2022

Authors: Adam Wexler, Jennifer Kates, Stephanie Oum, and Eric Lief
Published: Jul 12, 2023

Key Findings

This report provides an analysis of donor government funding to address the HIV response in low- and middle-income countries in 2022, the latest year available, as well as trends over time. It includes both bilateral funding from donors and their contributions to the Global Fund to Fight AIDS, Tuberculosis and Malaria (Global Fund), UNITAID, and UNAIDS. Overall, the analysis shows that while donor government funding for HIV increased between 2021 and 2022, this was primarily due to the timing of payments from the U.S. government and not actual increases in commitments. More broadly, UNAIDS reports that total global resources for HIV – including domestic funding – declined slightly in 2022 and are well below the estimated US$29.3 billion needed by 2025 to reach global goals; donor governments account for more than a third of total HIV resources. In addition, while there has been significant progress in addressing the HIV epidemic, new infections and AIDS-related deaths are on the rise in some regions and more than 9 million people living with HIV still lack access to antiretroviral therapy.1  With continued pressures on domestic and international resources resulting from the war in Ukraine, economic stress, and other challenges, future support for HIV remains uncertain. Key findings include the following:

  • Donor government funding for HIV increased in 2022 compared to the prior year. Disbursements were US$8.2 billion in 2022, an increase of more than US$700 million compared to 2021 (US$7.5 billion), in current U.S. dollars (funding increased even after accounting for inflation and exchange rate fluctuations).2  This increase essentially returns funding to 2020 levels in nominal terms, after a decline last year. More broadly, the real value of funding has fallen over the past decade due to the effects of inflation.
  • However, the increase in 2022 was primarily due to the timing of U.S. disbursements, rather than increased commitments. S. funding totaled US$6.1 billion in 2022, almost US$600 million above 2021 (US$5.5 billion), and included increases in both bilateral disbursements as well as contributions to the Global Fund.3  These increases, however, were entirely due to the timing of disbursements of prior-year funding rather than increased commitments, as the funding amounts specified by the U.S. Congress for both bilateral HIV programs and the Global Fund have been relatively flat through 2022.4  Similarly, while funding from all other donor governments also increased in 2022, this was largely attributable to the timing of Global Fund contributions from France and the European Commission.
  • The U.S. continues to be the largest donor to HIV, even after adjusting for the size of its economy. In 2022, the U.S. disbursed US$6.1 billion, accounting for 74% of total donor government HIV funding (bilateral and multilateral combined).5  France was the second largest donor (US$382 million, 5%), followed by the U.K. (US$376 million, 5%), the European Commission (US$328 million, 4%), and Germany (US$191 million, 2%). The U.S. also ranked first when standardized by the size of its economy, followed by the Netherlands, France, Sweden, and Denmark.
  • Looking at the longer-term trend, funding is below historical levels, largely due to declines in bilateral funding from donor governments other than the U.S. Total bilateral funding from other donor governments has decreased each year for more than a decade (by almost US$1.4 billion or 80% since 2011). While increases in multilateral funding have offset these declines in some years, overall funding is still more than US$1.0 billion below where it was just over a decade ago. This also suggests that the already significant dependency of international HIV resources on the U.S. could grow.
  • Taken together, this means that the donor government funding pie, which accounts for more than a third of all global HIV resources, is not growing. Rather, funding has fluctuated for several years, with year-to-year changes largely due to the normal ebb and flow of payment timing and Global Fund pledging periods, but not increasing government commitments to HIV; in fact, current levels are below the high-water mark reached almost a decade ago (US$8.6 billion in 2014). As donor governments continue to face budgetary pressures ranging from ongoing inflation as well the economic impacts associated with the war in Ukraine, increased funding for HIV moving forward is uncertain.6  While donor pledges for the Global Fund’s 2023-2025 replenishment period reached their highest level to date, indicating that increased resources may be available in the future, this will be dependent on donor fulfillment of their pledges amid these ongoing constraints. More broadly, UNAIDS reports that funding for the global HIV response from all sources declined in the last year, driven by decreased funding from domestic governments who are facing significant economic pressures, making the gap between available resources and projected need even greater.7 

Report

Introduction

This report provides the latest data on donor government resources available to address HIV in low- and middle-income countries, reporting on disbursements made in 2022. It is part of a collaborative tracking effort between UNAIDS and KFF that began almost 20 years ago, just as new global initiatives were being launched to address the epidemic. The analysis includes data from all 31 members of the Organisation for Economic Co-operation and Development (OECD)’s Development Assistance Committee (DAC), as well as non-DAC members who report data to the DAC. Data are collected directly from donor governments, UNAIDS, the Global Fund, and UNITAID, and supplemented with data from the DAC. Of the 31 DAC members, 14 provide 99% of total disbursements and individual-level data are provided for each. For the remaining 17 DAC members, data are provided in aggregate. Both bilateral and multilateral assistance are included (see methodology for more detail).

Findings

Total Funding

In 2022, donor government funding for HIV through bilateral and multilateral channels totaled US$8.2 billion in current USD, an increase of more than US$700 million compared to 2021 (US$7.5 billion) (See Figure 1 and Table 1).8  However, this increase was largely due to the timing of disbursements, particularly for the U.S. (see below), and was not an actual increase in commitments. Total funding in 2022 was essentially a return to prior year levels following a significant decline in 2021, which was similarly due to the timing of disbursements.9 

HIV Funding from Donor Governments, 2002-2022
Donor Government Funding for HIV (bilateral & multilateral), 2011-2022 (current USD in millions)

In 2022, donor governments accounted for approximately 37% of the US$22.4 billion estimated by UNAIDS to be available to address HIV (the total is US$20.8 billion when measured in 2019 constant USD); domestic resources accounted for 60%, and the remainder was from foundations, other multilateral organizations, and UN agencies.10 ,11 ,12  This amount is well below the US$29.3 billion that UNAIDS estimates will be needed by 2025 in order to reach global goals.13 

The U.S. continued to be the largest donor to HIV efforts, providing US$6.1 billion and accounting for 74% of total donor government funding in 2022.14  The second largest donor was France (US$382 million, 5%), followed by the U.K. (US$376 million, 5%), the European Commission (US$328 million, 4%), and Germany (US$191 million, 2%). In 2022, 90% of total donor government funding for HIV was provided by these five donors.

While most funding from donors is provided bilaterally (68%), largely driven by the U.S. (which provided 87% of its funding through bilateral channels), the majority of donors (eleven – Australia, Canada, European Commission, France, Germany, Ireland, Italy, Japan, Norway, Sweden, and the U.K.) provide a larger share of their resources through multilateral channels (See Figure 2). Over the past decade there has been a significant shift in how donor governments, other than the U.S., direct their funding, falling from 54% provided through bilateral channels in 2011 to only 16% in 2022 (see below).

HIV Funding from Donor Governments by Funding Channel, 2022

Bilateral Disbursements

Bilateral disbursements for HIV from donor governments – that is, funding disbursed by a donor on behalf of a recipient country or region – totaled US$5.6 billion in 2022, an increase of almost US$130 million compared to 2021 (US$5.5 billion). This increase, however, was almost entirely due to the U.S. as bilateral funding from most donor governments either decreased or remained essentially flat in 2022; Denmark and France were the only other donor governments that increased bilateral support (See Figure 3). These trends were the same after accounting for inflation and exchange rate fluctuations except for the U.K., which was flat when measured in currency of origin.

Change in Donor Government Bilateral Funding (2021-2022)

While U.S. bilateral disbursements increased by more than US$200 million in 2022 (US$5.3 billion) compared to 2021 (US$5.1 billion) (See Figure 4), the change was due to the timing of disbursements of prior year funding and was not an actual increase in commitments. In fact, bilateral HIV funding as specified by the U.S. Congress in annual appropriations has been flat for several years.

HIV Funding from the United States, 2011-2022

When the U.S. increase is removed, bilateral funding from all other donor governments decreased by almost US$90 million in 2022 continuing a more than decade-long trend of declining bilateral support. Since 2011, funding from donor governments, other than the U.S., has decreased by almost US$1.4 billion (80%), declines which have not been fully offset by increases in multilateral contributions (See Figure 5 and “Multilateral Contributions” below). As a result, the U.S., which has historically provided the majority of bilateral resources from donor governments, has accounted for an increasing share, rising from 70% in 2011 to 94% in 2022.

HIV Funding from Donor Governments, Other than the United States, 2011-2022

Multilateral Contributions

Multilateral contributions from donor governments to the Global Fund, UNITAID, and UNAIDS for HIV – funding disbursed by donor governments to these organizations which in turn use some (Global Fund and UNITAID) or all (UNAIDS) of that funding for HIV – totaled US$2.6 billion in 2022 (after adjusting for an HIV share to account for the fact that the Global Fund and UNITAID address other diseases).15  Funding was US$2.4 billion for the Global Fund, US$58 million for UNITAID, and US$160 million for UNAIDS.

Donor government contributions to multilateral organizations increased by almost US$600 million in 2022 (US$2.6 billion) compared to the 2021 level (US$2.0 billion), largely due to the timing of contributions to the Global Fund by the U.S., France, and the European Commission. Timing of U.S. contributions to the Global Fund are based in large part on the amount of funding received from other donors, as the U.S. is required by law not to exceed 33% of total contributions to the Global Fund from all donors. For many of the other donor governments, Global Fund contributions tend to fluctuate over the Global Fund’s three-year pledge periods, with some donors providing significant contributions at the beginning of the period, resulting in declines in subsequent years, while others choose to fulfill pledges towards the end of the pledge period, resulting in what appears to be significant increases. For example, in 2022, the European Commission provided a large portion of its pledge for the Global Fund’s 2023-2025 replenishment period. Conversely, the increase in 2022 by France was towards fulfillment of its pledge for the 2020-2022 replenishment period as it provided smaller contributions in the preceding years.

Fair Share

We looked at several different measures for assessing the relative contributions of donor governments, or “fair share”, to HIV. These include: rank by share of total donor government disbursements for HIV; rank by share of total resources available for HIV compared to share of the global economy; and rank by funding for HIV per US$1 million GDP. As shown in Table 2, each measure yields varying results, though the U.S. ranks #1 across all three:

  • Rank by share of total donor government funding for HIV: By this measure, the U.S. ranked first in 2021, followed by France, the U.K., European Commission, and Germany. The U.S. has consistently ranked #1 in absolute funding amounts.
  • Rank by share of total resources available for HIV compared to share of the global economy (as measured by GDP): This measure compares donor government shares of total resources estimated to be available for HIV in 2022 ($22.4 billion) to their share of the global By this measure, only one country, the U.S., provided a greater share of total HIV resources than its share of total GDP (Figure 6).
  • Rank by funding for HIV per US$1 million GDP: Another way of looking at the relationship between HIV donor funding and GDP is to standardize donor government disbursements by the size of donor economies (GDP per US$1 million). This also puts the U.S. on top, followed by the Netherlands, France, and Sweden. (Figure 7)
Assessing Fair Share Across Donors, 2022
Donor Government Share of Resources Available for HIV Compared to Share of GDP, 2022
Donor Government Ranking by Funding for HIV per US$1 Million GDP, 2022

Looking Forward

As this report finds, the donor government funding pie, which accounts for more than a third of all global HIV resources annually to low- and middle-income countries, has not been growing; rather, funding has fluctuated for several years, with year-to-year changes largely due to the normal ebb and flow of payment timing and Global Fund pledging periods. In fact, current levels are below the high-water mark of almost a decade ago due to decreasing bilateral support from donor governments other than the U.S. As a result of these trends, five donor governments (U.S., France, U.K., Germany, and European Commission) now account for 90% of total donor government funding.  Moreover, while there has been significant progress in addressing the HIV epidemic —there were 1.3 million new infections in 2022, down from approximately 2 million a decade ago, and almost half as many AIDS-related deaths—new infections and AIDS-related deaths are on the rise in some regions, including in Eastern Europe and Central Asia and the Middle East and North Africa. Further, more than 9 million people living with HIV still lack access to antiretroviral therapy.16 

Looking ahead, if these trends continue, the financing outlook for 2023 and beyond will likely be dependent on fulfillment of pledges to the Global Fund for the 2023-2025 replenishment period, which was the highest ever and included significant increases from many donors. Notably, for the first time in many years, the U.S. increased its Global Fund pledged commitment to $6 billion over 3 years ($2 billion/year), or a more than $400 million increase per year. This resulted in a $2 billion appropriation by the U.S. Congress for the Global Fund in 2023. However, the extent to which this full amount can be provided will depend on funding from other donors, as the U.S. is required by law not to exceed 33% of total contributions to the Global Fund from all sources. As such, future U.S. funding commitments to the Global Fund could be reduced. These trends and questions moving forward, combined with continued stresses on domestic government budgets, create an uncertain future.

Methodology

This project represents a collaboration between the Joint United Nations Programme on HIV/AIDS (UNAIDS) and KFF. Data provided in this report were collected and analyzed by UNAIDS and the KFF.

Bilateral and multilateral data on donor government assistance for HIV in low- and middle-income countries were collected from multiple sources for the 31 members of the OECD Development Assistance Committee (DAC). Data are collected directly from donor governments, UNAIDS, the Global Fund, and UNITAID, and supplemented with data from the DAC. The research team solicited bilateral assistance data directly, from the governments of Australia, Canada, Denmark, France, Germany, Ireland, Japan, the Netherlands, Norway, Sweden, the United Kingdom, and the United States during the first half of 2023, representing the fiscal year 2022 period.17 ,18 ,19  Direct data collection from these donors was desirable because the latest official statistics on international HIV specific assistance – from the Organisation for Economic Co-operation and Development (OECD) Creditor Reporting System (CRS) (see: http://www.oecd.org/dac/stats/data) – are from 2021 and do not include all forms of international assistance (e.g., certain funding streams provided by donors, such as HIV components of mixed-purpose grants to non-governmental organizations).

Where donor governments were members of the European Union (EU), the research team ensured that no double-counting of funds occurred between EU Member State reported amounts and European Commission (EC) reported amounts for international HIV assistance. Figures obtained directly using this approach should be considered as the upper bound estimation of financial flows in support of HIV-related activities.

Data for all other member governments of the OECD DAC – Austria, Belgium, the Czech Republic, the European Commission, Finland, Greece, Hungary, Iceland, Italy, Korea, Luxembourg, New Zealand, Poland, Portugal, the Slovak Republic, Slovenia, Spain, Switzerland – were obtained from the OECD CRS database and UNAIDS records of core contributions. The CRS data are from calendar year 2021, and therefore, do not necessarily reflect 2022 calendar year amounts. However, collectively, these governments have accounted for less than 5 percent of bilateral disbursements in each of the past several years. UNAIDS core contributions reflect 2022 amounts.

Data included in this report represent funding assistance for HIV prevention, care, treatment and support activities, but do not include funding for international HIV research conducted in donor countries (which is not considered in estimates of resource needs for service delivery of HIV-related activities).

Bilateral funding is defined as any earmarked (HIV-designated) amount, including earmarked non-core (“multi-bi”) contributions to multilateral organizations, such as UNAIDS. Reflecting deliberate strategies of integrating HIV activities into other activity sectors, some donors use policy markers to attribute portions of mixed-purpose projects to HIV. This is done, for example, by the Netherlands and the U.K. The bilateral figures submitted by the UK Foreign, Commonwealth & Development Office (FCDO) for the financial year 2022/23 are based on an existing FCDO ‘HIV policy marker’. Ireland and Denmark also attribute percentages of multipurpose projects to HIV. Canada breaks its mixed-purpose projects into components by percentage. Germany, Norway, and Sweden provided data much more conservatively, consistent with DAC constructs and purpose codes. Apart from targeted HIV/AIDS programs, bilateral health programs mainly focusing on health systems strengthening are also designed to contribute to the HIV response in partner countries. Global Fund contributions from all governments correspond to amounts received by the Fund during the 2022 calendar year, regardless of which contributor’s fiscal year such disbursements pertain to. Data from the U.K., Canada, Australia, Denmark, France, Norway, and Germany should be considered preliminary estimates.

Bilateral assistance data were collected for disbursements. A disbursement is the actual release of funds to, or the purchase of goods or services for, a recipient. Disbursements in any given year may include disbursements of funds committed in prior years and in some cases, not all funds committed during a government fiscal year are disbursed in that year. In addition, a disbursement by a government does not necessarily mean that the funds were provided to a country or other intended end-user.

Included in multilateral funding were core contributions to UNAIDS, as well as contributions to the Global Fund (see: http://www.theglobalfund.org/en/) and UNITAID (see: http://www.unitaid.org/#end). All Global Fund contributions were adjusted to represent 52% of the donor’s core contribution, reflecting the Fund’s reported grant approvals for HIV-related projects to date and includes HIV/TB. UNITAID contributions were adjusted to represent 46% of the donor’s core contribution, reflecting UNITAID’s reported attribution for HIV-related projects.

In addition to contributions supporting the Global Fund’s and UNITAID’s core activities, some donor governments provided significant funding to these multilateral organizations for COVID-related efforts. These COVID-specific contributions were not included in totals for the purposes of this report. The U.S., for example, provided almost $1.9 billion in such funding to the Global Fund during 2022.

Other than contributions provided by governments to the Global Fund and UNITAID, un-earmarked general contributions to United Nations entities, most of which are membership contributions set by treaty or other formal agreement (e.g., the World Bank’s International Development Association or United Nations country membership assessments), are not identified as part of a donor government’s HIV assistance even if the multilateral organization in turn directs some of these funds to HIV. Rather, these would be considered as HIV funding provided by the multilateral organization, as in the case of the World Bank’s efforts, and are not considered for purposes of this report.

Bilateral data collected directly from the Australian, Canadian, Japanese, U.K., and U.S. governments reflect the fiscal year (FY) period as defined by the donor, which varies by country. The U.S. fiscal year runs from October 1-September 30. The fiscal years for Canada, Japan, and the U.K. are April 1-March 31. The Australian fiscal year runs from July 1-June 30. The European Commission, Denmark, France, Germany, Italy, Ireland, the Netherlands, Norway, and Sweden use the calendar year. The OECD uses the calendar year, so data collected from the CRS for other donor governments reflect January 1-December 31. Most UN agencies use the calendar year and their budgets are biennial. The Global Fund’s fiscal year is also the calendar year.

All data are expressed in current US dollars (USD), unless otherwise noted. Where data were provided by governments in their currencies, they were adjusted by average daily exchange rates to obtain a USD equivalent, based on foreign exchange rate historical data available from the U.S. Federal Reserve (see: http://www.federalreserve.gov/) or the OECD. Data obtained from UNITAID were already adjusted to represent a USD equivalent based on date of receipts. Data on gross domestic product (GDP) were obtained from the International Monetary Fund’s World Economic Outlook Database and represent current price data for 2022 (see: https://www.imf.org/en/Publications/WEO/weo-database/2023/April).

Appendix

See here.

Donor Government Funding for HIV (current USD in millions), 2021 & 2022

Endnotes

  1. UNAIDS, “Global AIDS Update Report”, July 2023. ↩︎
  2. In 2022, some donor governments provided COVID-specific emergency contributions to the Global Fund and UNITAID in addition to their contributions for core activities. Specifically, Canada, France, Germany, and Japan provided COVID-specific funding to UNITAID, while the European Commission, Germany, the Netherlands, New Zealand, Portugal, the U.K., and the U.S. provided COVID-specific funding to the Global Fund. For the purposes of this report, these COVID-specific amounts have been excluded as they cannot be attributed to a specific area, such as HIV. ↩︎
  3. Donor government contributions to the Global Fund and UNITAID have been adjusted for an HIV-share to account for the fact that these multilateral organizations address other diseases and areas (see Methodology). ↩︎
  4. U.S. totals represent funding amounts provided through regular appropriations only. In 2021, the U.S. Congress appropriated additional emergency supplemental funding for bilateral HIV activities and for the Global Fund to address the impacts of the COVID-19 pandemic. These emergency supplemental funding amounts are not included in overall U.S. totals. ↩︎
  5. In addition to the $5.5 billion disbursed for HIV in 2021 (provided through regular appropriations for bilateral programs as well as the HIV-adjusted share of contributions to the Global Fund and UNAIDS), the U.S. disbursed an additional $4.3 million for bilateral HIV activities from emergency supplemental funding that was provided in response to the COVID-19 pandemic through the “American Rescue Plan Act of 2021” (see KFF analysis of “Global Funding Across U.S. COVID-19 Supplemental Funding Bills”). ↩︎
  6. Per direct communication with Swedish International Development Cooperation Agency (SIDA): “Swedish SRHR aid fell by 16% in between 2021 and 2022. This was the result of a reprioritization in the state budget following Russia’s invasion of Ukraine.” ↩︎
  7. UNAIDS, “Global AIDS Update Report”, July 2023. ↩︎
  8. Donor government disbursements are a subset of overall international assistance for HIV in low-and-middle-income countries, which also includes funding provided by other multilateral institutions, UN agencies, and foundations. ↩︎
  9. KFF & UNAIDS, “Donor Government Funding for HIV in Low- and Middle-Income Countries in 2022”, July 2022. ↩︎
  10. UNAIDS, “Global AIDS Update Report”, July 2023. ↩︎
  11. UNAIDS estimates that US$20.8 billion was available for HIV from all sources (domestic resources, donor governments, multilaterals, and philanthropic organizations) in 2022, expressed in 2019 USD. For purposes of this analysis, this estimate was converted to 2022 USD, or $22.4 billion. In addition, while the amounts presented in this analysis include donor contributions to multilateral organizations, the UNAIDS estimate of total available resources for HIV includes the actual disbursements made by multilateral organizations in 2021 rather than the donor government contributions to these entities. ↩︎
  12. The donor share of total available resources includes bilateral disbursements as well as an adjusted share of Global Fund and UNITAID disbursements (the donor government share of contributions to each of the multilaterals in 2021 is applied to the disbursements from these multilaterals for the same year). ↩︎
  13. The UNAIDS resource needs estimate is expressed in 2019 USD. ↩︎
  14. In addition to the $5.5 billion disbursed for HIV in 2021 (provided through regular appropriations for bilateral programs as well as the HIV-adjusted share of contributions to the Global Fund and UNAIDS), the U.S. disbursed an additional $4.3 million for bilateral HIV activities from emergency supplemental funding that was provided in response to the COVID-19 pandemic through the “American Rescue Plan Act of 2021” (see KFF analysis of “Global Funding Across U.S. COVID-19 Supplemental Funding Bills”). ↩︎
  15. In 2022, 54% of the Global Fund’s disbursements and 46% of UNITAID’s disbursements were directed to HIV activities. These percentages were applied to the full donor government contributions to these multilateral organizations to calculate the “HIV-share” (see Methodology for additional details). ↩︎
  16. UNAIDS, “Global AIDS Update Report”, July 2023. ↩︎
  17. Per direct communication with the German Agency for International Cooperation (GIZ): “In general, Germany supports systemic approaches such as the One Health approach and health systems strengthening through both multilateral and bilateral engagement. In addition to supporting a smaller number of projects that address individual diseases, Germany takes a horizontal, systemic approach by supporting health systems strengthening in general. Efficient health systems are a prerequisite for realizing the human right to the ‘highest attainable standard of physical and mental health.’ Strengthening health systems is therefore the overarching approach to the strategy of German development cooperation in the health sector and is prioritized over funding activities that address individual diseases.” ↩︎
  18. Per direct communication with Ireland Department of Foreign Affairs: “The data for 2022, which shows a decrease against 2021 expenditure, is a result of a revised assessment methodology of estimated HIV/AIDS expenditure.” ↩︎
  19. Per direct communication with the U.K. Foreign, Commonwealth & Development Office (FCDO): “The FCDO Annual Report and Accounts 2021 to 2022 explained that the department’s ODA spending plans needed to be revisited to ensure all ODA-eligible spending was managed within 0.5% of GNI. This was in the context of the significant and unexpected costs incurred to support the people of Ukraine and Afghanistan escape oppression and conflict and find refuge in the UK, alongside wider migration pressures. We remain committed to protecting the most vulnerable and returning to spending 0.7% of GNI on ODA as soon as the fiscal situation allows.  The FCDO’s latest estimate of its ODA spending for 2022-23 is £7,572m. The FCDO’s indicative ODA budget for 2023-24 is £8,095m. FCDO ODA allocations for these years are set out in the Minister for Development’s 30 March Written Ministerial Statement.” ↩︎
News Release

New KFF Analysis Examines Rapidly Evolving Federal Policies For Substance Use Disorder Treatment for the Opioid Epidemic  

Published: Jul 11, 2023

A new KFF analysis finds that 24 percent more buprenorphine, a medication to treat opioid use disorder, was dispensed in 2022 than in 2019, the year before the pandemic brought a surge of opioid overdose deaths – and a focus on how to expand access and treatment.

This upward trend in buprenorphine distribution, already in motion before the pandemic, continued throughout the COVID public health crisis, suggesting continued improvements in access to treatment even as the pandemic raised other barriers to health care. However, it is unclear whether these steps to improve access to buprenorphine are reaching people with high needs, including communities of color.

KFF examined five key federal policies governing substance use disorder treatment, the changes they have undergone during the pandemic, and the implications for access and treatment for opioid use disorder. Data show a steep increase in opioid overdose deaths during the pandemic, primarily driven by the synthetic opioid fentanyl. From 2016 to 2021, opioid overdose deaths nearly doubled, from 42,249 to 80,411. The increase has been particularly high among people of color and young people.

The key findings include:

  • Policy changes during the pandemic increased access to care by making it possible to initiate buprenorphine treatment via telehealth, without an in-person visit. Although federal officials have considered ending that flexibility, it has been extended temporarily in response to public concerns over the likely impact on access to treatment.
  • Late last year, federal legislation removed the additional barriers to buprenorphine prescribing for OUD treatment, the so-called X-waiver, opening the doors to a substantial increase in authorized providers. But research indicates that many prescribers still may not prescribe buprenorphine and substantial disparities in access to treatment may remain.
  • A temporary pandemic-era policy has allowed opioid treatment programs to provide some patients with up to 28 days of take-home doses of methadone, a change that may become permanent under a proposed rule. This shift was designed to ease the burden for patients and increase access to treatment for those living farther from treatment centers.
  • Recent Food and Drug Administration approval of over-the-counter naloxone – a nasal spray to reverse opioid overdose – allows the life-saving drug to be purchased without a prescription, though its roughly $50 price may remain a barrier. Accessibility of fentanyl test strips, which can help users determine if drugs have been mixed with fentanyl, remains limited, though federal funds can now be used to pay for them under certain grant programs.
  • As of June 2023, 14 states have submitted Section 1115 waivers seeking exemption from federal law that prohibits the use of federal Medicaid dollars for health care services for inmates, including opioid use disorder treatment. Nearly two-thirds of prison inmates have a substance use disorder, and their risk of opioid overdose after being released is 10 times higher compared to the general public.

Though new and proposed federal policies have the potential to increase access to care, ongoing challenges, such as behavioral health workforce shortages, low prescribing of buprenorphine by providers, and treatment gaps by race/ethnicity, could limit the effectiveness of new federal strategies.

For more data and analyses about the opioid epidemic, visit kff.org.

Related Resources:

Addressing the Opioid Crisis: A Look at the Evolving Landscape of Federal OUD Treatment Policies

Published: Jul 11, 2023

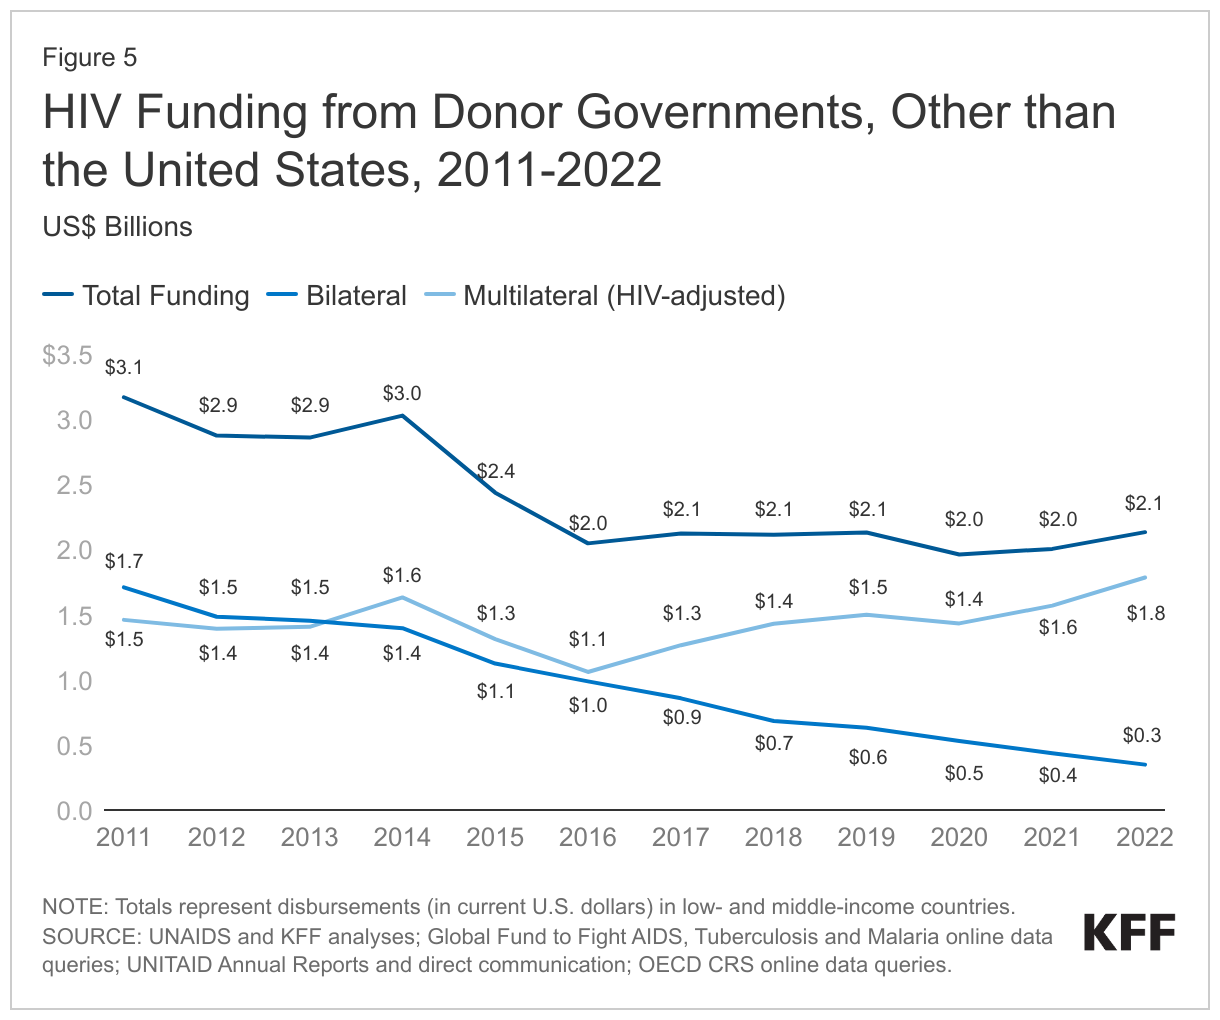
Opioid overdose deaths, primarily driven by fentanyl, have surged during the pandemic, exposing significant gaps in access to and availability of treatment. From 2016 to 2021, opioid overdose deaths nearly doubled, from 42,249 to 80,411. By 2021, these deaths accounted for 75% of all fatal drug overdoses, up from 66% in 2016. Rises in overdose deaths have been particularly sharp among people of color and young people. Policy efforts have focused on enhancing access to medications for Opioid Use Disorder (OUD) treatment, which can substantially reduce overdose and mortality rates. Yet, approximately 75% of people with OUD do not receive the recommended treatment, and treatment rates are generally lower among people of color and adolescents.

Currently, three medications are approved for OUD treatment: methadone, buprenorphine, and naltrexone. Buprenorphine and methadone, both controlled substances, have unique administration requirements. Buprenorphine can be prescribed and picked up from a pharmacy, while methadone must be dispensed through licensed opioid treatment programs.

Federal policies governing substance use disorder treatment have undergone rapid changes during the pandemic; however, the extent to which these changes can address the surge in opioid overdose deaths is unclear. Some of these policy adjustments are permanent, while others could revert to pre-pandemic regulations. In this brief, we examine the following 5 key federal policies and implications for access and treatment for OUD:

  • Access to buprenorphine medication via telehealth
  • Changes to dispensing methadone
  • Changes to provider regulations for the prescribing of buprenorphine
  • Changes in access to opioid overdose prevention and reversal methods
  • Guidance to leverage Medicaid for pre- and post-release from prison access to OUD treatment services

1. Access to Buprenorphine Medication via Telehealth

In response to the pandemic, it became possible to initiate buprenorphine treatment via telehealth without the necessity of an in-person visit, resulting in a shift in access. This modification was largely due to the temporary relaxation of provisions within the Ryan Haight Act of 2008. Ordinarily, this act mandates an in-person visit prior to the prescription of controlled substances, although exceptions are permitted during a Public Health Emergency (PHE). Given the PHE declaration, the Drug Enforcement Administration (DEA) was able to suspend in-person visit requirements, thereby improving treatment accessibility to prescriptions for controlled substances like buprenorphine over telehealth.

The DEA temporarily extended pandemic-era telehealth flexibility in response to public feedback and concerns over OUD treatment access. Initially, the DEA proposed two rules which would reinstate many aspects of the pre-pandemic telehealth regulations, including generally requiring an initial in-person visit for some controlled substance prescriptions, with some exceptions. One of the proposals included a modification for buprenorphine, requiring an in-person consultation with a provider within 30 days of prescription. However, the proposed rules were met with resistance, including concerns about potential disruptions in treatment access. In response, the DEA and Substance Abuse and Mental Health Services Administration (SAMHSA) opted to temporarily continue the flexible telehealth policies established during the pandemic, an interim decision that allows the DEA time to balance the potential effects of the proposed regulations on healthcare accessibility against its concerns about diversion.

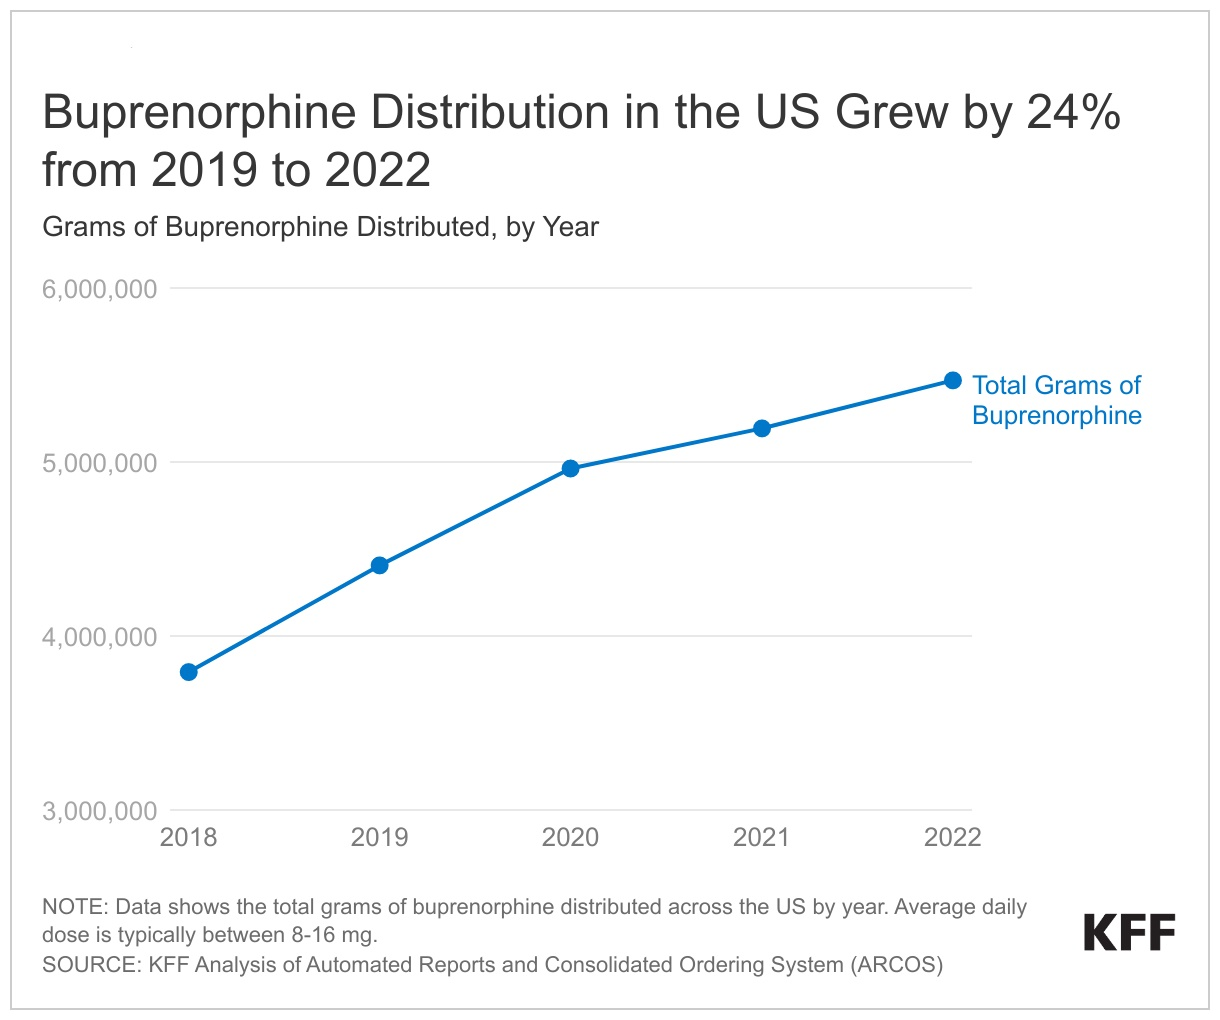
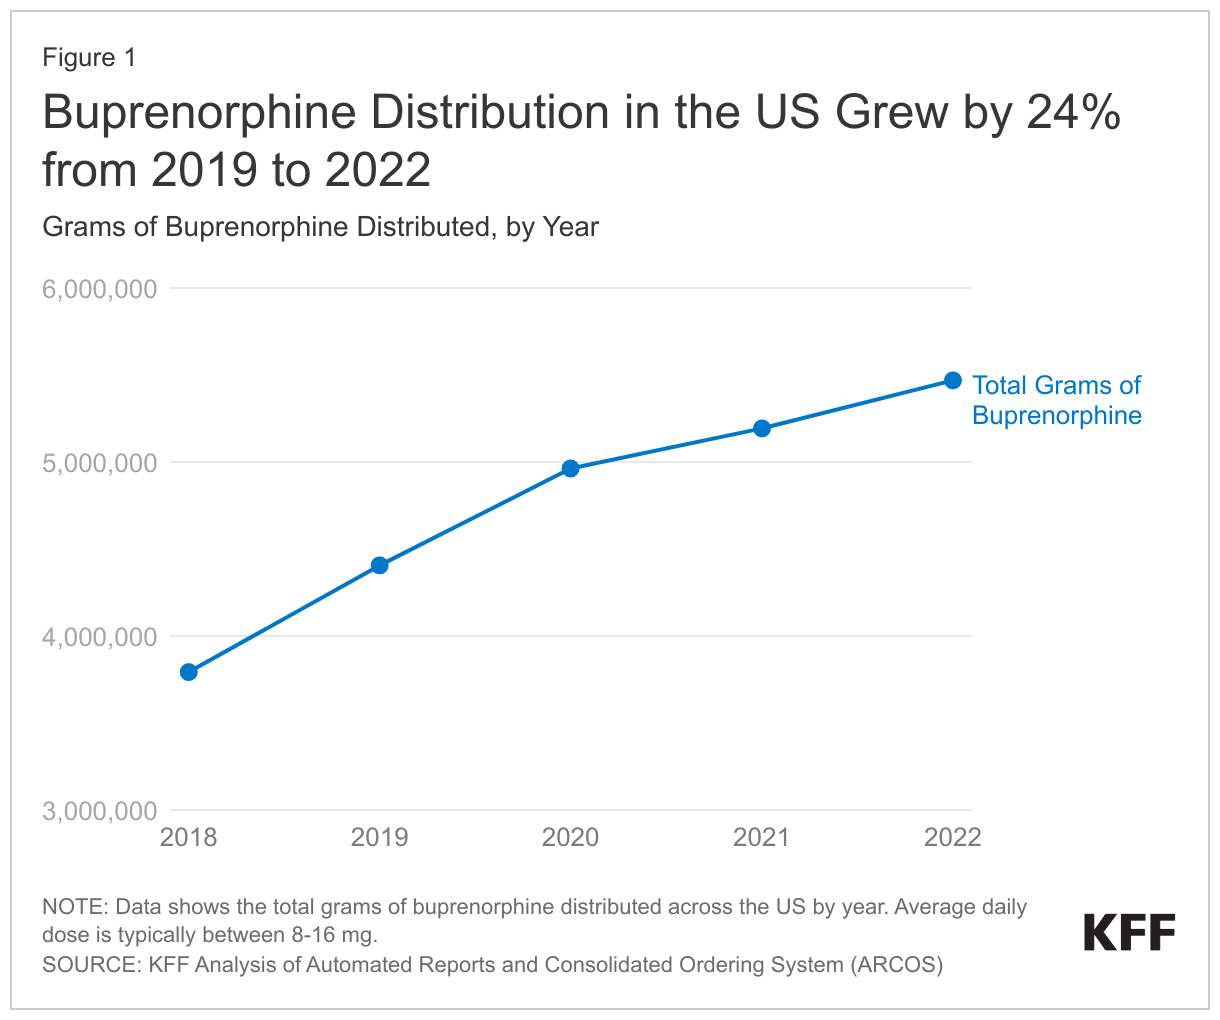
In 2022, buprenorphine dispensing grew by 24% compared to pre-pandemic levels in 2019 but it is unclear whether steps to improve access to buprenorphine are reaching people of color (Figure 1). This upward trend, already in motion before the pandemic due to various policies and/or increases in underlying treatment demand, continued through the pandemic, despite other pandemic-related barriers that resulted in declining health care utilization. Preliminary studies show that telehealth boosted access and retention in care without raising the risk of buprenorphine-related overdoses. Despite these access improvements, it is unclear whether buprenorphine access has improved among communities of color. Prior to the pandemic, research found that compared to White people, Black and Hispanic people have limited access to buprenorphine. The uptake of medication-assisted treatment services has also remained low among American Indian and Alaska Native (AIAN) people. AIAN and Black communities experienced the highest rates of opioid overdose deaths in 2021 (38.7 and 33.5 per 100,000, respectively) compared to all other racial and ethnic groups. Separately, although telehealth may improve treatment accessibility, barriers remain for many individuals, including limited access to broadband, digital literacy issues, and affordability.

Buprenorphine Distribution in the US Grows by 24% from 2019 to 2022

2. Changes to Dispensing Methadone

Methadone dispensing for opioid use disorder treatment is tightly regulated and can only occur through federally and state regulated facilities known as Opioid Treatment Programs (OTPs). However, only 5% of zip code tabulation areas have an OTP, potentially limiting their reach. Further, traditionally, methadone was dispensed on-site at OTPs, requiring patients to make daily clinic visits that posed challenges for their work and childcare responsibilities. Consequently, individuals who live far from an OTP or faced other obstacles may be unable to access this treatment option, despite the potential benefits of methadone treatment.

During the pandemic, a temporary policy allowed OTPs to provide some patients with up to 28 days of take-home doses of methadone, a change that may become permanent under a proposed rule. Research suggests this shift eased the burden for patients and may have increased access to treatment for those living farther from OTPs. Though there were increases in methadone-related overdoses during the pandemic, they coincided with overall increases in overdoses, making it unclear whether pandemic-era policy changes contributed to this trend. A recent study found that methadone-related overdose deaths have decreased among Black and Hispanic men since 2020, suggesting that the policy shift has benefited certain populations. SAMHSA has proposed a rule to make these extended take-home flexibilities permanent. While SAMHSA considers feedback and evaluates the pros and cons, the COVID-era policies will remain in effect until a year after the public health emergency concludes or the final rule is published.

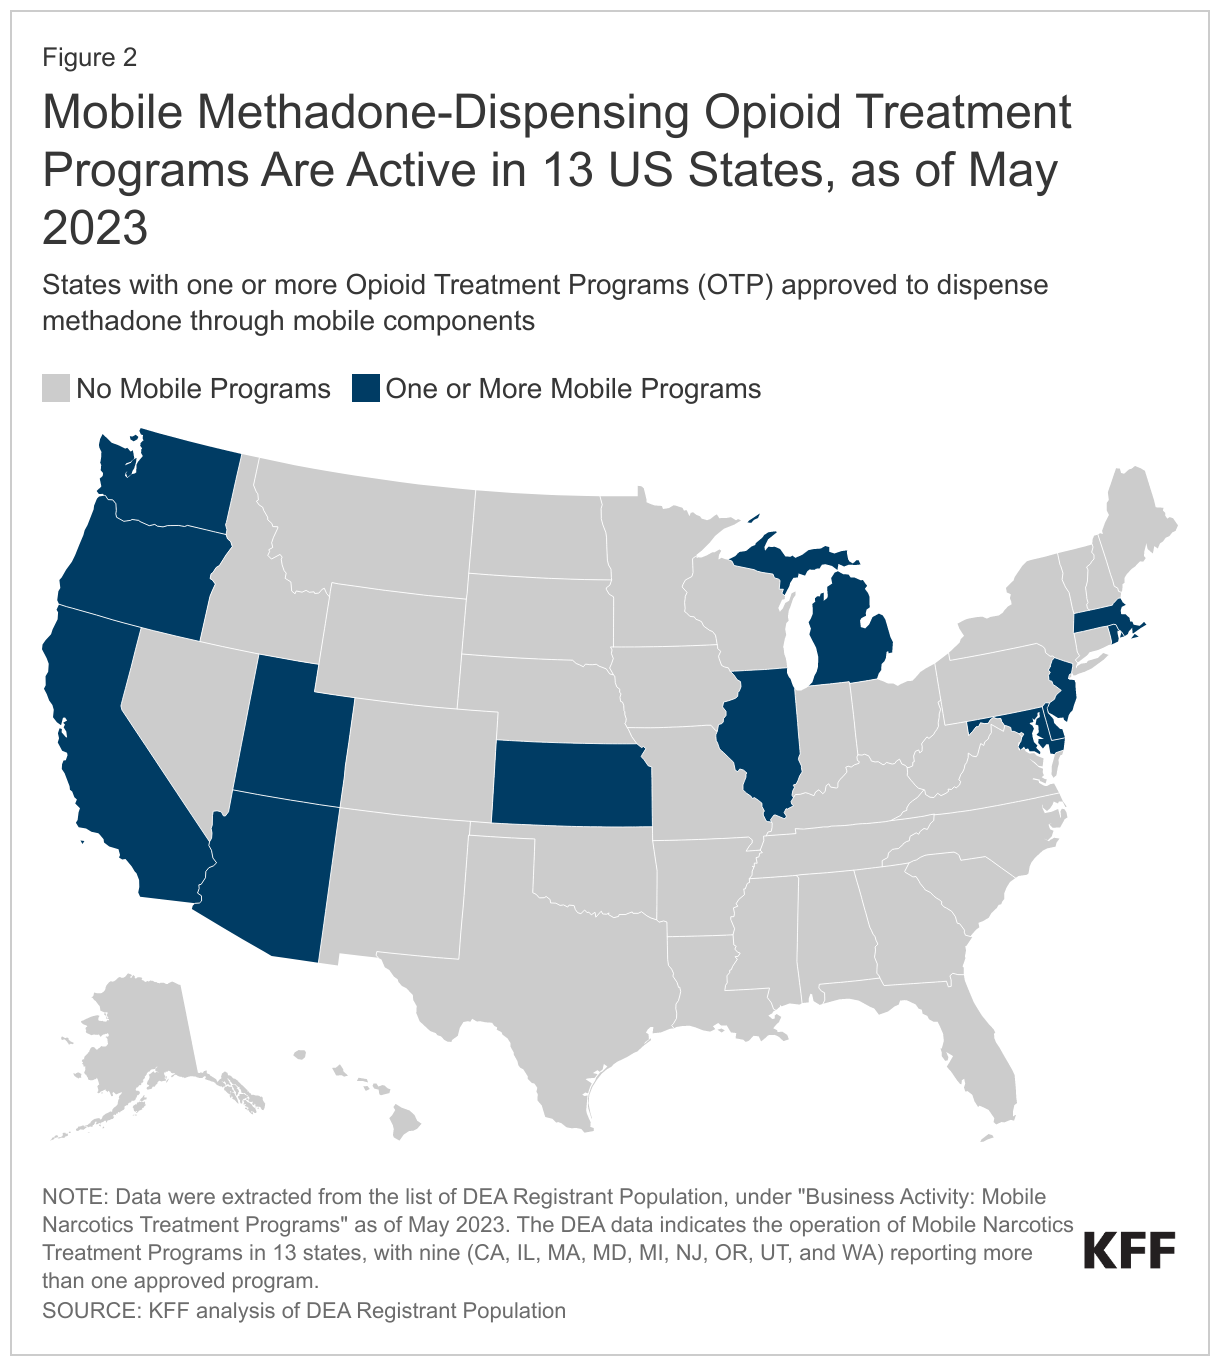
A DEA rule finalized in 2021 authorizes OTPs to add mobile components to expand their reach—but so far uptake has been limited. These mobile units operate as extensions of accredited OTPs and are designed to provide methadone treatments to areas where it’s needed most. Despite the potential benefits, the adoption of this initiative has been somewhat limited with 27 mobile treatment programs registered across 13 states. These mobile treatment components aim to mitigate transportation or other logistical challenges by bringing the treatment directly to those in need. They can travel to rural regions or areas experiencing high rates of overdoses to administer methadone, buprenorphine, or other treatments for opioid use disorders. DEA regulations require these mobile units to return to their associated OTP at the end of each day. Although these mobile components are not required to undergo a separate DEA registration process, they must secure approval from the DEA before commencing operations. OTP decisions about whether to expand through mobile components may also be influenced by implementation costs or state regulations. For example, some states place strict requirements on dosing or require that all patients have a government ID to access OTP treatment.

Mobile Methadone-Dispensing Opioid Treatment Programs Are Active in 13 US States, as of May 2023

3. Changes to Provider Regulations for the Prescribing of Buprenorphine

Recent legislation vastly increases the potential OUD workforce by allowing providers with a DEA registration to prescribe buprenorphine, a key medication used to treat OUD. Previously, providers had to navigate numerous administrative steps and training to obtain an X-waiver, which granted them authorization to prescribe buprenorphine to treat OUD. However, through a series of legislative efforts, these requirements have gradually been reduced over time. Most recently, legislation passed as part of the Consolidated Appropriations Act (CAA) completely eliminated the X-waiver requirement in response to calls for policy change and the ongoing opioid epidemic. As a result, all prescribers with a current DEA registration that includes Schedule III authority can now prescribe buprenorphine for an OUD treatment, in accordance with state laws.

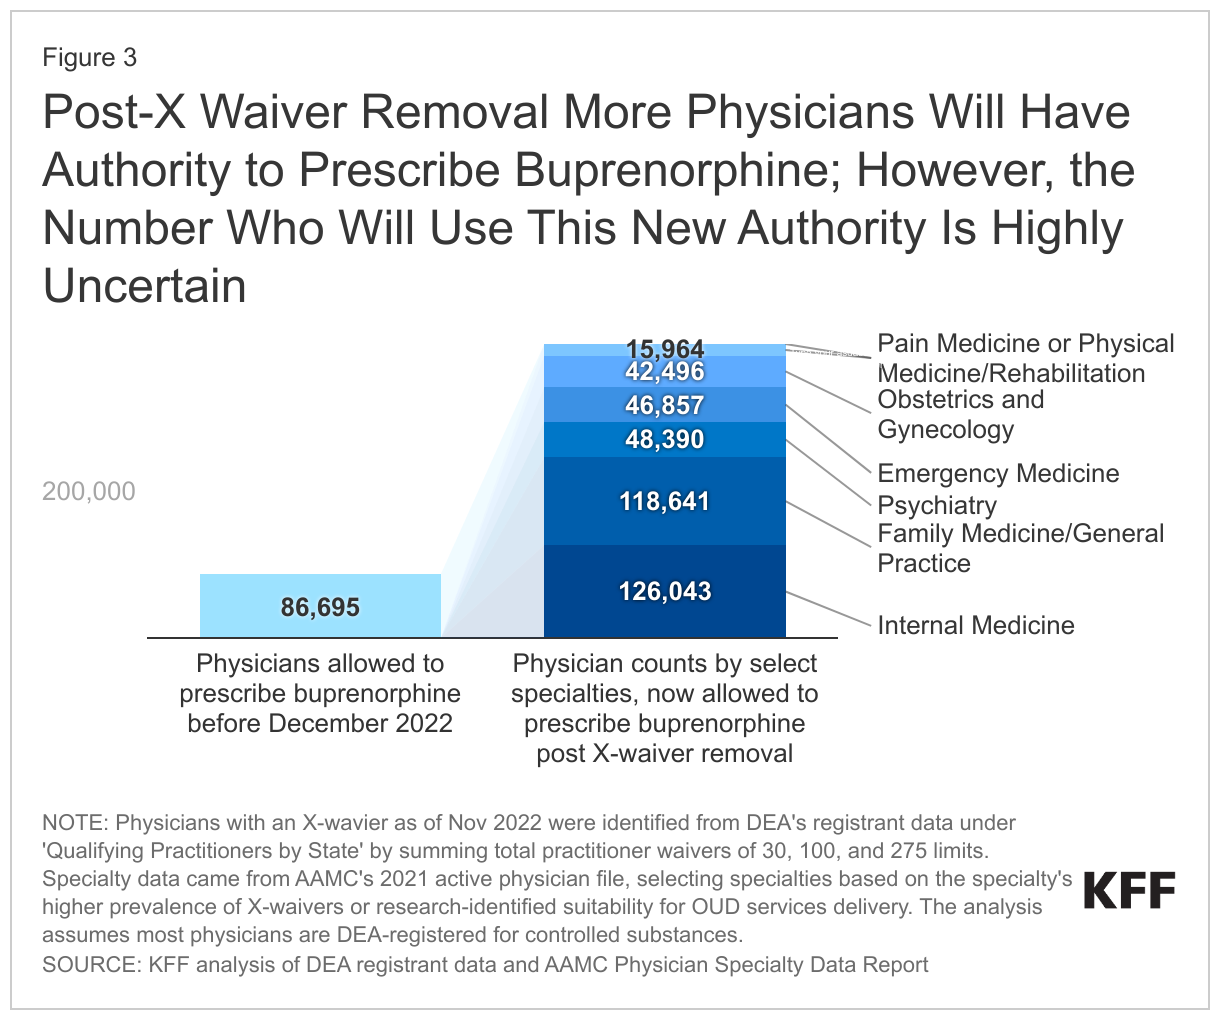
While the removal of the X-waiver increases the number of providers allowed to prescribe buprenorphine without additional administrative steps, it is unclear how many will use the new authority and whether populations with high needs – including communities of color – will be reached. Along with increasing the number of providers authorized to prescribe buprenorphine (figure 3), the removal of the X-waiver also eliminates limits on the number of patients providers were able to treat. However, even among providers who obtained an X-waiver, a substantial share may only prescribe to a handful of patients, if any. There are many reasons behind this, including skepticism about using medication for opioid use disorder treatment, lack of time, insufficient reimbursement rates, perceived scarcity of professional or mental health support, and apprehension over medication diversion or amplified DEA monitoring. While buprenorphine treatment capacity has grown over time, research suggests that even as restrictions for buprenorphine prescribing were relaxed during the pandemic, growth in obtaining X-waivers slowed, particularly among physicians. In recent years, advanced practice nurses have largely contributed to growth in buprenorphine treatment capacity; however, in many states they are restricted by required physician oversight. It may not be possible to increase the number of providers who can prescribe buprenorphine without addressing these issues and other systemic issues, such as inconsistent access to buprenorphine in pharmacies. Research also suggests that increasing OUD treatment prescribers has not addressed longstanding issues of inequitable buprenorphine distribution across racial and ethnic groups. The lack of a diverse mental health care workforce and culturally informed care may further contribute to treatment barriers among communities of color.

Post-X Waiver Removal More Physicians Will Have Authority to Prescribe Buprenorphine; However, the Number Who Will Use This New Authority Is Highly Uncertain

A one-time eight-hour training on SUD treatment and management is required for most DEA-registered providers, which may increase provider knowledge or willingness to treat OUD. Prior research has shown that most providers have received limited training in SUD treatment, which may contribute to hesitation in treating OUD. A study examining state policies related to buprenorphine prescribing found that states with additional training requirements for providers have higher rates of buprenorphine prescribing, suggesting that provider training and education may be linked to increased access to buprenorphine treatment. The CAA included legislation mandating this SUD training for all DEA-registered providers, exempting some with qualifying prior SUD training. This increase in providers who will have SUD training is parallel to the number of prescribers who are newly eligible to prescribe buprenorphine following the elimination of the X-waiver requirement.

4. Changes in Access to Opioid Overdose Prevention and Reversal Methods

Illicit fentanyl, known for its higher potency and increased risk of overdose, has become pervasive in various drug supplies. The primary driver of fatalities is illegally produced fentanyl, which can be lethal to both those who intend to use it and those who consume fentanyl-contaminated products unknowingly. This trend extends to those seeking illicitly manufactured pain pills or drugs like cocaine, putting them at risk of fentanyl-induced overdoses. Consequently, the demand for harm reduction measures such as fentanyl test strips and naloxone has risen. Fentanyl test strips allow people who use drugs to identify trace amounts of fentanyl and naloxone can reverse an opioid overdose. However, these resources can be expensive and challenging to obtain.

The FDA’s recent approval of over-the-counter naloxone–a nasal spray to reverse opioid overdose–allows purchase of this life-saving drug without a prescription. Naloxone is recommended for individuals with opioid use disorder or at increased risk of overdose, including people prescribed high doses of opioids for pain, and their friends/family. Soon, over-the-counter naloxone will be available. However, its roughly $50 price may be unaffordable for many, particularly if insurers do not cover these costs or if the process to receive reimbursement is too complex. Even when naloxone is covered by insurance, out of pocket costs can be a financial barrier that prevents access. Further, some research suggests that compared to White people, Black people have limited access to naloxone.

Federal funds under certain grant programs can now pay for fentanyl test strips, which can help determine if drugs have been mixed with fentanyl and provide users with crucial risk information. However, the accessibility of these test strips remains limited. They can sometimes be obtained from social service organizations and health departments. Yet, challenges around ease of access likely remain, especially if the limited organizations distributing fentanyl test strips enforce quantity limits. Additionally, the legality of fentanyl test strips varies across states. As of April 2022, possession of these test strips is illegal in 25 states due to laws considering them drug paraphernalia. However, some states are working to change these laws.

5. Guidance to Leverage Medicaid for Pre- and Post-Release from Prison Access to OUD Treatment Services

After being released from prison, the risk of overdose and death is notably higher, with opioid overdose being a primary cause of mortality. According to a study conducted in Oregon, the risk of opioid overdose after release is 10 times higher compared to the general public. Further, it is estimated that 65% of inmates have a SUD, which is considerably higher than the general prevalence of 18%. In states that expanded Medicaid, most individuals recently released from prison meet income and eligibility requirements for Medicaid coverage. However, there may be delays in enrollment or difficulty connecting to health services. This can lead to gaps in medication or health care, increased ED utilization, and a worsening of existing health conditions. Federal Medicaid law prohibits federal dollars from paying for health care services of inmates in most cases due to a policy known as the Medicaid Inmate Exclusion Policy.

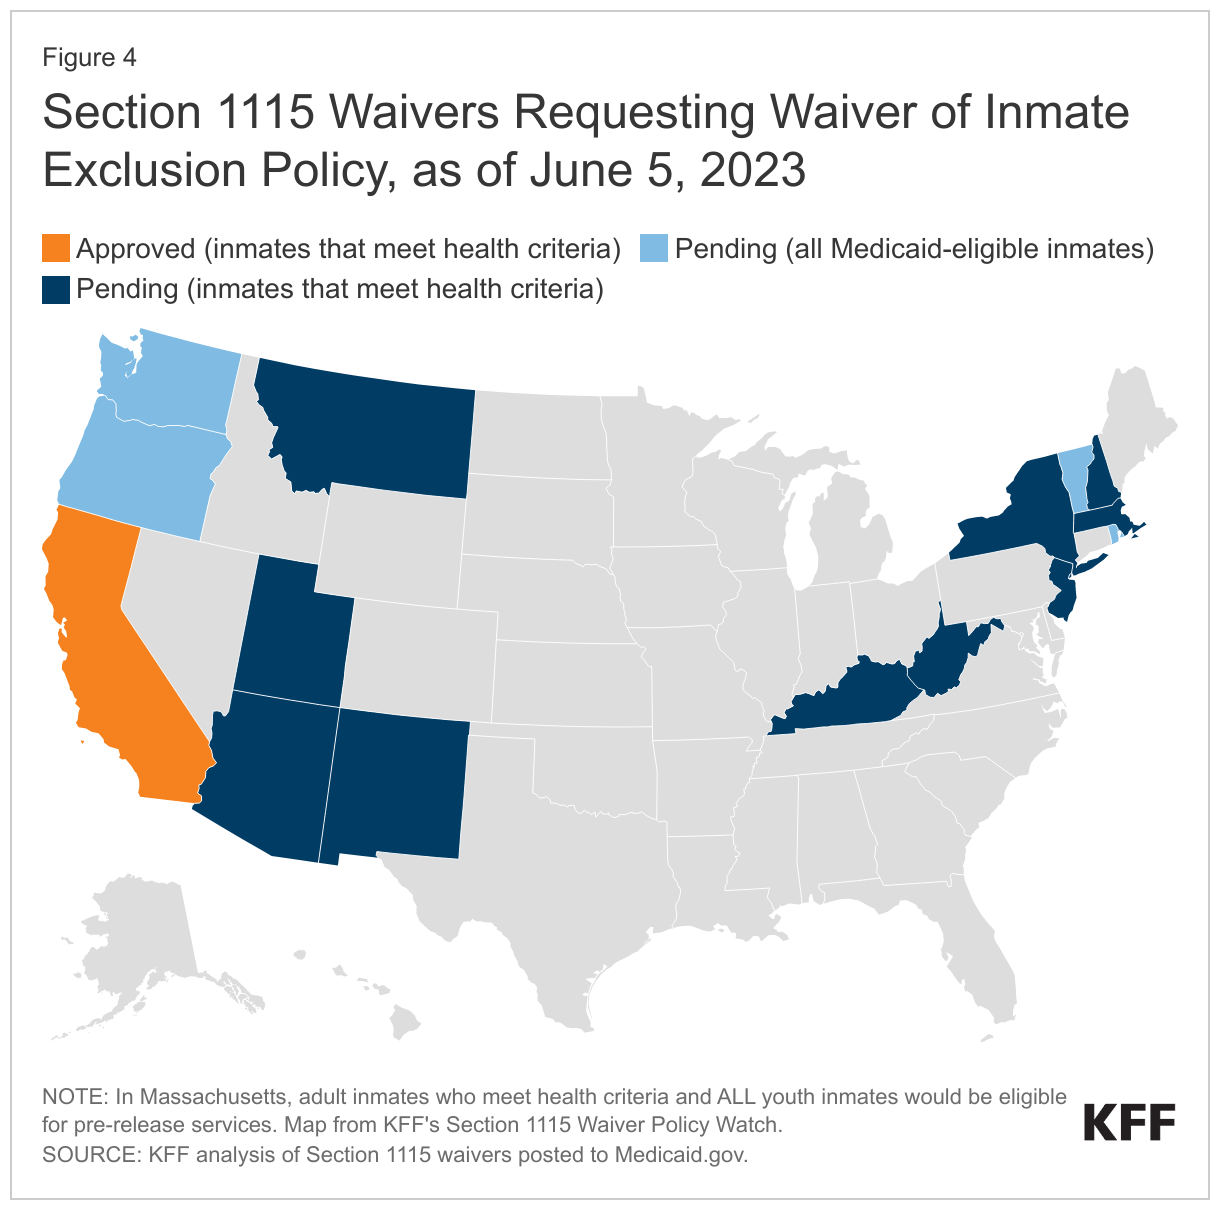
Recent demonstration opportunities under section 1115 allow Medicaid programs to cover pre-release services–including SUD treatment–and transitional supports. States that submit a waiver request for this opportunity must cover medication-assisted treatment, but it is not required to include all three FDA-approved medications for treating OUD —buprenorphine, methadone, and naltrexone. In January 2023, CMS approved California’s Section 1115 request to cover a package of reentry services for certain groups of incarcerated individuals 90 days prior to release, marking the first approval of a partial waiver of the Medicaid inmate exclusion policy.

As of June 2023, 14 states have submitted section 1115 waivers seeking exemption from the inmate exclusion policy (Figure 4). These pending waivers differ in eligibility requirements, duration of pre-release services, and comprehensiveness of benefits. Given that states submitted these waivers prior to the guidance it is expected that there may be changes prior to approval to come into compliance with the requirements outlined in the guidance.

Section 1115 Waivers Requesting Waiver of Inmate Exclusion Policy, as of June 5, 2023

Looking Ahead

As federal policies evolve, so does the opioid crisis. Illegally produced fentanyl is now responsible for most overdose deaths, and emerging threats like Xylazine—an veterinary tranquilizer—mixed with fentanyl, further complicates the response to the epidemic and escalates the risk of fatal overdoses. Preliminary data from 2022 finds that opioid overdose deaths remain elevated in the U.S., signaling that there are still significant gaps in access to care. While some recent federal policy changes are permanent, others are subject to change as federal rules are finalized. Though new and proposed federal policies have the potential to increase access to care, ongoing challenges, such as behavioral health workforce shortages, low prescribing of buprenorphine by providers, and treatment gaps by race/ethnicity, could limit the effectiveness of new federal strategies.

The impact of federal efforts may be hampered by resource limitations or state laws. For instance, while OTPs could expand their reach through mobile units, the upfront resource demands might be too burdensome for some programs. Similarly, despite federal funding allowed for fentanyl test strips for some grantees – a potential overdose reduction measure – their accessibility remains limited or illegal in many states due to their classification as drug paraphernalia.

Federal lawmakers are considering the extension or introduction of new strategies to combat the opioid epidemic. Discussions are ongoing regarding whether to extend or permanently classify fentanyl analogs as top-tier controlled substances, affecting penalties for illegal possession and distribution. Congress is engaged in discussions to reauthorize the 2018 SUPPORT Act, addressing the opioid crisis, including funding extensions and proposals for new provisions. Further, federal directives for a public education campaign seek to heighten and spread awareness of the more potent illicit fentanyl which has spread in various drug supplies across the U.S.

States are simultaneously addressing the opioid epidemic through innovative strategies and are debating the best use of recent opioid settlement funds. State Medicaid programs – which have improved access to behavioral health services in recent years through increasing coverage of SUD services, SUD-focused section 1115 waivers, telehealth expansions, and efforts to expand workforce – are now interpreting new federal guidance on justice re-entry focused 1115 waivers. These waivers can allow states to facilitate the provision of OUD services prior to release from incarceration. Yet, the recent resumption of Medicaid renewals following a three-year pandemic halt—termed ‘Medicaid unwinding’— has already led to many individuals losing coverage, primarily due to procedural rather than eligibility reasons. Coverage loss could disrupt OUD treatment, heightening overdose risks, especially during the fentanyl crisis. As awareness and focus on the changing opioid epidemic increases, our understanding of the most effective policies and remaining gaps in access to care and overdose prevention will continue to evolve.

This work was supported in part by Well Being Trust. KFF maintains full editorial control over all of its policy analysis, polling, and journalism activities.

Overview of Health Coverage and Care for Individuals with Limited English Proficiency (LEP)

Authors: Sweta Haldar, Drishti Pillai, and Samantha Artiga
Published: Jul 7, 2023

Introduction

As of 2021, 25.7 million or 8% of people ages five or older living in the United States had limited English proficiency (LEP). Guidance from the Department of Health and Human (HHS) services identifies individuals with LEP as those who do not speak English as their primary language and who have a limited ability to read, write, speak, or understand English.1  Individuals with LEP disproportionately experience gaps in health insurance coverage and poor health outcomes, in part because they may face linguistic barriers to information or communication.2 ,3  Because people of color are significantly more likely to have LEP than White people, these barriers can also exacerbate racial and ethnic disparities in health and health care. This brief provides an overview of the LEP population and their access to health coverage and care based on KFF analysis of 2021 American Community Survey data. Overall, it shows:

  • Most individuals with LEP are Hispanic, Spanish-speaking adults. As of 2021, Hispanic people account for nearly two-thirds (62%) of the LEP population, while over a fifth (22%) of individuals with LEP are Asian. The top five languages spoken by people with LEP include Spanish (63%), Chinese (7%), Vietnamese (3%), Arabic (2%), and Tagalog (2%), while the remaining roughly quarter (23%) of people with LEP speak other languages. People with LEP are disproportionately concentrated in some states, with nearly 60% of people with LEP living in California (25%), Texas (14%), Florida (10%) and New York (9%).
  • While Hispanic people make up the majority of people with LEP, Asian people have the highest share of individuals with LEP across racial and ethnic groups. Nearly one in three Asian people (31%) over age five have LEP, followed by nearly three in ten (28%) Hispanic people. Moreover, immigrants are significantly more likely than U.S.-born people to have LEP, with over half (56%) of noncitizens and over a third (37%) of naturalized citizens having LEP compared to just 2% of U.S.-born citizens.
  • Individuals with LEP are more likely to be uninsured than their English proficient counterparts. Individuals with LEP are about as likely as English proficient individuals to live in a household with a full-time worker, but they are more likely to have lower incomes and educational attainment levels. The lower incomes among people with LEP reflect disproportionate employment in low-wage jobs that often do not offer health coverage, contributing to higher uninsured rates. Despite large gains in coverage since implementation of the Affordable Care Act (ACA), people with LEP remain three times as likely as likely as English proficient people to be uninsured. Among people with LEP, Hispanic people are particularly likely to be uninsured.
  • Beyond disparities in coverage, people with LEP face other challenges and barriers to accessing high-quality health care. Language barriers between providers and patients can reduce the quality of care patients receive and result in adverse effects and/or medical errors. Disparities based on race and ethnicity, citizenship status, and educational attainment and income may compound impacts of LEP.
  • Disparities in coverage for people with LEP could widen as states unwind the continuous enrollment provision in Medicaid. Mitigating coverage losses among people with LEP who remain eligible for Medicaid or for other coverage options like the ACA Marketplace will be important for preventing widening of coverage disparities. Moreover, ensuring people with LEP can access timely and qualified language assistance services can help to address challenges LEP people face in accessing health care and improve the quality of care they receive.

Who are individuals with LEP?

Most individuals with LEP are Hispanic, Spanish-speaking adults. Nearly nine out of ten individuals with LEP are adults, the largest share of whom are between ages 35-54 (38%) (Figure 1). Hispanic people account for nearly two-thirds (62%) of the LEP population, while over a fifth (22%) of individuals with LEP are Asian. The remainder of individuals with LEP are White (11%) or Black (4%) or of other racial and ethnic backgrounds, including American Indian and Alaska Native (AIAN) people, Native Hawaiian and Other Pacific Islander (NHOPI) people and those that identify more than one race. The top five languages spoken by people with LEP include Spanish (63%), Chinese (7%), Vietnamese (3%), Arabic (2%), and Tagalog (2%), while the remaining roughly quarter (23%) of people with LEP speak other languages. People with LEP are disproportionately concentrated in some states, with nearly 60% of people with LEP living in California (25%), Texas (14%), Florida (9%) and New York (9%).

People with Limited English Proficiency by Age, Race and Ethnicity, Language and State

Who is more likely to have LEP?

Nationwide, 8% of individuals over age five have LEP, but this share is higher in some states (Figure 2). The share of individuals with LEP varies widely across states, from a low of less than 1% in West Virginia to a high of 18% in California. Other states with relatively high shares of individuals with LEP include New York (13%), Texas (13%), Florida (12%), Hawaii (12%), New Jersey (12%), Nevada (11%), and Massachusetts (10%).

Percent of Total Population with Limited English Proficiency by State, 2021

Asian people have the highest share of individuals with LEP across racial and ethnic groups, with nearly one in three (31%) individuals over age five having LEP as of 2021, followed by nearly three in ten (28%) Hispanic people and 12% of NHOPI people (Figure 3). Shares of individuals with LEP are lower among other racial and ethnic groups at less than 5%. Noncitizens (56%) and naturalized citizens (37%) are also significantly more likely to have LEP compared with U.S-born citizens (2%).

English Proficiency by Race and Ethnicity, 2021

How does work, education, and income vary by English proficiency?

Individuals with LEP are about as likely as English proficient individuals to live in a household with a full-time worker, but they are more likely to have lower incomes and educational attainment levels. Approximately seven in ten of both LEP and English proficient individuals live in a household with at least one full-time worker (Figure 4). Workers with LEP are concentrated in manufacturing, food services and construction industries, which typically provide lower wages than professional or management positions.4  Reflecting disproportionate employment in these industries, individuals with LEP are more likely to be low-income—nearly one in five individuals with LEP have family income below 200% of the federal poverty level (FPL) compared to just over one in ten English proficient individuals (19% vs. 12%). Lower educational attainment is one factor likely driving these employment differences, as among those ages 19 and older, individuals with LEP are over five times as likely as English proficient adults to have less than a high school education (39% vs. 7%).

Employment, Income, and Educational Attainment by English Proficiency, 2021

How does health coverage vary by English proficiency?

As of 2021, nonelderly individuals with LEP are more likely to be uninsured and more likely to be covered by Medicaid compared with English proficient individuals. Nonelderly individuals with LEP are over three times more likely to be uninsured (29% vs. 9%) as English proficient individuals (Figure 5). The higher uninsured rate among nonelderly individuals with LEP reflects lower rates of private coverage among this group. As noted, individuals with LEP are more likely to be employed in lower-wage jobs and industries that often do not offer employer-sponsored coverage and may have difficulty affording coverage even when it is offered. Medicaid helps to fill some of this gap in private coverage for people with LEP, but does not fully offset the difference, leaving people with LEP more likely to be uninsured. Although uninsured rates are lower among children compared to nonelderly adults, both children and nonelderly adults with LEP are more than three times as likely to be uninsured as their English proficient peers (17% vs. 5% for children and 31% vs. 10% for adults).

Health Coverage by English Proficiency, 2021

Differences in health coverage by English proficiency vary by race and ethnicity, with Hispanic nonelderly individuals with LEP having the highest uninsured rate. Across racial and ethnic groups, individuals with LEP are significantly more likely to be uninsured than English proficient people. For example, among nonelderly Hispanic people, those with LEP are over twice as likely to be uninsured as those who are English proficient (37% vs. 14%) (Figure 6). Similarly, nonelderly Asian people with LEP are twice as likely to be uninsured as Asian people who are English proficient (10% vs. 5%). However, uninsured rates among people with LEP vary widely across race and ethnicity groups. Among nonelderly people with LEP, Hispanic people have the highest uninsured rate at 37%, followed by almost one-third (31%) of AIAN people, and nearly a quarter (23%) of NHOPI people. Uninsured rates among Black and White people with LEP are lower at 19% and 16%, respectively, and lowest among Asian people with LEP at 10%, although uninsured rates among Asian people vary by ethnic subgroup.

Health Coverage of Nonelderly Individuals by Race and Ethnicity and English Proficiency, 2021

Nonelderly individuals with LEP have experienced large coverage gains since implementation of the ACA, which helped narrow but did not eliminate disparities in coverage. Prior to the enactment of the ACA in 2010, almost half (46%) of people with LEP were uninsured—nearly three times the uninsured rate of English proficient people (16%). Between 2010 and 2021, the uninsured rate among people with LEP fell from 46% to 29%, a 17 percentage-point drop, over twice as large as the 7 percentage-point drop for English proficient people from 16% to 9% (Figure 7). This coverage gain helped to narrow the absolute difference in uninsured rates between people with LEP and English proficient people, but people with LEP still remained over three times as likely as English proficient people to be uninsured as of 2021 (29% vs. 9%). Across most racial and ethnic groups, people with LEP had larger absolute gains in coverage than their English proficient counterparts, although there were no improvements in relative disparities. Hispanic people with LEP had the largest coverage gain, with their uninsured rate falling from 55% to 37%. Asian and Black people with LEP had gains of 17 percentage points (27% to 10%) and 16 percentage points (35% to 19%), respectively, while gains were smaller among other groups.

Many of these gains in coverage reflected the new coverage options for low- and moderate-income individuals created by the ACA, including the Medicaid and Marketplace expansions implemented in 2014. Following years of coverage gains after implementation of the ACA, uninsured rates increased for several years prior to the pandemic, and then declined slightly between 2019 and 2021. These recent coverage gains reflect policies implemented during the pandemic to stabilize and expand health coverage, including a requirement that Medicaid programs keep people continuously enrolled during the pandemic, which contributed to rises in enrollment.

Uninsured Rate by English Proficiency and Race and Ethnicity, 2010-2021

Beyond disparities in health coverage, people with LEP face other challenges and barriers to accessing high-quality health care. Studies have found that language barriers between providers and patients may result in decreased patient satisfaction with health care5 ; lack of comprehension of health care information, leading to increased adverse effects; 6  reduced medication adherence;7  excessive ordering of medical tests by providers;8  higher rates of medical errors;9  and decreased primary care utilization.10 ,11 ,12  Patients with LEP have longer hospital stays and are at higher risk of surgical delays and readmissions.13  Hispanic people with LEP report reduced access to care and fewer preventive services compared to English proficient Hispanic people.14  For Asian American people with LEP, language barriers are one of the most significant challenges to accessing care, particularly among older Asian Americans with LEP.15  A 2021 KFF survey found that, among Hispanic adults who completed the survey in Spanish, 35% said it is difficult to find a doctor who explains things in a way they can understand compared with 17% of those who completed the survey in English, and one-third (33%) said it was very or somewhat difficult to find a doctor who speaks their preferred language or provides an interpreter when needed. While LEP can be an independent contributor to inequities in health and health care, disparities based on race and ethnicity, citizenship status, and educational attainment and income levels may compound impacts.

Looking Ahead

Providing timely access to language assistance can help to address challenges LEP people face in accessing health coverage and care and improve the quality of care they receive. Language assistance includes oral interpretation, either in-person or remote via phone or video, and written translations.16  Research points to the importance of using qualified interpreters and translators, as the use of family members or untrained staff and machine translation tools can contribute to inaccuracies.17 ,18 ,19 ,20  Under Section 1557 of the ACA, state Medicaid agencies and health care providers must take reasonable steps to provide meaningful access to LEP individuals. The Trump Administration reduced some standards for providing meaningful access under Section 1557.21  However, the Biden Administration since proposed a rule that would restore the standards more closely to the original 2016 regulations.22  The National Standards for Culturally and Linguistically Appropriate Services (CLAS) in Health and Health Care provide action steps to guide organizations in implementing culturally and linguistically appropriate services.23  In October 2022, the Office of Minority Health announced more than $4 million in grants to develop and test methods of informing individuals with LEP about the availability of language access services in health care settings.24  HHS also convened its Language Access Steering Committee in October 2022, which is charged with implementing the language goals of the 2022 HHS Equity Action Plan and updating the 2013 HHS Language Access Plan.25 

Although people with LEP have experienced large coverage gains since implementation of the ACA, they continue to face large disparities in coverage, which could grow as states unwind the Medicaid continuous enrollment provision. The Medicaid continuous enrollment provision, which had halted Medicaid disenrollments since March 2020, ended on March 31, 2023. As states unwind the continuous enrollment provision, they will redetermine eligibility for all Medicaid enrollees and disenroll those who are no longer eligible or who may remain eligible but are unable to complete the renewal process. Millions of people are expected to lose Medicaid coverage during this unwinding period, with disenrollments beginning in Spring and Summer 2023. Complex enrollment and renewal processes have historically been barriers to obtaining and maintaining Medicaid coverage. Enrollees with LEP are at particular risk for experiencing difficulties, as they may face added challenges understanding and completing tasks or forms due to language barriers, particularly if they are not provided translated materials.

Maintaining Medicaid coverage for people with LEP who remain eligible and facilitating smooth transitions to Marketplace or other coverage for those who are no longer eligible amid the unwinding of the Medicaid continuous enrollment provision can help to prevent widening of coverage disparities. In 2022, the Centers for Medicare and Medicaid Services (CMS) released guidance outlining specific steps states can take to maintain Medicaid coverage for people with LEP who remain eligible, including ensuring accessibility of forms and notices for people with LEP and reviewing communications strategies to ensure accessibility of information.26  In 2023, the Office of Civil Rights at HHS sent a letter to state Medicaid agencies reminding them of their obligations under federal civil rights laws to provide meaningful access for individuals with LEP and outlining best practices.27  These include adequately funding and staffing call centers to ensure they are accessible without prolonged delays, providing notices in the top 15 languages other than English spoken by people with LEP in the state, using plain language on forms and notices, informing individuals of the availability of free language assistance services, ensuring use of qualified interpreters and translators, and engaging with local communities and community- based organizations to provide outreach. Prior KFF analysis found significant variation in linguistic accessibility of state Medicaid websites and applications.

Navigators and other enrollment assistance programs can help Medicaid enrollees with LEP maintain or transition to other coverage. Marketplace consumer assistance programs conduct outreach and education and provide direct assistance to help people apply for and enroll in affordable coverage and renew existing coverage. This assistance is particularly important for people who may have increased difficulty navigating enrollment and renewal processes, such as people with LEP. A 2022 KFF survey of Assister programs found that nearly all reported helping at least some consumers who need language assistance. Community health centers can also play a role in supporting stable coverage among people with LEP. A 2021 KFF survey of health centers  found that two-thirds (66%) of health centers were planning or taking actions to help their patients retain coverage during the unwinding of the Medicaid continuous enrollment provision.

  1. Office of Civil Rights. (2013, July 26). Guidance to Federal Financial Assistance Recipients Regarding Title VI Prohibition Against National Origin Discrimination Affecting Limited English Proficient Persons. United States Department of Health and Human Services. https://www.hhs.gov/civil-rights/for-individuals/special-topics/limited-english-proficiency/guidance-federal-financial-assistance-recipients-title-vi/index.html ↩︎
  2. Lu, Tianyi and Rebecca Meyerson. (2020). “Disparities in Health Insurance Coverage and Access to Care by English Language Proficiency in the USA, 2006–2016.” Journal of General Internal Medicine, 35(2), https://link.springer.com/article/10.1007/s11606-019-05609-z. ↩︎
  3. Proctor, Kimberly, Shondelle Wilson-Frederick and Samuel Haffer. (2018). “The Limited English Proficient Population: Describing Medicare, Medicaid, and Dual Beneficiaries.” Health Equity, 2(1), https://www.liebertpub.com/doi/10.1089/heq.2017.0036. ↩︎
  4. Wilson, Jill (2014). “Investing in English Skills: The Limited English Proficient Workforce in U.S. Metropolitan Areas,” Brookings Institution. https://www.brookings.edu/wp-content/uploads/2014/09/metro_20140924_investing_in_english_skils_report.pdf. ↩︎
  5. Shamsi, et al. (2020). “Implications of Language Barriers for Healthcare: A Systematic Review.” Oman Medical Journal, 35(2), doi: 10.5001/omj.2020.40. ↩︎
  6. Berdahl, Terceira  and James B. Kirby (2019). “Patient-Provider Communication Disparities by Limited English Proficiency (LEP): Trends from the US Medical Expenditure Panel Survey, 2006–2015,” Journal of General Internal Medicine 34(8) https://doi.org/10.1001/jamahealthforum.2021.2724. ↩︎
  7. Kahler, Luke and Joseph LeMaster (2022). “Understanding Medication Adherence in Patients with Limited English Proficiency,” Kansas Medical Journal 15 doi: 10.17161/kjm.vol15.15912. ↩︎
  8. Silverberg, Melissa (2021). “Patients with Limited English More Likely To Be Referred For Imaging in EDs,” Radiological Society of North America Daily Bulletin, https://dailybulletin.rsna.org/db21/index.cfm?pg=21wed08. ↩︎
  9. “Limited English Proficiency and Health Care: How to Support Non-English Speakers,” George Washington University Milken Institute School of Public Health, https://onlinepublichealth.gwu.edu/resources/limited-english-proficiency-health-care-how-to-support/. ↩︎
  10. Berdahl, Terceira A. and James B. Kirby (2019). “Patient-Provider Communication Disparities by Limited English Proficiency (LEP): Trends from the US Medical Expenditure Panel Survey, 2006–2015,” Journal of General Internal Medicine 34(8) https://doi.org/10.1001/jamahealthforum.2021.2724. ↩︎
  11. Jang, Yuri and Miyong T. Kim (2018). “Limited English Proficiency and Health Service Use in Asian Americans,” Journal of Immigrant and Minority Health 21, https://doi.org/10.1007/s10903-018-0763-0. ↩︎
  12. Sifuentes, et al (2020). “The Role of Limited English Proficiency and Access to Health Insurance and Health Care in the Affordable Care Act Era,” Health Equity 4(1), https://doi.org/10.1089/heq.2020.0057 ↩︎
  13. U.S. Department of Health & Human Services., Agency for Healthcare Research & Quality, Executive Summary: Improving Patient Safety Systems for Patients with Limited English Proficiency (Sept. 2020), https://www.ahrq.gov/​health-literacy/​professional-training/​lepguide/​exec-summary.html#what. ↩︎
  14. Espinoza et al., “How Should Clinicians Respond to Language Barriers that Exacerbate Health Inequity?”, 23 a.m. Medical Association Journal of Ethics E109 (2021) (LEP patients and families in the U.S. “face barriers to health service access, experience lower quality care, and suffer worse health outcomes”), https://journalofethics.ama-assn.org/​sites/​journalofethics.ama-assn.org/​files/​2021-02/​cscm3-2102.pdf. ↩︎
  15. Kim et al., “Barriers to Healthcare Among Asian Americans,” (2010). Social Work in Public Health 286, 289 (2010), https://doi.org/10.1080/19371910903240704. ↩︎
  16. U.S. Department of Health & Human Services., Centers for Medicare and Medicaid Services, Providing Language Services to Diverse Populations: Lessons from the Field (July 2022), https://www.cms.gov/About-CMS/Agency-Information/OMH/Downloads/Lessons-from-the-Field.pdf. ↩︎
  17. Espinoza et al., “How Should Clinicians Respond to Language Barriers that Exacerbate Health Inequity?”, 23 a.m. Medical Association Journal of Ethics E109 (2021) (LEP patients and families in the U.S. “face barriers to health service access, experience lower quality care, and suffer worse health outcomes”), https://journalofethics.ama-assn.org/​sites/​journalofethics.ama-assn.org/​files/​2021-02/​cscm3-2102.pdf. ↩︎
  18. Dew et al., (2018). “Development of Machine Translation Technology for Assisting Health Communication: A Systematic Review,” Journal of Biomedical Informatics 85, https://doi.org/10.1016/j.jbi.2018.07.018 ↩︎
  19. Taira, et al. (2021). “A Pragmatic Assessment of Google Translate for Emergency Department Instructions.” Journal of General Internal Medicine, 36(11), 3361-3365. doi: 10.1007/s11606-021-06666-z. ↩︎
  20. Vieira et al., (2020). “Understanding the Societal Impacts of Machine Translation: A Critical Review of the Literature on Medical and Legal Use Cases.” Information, Communication and Society 24, https://www.tandfonline.com/​doi/​full/​10.1080/​1369118X.2020.1776370. ↩︎
  21. Nondiscrimination in Health and Health Education Programs or Activities, Delegation of Authority, 85 Fed. Reg. 37,160 (June 19, 2020) (to be codified at 42 CFR Parts 438, 440, and 460). ↩︎
  22. Ibid. ↩︎
  23. U.S. Department of Health & Human Services., Office of Minority Health, National Standards for Culturally and Linguistically Appropriate Services (CLAS) in Health and Health Care, https://thinkculturalhealth.hhs.gov/clas. ↩︎
  24. “HHS Takes Action to Break Language Barriers,” (October 6, 2022). U.S. Department of Health and Human Services. https://www.hhs.gov/about/news/2022/10/06/hhs-takes-action-break-language-barriers.html. ↩︎
  25. U.S. Department of Health & Human Services., Centers for Medicare and Medicaid Services, HHS Equity Action Plan (April 2022), https://www.hhs.gov/sites/default/files/hhs-equity-action-plan.pdf. ↩︎
  26. Centers for Medicare and Medicaid Services. (2022, March 3) Promoting Continuity of Coverage and Distributing Eligibility and Enrollment Workload in Medicaid, the Children’s Health Insurance Program (CHIP), and Basic Health Program (BHP) Upon Conclusion of the COVID-19 Public Health Emergency. https://www.medicaid.gov/federal-policy-guidance/downloads/sho22001.pdf. ↩︎
  27. Office of Civil Rights. (2023, April 4) Ensuring Language Access for Limited English Proficient (LEP) Individuals and Effective Communication for Individuals with Disabilities During the States’ Unwinding of the Medicaid Continuous Enrollment Condition. https://www.hhs.gov/sites/default/files/medicaid-unwinding-letter.pdf. ↩︎

New Alzheimer’s Drugs Spark Hope for Patients and Cost Concerns for Medicare

Published: Jul 6, 2023

This post was updated on July 6, 2023, to reflect FDA’s approval of Leqembi, additional details from CMS about patient registries, and updated Medicare spending projections.

The FDA has just granted traditional approval to Leqembi (lecanemab), an anti-amyloid monoclonal antibody treatment for Alzheimer’s disease, after granting accelerated approval this past January. Clinical trial results showed that Leqembi, made by Eisai and Biogen, slowed the rate of cognitive decline and reduced amyloid plaques, the protein that accumulates in the brains of people with Alzheimer’s disease – though not without the risk of adverse events. FDA’s approval of a drug that can slow the progression of cognitive decline in patients with Alzheimer’s disease offers long-awaited hope for these patients and their families, but also raises concerns about the potential impact on Medicare spending.

Now that the FDA has granted traditional approval to Leqembi, Medicare will cover it for all indicated populations – patients with mild cognitive impairment or mild dementia with confirmed amyloid plaques – outside of the randomized clinical trials required for drugs with accelerated approval under Medicare’s coverage with evidence development. At the same time, the Centers for Medicare & Medicaid Services (CMS) will require physicians and other clinicians to participate in prospective data collection efforts for Leqembi users, known as registries, to inform questions about how the drug is working, including benefits and harms to patients and whether it improves health outcomes, based on real-world evidence. CMS has announced it will establish its own registry, to be made available on CMS’s website, and will also provide access to registries established by other organizations on the same site. Yet questions remain about the registry requirement for Leqembi, including whether the data collection system is ready for use, how data about the drug’s benefits and risks will be collected, how easy it will be for providers to participate in the registry, the costs involved with collecting the data, and whether the registry requirement will make it harder for patients to access the drug.

Notwithstanding these questions about the registry requirement and how it might affect access to Leqembi, broader access to the drug under Medicare outside of clinical trials will lead to higher Medicare spending, based on the drug’s annual price of $26,500 and expected demand for it among patients with Alzheimer’s disease. Yet the exact number of Medicare beneficiaries who meet the prescribing requirements for Leqembi is unknown and the take-up rate among eligible individuals for a drug like this one is difficult to estimate.

Eisai has estimated that take-up will be ‘approximately 100,000 individuals by year 3’ – an estimate that some consider conservative – and will increase ‘gradually’ over time. Based on this estimate of take-up, which represents 1.5% of the 6.7 million older adults in the US with Alzheimer’s disease, annual Medicare spending on Leqembi would be $2.7 billion (assuming all are enrolled in Part B), which would make it the third most costly drug covered by Medicare Part B, based on 2021 total spending (Figure 1). If take-up is somewhat higher, for example, 5% of those with Alzheimer’s disease, this would translate to $8.9 billion in total annual spending, while a 10% take-up rate would amount to $17.8 billion.

 Depending on Take-up, the New Alzheimer's Drug Leqembi Would Rank Among the Top Spending Medicare Part B Drugs

To put these amounts in context, projected Medicare spending on Leqembi would be roughly equal to spending on the top 3 Part B drugs combined in 2021 based on the 5% take-up rate. At the 10% take-up rate, projected spending on this one drug alone would exceed spending on the top 10 Part B drugs in 2021 and would represent close to half of the $40 billion spent in total on the 600+ Part B covered drugs in 2021. And these estimates do not include additional costs to Medicare associated with PET scans or multiple MRIs that may be needed in conjunction with use of Leqembi nor potential offsets if treatment with Leqembi helps reduce spending on other services, such as hospitalizations due to falls or skilled nursing facility stays.

Higher Medicare Part B spending would likely lead to higher Medicare Part B premiums, which are set to cover roughly 25 percent of program costs. In the case of Aduhelm, the anticipation of substantially higher Medicare Part B spending due to coverage of that drug contributed to a 15% jump in the Part B premium between 2021 and 2022, an increase substantially above the norm. Medicare’s subsequent decision to limit coverage of Aduhelm contributed to a modest (3%) decline in the Part B premium for 2023.

At Leqembi’s current $26,500 list price, Medicare patients administered the drug will be responsible for more than $5,000 out of pocket each year, based on a 20% coinsurance requirement in traditional Medicare. Medicare Advantage enrollees are also typically responsible for the 20% coinsurance for Part B drugs up to their plan’s out-of-pocket maximum. (In 2022, the weighted average out-of-pocket maximum in Medicare Advantage plans was nearly $5,000 for in-network services and just over $9,200 for in-network and out-of-network combined). Beneficiaries may pay less if they have supplemental insurance, such as Medigap or Medicaid, that covers Medicare cost sharing. The Inflation Reduction Act includes a new cap on out-of-pocket drug spending under Medicare Part D beginning in 2024 that will provide significant financial relief to people who take high-priced Part D drugs, but there is no similar cap on out-of-pocket spending for drugs, like Leqembi, that are covered under Medicare Part B.

Even with Medicare coverage, therefore, Leqembi could be beyond the reach of many people with Medicare, whose median income is around $30,000 per person. And with higher rates of dementia and lower incomes among older Hispanic and Black adults than among older White adults in the US, the high cost of treatment could raise equity concerns if it means Black and Hispanic beneficiaries are less likely to gain access to this treatment because they can’t afford it.

To address concerns about the effect of high-priced drugs on Medicare program spending, the Inflation Reduction Act requires Medicare to negotiate the price of top spending drugs, but manufacturers of biologic drug products like Leqembi will be exempt from having CMS-negotiated prices take effect for 13 years from the drug’s licensure date. In the case of Leqembi, its manufacturers will have between now and 2036 to recoup investments in research and development and earn revenue from Medicare before possibly having negotiated pricing take effect. While broader access to Leqembi is expected to provide modest clinical benefits to older adults with mild cognitive impairment and mild dementia stage of Alzheimer’s disease, a significant increase in Medicare spending and premiums is a distinct possibility, and one that Medicare, patients, and taxpayers are likely to confront in the not-too-distant future.

This work was supported in part by Arnold Ventures. KFF maintains full editorial control over all of its policy analysis, polling, and journalism activities.

A Closer Look at the Five Largest Publicly Traded Companies Operating Medicaid Managed Care Plans

Published: Jul 6, 2023

Note: For the latest data on the experiences of the five largest publicly traded companies, view our 2025 brief

Total Medicaid and CHIP enrollment is now over 90 million. The latest national Medicaid managed care enrollment data (from 2020) show 72% of Medicaid beneficiaries were enrolled in comprehensive managed care organizations (MCOs). In FY 2021, payments to comprehensive Medicaid MCOs accounted for 52% of total Medicaid spending (or more than $376 billion). Medicaid is a major source of revenue and profits for multi-state insurance companies. KFF analysis of National Association of Insurance Commissioners (NAIC) data show gross margins per enrollee in the Medicaid managed care market were higher in 2021 than they were pre-pandemic. Medicaid MCOs have played a key role in responding to the COVID-19 pandemic and are expected to work with states in conducting outreach and providing support to enrollees during the “unwinding” of the continuous enrollment requirement. Beginning April 1, 2023, states were able to restart disenrollments (which had been paused since February 2020) after conducting a full review of eligibility. Many people will likely be found to be no longer eligible for Medicaid, while others could face administrative barriers and lose coverage despite remaining eligible. Medicaid MCOs have a financial interest in maintaining enrollment, which could also prevent disruptions in care for enrollees. This brief takes a closer look at the five largest publicly traded companies (also referred to as “parent” firms) operating Medicaid MCOs which account for half of Medicaid MCO enrollment nationally. Information and data reported in this brief come from quarterly company earnings reports, financial filings, and other company materials as well as from national administrative data.

Medicaid enrollment in the five largest publicly traded companies operating Medicaid MCOs

Five for-profit, publicly traded companies – Centene, Elevance (formerly Anthem), UnitedHealth Group, Molina, and CVS Health – account for 50% of Medicaid MCO enrollment nationally (Figure 1). All five are ranked in the Fortune 500, and four are ranked in the top 100, with total revenues that ranged from $32 billion (Molina) to $324 billion (UnitedHealth Group) for 2022. Each company operates Medicaid MCOs in 12 or more states (Figure 2). All five firms also operate in the commercial and Medicare markets (Figure 3); however, the distribution of membership across markets varies across firms. Two firms – Molina and Centene– have historically focused predominantly on the Medicaid market. Medicaid members accounted for over 90% of Molina’s overall medical membership and nearly 70% of Centene’s medical membership as of March 2023 (Figure 3).

Five For-Profit, Publicly Traded Companies Have Half of the Medicaid MCO Market.
Five Firms Have a Wide Geographic Reach in Medicaid, Each With MCOs in 12 or More of the 40 MCO States.
The Distribution of Medical Membership Across Markets Varies Across the Five Largest Publicly Traded Companies Operating Medicaid MCOs.

Combined Medicaid enrollment across the five firms increased by 13.5 million or 44.1% from March 2020 to March 2023 (Figure 4). Medicaid enrollment overall grew by more than 20 million (or about 31%) during the continuous enrollment period (February 2020 to January 2023), resulting in growth in MCO enrollment as well. Enrollment growth has been primarily attributed to the Families First Coronavirus Response Act (FFCRA) provision that required states to ensure continuous enrollment for Medicaid enrollees in exchange for a temporary increase in the Medicaid match rate. Growth in parent firm Medicaid enrollment may also reflect other activity including firm acquisitions and/or new contracts. For the firms that report this information, Medicaid revenue growth 2022 over 2021 ranged from 11% (Centene) to 18% (UnitedHealth) to 21% (Molina). These same firms reported Medicaid revenue growth ranging from 13% (Centene) to 16% (UnitedHealth) to 43% (Molina) year-over-year 2021 over 2020. Molina reported the medical margin earned by the Medicaid segment was $3.0 billion in 2022 and $2.3 billion in 2021 (medical margin = premium revenue – medical costs).

Medicaid Enrollment Across the Five Firms Increased During the Pandemic Continuous Enrollment Period from 30.7 Million to 44.2 Million or 44%.

Implications of “unwinding” for the five largest publicly traded companies operating Medicaid MCOs

All five firms expect Medicaid enrollment losses following the end of the continuous enrollment requirement (over 2023 and 2024); however, firms expect to retain some members who lose Medicaid coverage in their Marketplace and other products (Appendix Table). The Consolidated Appropriations Act, 2023 ended the continuous enrollment provision and allowed states to resume disenrollments starting April 1, 2023. While the number of Medicaid enrollees who may be disenrolled during the unwinding period is highly uncertain, it is estimated that millions will lose coverage. KFF estimates 17 million people could lose Medicaid coverage – including some who are no longer eligible and others who are still eligible but face administrative barriers to renewal. Rates of Medicaid coverage loss will vary across states depending on how states approach unwinding. CMS has issued specific guidance allowing states to permit MCOs to update enrollee contact information and conduct outreach about the eligibility renewal process to facilitate continued enrollment as well as Marketplace transitions, where appropriate. In June 2023, CMS released new guidance highlighting several new strategies available to states to prevent procedural terminations including permitting managed care plans to assist enrollees in completing certain parts of renewal forms.

In first quarter 2023 investor earnings calls, executives of the publicly traded companies operating Medicaid MCOs expressed the aim of maximizing continuity of coverage for members through supporting continued enrollment in Medicaid and transitions to the Marketplace (and other products), where appropriate. The firms report conducting direct and indirect outreach, including text messages, live calls, and community-based provider campaigns, to educate members about Medicaid redeterminations and the renewal process as well as about their Marketplace options if they are no longer eligible for Medicaid (Appendix Table).

All five firms offer a Qualified Health Plan (QHP) in the ACA marketplace in many states where they operate a Medicaid MCO, however there may not be plan alignment if plans operate regionally. Current enrollees who are determined to no longer be eligible for Medicaid may be eligible for ACA marketplace (which has higher income eligibility thresholds than Medicaid) or other coverage (e.g., CHIP coverage or employer sponsored insurance (ESI)). Individuals eligible for coverage in the Marketplace may qualify for plans with zero premiums; however, individuals transitioning to Marketplace coverage may face higher cost-sharing and different provider networks. Prior analyses suggest that individuals face barriers moving from Medicaid to other coverage programs and many may experience gaps in coverage. CMS guidance outlines states may encourage MCOs that also offer a QHP to share information with their own enrollees who have been determined ineligible for Medicaid to assist in the transfer of individuals to Marketplace coverage (as long as state-specific laws and/or contract requirements do not prohibit this activity). To avoid gaps in coverage, managed care plans may reach out to individuals before they lose coverage to allow them to apply for Marketplace coverage in advance.

Looking Ahead

Medicaid managed care plans have a financial interest in maintaining enrollment, which could also prevent disruptions in care for enrollees. The five publicly traded firms that are the subject of this analysis account for half of all Medicaid MCO enrollment nationally. As states unwind the continuous enrollment provision, many people will likely be found to be no longer eligible for Medicaid. Others could face administrative barriers and lose coverage despite remaining eligible. Medicaid managed care plans can assist state Medicaid agencies in communicating with enrollees, conducting outreach and assistance, and ultimately, in improving coverage retention – including facilitating transitions to the Marketplace.

Appendix

Expected Medicaid Redetermination Impacts, Including Enrollment Shift to Other Products

Mental Health Care Needs and Experiences Among LGBT+ People

Published: Jun 30, 2023

Issue Brief

Key Findings

There has been rising attention to the scope of mental health challenges in the United States, including a desire to better understand the experiences and needs of those who may be most heavily impacted. The LGBT+ community is one such group, having faced lifelong mental health challenges beginning in adolescence and persisting through adulthood. While in some cases, LGBT+ people are accessing mental health care more frequently than non-LGBT+ people, their need for services is greater, and gaps remain. Today, policies seeking to curtail access and rights of LGBT+ people threaten to worsen these disparities, and continuing to monitor the wellbeing of the community will be important.

With this report, we examine LGBT+ people’s needs for and experiences accessing mental health care by analyzing data from a nationally representative 2022 KFF survey with a large sample of LGBT+ adults. Key findings include:

  • Two-thirds of LGBT+ people (67%) reported needing a mental health service over the past two years, a considerably higher share than for non-LGBT+ people (39%).
  • Yet, only about half of LGBT+ people with a reported need sought and received mental health services (similar to the share among non-LGBT+ people).
  • Barriers to care can include:
    • Wait times: Four-in-ten LGBT+ people reported having to wait at least a month for services.
    • Insurance: One-quarter of privately insured LGBT+ people who received mental health services said their provider did not take their insurance.

Introduction

There has been rising attention to the depth and breadth of mental health challenges in the United States, including a desire to better understand the experiences and needs of those most heavily impacted. A recent KFF/CNN poll found that nearly all (90%) Americans believe there is a mental health crisis today and that LGBT+ adults consistently reported poorer mental health outcomes on almost all measures throughout the survey.

Indeed, the LGBT+ community has faced lifelong mental health challenges beginning in adolescence and persisting through adulthood at higher rates compared to non-LGBT+ people. Additionally, while in some cases, LGBT+ people are accessing mental health care more frequently than non-LGBT+ people, their need for services is greater and gaps remain. Addressing systemic factors that drive stigma and discrimination within the community could play a key role in mitigating these challenges alongside improving access more generally.

With this report, we provide an update on LGBT+ people’s needs for and experiences of accessing mental health care by analyzing data from a nationally-representative 2022 KFF survey of 6,442 adults ages 18 to 64, including 958 LGBT+ people, conducted primarily online from May 10, 2022, to June 7, 2022. For this survey, LGBT+ people include those who identified their sexual orientation as lesbian, gay, bisexual, or “something else,” and those who identified their gender as transgender, non-binary, “other,” or whose reported gender does not correspond to their reported sex assigned at birth. (See the Methodology for additional detail.) Beyond issues related to mental health and access to care, the survey collected data on a range of demographic characteristics and issues from general well-being to experiences engaging in the health system, use of preventive services including HIV and STI testing, and reproductive health. A separate companion issue brief, LGBT+ People’s Health Status and Experiences Accessing to Care, provides these additional findings.

Findings

Experiences with Mental Health Problems

Surveys regularly find that LGBT+ people face greater mental health challenges than non-LGBT+ people, including for common conditions like depression and anxiety, as found in a recent KFF/CNN poll.

Here we find that two-thirds of LGBT+ people (67%) reported needing a mental health service over the past two years, a considerably higher share than the one-in-four non-LGBT+ people (39%). Self-reported need for mental health care was highest among younger LGBT+ people under age 35 (77%) and for women, nearly three-quarters of whom (73%) reported the need for mental health care (Figure 1).

Two-Thirds of LGBT+ People Reported Needing Mental Health Care in the Past Two Years

Accessing Mental Health Care

The higher rates of stigma, discrimination, and violence experienced by LGBT+ populations can translate into mental health and substance use challenges. For many who are part of this community, these challenges highlight the need for behavioral health care.

While reported need for mental health services was high among LGBT+ people, not all of those with a need for services sought or received them. Notably, a higher share of LGBT+ people have both a need for mental health service than non-LGBT+ people, and higher shares sought and received mental health services than their non-LGBT+ counterparts. Yet, unmet need persisted for many in both groups.

Two-thirds (65%) of LGBT+ people who reported needing a mental health service sought one, compared to 58% of non-LGBT+ people, still leaving many without desired services (Figure 2). There were no statistical differences in the share that sought services by age, race/ethnicity, or insurance status among LGBT+ people. Limited uptake could be due to being a lower-income group, having lower rates of private coverage, or experience of stigma, discrimination shame and trauma, including within medical settings. See the issue brief LGBT+ People’s Health Status and Experiences Accessing to Care for more details.

Among Those Who Needed Care, Three-Quarters of LGBT+ People With Medicaid Sought Mental Health Care

Only about half of LGBT+ people (55%) and non-LGBT+ people (49%) who reported a need for mental health services over the past two years received care, pointing to substantial unmet need in this area regardless of gender identity or sexual orientation. One-in-ten (10%) LGBT+ who reported a need for these services said they tried to get but did not receive care, also similar to non-LGBT+ people. One-third (35%) with a need did not try to get mental health care (Figure 3). A smaller share of LGBT+ individuals with a need did not try to get mental health care compared to non-LGBT+ individuals (35% vs. 42%).

Among LGBT+ Individuals Who Thought They Needed Mental Health Care in the Past Two Years, Just Over Half Were Able to Get an Appointment for Care

Since the COVID-19 pandemic, telehealth has emerged as an important avenue for people to access health care, including mental health services. Almost two-thirds of LGBT+ people (63%) reported having had a telehealth visit in the last year and mental health services was the leading reason for their most recent telehealth visit – 28% received mental health services, followed by an annual check-up or well-visit (21%). Telehealth can increase access to mental health services, including for those who might not otherwise get or want in-person care (data not shown in figure).

Barriers to Mental Health Care

Among LGBT+ people who were able to get a mental health appointment, about six-in-ten (58%) were able to get one in less than a month, but four-in-ten (42%) had to wait one month or more, with 16% waiting more than two months. These were similar to the shares among non-LGBT+ people. Such delays can be a barrier to getting people into care, particularly when those who have to wait may end up not seeking care at all if that wait is for a substantial period. These delays can prolong suffering and lead to worsening of symptoms (Figure 4).

Four-in-Ten LGBT+ Individuals Who Got a Mental Health Appointment Had to Wait a Month or More

Seven-in-ten (69%) privately insured LGBT+ people reported their mental health provider accepted their insurance plan, but 27% said they did not, and 4% didn’t know, shares similar to privately insured non-LGBT+ people (Figure 5).

One-Quarter of Privately-Insured LGBT+ People Who Received Mental Health Services Said the Provider Did Not Accept Their Insurance

Conclusion

LGBT+ people experience significantly higher rates of mental health challenges and need for mental health services than non-LGBT+ people, as well as higher rates of health care discrimination. While they also reported accessing mental health care at slightly higher rates than non-LGBT+ people, nearly half who said they could benefit from such services went without. The findings presented here suggest that in addition to inability to secure appointments, wait times may also be a barrier to care. A facilitator to mental health care appears to be telehealth, with more than one-quarter of LGBT+ people accessing telehealth care doing so for mental health services.

The reasons that LGBT+ people are more likely to face mental health challenges are complex and may relate, in part, to widespread experiences of stigma and discrimination. Current attempts to institute anti-LGBTQ policies in many states and communities may contribute to poor mental health outcomes and increase the need for care. Targeted and culturally appropriate policy solutions aimed at improving the well-being of the LGBT+ community and addressing their access challenges to mental health care could help to meet their mental health care needs, as would efforts to address systemic factors that drive stigma and discrimination within the community.

Methods

Methods

Data for this issue brief come from the 2022 KFF Women’s Health Survey, a nationally representative survey of 6,442 people of all genders ages 18 to 64, including 958 LGBT+ people, conducted from May 10, 2022, to June 7, 2022. The objective of the survey is to help better understand respondents’ experiences with contraception, potential barriers to health care access, and other issues related to reproductive health. The survey was designed and analyzed by researchers at KFF (Kaiser Family Foundation) and fielded online and by telephone by SSRS using its Opinion Panel, supplemented with sample from IPSOS’s KnowledgePanel.

The survey asked respondents which sex they were assigned at birth, on their original birth certificate (male or female). They were then asked what their current gender is (man, woman, transgender, non-binary, or other). Those who identified as transgender men are coded as men and transgender women are coded as women. While we attempted to be as inclusive as possible and recognize the importance of better understanding the health of non-cisgendered people, as is common in many nationally representative surveys, we did not have a sufficient sample size (n >= 100) to report gender breakouts other than men and women with confidence that they reflect the larger non-cisgender population as a whole. The data in our reproductive health analyses use the respondent’s sex assigned at birth (inclusive of all genders) to account for reproductive health needs/capacity (e.g., ever been pregnant) while other analyses use the respondent’s gender (inclusive of males and females).

For this survey, LGBT+ people include those who identified their sexual orientation as lesbian, gay, bisexual, or “something else,” and those who identified their gender as transgender, non-binary, “other,” or whose reported gender does not correspond to their reported sex assigned at birth.

Questionnaire design

KFF developed the survey instrument with SSRS feedback regarding question wording, order, clarity, and other issues pertaining to questionnaire quality. The survey was conducted in English and Spanish. The survey instrument is available upon request.

Sample design

The majority of respondents completed the survey using the SSRS Opinion Panel (n=5,202), a nationally representative probability-based panel where panel members are recruited in one of two ways: (1) through invitations mailed to respondents randomly sampled from an Address-Based Sample (ABS) provided by Marketing Systems Group through the U.S. Postal Service’s Computerized Delivery Sequence. (2) from a dual-framed random digit dial (RDD) sample provided by Marketing Systems Group.

In order to have large enough sample sizes for certain subgroups (females ages 18 to 35, particularly females in the following subgroups: lesbian/gay/bisexual; Asian; Black; Hispanic; Medicaid enrollees; low-income; and rural), an additional 1,240 surveys were conducted using the IPSOS KnowledgePanel, a nationally representative probability-based panel recruited using a stratified ABS design. (Note that due to small sample sizes, data for LGBT+ people who are Asian or Pacific Islanders are not presented in this report.)

Data collection

The majority of surveys completed using the SSRS Opinion Panel (n=5,056) and all of the surveys completed using the KnowledgePanel (n=1,240) were self-administered web surveys. Panelists were emailed an invitation, which included a unique passcode-embedded link, to complete the survey online. In appreciation for their participation, panelists received a modest incentive in the form of a $5 or $10 electronic gift card. In addition to the self-administered web survey, n=146 surveys were completed by telephone with SSRS Opinion Panelists who are web reluctant.

Weighting

The data are weighted to represent U.S. adults ages 18 to 64. The data include oversamples of females ages 18 to 35 and females ages 36 to 64. Due to this oversampling, the data were classified into three subgroups: females 18 to 35, females 36 to 64, and males 18 to 64. The weighting consisted of two stages: 1) application of base weights and 2) calibration to population parameters. Each subgroup was calibrated separately, then the groups were put into their proper proportions relative to their size in the population.

Calibration to Population Benchmarks

The total sample for the Women’s Health Survey was balanced to match estimates of each of the three subgroups (females ages 18 to 35, females ages 36 to 64, and males ages 18 to 64) along the following dimensions: age; education (less than a high school graduate, high school graduate, some college, four-year college or more); region (Northeast, Midwest, South, West); and race/ethnicity (White non-Hispanic, Black non-Hispanic, Hispanic-born in U.S., Hispanic-born Outside the U.S., Asian non-Hispanic, Other non-Hispanic). The sample was weighted within race (White, non-Hispanic; Black, non-Hispanic; Hispanic; and Asian) to match population estimates. Benchmark distributions were derived from 2021 Current Population Survey (CPS) data. Although the LGBT+ sample in this survey is not weighted separately to match population benchmarks, the full sample is. Comparisons to the available demographic data for the LGBT population from the 2021 Behavioral Risk Factor Surveillance System (BRFSS) found the demographics from our sample closely align with the federal data source.

Margin of Sampling Error

The margin of sampling error, including the design effect for subgroups, is presented in Table 1 below. It is important to remember that the sampling fluctuations captured in the margin of error are only one possible source of error in a survey estimate and there may be other unmeasured error in this or any other survey.

The KFF Women’s Health Survey sample includes people of all genders; however, our sample design is more heavily focused on women. While our survey weights take this gender imbalance into account and we use additional data control measures to ensure the data we present are as reliable and as representative of the population as possible, some data points for certain subgroups with larger margins of error may be more heavily weighted by women than men. Caution should be exercised in interpreting findings among LGBT+ subpopulations due to smaller sample sizes and larger margins of error. Our issue briefs do not present data for subgroups where data limitations precluded us from developing reliable estimates.

Sample Sizes, Design Effects, and Margins of Error, by Demographic Groups
STATISTICAL SIGNIFICANCE

All statistical tests are performed at the .05 confidence level. Statistical tests for a given subgroup are tested against the reference group (Ref.) unless otherwise indicated. For example, White is the standard reference for race/ethnicity comparisons and private insurance is the standard reference for types of insurance coverage. Some breakouts by subsets have a large standard error, meaning that sometimes even large differences between estimates are not statistically different.

See the full 2022 KFF Women’s Health Survey methodology for more details. The full survey instrument is available upon request.

LGBT+ People’s Health Status and Access to Care

Published: Jun 30, 2023

Key Findings

Key Findings

The share of people in the United States who identify as LGBT+ has increased substantially in recent years, yet health disparities and health access-related challenges persist across multiple dimensions. While in some areas, the health experiences of LGBT+ people mirror those of their non-LGBT+ counterparts, studies have found that this population experiences certain challenges at higher rates. Understanding the health care needs and experiences of LGBT+ people, and where they differ from those who are not LGBT+, is therefore important for addressing barriers and facilitating access to care and coverage. This report, based on a nationally representative 2022 KFF survey, provides an analysis of the health experiences of self-identified LGBT+ adults in the U.S. compared to their non-LGBT+ counterparts. Key findings include:

Demographics, Coverage and Health Status

  • The demographics of the LGBT+ adult population were similar to non-LGBT+ adults with respect to gender, race/ethnicity, urbanicity, and working status, but a significantly greater share were younger.1 
  • Despite being a younger population, LGBT+ individuals were more likely to report being in fair or poor health and were managing chronic conditions and living with disabilities at higher rates than non-LGBT+ people.
  • LGBT+ people were less likely be privately insured and more likely to have Medicaid coverage than their non-LGBT+ counterparts, with similar shares uninsured.

Access to and Use of Care

  • LGBT+ people reported lower rates of having a usual source of care than their non-LGBT+ counterparts but reported wider use of telehealth visits.
  • The large majority of LGBT+ people saw a health care provider in the past two years, but a smaller share had a recent check-up or well-woman visit. The share in both cases is similar to those among non-LGBT+ people. Those who were uninsured were less likely than those with coverage to have seen a provider or had a check-up.
  • Uptake of health services differs by LGBT+ status in some cases. For example, LGBT+ people reported higher testing rates for sexually transmitted infections (STIs) and HIV, but lower uptake of pap smears. In addition, larger shares of LGBT+ people reported regularly taking prescription medications than non-LGBT+ people, despite being a younger population overall.
  • LGBT+ people reported needing mental health services over the past two years at much higher rates than non-LGBT+ people. Moreover, not all those who said they needed mental health services received them.
  • LGBT+ people, like non-LGBT+ people, commonly reported problems with health care costs impacting their ability to pay for basic necessities such as food, heat, and housing, among other challenges.
  • The majority of LGBT+ people assigned female at birth have used contraception at some point in their lifetime (70%) and over half do so for a reason other than preventing pregnancy. They were less likely than non-LGBT+ people to say they have ever been pregnant (40% compared to 70%).

Provider Interactions

  • LGBT+ people reported higher rates of discrimination during a health care visit compared to non-LGBT+ people.
  • LGBT+ people were also more likely to report a range of recent negative provider experiences, including having had a provider who did not believe they were telling the truth or suggested they were to blame for a health problem, among others. These experiences were most common among LGBT+ people who were women, younger, had low incomes, and/or reported a disability or chronic disease.


Issue Brief

Background

The share of people in the United States who identifies as LGBT+ has increased substantially in recent years, particularly among younger generations, yet health disparities and health access-related challenges persist across multiple dimensions. Understanding the health care needs and experiences of the more than 7% of LGBT+-identified people in the United States, including the one-in-five younger adults from Generation Z, is important for addressing barriers and facilitating access to care and coverage.

While in some areas, the health experiences of LGBT+ people mirror those of their non-LGBT+ counterparts, studies have found that this population experiences certain challenges at higher rates than those who identify as heterosexual and cisgender, challenges which intersect with factors beyond sexual orientation and gender identity to include race/ethnicity, class, nationality, and age, among other aspects of identity. Recognizing this, the National Institutes of Health (NIH) identified sexual and gender minorities as a “health disparity population” to encourage and support research in this area. Further, the Biden administration has taken multiple steps to address equity in the LGBTQ community, including with respect to data collection and health care, including issuing multiple executive orders in this area, announcing that the HHS Office for Civil Rights (OCR) would include gender identity and sexual orientation as it interprets and enforces the ACA’s prohibition against sex discrimination (Section 1557), opposing state actions aimed at limiting access to gender-affirming care for transgender and gender non-conforming people, adopting protections for LGBTQ+ youth and working to provide protections for health care workers delivering gender affirming care, and issuing a Federal Evidence Agenda on LGBTQI+ Equity, a “roadmap for federal agencies” regarding “data-driven and measurable [sexual orientation and gender identity] SOGI Data.”

Despite progress in researching these issues over the past decade and increased federal commitment, much population-based research still does not include measures of sexual orientation and gender identity, limiting the ability of policymakers, policy implementers, and researchers to assess national trends and disparities, and identify needed interventions. With this report, we add to the knowledge base in this area by analyzing nationally representative data from a 2022 KFF survey of 6,442 adults ages 18 to 64, including 958 LGBT+ people, conducted primarily online from May 10, 2022, to June 7, 2022. For this survey, LGBT+ people include those who identified their sexual orientation as lesbian, gay, bisexual, or “something else,” and those who identified their gender as transgender, non-binary, “other,” or whose reported gender does not correspond to their reported sex assigned at birth. See the Methodology for additional detail.

The survey collected data on a range of demographic characteristics and issues from general well-being to experiences engaging in the health system, use of preventive services including HIV and STI testing, reproductive health, and mental health. (See also our issue brief Mental Health Care Needs and Experiences Among LGBT+ People).

Demographics

The demographics of LGBT+ adults generally mirror those of non-LGBT+ adults in many ways, with age and income being notable exceptions (Figure 1).

  • LGBT+ adult demographics look similar to non-LGBT+ adults with respect to gender, race/ethnicity, urbanicity, and working status.
  • Yet LGBT+ adults are significantly younger, with almost two-thirds (62%) between the ages of 18 and 35 compared to 36% of non-LGBT+ adults.
  • LGBT+ people are also more likely than non-LGBT+ people to have lower incomes, with 44% of LGBT+ people earning less than 200% of the federal poverty level ($13,590 per year in 2022 for an individual) compared to 36% of non-LGBT+ people.
LGBT+ Adults Were Younger and Had Lower Incomes Than Their Non-LGBT+ Counterparts

Health Status

LGBT+ people were more likely to be in fair or poor health than non-LGBT+ people despite being a younger population overall (Figure 2).

  • One-quarter (25%) of LGBT+ people reported being in fair or poor health compared to 18% of non-LGBT+ people. This was especially common among LGBT+ people with low incomes2  and those covered by Medicaid.
  • There were no statistically significant differences by race/ethnicity or gender.
Nearly Two in Five LGBT+ People With Medicaid Reported Being in Fair or Poor Health

LGBT+ people were managing chronic conditions and living with disabilities that impact daily life at higher rates than non-LGBT+ people (Table 1).

  • Half (50%) of LGBT+ people reported that they had an ongoing health condition that requires regular monitoring, medical care, or medication, a higher share than non-LGBT+ people (45%).
  • Additionally, a larger share of LGBT+ people reported having a disability or chronic disease that keeps them from participating fully in work, school, housework, or other activities than non-LGBT+ people (25% v. 16%). There were also notable differences within the LGBT+ community.
    • LGBT+ adults between the ages of 45-64 reported markedly higher rates of ongoing conditions requiring care or medication than younger LGBT+ adults ages 18-44 (44% v. 70%).
    • A larger share of LGBT+ people ages 18-44 reported having a disability or chronic disease (26%) than non-LGBT+ people in this age range (12%) (data not shown in table).
    • LGBT+ people with Medicaid faced especially high rates of disability, which is one of the eligibility pathways into the program, compared to LGBT+ people with private insurance coverage (45% v. 15%).
Many LGBT+ People Reported Living with Ongoing Health Conditions or Disabilities

Insurance Coverage and Access to Care

A smaller share of LGBT+ people had private insurance (59%) and more had Medicaid coverage (21%) than their non-LGBT+ counterparts (64% and 16%, respectively), reflecting their lower incomes which were driven, at least in part, by being a younger population (Figure 3). Similar shares were uninsured.

A Larger Share of LGBT+ People Were Covered by Medicaid Than Non-LGBT+ People

Most LGBT+ people reported having a regular doctor or health care provider, though they were less likely to have one than non-LGBT+ people.

  • LGBT+ people reported lower rates of having a regular doctor or provider than their non-LGBT+ counterparts (72% v. 77%) (Figure 4). Research has found that having a usual source of care is associated with increased use of preventive care and better health outcomes.
  • Among LGBT+ people, rates were significantly lower for those ages 18-44 than those ages 45-64 (68% v. 86%) and among those who were uninsured (36%).
Seven in Ten LGBT+ People Reported Having a Regular Doctor or Health Care Provider

Nearly three-quarters (74%) of LGBT+ people with a usual source of care got that care at a doctor’s office, though one in five (20%) obtained their routine care at a clinic, such as a health department, health center, school clinic, urgent care center, or clinic inside a store or pharmacy. Smaller shares went to an emergency room or some other place (6%) (Figure 5). The type of location where care was received was similar among LGBT+ and non-LGBT+ people (data not shown in figure).

The Majority of LGBT+ People With a Usual Source of Care Obtained Their Health Care at a Doctor's Office

Telehealth has become an increasingly common way to access care, including among LGBT+ people, who reported higher use of telehealth visits over the past two years than did non-LGBT+ people (63% v. 53%) (Figure 6).

  • There were no statistically significant demographic differences among LGBT+ people who used telehealth in the past two years except for those who were uninsured, who reported lower rates of telehealth use (39%) than those with Medicaid (67%) or private insurance (64%). Similarly, non-LGBT+ people without insurance reported lower rates of telehealth use than those with Medicaid and private insurance (data not shown in figure).
  • About one in ten (9%) LGBT+ people reported using an online prescribing platform or app, such as Nurx, The Pill Club, Roman, or hims/hers to receive a prescription or health care service, similar to the share among non-LGBT+ people (6%) (data not shown in figure).
LGBT+ People More Likely Than Non-LGBT+ People to Have Had a Telehealth Visit in the Past 2 Years

Use of Health Care Services

More than nine in ten (93%) LGBT+ people saw a doctor or health care provider in the past two years but fewer than three-quarters (73%) of this group had a general check-up or well-woman visit3  in that period. Both findings were similar to the share among non-LGBT+ people (Table 2).

  • LGBT+ people who were uninsured were significantly less likely than those with health coverage (either Medicaid or private insurance) to have seen a provider (80% v. 94%) or had a wellness check-up in the past two years (57% v. 74%).
Most LGBT+ People Saw a Doctor or Health Care Provider in the Past 2 Years, but Fewer Have Had a Check-up

Use of preventive cancer screenings can lead to early identification of conditions when they are more responsive to medical interventions and potentially avert serious complications. While uptake of colonoscopies among LGBT+ people was similar to that of non-LGBT+, slightly higher shares of non-LGBT+ people reported having had a pap smear in the past two years than LGBT+ people (Figure 7).

  • Slightly smaller shares of LGBT+ people assigned female at birth4  ages 21-64 reported having had a pap smear in the past two years than their non-LGBT+ counterparts (54% v. 59%).
  • Forty-five percent of LGBT+ people ages 45-64 reported having had a colon cancer screening in the past two years, similar to non-LGBT+ people (37%).
Smaller Share of LGBT+ People Assigned Female at Birth Has Had a Pap Smear/Test in the Past Two Years Than Non-LGBT+ Counterparts

A higher share of LGBT+ people reported taking at least one prescription medication on a regular basis than non-LGBT+ people, despite being a younger population overall (62% v. 55%) (Figure 8).

  • As with non-LGBT+ people, prescription use among LGBT+ people increased with age.
    • However, the share of LGBT+ taking a prescription was higher across each age group, except those ages 45 to 64, when compared to non-LGBT+ people.
  • Looking at the youngest group, more than half (54%) of LGBT+ people ages 18 to 24 reported regularly taking a prescription compared to just over one-third (36%) of non-LGBT+ people in the same age group.
A Larger Share of LGBT+ People Regularly Takes a Prescription Medication Than Non-LGBT+ People Across Most Age Groups

Sexual and Reproductive Health

LGBT+ people reported higher rates of receiving testing for sexually transmitted infections (STIs) and for HIV than their non-LGBT+ counterparts, services that are recommended for early detection, treatment, and preventing transmission (Table 3).

  • However, uptake is still relatively low. Thirty-five percent (35%) of LGBT+ people ages 18-64 have been tested for HIV in the past two years, higher than the share of non-LGBT+ people (19%).
    • Among LGBT+ people, testing rates were highest among those ages18-44.
  • Nearly four in ten (37%) LGBT+ people ages 18-64 have been tested for an STI (other than HIV) such as chlamydia or herpes in the past two years, higher than the share of non-LGBT+ people (19%).
    • Among LGTB+ people, STI testing rates were also higher among those who were younger (43%).
Fewer Than Two in Five LGBT+ People Have Had an STI or HIV Test in the Past 2 Years, With Higher Rates Among Black LGBT+ People

The majority (70%) of LGBT+ people assigned female at birth5  have used contraception in their lifetime, compared to 77% of their non-LGBT+ counterparts, and most used more than one type of contraception across their lifetime (70%). Three in four (75%) sexually active reproductive-age (18-49) LGBT+ people assigned female at birth who were not pregnant reported using contraception in the past year. The share of LGBT+ people using contraceptives is largely driven by bisexual women.

  • Over half (55%) of LGBT+ reproductive-age people assigned female at birth who used contraception in the past year did so for a reason other than preventing pregnancy compared to 35% of their non-LGBT+ counterparts. This share includes the nearly one in five (18%) LGBT+ people who used contraception solely for a reason other than preventing pregnancy, like managing a medical condition or preventing an STI (Figure 9).
Over Half of Reproductive-Age LGBT+ People Assigned Female at Birth Use Contraception for a Reason Other Than Preventing Pregnancy

The share of LGBT+ reproductive-age people assigned female at birth had similar contraceptive method use patterns to non-LGBT+ females (Table 4).

  • However, larger shares of LGBT+ people said they used injectable contraception, contraceptive patches, contraceptive implants, and male condoms compared to non-LGBT+ females.
Reproductive-Age LGBT+ People Assigned Female at Birth Reported Using Certain Forms of Contraception More Commonly Than Non-LGBT+ Females

Across the lifespan, four in ten LGBT+ people ages 18-64 assigned female at birth have ever been pregnant compared to seven in ten non-LGBT+ females (Figure 10).

  • Lower shares of LGBT+ people said their pregnancies resulted in a birth, while higher shares said they have experienced a miscarriage compared to their non-LGBT+ counterparts.
Pregnancy Experiences Differ Between LGBT+ and Non-LGBT+ People

Mental Health

Two-thirds (67%) of LGBT+ people reported needing a mental health service over the past two years, compared to four in ten (39%) non-LGBT+ people (Figure 11). Surveys regularly find that LGBT+ people are more likely than non-LGBT+ people to experience mental health conditions such as depression and anxiety, which can result from ongoing experiences of discrimination, stigma, and violence.

  • Among LGBT+ people, self-reported need for mental health care was higher for those who were younger (ages 18-34) compared to those ages 35-64 and for those with Medicaid compared to those with private insurance (data not shown in figure but available in Mental Health Care Needs and Experiences Among LGBT+ People).
A Higher Share of LGBT+ People Report Needing Mental Health Services in the Past Two Years Than Non-LGBT+ People

While the reported need for mental health services was high among LGBT+ people, not all of those with a need for services sought or received them.

  • Sixty-five percent (65%) of LGBT+ people who reported needing a mental health service sought one, a higher share than among non-LGBT+ people (58%), but more than one-third (35%) did not (Figure 12).
Among Those Who Needed Care, Three-Quarters of LGBT+ People With Medicaid Sought Mental Health Care

For additional detail on mental health and LGBT+ people see our companion issue brief on this topic, Mental Health Care Needs and Experiences Among LGBT+ People.

Provider Interactions

LGBT+ people were more likely to report a range of negative provider experiences in the past two years compared to non-LGBT+ people. This may limit their willingness to seek care, which could be especially problematic for this group which has higher rates of certain health conditions compared to non-LGBT+ people. Negative interactions included having a provider not believe they were telling the truth, suggesting they were personally to blame for a health problem, assuming something about them without asking, or dismissing their concerns. LGBT+ people were more likely to report experiencing discrimination based on their age, gender, race, sexual orientation, religion, or some other personal characteristic during a health care visit (Figure 13).

  • Altogether, nearly half (45%) of LGBT+ people who had visited a health care provider in the past two years reported at least one of these negative experiences with a provider or during a health care visit, compared to one-third (33%) of non-LGBT+ people. LGBT+ people were twice as likely as non-LGBT+ people to report that they had been discriminated against during a health care visit over the past two years (12% v. 6%).
Larger Shares of LGBT+ People Reported Negative Experiences With Their Health Care Provider Than Non-LGBT+ People

Among LGBT+ people, these negative provider experiences were more commonly reported by women, younger groups, those with low incomes, and those with a disability or chronic disease. Large shares, in most cases more than half, of LGBT+ people in these groups reported having at least one of these negative provider experiences in the past two years (Table 5).

Half of LGBT+ People With a Disability or Chronic Disease Have Had a Negative Interaction With a Health Care Provider in the Past Two Years

Communication is an important component of health care quality but three in ten (29%) LGBT+ people said it is difficult to find a doctor who explains things in a way that is easy to understand, higher than the share of non-LGBT+ people (19%) (Figure 14).

  • LGBT+ people who were younger, low-income, and had Medicaid coverage or were uninsured had more difficulty finding a doctor who provides clear explanations than those who were older, higher income, or had private insurance.
LGBT+ People Were More Likely Than Non-LGBT+ People to Say it is Difficult to Find a Doctor who Provides Clear Explanations

Health Care Costs

LGBT+ people reported having problems with health care costs at similar rates as non-LGBT+ people, with nearly one-third (29%) of LGBT+ people and one-quarter (25%) of non-LGBT+ people reporting they or a household member had problems paying medical bills in the past 12 months (Figure 15). Given that LGBT+ people tend to be younger, have lower incomes, and have greater health needs, costs could be an outsized barrier to care for this group.

  • Among LGBT+ people, this challenge was especially acute for those who reported being in fair or poor health, with 42% saying they have had problems paying medical bills.
  • Not surprisingly, those with low incomes, the uninsured, and those in fair or poor health reported these challenges at higher rates than their counterparts but there were no statistically significant differences by gender.
More Than Half of Uninsured LGBT+ People Reported Trouble Paying Medical Bills in the Past Year

Medical bills have consequences on LGBT+ people’s financial well-being, including their ability to afford basic necessities.

  • Among the 29% LGBT+ people who reported having trouble paying medical bills in the past 12 months, six in ten (61%) said they used up all or most of their savings (Figure 16). About the same share said they had to set up a payment plan with a doctor or hospital (59%) or had difficulty paying for basic necessities (57%), and over half (53%) said they have been contacted by a collection agency, while 47% said they borrowed money from family or friends as a result of these bills. Non-LGBT+ people experience these consequences at similar rates.
Six in Ten LGBT+ People Who Have Had Problems Paying Medical Bills in the Past Year Used up All or Most of Their Savings

Conclusion

While in many cases LGBT+ people have similar health and health care experiences to non-LGBT+ people, we find some notable differences. For example, LGBT+ people’s self-reported health status was poorer than non-LGBT+ people, despite being a younger population. They also reported wider prescription usage, and younger LGBT+ people reported higher rates of disability than younger non-LGBT+ people. Additionally, LGBT+ people reported a higher need for mental health services, which could relate to ongoing experiences of stigma and discrimination. Indeed, LGBT+ people reported higher rates of discrimination during a health care visit and were more likely to report a range of recent negative provider experiences, most commonly among LGBT+ women, those who were younger, had low incomes, and reported a disability or chronic disease. These experiences suggest a gap in clinical attention and/or competency for reaching LGBT+ people, especially those with intersecting marginalized identities.

More broadly, while data collection on LGBT+ people is improving, particularly at the federal level, it is still not standard, and as such, knowledge gaps remain, including with respect to health status, health needs, and health care access. Lack of research in this area limits the ability of those in both policy and health care sectors to address health needs and disparities within the LGBT+ population. As efforts aimed at limiting LGBT+ people’s access to social institutions, including health care, increase, continuing to monitor the community’s well-being and responding to discrimination and health challenges is especially timely.

Methods

Methods

Data for this issue brief come from the 2022 KFF Women’s Health Survey, a nationally representative survey of 6,442 people of all genders ages 18 to 64, including 958 LGBT+ people, conducted from May 10, 2022, to June 7, 2022. The objective of the survey is to help better understand respondents’ experiences with contraception, potential barriers to health care access, and other issues related to reproductive health. The survey was designed and analyzed by researchers at KFF (Kaiser Family Foundation) and fielded online and by telephone by SSRS using its Opinion Panel, supplemented with sample from IPSOS’s KnowledgePanel.

The survey asked respondents which sex they were assigned at birth, on their original birth certificate (male or female). They were then asked what their current gender is (man, woman, transgender, non-binary, or other). Those who identified as transgender men are coded as men and transgender women are coded as women. While we attempted to be as inclusive as possible and recognize the importance of better understanding the health of non-cisgendered people, as is common in many nationally representative surveys, we did not have a sufficient sample size (n >= 100) to report gender breakouts other than men and women with confidence that they reflect the larger non-cisgender population as a whole. The data in our reproductive health analyses use the respondent’s sex assigned at birth (inclusive of all genders) to account for reproductive health needs/capacity (e.g., ever been pregnant) while other analyses use the respondent’s gender (inclusive of males and females).

For this survey, LGBT+ people include those who identified their sexual orientation as lesbian, gay, bisexual, or “something else,” and those who identified their gender as transgender, non-binary, “other,” or whose reported gender does not correspond to their reported sex assigned at birth.

Sample design

The majority of respondents completed the survey using the SSRS Opinion Panel (n=5,202), a nationally representative probability-based panel where panel members are recruited in one of two ways: (1) through invitations mailed to respondents randomly sampled from an Address-Based Sample (ABS) provided by Marketing Systems Group through the U.S. Postal Service’s Computerized Delivery Sequence. (2) from a dual-framed random digit dial (RDD) sample provided by Marketing Systems Group.

In order to have large enough sample sizes for certain subgroups (females ages 18 to 35, particularly females in the following subgroups: lesbian/gay/bisexual; Asian; Black; Hispanic; Medicaid enrollees; low-income; and rural), an additional 1,240 surveys were conducted using the IPSOS KnowledgePanel, a nationally representative probability-based panel recruited using a stratified ABS design. (Note that due to small sample sizes, data for LGBT+ people who are Asian or Pacific Islanders are not presented in this report.)

Data collection

The majority of surveys completed using the SSRS Opinion Panel (n=5,056) and all of the surveys completed using the KnowledgePanel (n=1,240) were self-administered web surveys. Panelists were emailed an invitation, which included a unique passcode-embedded link, to complete the survey online. In appreciation for their participation, panelists received a modest incentive in the form of a $5 or $10 electronic gift card. In addition to the self-administered web survey, n=146 surveys were completed by telephone with SSRS Opinion Panelists who are web reluctant.

Weighting

The data are weighted to represent U.S. adults ages 18 to 64. The data include oversamples of females ages 18 to 35 and females ages 36 to 64. Due to this oversampling, the data were classified into three subgroups: females 18 to 35, females 36 to 64, and males 18 to 64. The weighting consisted of two stages: 1) application of base weights and 2) calibration to population parameters. Each subgroup was calibrated separately, then the groups were put into their proper proportions relative to their size in the population.

Calibration to Population Benchmarks

The total sample for the Women’s Health Survey was balanced to match estimates of each of the three subgroups (females ages 18 to 35, females ages 36 to 64, and males ages 18 to 64) along the following dimensions: age; education (less than a high school graduate, high school graduate, some college, four-year college or more); region (Northeast, Midwest, South, West); and race/ethnicity (White non-Hispanic, Black non-Hispanic, Hispanic-born in U.S., Hispanic-born Outside the U.S., Asian non-Hispanic, Other non-Hispanic). The sample was weighted within race (White, non-Hispanic; Black, non-Hispanic; Hispanic; and Asian) to match population estimates. Benchmark distributions were derived from 2021 Current Population Survey (CPS) data. Although the LGBT+ sample in this survey is not weighted separately to match population benchmarks, the full sample is. Comparisons to the available demographic data for the LGBT population from the 2021 Behavioral Risk Factor Surveillance System (BRFSS) found the demographics from our sample closely align with the federal data source.

Margin of Sampling Error

The margin of sampling error, including the design effect for subgroups, is presented in Table 1 below. It is important to remember that the sampling fluctuations captured in the margin of error are only one possible source of error in a survey estimate and there may be other unmeasured error in this or any other survey.

The KFF Women’s Health Survey sample includes people of all genders; however, our sample design is more heavily focused on women. While our survey weights take this gender imbalance into account and we use additional data control measures to ensure the data we present are as reliable and as representative of the population as possible, some data points for certain subgroups with larger margins of error may be more heavily weighted by women than men. Caution should be exercised in interpreting findings among LGBT+ subpopulations due to smaller sample sizes and larger margins of error. Our issue briefs do not present data for subgroups where data limitations precluded us from developing reliable estimates.

Sample Sizes, Design Effects, and Margins of Error, by Demographic Groups
STATISTICAL SIGNIFICANCE

All statistical tests are performed at the .05 confidence level. Statistical tests for a given subgroup are tested against the reference group (Ref.) unless otherwise indicated. For example, White is the standard reference for race/ethnicity comparisons and private insurance is the standard reference for types of insurance coverage. Some breakouts by subsets have a large standard error, meaning that sometimes even large differences between estimates are not statistically different.

See the full 2022 KFF Women’s Health Survey methodology for more details. The full survey instrument is available upon request.

Endnotes

  1. The LGBT+ sample from the 2022 KFF Womenu2019s Health Survey includes 60% of whom are ages 18-34, which is younger than the non-LGBT+ sample but closely matches the U.S. Census Bureauu2019s Household Pulse survey data. ↩︎
  2. This survey defines low income as household income under 200% of the federal poverty level (FPL); higher income is 200% or more of the FPL. The federal poverty level (FPL) for an individual in 2022 was $13,590. ↩︎
  3. Survey respondents who reported being assigned female at birth were asked if they had either a general check-up or a well-woman visit. All others were asked if they had had a general check-up. ↩︎
  4. Questions related to reproductive capacity (e.g., ever been pregnant) are based on the respondentu2019s sex assigned at birth (inclusive of all genders) while other analyses use the respondentu2019s gender (inclusive of males and females). ↩︎
  5. Questions related to reproductive capacity (e.g., ever been pregnant) are based on the respondentu2019s sex assigned at birth (inclusive of all genders) while other analyses use the respondentu2019s gender (inclusive of males and females). ↩︎