Racial and Ethnic Health Disparities: Potential Implications of the Election

Published: Oct 17, 2024

Former President Trump and Vice President Harris have taken widely different stances and approaches on recognizing and addressing racial and ethnic disparities in health and health care. Former President Trump took executive action to prohibit federal agencies and contractors from providing training based on “divisive concepts” such as racism and sexism. As candidate, he has vowed to focus on “anti-White” racism, not racism against people of color. The Biden-Harris Administration has identified advancing racial equity as a federal priority, acknowledged that structural and systemic racism drive disparities, and recognized that social and economic factors play an important role in determining individuals’ health and well-being. Beyond these differences, variation in the candidates’ actions and proposals across different areas of health care, including health coverage, reproductive and maternal health, and immigrant health and well-being are likely to have important implications for future efforts to address health disparities as outlined below.

Health Coverage

Trump’s record as president included plans to repeal or weaken the Affordable Care Act (ACA) and cap and reduce federal Medicaid financing, while Vice President Harris has focused on efforts to “protect and strengthen Medicaid and the ACA.” Trump has said in the recent campaign that he’s not planning to repeal the ACA, though he has said he has “concepts” of a plan to replace it and would create a plan with “much better health care.” Although the Trump Administration never issued a detailed plan to replace the ACA, Trump’s budget proposals as president included plans to convert the ACA into a block grant to states, cap federal funding for Medicaid, and allow states to relax the ACA’s rules protecting people with preexisting conditions. Those plans, if enacted, would have reduced federal funding for health care by about $1 trillion over a decade, with trade-offs of higher out-of-pocket premiums for people, more uninsured, higher spending and greater risk for states, and restrictions in Medicaid eligibility. Under the Biden-Harris Administration, legislation was enacted that provided incentives for remaining non-expansion states to implement the ACA Medicaid expansion and provided enhanced subsidies for people to purchase Marketplace coverage. Harris has proposed making these enhanced subsidies permanent as they are currently set to expire at the end of 2025. Under the Biden-Harris Administration, there has been record ACA enrollment.

Future directions of ACA Marketplace and Medicaid coverage have important implications for racial and ethnic disparities in health coverage. Following the ACA health coverage expansions in 2014, there were large gains in coverage across racial and ethnic groups, which helped to narrow but not eliminate racial disparities in coverage (Figure 1). Continued efforts to increase access to coverage and improve continuity of coverage could further narrow these disparities. Conversely, coverage losses through the Marketplaces or Medicaid could reverse progress and widen disparities. Health coverage plays a key role in enabling people to access health care and protecting families from high medical costs.

Uninsured Rate Among the Nonelderly Population by Race and Ethnicity, 2010-2022

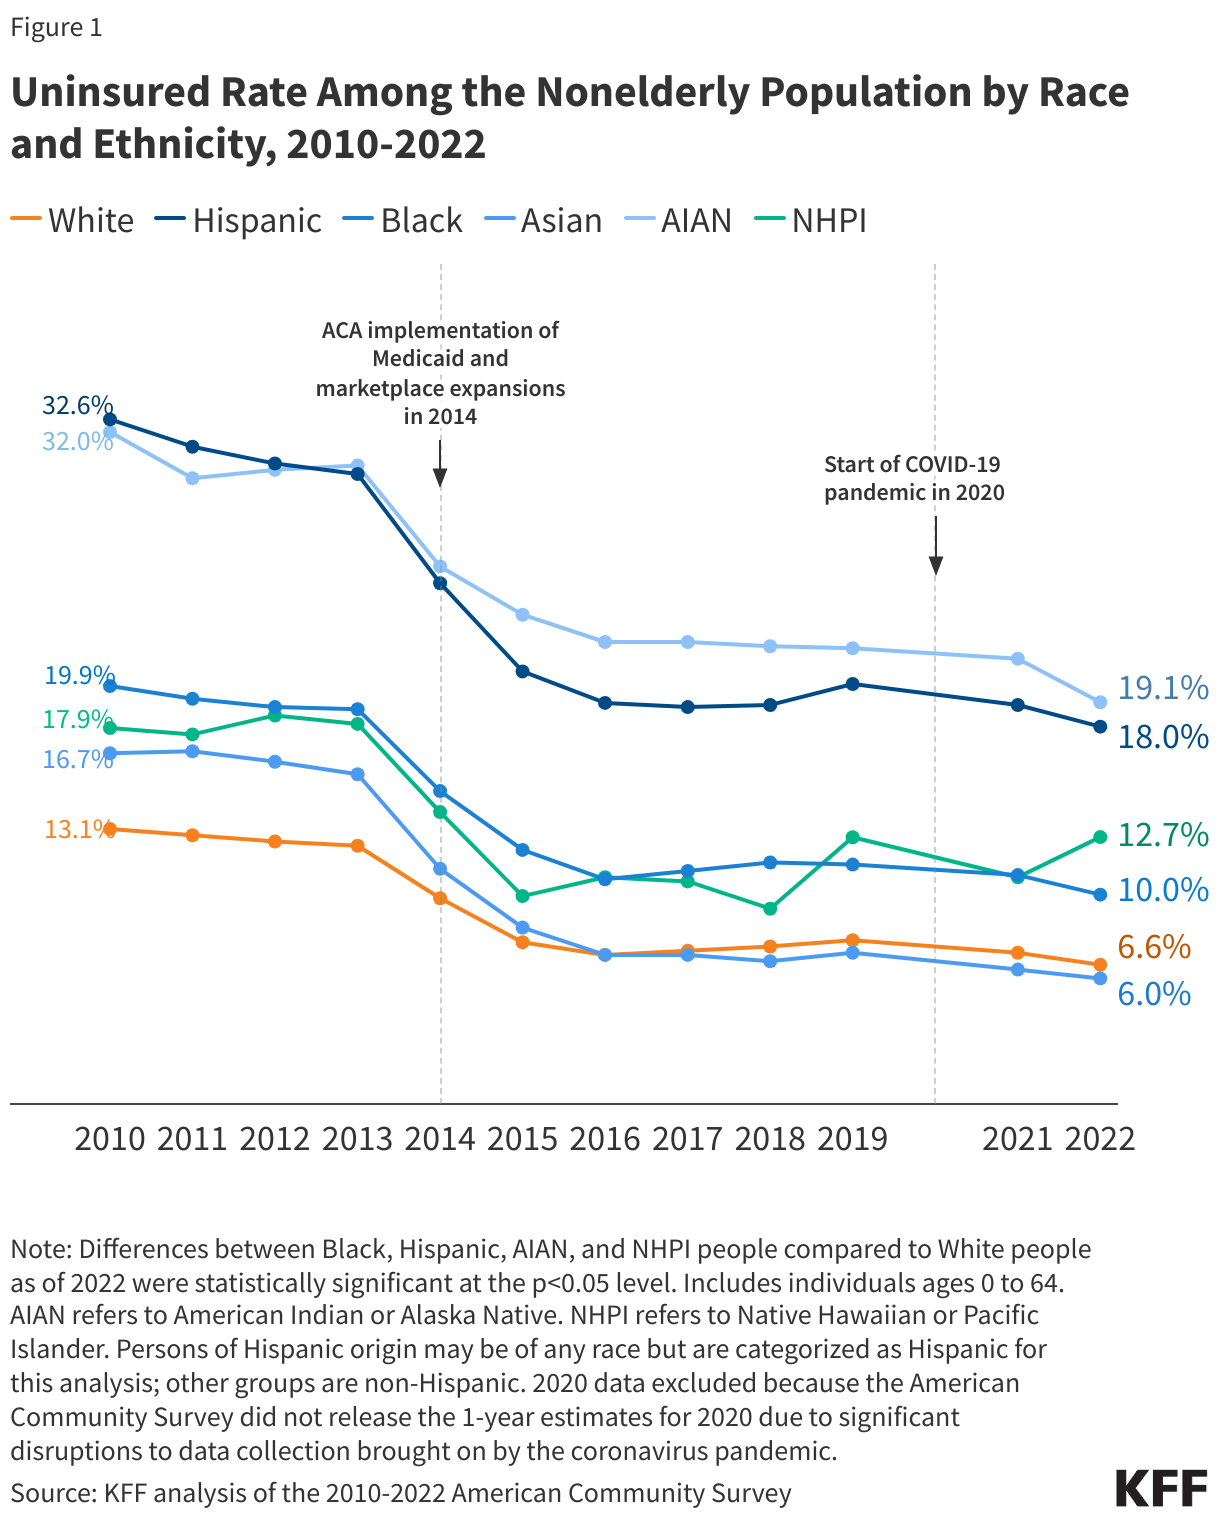
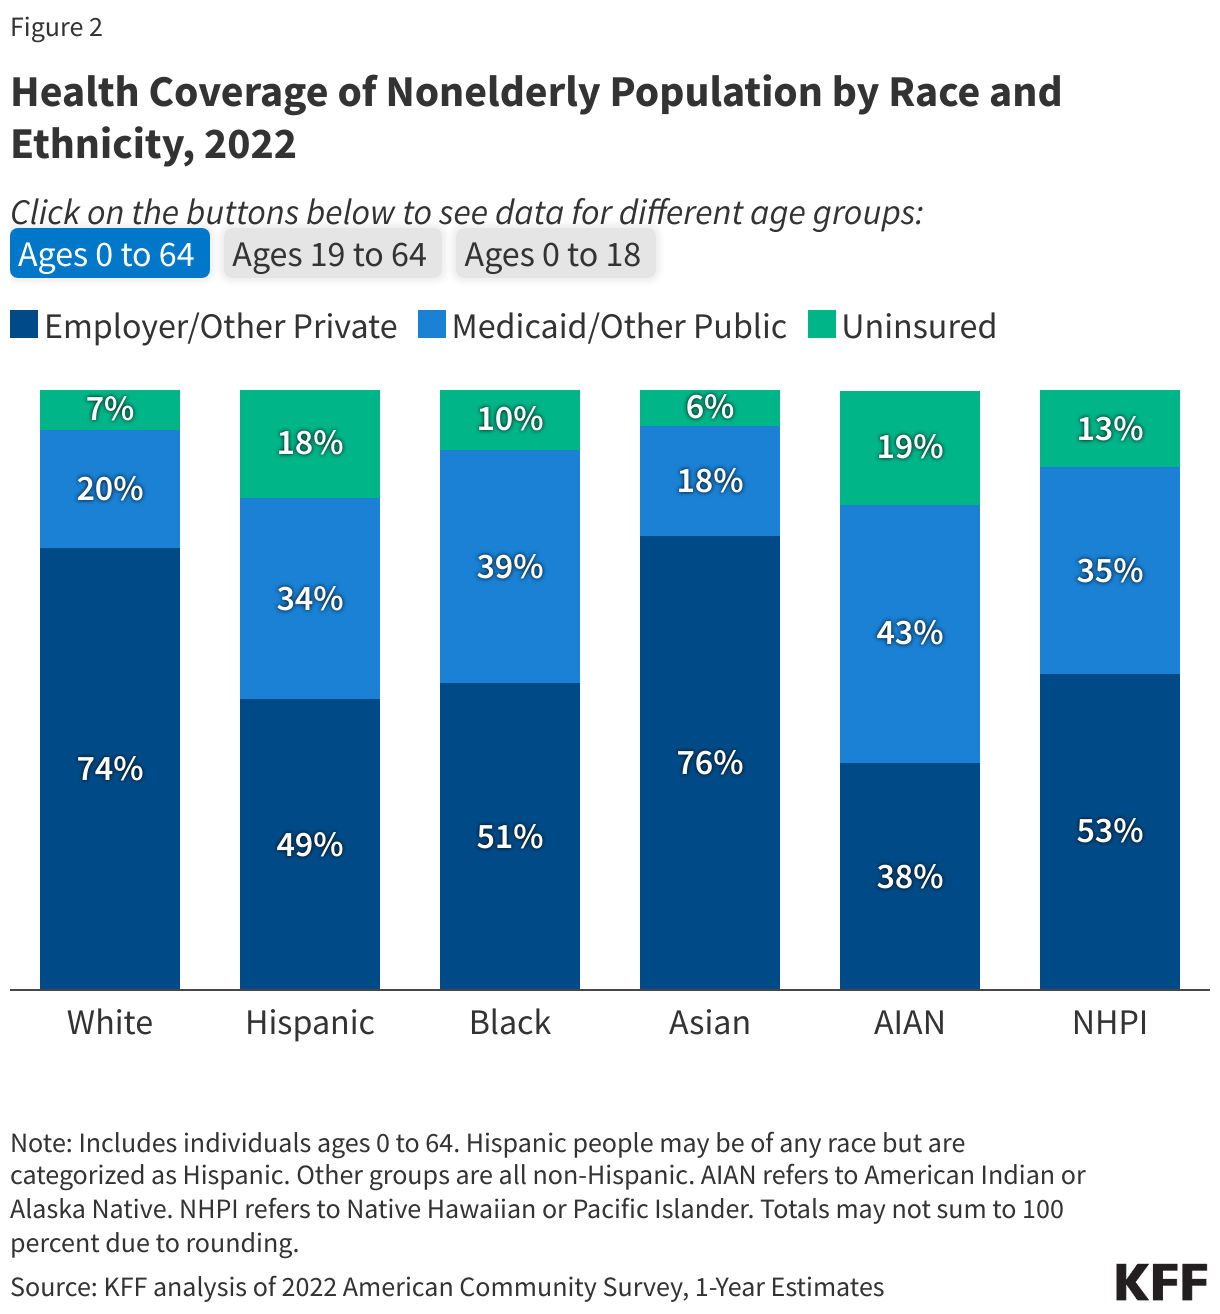
Changes to Medicaid may have particularly important implications for racial and ethnic health disparities given that it is a major source of health coverage for people of color. Medicaid helps to fill gaps in private coverage for many people of color, particularly children (Figure 2). Research suggests that ACA Medicaid expansion has contributed to a reduction in racial and ethnic disparities in health coverage. Adoption of the ACA Medicaid expansion in the remaining ten non-expansion states could continue to close coverage disparities. Nationally, over six in ten people in the coverage gap are people of color. Moreover, uninsured nonelderly Black people are more likely than White people to fall in the Medicaid “coverage gap” because a greater share live in states that have not implemented the Medicaid expansion.

Health Coverage of Nonelderly Population by Race and Ethnicity, 2022

Reproductive and Maternal Health

Vice President Harris has been and is an outspoken leader and advocate for reproductive freedom, while former President Trump has taken credit for the overturning of Roe v. Wade and has expressed support for letting states set their own abortion policy, including banning abortion. While abortion is the most prominent health care campaign issue, the election could also have large implications for contraceptive care and maternal health. Vice President Harris’ call for reproductive freedom includes access to contraception. The Trump Administration issued multiple regulations that restricted the availability of funding for contraception. During his campaign, he initially expressed that states could restrict access to contraceptives, but shortly afterwards, also said that he would not support this. As Senator, Vice President Harris sponsored the MOMNIBUS, a package of bills aimed at improving quality of and access to maternity care. Among other actions, under the Biden-Harris Administration, legislation was passed that allows states to extend Medicaid postpartum coverage from 60 days to 12 months. It also released a Maternal Health Blueprint that outlines future priorities. Former President Trump also issued a maternal health plan near the end of his term and signed federal legislation that provided funding for maternal mortality review committees.

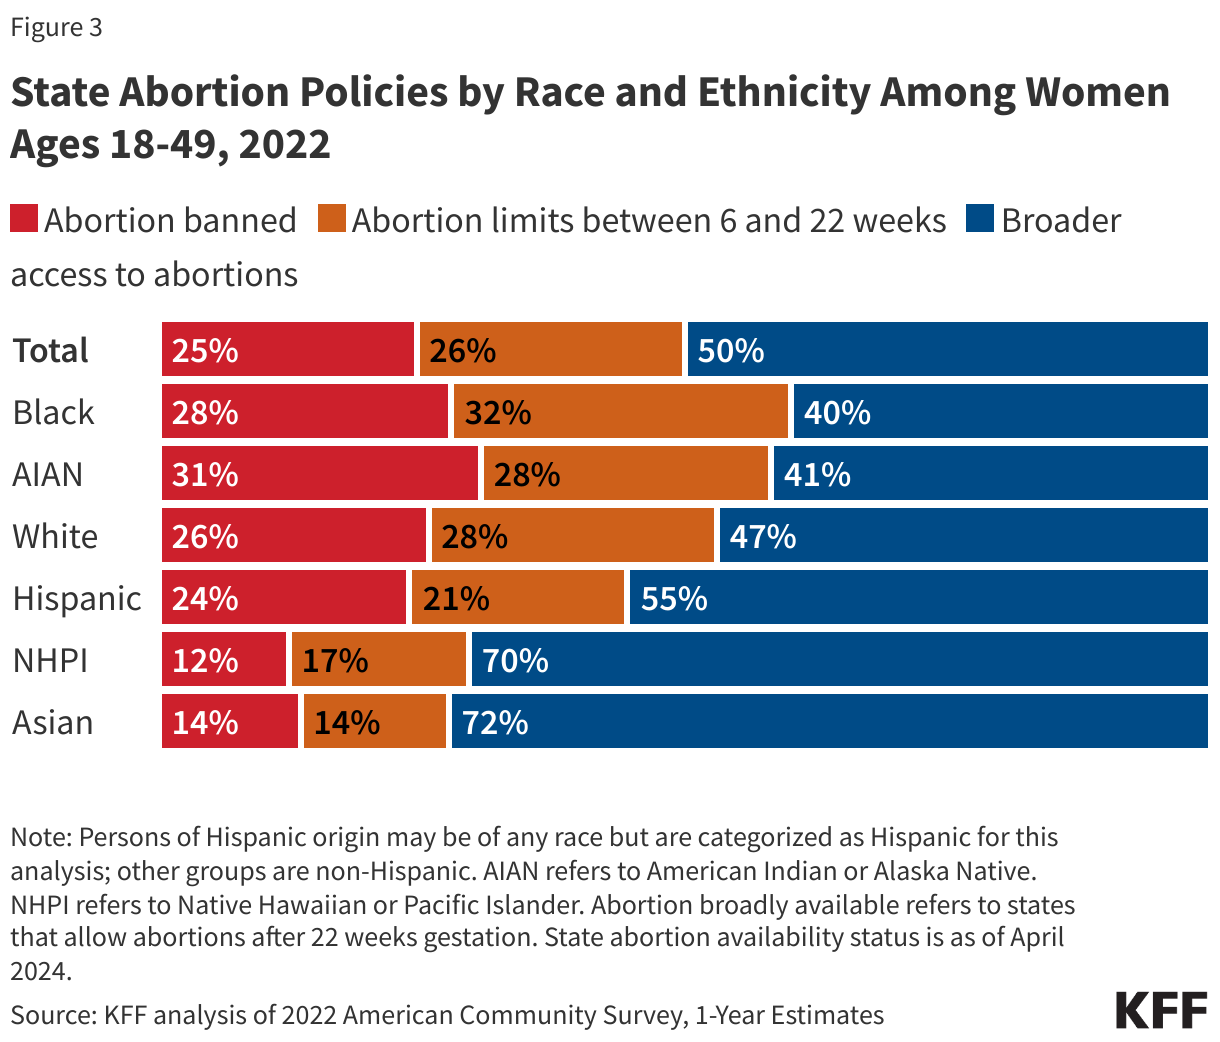
The outcome of the election may have important implications for abortion restrictions, which in turn, will likely impact racial and ethnic disparities in maternal health. Pregnancy-related mortality rates among American Indian and Alaska Native (AIAN) and Black women are over three times higher compared to White women. State restrictions on abortion in the wake of the overturning of Roe v. Wade may widen maternal health disparities. Six in ten Black and AIAN women of reproductive age live in states with bans or restrictions compared to just over half of their White counterparts (Figure 3). People of color also are more likely than their White counterparts to face structural barriers that make it difficult to travel out of state for an abortion.

State Abortion Policies by Race and Ethnicity Among Women Ages 18-49, 2022

Future directions of Medicaid coverage for pregnant women and family planning services as well as efforts to improve maternal health also may impact disparities. Medicaid covers about 4 in 10 births nationally, including more than two-thirds among Black and AIAN people. Nearly all states have implemented the option to extend postpartum coverage from 60 days to 12 months, facilitating more continuous coverage during this period. KFF research also has found that the ACA’s Medicaid expansion promotes continuity of coverage in both the prenatal and postpartum periods. Additionally, over half of the states have established programs that use Medicaid funds to cover the costs of family planning services for low-income women who remain uninsured, and Medicaid accounts for 75% of all publicly funded family planning. Moreover, many state Medicaid programs have implemented policies, programs, and initiatives to improve maternity care and outcomes, including expanding coverage for benefits such as doula care, home visits, and substance use disorder and mental health treatment; and using new payment, delivery, and performance measurement approaches.

Immigrant Health and Well-Being

As president and candidate, Trump pursued restrictive immigration policies and spread anti-immigrant rhetoric and misinformation; the Harris campaign has emphasized her tough on crime stance as a former attorney general of a border state and her support for stricter border security. During his presidential term, Trump implemented more restrictive enforcement policies, issued a proclamation suspending entry of immigrants into the United States unless they provided proof of health insurance, rescinded the Deferred Action for Childhood Arrivals (DACA) program, and made changes to public charge policies that newly considered the use of non-cash assistance programs, including Medicaid, to determine whether people could enter the U.S. On the campaign trail, he has promised to carry out the “largest domestic deportation” in American history and to end birthright citizenship for children of undocumented immigrants. He also has spread misinformation about immigrants, describing them as a source of crime, a burden for taxpayers, and a drain on government programs like Medicare and Social Security. The Biden-Harris Administration reversed the Trump Administration’s public charge changes and the proclamation that suspended entry of immigrants unless they provided proof of health insurance. It also extended Marketplace eligibility to DACA recipients in 2024.

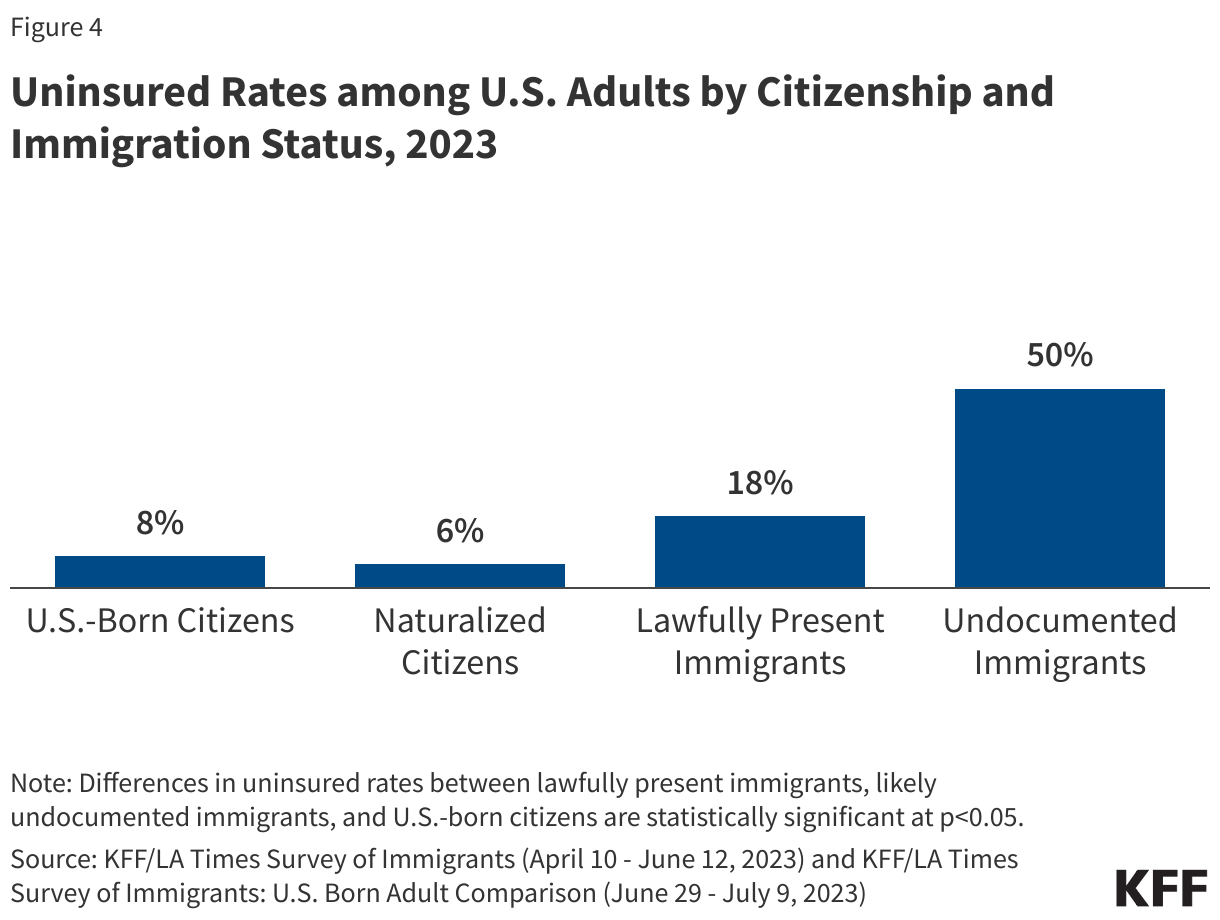
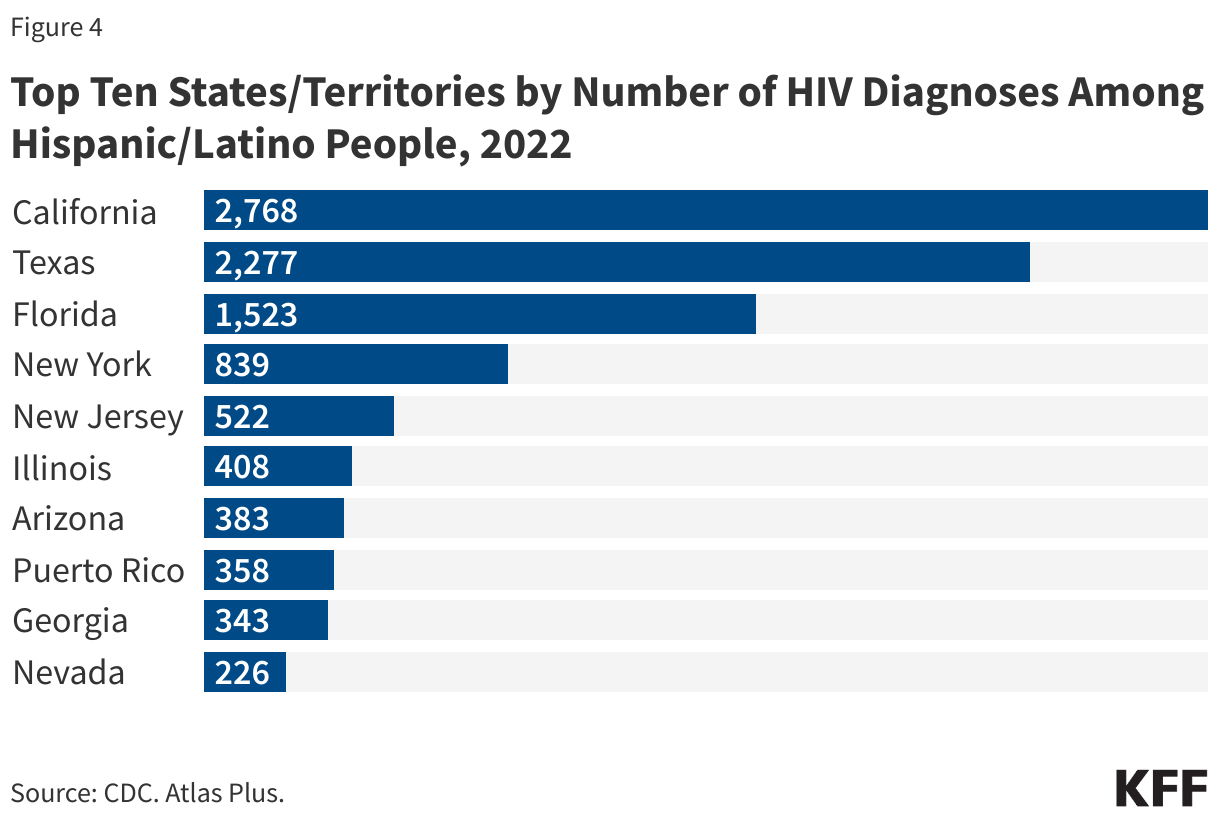
The future of immigration policies has important implications for the health and well-being of immigrants. Immigrants face large disparities in health and health care, including high uninsured rates, which reflect immigrant eligibility restrictions on health coverage programs funded by the federal government (Figure 4). Undocumented immigrants are prohibited from accessing federally funded programs, including Medicaid, Medicare, and the ACA Marketplaces, while many lawfully present immigrants are not eligible for these programs when they first arrive to the U.S. They also face barriers to care, including language access challenges, confusion about eligibility for health coverage and other public programs, and immigration-related fears. Earlier KFF analysis found that the policies and actions taken under the Trump Administration increased these fears, making immigrants more reluctant to access health coverage and care. Overall, research shows that immigrants use less health care and have lower health care costs than their U.S.-born counterparts, reflecting that they are younger and healthier and that they face greater barriers to care. Data also show that undocumented immigrants contribute billions in federal, state, and local taxes, with a sizeable share going toward programs that they cannot access, like Social Security and Medicare, and that they help subsidize health care for U.S.-born citizens

Uninsured Rates among U.S. Adults by Citizenship and Immigration Status, 2023

Understanding the Inequitable Impacts of Hurricanes and Other Natural Disasters in the Wake of Hurricanes Helene and Milton

Published: Oct 16, 2024

Extreme weather events used to be once in a century occurrences, but due to climate change, they have increased in both intensity and frequency. Hurricane Helene has claimed over 200 lives and is the deadliest hurricane to hit the continental U.S. since Hurricane Katrina. It is also projected to be one of the most expensive storms to hit the country. Hurricane Milton is one of the worst storms to hit Florida in over 100 years. The Biden-Harris Administration has mobilized resources to support the Federal Emergency Management Agency (FEMA), the Department of Defense and efforts to provide emergency assistance to families. At the same time, FEMA is facing ongoing misinformation and disinformation that may hamper response efforts. Amid recovery and response efforts, it’s important to recognize that hurricanes and other natural disasters have far-reaching impacts on health and well-being in their immediate aftermath and over the long-term. These impacts are uneven, with many groups who already face disparities in health and health care bearing the brunt of storms and other disasters. The uneven impacts reflect disparities in people’s risk of exposure to natural disasters; their ability to prepare for, evacuate from, and to recover from a natural disaster; and long-term impacts as discussed below.

Many of the same factors that contribute to health inequities leave some communities at higher risk of experiencing a natural disaster. Low income communities and communities of color are on the front lines of natural disasters and climate change. Due to historical residential segregation including redlining, people of color are more likely to live in neighborhoods that have worse infrastructure increasing their risk of harm and limiting their ability to prepare or safely shelter-in-place. In most states, homes in formerly redlined neighborhoods are more likely to be in flood zones, however in Florida more blue- and greenlined “desirable” neighborhoods have a higher risk of flooding due to proximity to the beach. Data on patterns of flooding associated with Hurricanes Helene and Milton are not yet available. Rural communities face challenges responding to natural disasters, ranging from physical isolation, high poverty rates, and limited access to health care as well as limited financial capacity.

The Southeast region of the U.S. is particularly vulnerable to severe tropical storms due to climate change, and its persistently high poverty rates inhibit residents’ ability to prepare for and recover from storms. Further, many of the states in the Southeast have not implemented the ACA Medicaid expansion, leaving lower income residents in those states with more limited access to health care, which may contribute to challenges addressing both immediate and longer term health needs. A significant proportion of people of color live in the South, with more than half of Black people residing in Southern states. Moreover, one study finds that Black communities are about twice as likely as other communities in the Southeast to experience a hurricane. It is estimated that, by 2050, homes owned by Black people in this region will be nearly twice as likely to be damaged by hurricanes compared to other communities.

Evacuation efforts for storms have highlighted disparities in peoples’ abilities to prepare for and evacuate in advance of major storms. About half of immigrants have limited English proficiency (LEP) and may face language barriers accessing evacuation and preparation resources. When Hurricane Beryl tore through Houston in 2024, significant portions of the city’s community with LEP felt unprepared as most emergency resources were written in Spanish and English but not other languages spoken by a large number of residents. Low-income communities, many of whom are people of color, are more likely to face financial challenges in preparing for natural disasters. A survey of Hurricane Harvey evacuees finds that people who evacuated spent on average between $1,200 to $2,300, accounting for lodging, transportation, food, and lost income.

There are also gaps in federal disaster management and response efforts. Research finds that recovery efforts are often inequitably distributed and favor White and wealthier communities over lower income communities and communities of color. In a KFF survey of Texas Gulf residents affected by Hurricane Harvey, six in ten affected Black residents reported feeling like they were not getting the help they needed to recover compared to a third of affected White residents. Further, a federal report finds that there were disparities in response efforts to Hurricane Harvey in Texas and Hurricane Maria in Puerto Rico, with Hurricane Harvey survivors receiving more aid faster compared to survivors of Hurricane Maria. The report also cited language barriers as a major issue that contributed to delays in people receiving aid and recovery support. Noncitizen immigrants are less likely to access recovery assistance programs than citizens, reflecting eligibility restrictions, immigration-related fears, and language barriers.

The impacts of hurricanes and other natural disasters are long-lasting. Research finds that hurricanes contribute to excess mortality years after they have passed, with Black people generally experiencing higher cumulative excess deaths compared to their White counterparts. In addition, major storms can increase the risk of illness and injury, disrupt infrastructure, and negatively impact the economy. For example, Hurricane Helene’s damage to a key manufacturer of IV solutions in North Carolina has led to a temporary supply disruption that will affect the broader U.S. medical system. Damage to infrastructure caused by storms can also compromise emergency response efforts, limit access to basic needs, and disrupt access to necessary health care and prescription medications. Storms can also have long-lasting mental health impacts. Data from a KFF survey of New Orleans residents who lived in the area during Katrina reported lingering stress and problems with their mental health due to the hurricane, ten years after the storm.

The federal government has taken steps to advance climate change adaptation and promote risk reduction and community resilience. For example, the Building Resilient Infrastructure and Communities initiative supports states, local governments, Tribes, and territories in designing projects to strengthen infrastructure and minimize risks before disasters occur. FEMA has developed a National Risk Index to identify locations most at risk for 18 natural hazards, adopted climate resilience building standards, and dedicated funding to support communities at risk for climate-related extreme weather events and other natural disasters. Research suggests that efforts at the local, state, Tribal, and federal levels are key to adapting to and mitigating the worsening impacts of climate change.

The Opportunities and Realities of Citizen-Initiated State Ballot Abortion Measures

Authors: Mabel Felix, Laurie Sobel, and Alina Salganicoff
Published: Oct 16, 2024

In its Dobbs decision, the Supreme Court wrote that it was returning the decision to restrict or protect abortion “to the people and their elected representatives.” Presidential candidate Trump claims credit for this decision and says that as a result, the “states are voting.” States are making decisions on abortion policy, but it’s mostly been state legislatures and state courts, not the voters, who have weighed in. Few states with abortion bans have a process for citizen-initiated constitutional amendments, including those that would protect the right to abortion. In this current election cycle, in those states, anti-abortion lawmakers and activists have utilized many different strategies in their efforts to block abortion measures from qualifying for the ballot or put roadblocks in their place.

The Challenging Path to the Ballot

Overall, a total of 10 states will vote on abortion measures this November; eight initiated by citizens and two referred by the legislature (Figure 1). Citizen-initiated ballot measures to amend a state’s constitution provide a direct pathway for the electorate to decide whether or not abortion should be legal in their state, regardless of how their elected representatives have approached abortion policy. This pathway is open only in 17 states. While there are a total of 10 states with abortion measures on the November ballot, (Figure 1), voters in five of these states will be voting on whether to invalidate their state’s abortion ban or early gestational restriction.

Abortion Will be On the Ballot in 10 States in November 2024

The stakes of having an abortion measure on the ballot are high for abortion rights supporters and opponents because every time abortion has been placed on the ballot since the Dobbs decision, the side favoring abortion has won. In states with abortion bans or restrictions and a process for citizens to propose constitutional amendments, lawmakers and anti-abortion activists have tried to hamper attempts to place measures on the ballot in a number of ways.

  • In Arizona, an anti-abortion group asked the court to remove the measure from the ballot, arguing that the language available to petition signers did not correctly convey the measure’s impact.
  • In challenges to the proposed abortion amendments in Nebraska and Missouri, opponents argued that the proposals violate the states’ rules that measures pertain to only one subject matter. In Missouri they also argued the petition did not specify which laws and constitutional provisions would be repealed if the amendment were approved by voters. The supreme courts of these states rejected these arguments and allowed the measures to remain on the ballot.
  • In South Dakota, a challenge seeking to disqualify the abortion ballot measure will not reach its conclusion before voters cast their ballots leaving open the possibility that the measure could be invalidated while votes are being cast. A trial at a county court will begin after early voting has commenced to determine the validity of the signatures collected. While voters will cast their votes for this constitutional amendment, if the state supreme court invalidates it, the constitution will not be amended even if the measure receives enough votes to pass.

Moving Goal Posts

  • In 2023, the Arkansas legislature passed a law requiring that constitutional amendment petitions obtain signatures from 50 of 75 counties in the state (up from the previous requirement of 15 counties).
  • Lawmakers in Florida, Missouri, and Oklahoma have introduced legislation to increase the percentage of the vote needed for constitutional amendment measures to pass, but none of these bills passed.
  • In 2023, ahead of an election where voters would weigh in on a constitutional amendment to protect the right to abortion, Ohio lawmakers placed a measure on the August ballot that would have increased the percentage of the vote needed for a Constitutional amendment ballot measure to pass from a simple majority to 60% and that would have increased the required number of counties from which campaigns need to gather signatures from 44 counties to all 88 in the state. Voters rejected the measure to raise the threshold and, in the November 2023 election, 57% of voters approved the abortion rights measure.
  • In 2022, the Arkansas legislature placed a constitutional amendment on the ballot that would have increased the percentage of the vote needed for ballot measures to pass to 60% (up from a simple majority), but as in Ohio, voters in Arkansas rejected the measure.
  • Similar approaches have been adopted in North Dakota and Arizona where this November, voters will cast their ballots on measures that would make it more difficult to get a citizen-initiated constitutional amendment on the ballot.

Using Biased Language in Ballot Materials

  • The Missouri Secretary of State drafted an incorrect summary of the measure for display at polling centers that would have stated the measure “will prohibit any regulation of abortion, including regulations designed to protect women undergoing abortions and prohibit any civil or criminal recourse against anyone who performs an abortion and hurts or kills the pregnant women.” Proponents of the measure filed a challenge against this summary and a judge struck it down and replaced it with an unbiased description.
  • In Arizona, the Republican-majority legislative council wrote an official ballot measure summary describing fetuses as “unborn human being[s],” which was initially blocked by a lower court, but ultimately upheld by the Arizona Supreme Court.
  • The Florida official financial impact statement for the ballot contains information unrelated to the financial impact of the amendment and speculates about future litigation on reproductive care, falsely implying that the amendment will block the state’s parental consent requirement.

Proposing Competing Initiatives

  • Months after Nebraska’s Protect the Right to Abortion constitutional initiative – which would protect the right to abortion up to viability – had been filed with the Nebraska Secretary of State, anti-abortion advocates introduced competing initiatives. The first, which did not receive enough signatures to appear on the ballot, would have amended the state constitution to define fetuses as persons. The second measure, which will appear on the November ballot, would amend the constitution to ban abortion after the first trimester. If the measure banning abortion after the first trimester and the measure protecting a right to abortion up to viability both pass, the one with most votes would be adopted.

Invalidating Signatures

  • After signatures for the proposed abortion measure were submitted, the Montana Secretary of State changed the rules for determination of acceptable signatures, reclassifying some registered voters as “inactive” and making these signatures unacceptable to be counted toward the total. Proponents of the measure sued to block these changes and won the case, allowing the signatures of newly deemed “inactive” voters to be counted.
  • The Arkansas Secretary of State refused to qualify a proposed measure that would have protected the right to abortion up to 20 weeks LMP, citing lack of compliance regarding paid signature gatherers. This decision was appealed by ballot measured proponents, but the Arkansas Supreme Court upheld this decision, and the initiative failed to make it to the voters.

Citizen-initiated campaigns to amend a state’s constitution can be very costly, especially when litigation is involved. When proponents of these amendments are blocked from placing them on the ballot after months of gathering signatures and campaigning, starting over again may not be financially feasible. It could be difficult to find anew the kind of financial support these petitions need to succeed and in the intervening time, the state legislature could change the rules for citizen initiatives to make amending the constitution even more difficult.

The Wording of the Constitutional Amendment Matters

Even when abortion rights measures pass, some abortion restrictions may remain, making the language of the constitutional amendment and how the state supreme court interprets it an additional important factor in shaping abortion access in the state. For instance, although the 2023 Ohio Reproductive Freedom Amendment prohibits any state laws that “burden, penalize, prohibit, interfere with or discriminate” against abortion care and abortion providers, Ohio laws limiting state Medicaid coverage of abortion, requiring parental consent, and a 22-week LMP gestational limit are still in effect. A state trial court recently blocked Ohio laws that had required a 24-hour waiting period, two in-person visits, and the state-mandated information before providing an abortion, ruling that these laws violate the Reproductive Freedom Amendment. However, this case has been appealed and the ultimate decision rests with the state’s supreme court, which currently has a 4-3 Republican majority. The court could change after the November election in which 3 seats are being contested. However, many voters are not knowledgeable about their state supreme court judges or their positions on abortion. There are 18 states holding elections for their supreme court this year. Two states (Ohio and Michigan) could see a partisan majority flip as a result of this election and other states that have nonpartisan races could also see an ideological shift in their supreme court as a result of the election.

Citizen-Proposed Constitutional Amendments Not an Option in Many States Where Abortion is Banned

Only 2 Remaining States with Abortion Bans or Early Gestational Limits Allow for Citizen Initiatives

Thirteen states with abortion bans or earlier gestational limits do not have a citizen initiative process to amend their constitutions. In these states, citizens cannot directly vote on their state abortion laws beyond electing legislators that support abortion rights or relying on changes in the ideological orientation of their state Supreme Courts. In some of these states, citizens may file legal challenges against abortion laws in hopes that the state supreme court will invalidate them and interpret the state constitution as protective of the right to abortion. However, the South Carolina, Idaho, and Iowa state supreme courts have recently ruled that there is no right to abortion and three statesLouisiana, Tennessee, and West Virginiaamended their state constitution to explicitly state it does not protect a right to abortion.

The 2024 election could be unique in its impact on state abortion laws. If all the measures protecting abortion pass this November, the only remaining states that allow citizen initiatives and ban abortion will be Oklahoma, and Arkansas. Citizen initiatives are also permitted in North Dakota, where a lower court recently struck down the state’s abortion ban. If the Supreme Court of North Dakota reverses the lower court’s ruling, proponents of abortion rights could try to place a constitutional amendment on a ballot at a future date.

The U.S. Government and Global Health

Published: Oct 15, 2024

This fact sheet does not reflect recent changes that have been implemented by the Trump administration, including a foreign aid review and restructuring. For more information, see KFF’s Overview of President Trump’s Executive Actions on Global Health.

Key Facts

  • U.S. government (U.S.) global health efforts aim to help improve the health of people in low- and middle-income countries while also contributing to broader U.S. global development goals, foreign policy priorities, and national security concerns.
  • The U.S. has been engaged in international health activities for more than a century and today is the largest funder and implementer of global health programs worldwide.
  • Many different U.S. government departments and agencies, congressional committees, and funding streams are involved in these efforts.
  • Through both bilateral programs and multilateral engagement, the U.S. supports activities that address a range of global health challenges (including but not limited to HIV, malaria, family planning and reproductive health, maternal and child health, and global health security) in approximately 80 countries.
  • Total U.S. global health funding through regular appropriations was approximately $12.3 billion in FY 2024, up from $5.4 billion in FY 2006; additionally, supplemental funding has been provided in response to emergencies, such as Ebola, Zika, and the COVID-19 pandemic, in certain years.

Why Is the U.S. Engaged in Global Health?

U.S. global health efforts aim to help improve the health of people in developing countries while also contributing to broader U.S. global development goals (e.g., advancing a free, peaceful, and prosperous world), foreign policy priorities (e.g., promoting democratic institutions, upholding universal values, and promoting human dignity), and national security concerns (e.g., protecting Americans from external threats, sustaining a stable and open international system).1  For these reasons, the U.S. government has been engaged in international health activities for more than a century and today is the largest funder and implementer of global health programs worldwide. The U.S. global health response – a key component of the U.S. international development portfolio, accounting for about 17% of the international affairs budget2  – is a multi-pronged, multi-billion dollar investment that targets a myriad of global health challenges, countries, and stakeholders. Efforts involve many different U.S. government departments and agencies, congressional committees, and funding streams.

What Is the U.S. Role?

The U.S. role in global health is multifaceted. The U.S. government:

  • acts as a donor by providing financial and other health-related development assistance (e.g., commodities, like contraceptives, or bed nets for protection from disease-carrying mosquitoes) to low- and middle-income countries;
  • operates programs and delivers health services;
  • provides technical assistance and other capacity-building support;
  • participates in major international health organizations through global health diplomacy and other efforts;
  • conducts research;
  • supports international responses to disasters and other emergencies; and
  • partners with governments, non-governmental groups, and the private sector.

What Agencies and Departments Are Involved?

The U.S. engagement in global health is largely carried out by executive branch departments and agencies (see organization chart below), but the legislative branch also plays an important role.

This figure is a visual representation of the "Organization of U.S. Global Health Efforts." It is seperated between Congress and the White House (which branches off into USAID, State, and HHS).


Executive Branch

Day-to-day, U.S. global health activities are administered through arms of the government, including: the White House through its National Security Council (NSC), which acts to coordinate national security and foreign policy decisions across federal agencies, with staff focused on development, global health, and humanitarian response as well as global health security and biodefense, along with the White House’s Office of Pandemic Preparedness and Response Policy (OPPR) and Office of Science and Technology Policy (OSTP); the Department of State through its new Bureau for Global Health Security and Diplomacy (GHSD), which coordinates the Department’s work on global health security and HIV, including PEPFAR, as well as provides diplomatic support (through U.S. Ambassadors and others) in implementing U.S. global health efforts; the U.S. Agency for International Development (USAID), which leads U.S. international development assistance and implements U.S. global health programs including through its Bureau for Global Health; and Department of Health and Human Services (HHS) operating divisions, particularly the Centers for Disease Control and Prevention (CDC), which works to prevent, detect, and respond to disease threats around the world including through its Center for Global Health, and the National Institutes of Health (NIH), which conducts behavioral and biomedical science research, including global health research, on diseases and is the largest public funder of biomedical research in the world. Additionally, the HHS Office of Global Affairs leads the department’s engagement with bilateral and multilateral partners.

Legislative Branch

Congress introduces, considers, and passes global health-related legislation; oversees global health efforts; authorizes and appropriates funding; and confirms presidential appointees to key U.S. global health positions. See the KFF primer on Congress and global health.

What Types of Efforts Are Supported?3 

The U.S. government supports a wide array of bilateral and multilateral global health efforts in countries around the world, partnering with numerous community and private sector organizations, as well as other governments and international and multilateral organizations, to carry out its global health activities:

Bilateral Efforts

U.S. bilateral (two-party; country-to-country; U.S. support that is for the benefit of another country and is provided to a government, NGO, or other group for this purpose) programs provide direct support to approximately 80 low- and middle-income countries and typically operate in a particular set of countries with their own budgets, staff, strategies, objectives, and monitoring and evaluation practices; they often involve multiple U.S. agencies/departments.4  See “What Are the Major Programs?” below.

Multilateral Efforts

U.S. support for multilateral (multi-country, usually through an international organization involving or supported by multiple governments; U.S. support provided to a multilateral organization is channeled to support programs in or benefitting other countries) global health efforts includes:

  • making financial contributions to international organizations (e.g., Gavi, the Vaccine Alliance [Gavi], and the Global Fund to Fight AIDS, Tuberculosis and Malaria [the Global Fund]) and United Nations agencies (e.g., the United Nations Children’s Fund [UNICEF]);
  • serving as a member-nation of large multilateral health organizations (e.g., the World Health Organization [WHO] – see the KFF fact sheet);
  • participating in multilateral governance (e.g., as a Board member of an organization);
  • serving as signatory to international health standards, treaties, and agreements;
  • providing technical assistance to international organizations; and
  • providing additional staff capacity to international organizations (by detailing U.S. government employees to these organizations for periods of time).

What Are the Major Programs?

HIV/PEPFAR

While the U.S. first provided funding to address the emerging global HIV epidemic in 1986, funding and attention has increased significantly in the last decade, particularly following the 2003 announcement of the President’s Emergency Plan for AIDS Relief (PEPFAR) by President Bush. PEPFAR’s launch led to a major increase in U.S. support for HIV prevention, treatment, and care efforts, as well as contributions to the Global Fund, the Joint United Nations Programme on HIV/AIDS (UNAIDS), and the International AIDS Vaccine Initiative (IAVI). The Department of State’s U.S. Global AIDS Coordinator oversees this government-wide effort, which is implemented by USAID, CDC, and other agencies.5  See the KFF fact sheet on the global HIV/AIDS epidemic, the KFF fact sheet on U.S. PEPFAR efforts, and the KFF fact sheet on the U.S. and the Global Fund.

Tuberculosis (TB)

USAID began its global TB control program in 1998, and since that time, the U.S. response has grown, particularly expanding after 2003 when the U.S. government’s commitment to addressing TB was highlighted as part of PEPFAR. Today, led by USAID and implemented by and involving several agencies, U.S. TB efforts focus on diagnosis, treatment, and control of TB (including multi-drug resistant and extensively drug-resistant TB [MDR/XDR TB]) and on research. The U.S. is also a donor to the Global Drug Facility of the Stop TB Partnership, a global network of public and private entities working to eliminate TB.6  See the KFF fact sheet on U.S. TB efforts.

Malaria/PMI

Engaged in malaria work since the 1950s, the U.S. supports malaria efforts through the President’s Malaria Initiative (PMI, launched in 2005) as well as other activities, including research. PMI programs, overseen by USAID’s U.S. Global Malaria Coordinator and implemented by USAID and CDC, center on expanding coverage of six key high-impact interventions: diagnosis of malaria and treatment with artemisinin-based combination therapies (ACTs), entomological monitoring, intermittent preventive treatment in pregnancy (IPTp), indoor residual spraying (IRS) with insecticides, insecticide-treated mosquito nets (ITNs), and seasonal malaria chemoprevention (SMC). See the KFF fact sheet on PMI and other U.S. malaria efforts.

Neglected Tropical Diseases (NTDs)

Having historically engaged in NTD efforts through research and surveillance, the U.S. expanded its response by launching the USAID NTD Program in 2006, which aimed to reduce the prevalence of seven NTDs (ascariasis or roundworm, hookworm, trichuriasis or whipworm, lymphatic filariasis or elephantiasis, onchocerciasis or river blindness, schistosomiasis or snail fever, and trachoma) through integrated treatment programs using mass drug administration (MDA), and the U.S. NTD Initiative in 2008, which aimed to intensify efforts and increase funding for activities across the U.S. government. Efforts are led by USAID and involve CDC, the National Institutes of Health (NIH), and other agencies. See the KFF fact sheet on U.S. NTD efforts.

Family Planning/Reproductive Health (FP/RH)

The U.S. has been engaged in international research on FP and population issues as well as other FP/RH efforts, including the purchase and distribution of contraceptives in developing countries, since the 1960s. Today, led by USAID and involving several agencies, U.S. FP/RH activities are designed to decrease the risk of unintended pregnancies and maternal and child mortality through effective interventions, including contraception, counseling, and post-abortion care. See the KFF fact sheet on U.S. FP/RH efforts and the KFF fact sheet on statutory requirements and policies related to these efforts.

Maternal and Child Health (MCH)

The U.S. has been involved in efforts to improve MCH since the 1960s. Today, led by USAID and involving several agencies, U.S. MCH activities aim to: improve equity of access to and use of services by vulnerable populations; bring to scale a range of high impact interventions that mitigate maternal, newborn, and under-five deaths; prevent and address the indirect causes of such deaths (such as HIV, TB, and malaria); strengthen integration of maternal health services with FP; and strengthen health systems. Additionally, some water, sanitation, and hygiene (WASH) activities are part of the environmental health efforts within the USAID MCH program. The U.S. is also a donor to global organizations addressing MCH, like Gavi; UNICEF; and the Global Polio Eradication Initiative (GPEI). See the KFF fact sheet on U.S. MCH efforts, the KFF fact sheet on U.S. polio efforts, and the KFF fact sheet on the U.S. and Gavi.

Nutrition/Feed the Future

For more than 40 years, USAID has been involved in nutrition efforts, aiming to prevent undernutrition through interventions such as nutrition education, nutrition during pregnancy, exclusive breastfeeding, and micronutrient supplementation.7  USAID’s nutrition efforts are coordinated with the U.S. Feed the Future Initiative (FtF, launched in 2009), which aims to address global hunger and food security and is led by USAID with several U.S. government agencies including the U.S. Department of Agriculture. See the KFF fact sheet on U.S. MCH efforts (which includes U.S. nutrition efforts).

Global Health Security

While the U.S. government has supported global health security (GHS) work for more than two decades, its involvement has expanded over time, with attention to these efforts growing significantly due to the COVID-19 pandemic. Meant to reduce the threat of emerging and re-emerging diseases by supporting preparedness, detection, and response capabilities worldwide, U.S. GHS efforts are primarily carried out by the White House, USAID, CDC, the Department of Defense (DoD), and the Department of State. The U.S. has also played a key role in development of the “Global Health Security Agenda (GHSA),” an international partnership launched in 2014 and now involving more than 70 countries and international organizations. Through the GHSA, U.S. government agencies work with host governments and partners to help countries make measurable improvements in capabilities to detect and respond to emerging disease events and achieve global health security targets. Further, in 2022 the U.S. was an early supporter and is the largest funder of the Pandemic Fund, a multilateral global financing mechanism that aims to help countries build their capacity to prevent, prepare for, and respond to epidemics and pandemics. See the KFF brief on the U.S. GHS efforts.

Where Do These Programs Operate?

U.S. global health efforts are carried out in approximately 80 countries through bilateral support to countries or through regional programs.8  The majority of countries reached through bilateral support are located in sub-Saharan Africa (35 countries), followed by the Western Hemisphere (16 countries), East Asia and Oceania (11 countries), South and Central Asia (9 countries), Europe and Eurasia (4 countries), and Middle East and North Africa (4 countries) (see the KFF tracker on U.S. global health programs by country and region). Additional countries are reached indirectly through U.S. contributions to multilateral organizations. The U.S. typically operates multiple global health programs in most of the countries. While more support is generally directed to countries facing a higher burden of disease, other factors influencing where U.S. health assistance is directed include the presence of willing and able partner governments; a history of positive relations and goodwill with host countries; strategic and national security priorities; funding; and personnel availability.9 

How Much Funding Is Provided?10 

The U.S. is the largest donor to global health in the world, and its investment in global health has grown significantly since the early 2000s.11  However, since FY 2010, U.S. funding for global health has remained relatively flat, with spikes in some years due to emergency supplemental funding for disease outbreaks (see figure below). Key highlights and funding trends include (also see KFF’s U.S. global health budget tracker and fact sheets):

  • funding for global health is channeled through multiple agencies and programs; most funding is provided by Congress to the Department of State (largely because most PEPFAR funding is channeled through the department), followed by USAID, HHS, and DoD;12 
  • the majority of U.S. funding for global health (around 80%) is captured under the Global Health Programs account, with an additional $1-2 billion per year for global health activities provided through other accounts;
  • most U.S. global health funding goes to HIV programs, which have received the most funding of any U.S. global health program since FY 2001 and have historically accounted for approximately half of total funding through regular appropriations;
  • most funding (approximately 80% in the last decade) is provided bilaterally with the remainder provided to multilateral organizations, such as the Global Fund and Gavi (see the KFF brief on U.S. multilateral global health engagement);13  and
  • most U.S. global health funding designated for specific country and regional efforts is allocated to sub-Saharan Africa, followed by South and Central Asia, the Western Hemisphere, East Asia and Oceania, the Middle East and North Africa, and Europe and Eurasia.14 
U.S. Global Health Funding (in billions), FY 2006 - FY 2025 Request
  1. USAID website, “Mission, Vision and Values,” webpage, https://www.usaid.gov/about-us/mission-vision-values; U.S. Department of State and USAID, Joint Strategic Plan FY2022-FY2026, March 2022. White House, National Security Strategy, October 2022. ↩︎
  2. KFF analysis of the FY 2025 International Affairs Congressional Budget Justification. This percentage is the share of State and USAID global health funding provided through the International Affairs account (including Function 150, 300, and 800 accounts). ↩︎
  3. KFF global health policy fact sheets, https://modern.kff.org/topic/global-health-policy/?s=&fs%5Bcustom_date_range%5D%5B%5D=&fs%5Bcustom_date_range%5D%5B%5D=&fs%5Bpost_type%5D%5B%5D=fact-sheet&layout=list. ↩︎
  4. KFF analysis of FY 2023 country level data in the U.S. Foreign Assistance Dashboard website, ForeignAssistance.gov, accessed June 2024. Includes countries receiving bilateral global health funding through the Global Health Programs (GHP), Economic Support Fund (ESF), and Development Assistance (DA) accounts. Due to the unique nature of the program, funding provided through the Food for Peace (FFP) account at USAID is not included in this analysis. The U.S. Foreign Assistance Dashboard does not break out bilateral funding for NTDs. As such, this analysis includes countries supported by USAID’s NTDs and programs as reported by USAID’s “Where we work” page accessed https://www.neglecteddiseases.gov/where-we-work and through personal communication with USAID. Additional countries may be reached through regional programs. ↩︎
  5. Other agencies and departments involved include the National Security Council (NSC), National Institutes of Health (NIH), Health Resources and Services Administration (HRSA), U.S. Food and Drug Administration (FDA), Peace Corps, and Departments of Labor, Commerce, and Defense (DoD). ↩︎
  6. Stop TB Partnership website, www.stoptb.org/. ↩︎
  7. USAID, “Nutrition,” webpage, https://www.usaid.gov/global-health/health-areas/nutrition. ↩︎
  8. Reflects U.S. global health programs by country and region as identified in FY 2023 planned funding data from ForeignAssistance.gov for all global health programs, with the exception of Neglected Tropical Diseases (NTDs), whose countries were identified through the FY 2023 USAID NTD fact sheet and personal communication with USAID. See also KFF’s U.S. Global Health Budget Tracker for more details on planned funding by country. ↩︎
  9. KFF, The U.S. Global Health Initiative: A Country Analysis, 2011. ↩︎
  10. Unless otherwise specified, U.S. global health funding in this section refers to funding through regular appropriations only. KFF analysis of data from the Office of Management and Budget, Agency Congressional Budget Justifications and Operating Plans, Congressional Appropriations Bills, Press Releases, and Conference Reports; and U.S. Foreign Assistance Dashboard website, ForeignAssistance.gov. ↩︎
  11. KFF, Historical Trends in U.S. Funding for Global Health, May 2021. KFF analysis of OECD DAC CRS database, June 2024. KFF analysis of data from the Office of Management and Budget, Agency Congressional Budget Justifications and Operating Plans, Congressional Appropriations Bills, Press Releases, and Conference Reports; and U.S. Foreign Assistance Dashboard website, ForeignAssistance.gov. ↩︎
  12. Based on specified funding for global health programs in the President’s budget request, ForeignAssistance.gov, and Congressional appropriations bills. There is additional funding for global health activities that is determined at the agency level and is not specified by the Administration or in Congressional appropriations (e.g., Economic Support Fund [ESF] at USAID); these amounts are estimated using prior year levels. ↩︎
  13. KFF analysis of data from the Office of Management and Budget, Agency Congressional Budget Justifications and Operating Plans, Congressional Appropriations Bills, Press Releases, and Conference Reports; and U.S. Foreign Assistance Dashboard website, ForeignAssistance.gov. ↩︎
  14. KFF analysis of FY 2023 country level data in the U.S. Foreign Assistance Dashboard website, ForeignAssistance.gov, accessed June 2024. Includes countries receiving bilateral global health funding through the Global Health Programs (GHP), Economic Support Fund (ESF), and Development Assistance (DA) accounts. Due to the unique nature of the program, funding provided through the Food for Peace (FFP) account at USAID is not included in this analysis. ↩︎

2025 Medicare Advantage Plan Choices are Stable, Following Years of Steady Growth

Authors: Jeannie Fuglesten Biniek, Meredith Freed, Anthony Damico, and Tricia Neuman
Published: Oct 15, 2024

Note: This analysis was updated on November 25th to reflect the October version of the 2025 CMS Landscape file. For more information, please see: Medicare Advantage 2025 Spotlight: A First Look at Plan Offerings | KFF and Medicare Advantage 2025 Spotlight: A First Look at Plan Premiums and Benefits | KFF

In the months leading up to the Medicare annual open enrollment period that runs from October 15th through December 7th, there were questions about how modifications to the payment formula and higher utilization would impact the number of Medicare Advantage plans that would be offered in 2025. A review of the plans available for individual enrollment shows that the total number of plans declined by 6% (from 3,959 to 3,719). Some reports have suggested that this translates into a dramatic drop in the number of plans available to the average Medicare beneficiary. However, taking a closer look, the Medicare Advantage market appears relatively stable.

KFF analysis finds the average Medicare beneficiary will have the option of 34 Medicare Advantage prescription drug (MA-PD) plans in 2025, just 2 fewer than the 36 options available in 2024 (Figure 1). Across all plans for individual enrollment, including those with and without prescription drug coverage, the average beneficiary has 42 options in 2025, compared to 43 options in both 2023 and 2024. Since 2018, the number of plans available to the average beneficiary has doubled.

The Number of Medicare Advantage Plans Available to the Average Medicare Beneficiary is Stable in 2025

While a full KFF analysis of plan offerings and benefits will follow, at a high level, 2025 looks similar to 2024 in terms of plan choice.

    The average Medicare beneficiary has access to plans offered by 8 different firms in 2025, the same as in 2024, and an increase of 2 firms since 2018. Virtually all enrollees (99%) also have access to at least one zero premium plan that includes prescription drug coverage, consistent with recent years and substantially higher than the 84% in 2018.

The decrease in the total number of Medicare Advantage plans means that some Medicare beneficiaries will find that their current coverage is no longer an option for next year. In most cases, these beneficiaries live in counties where they will continue to have a myriad of Medicare Advantage plan options, potentially including some from the same insurer for the plan in which they are currently enrolled. In some cases, people will be moved into a new plan under the same insurer automatically if the contract includes another plan of the same type (i.e., HMO or PPO) in the same county. Others will have to make an active choice about their Medicare coverage if they wish to enroll in another Medicare Advantage plan.

Though higher than in previous years, a relatively small number of Medicare Advantage beneficiaries are enrolled in a plan in 2024 that has been terminated for the coming year and will not be automatically assigned to a new plan. People in this group will be able to enroll in another Medicare Advantage plan if one is available or choose traditional Medicare. If they choose traditional Medicare, they will qualify for a special enrollment period for Medigap with guaranteed issue rights, meaning they can switch to traditional Medicare and will not be denied a Medigap policy due to a pre-existing condition.

Every year, Medicare Advantage plans change in ways that could be important to enrollees, including the scope and generosity of extra benefits, cost sharing for Medicare-covered benefits, rules for using covered services (such as referral requirements and prior authorization), drug formularies, and provider networks. Despite these changes, most Medicare beneficiaries report that they do not compare coverage options on an annual basis. While reviewing the various features of plans can be daunting, beneficiaries can take some comfort in the stability of the Medicare Advantage market in terms of the number of plans available to them in 2025.

Teens, Drugs, and Overdose: Contrasting Pre-Pandemic and Current Trends

Authors: Nirmita Panchal and Sasha Zitter
Published: Oct 15, 2024

Teenage drug and alcohol use is on the decline and, for the first time in recent years, drug overdose deaths among teens have slightly decreased. Adolescent overdose fatalities first spiked with the onset of the pandemic, nearly doubling from 282 deaths in 2019 to 546 deaths in 2020. These deaths decreased from 721 in 2022 to 708 in 2023, a small reduction that marked a plateau and possibly the start of a decline in adolescent overdose deaths. While it is too early to determine what the direction of overdose deaths may be, factors that may have contributed to the small decline include a decrease in pandemic-related stressors along with policies aimed at reducing overdose deaths. Through the Biden-Harris Administration, naloxone was made available over the counter, access to substance use treatment and education was expanded, including in schools, and the Kids Online Health and Safety Task Force was launched, which aims to prevent teens from purchasing drugs via social media. With the 2024 Presidential election approaching and both candidates’ plans to address the youth drug crisis differing widely, future policy efforts will depend on election outcomes.

This issue brief analyzes CDC WONDER data – including provisional data from 2023 – and data from national surveys of adolescent youth to highlight trends in substance use and overdose deaths. It explores how and where teenagers receive substance use information and treatment and how school settings can be leveraged to enhance prevention measures. Lastly, it examines federal and state prevention efforts and social media’s role in the drug crisis.

Adolescent drug fatalities more than doubled in recent years – primarily due to opioids – but slightly decreased by the end of 2023. There were 708 adolescents drug fatalities in 2023, compared to 721 in 2022 (Figure 1). Additionally, a recent KFF analysis found that opioid-related deaths among adolescents decreased in the second half of 2023. Although these findings represent the first decrease in drug overdose fatalities in recent years, they remain more than twice as high as the number of adolescent overdose fatalities prior to the pandemic (708 deaths in 2023 vs. 282 deaths in 2019, Figure 1).

Adolescent Overdose Deaths Have Increased Since Before the Pandemic, Primarily Driven by Opioids

Fentanyl overdose deaths increased by 2% from 2022 to 2023, marking the smallest annual increase in fentanyl deaths among adolescents since the pandemic began. The synthetic opioid, fentanyl, has largely driven the increase in adolescent drug fatalities since the pandemic began. In the first year of the pandemic, adolescent overdose deaths involving fentanyl increased by 177% (from 128 deaths in 2019 to 354 in 2020, Figure 1). While these deaths remain higher than pre-pandemic levels, the increase slowed to 2% from 2022 to 2023 (527 and 539 deaths, respectively).

The share of all drug overdose deaths that involved fentanyl increased faster among adolescents than adults in recent years (Figure 2). Fentanyl deaths as a share of all adolescent drug overdose deaths increased significantly from 32% in 2018 to 65% in 2020. This increase marked the first time the share of drug fatalities involving fentanyl was higher among adolescents than adults (65% vs 62% in 2020). This gap has continued to slowly widen – in 2023, 76% and 69% of adolescent and adult drug fatalities involved fentanyl, respectively. While the share of fentanyl deaths increased more among adolescents than adults over time, the number and rates of these deaths remains much lower among adolescents compared to adults (539 vs. 72,000 deaths; and 2.1 vs. 27.6 deaths per 100,000 in 2023).

The Share of Drug Fatalities Involving Fentanyl Increased Faster Among Adolescents Than Adults in Recent Years

Adolescents may obtain drugs through social media, and these drugs are often contaminated with fentanyl. In 2023, seven out of every ten counterfeit opioid pills were found by the Drug Enforcement Administration to contain a potentially deadly dose of the drug. Fentanyl is exceedingly lethal and is often used to lace drugs because it is cheap and highly potent. With the onset of the pandemic, fentanyl spread quickly into drug supplies and is often trafficked by U.S. citizens (although misinformation incorrectly links the spread of fentanyl to undocumented immigrants). Adolescent fentanyl overdoses are thought to be mostly accidental, as teens search for prescription opioids or other drugs, either for recreational or self-medication purposes, but instead encounter fentanyl-contaminated pills. Adolescents may acquire drugs through social media platforms, which are frequently scrutinized for lacking regulation around illegal drug sales. The National Crime Prevention Council estimates that eight in ten teen and young adult fentanyl overdose deaths are associated with social media contact.

Despite the increase in drug overdose deaths among adolescents in recent years, their use of drugs and alcohol has slightly declined (Figure 3). In 2023, 10% of high school students reported ever using select illicit drugs, including cocaine, heroin, inhalants, methamphetamines, ecstasy, or hallucinogens, a slight decrease from 2017 (13%). Declines were also reported in opioid misuse (14% vs. 12%) and current alcohol use (30% vs. 22%) among high school students during the same period. Marijuana use has fluctuated, but ultimately decreased slightly since 2017 (20% vs. 17% in 2023). However, adolescent marijuana use may be linked to the onset of psychotic disorders, including depression and suicidality. Among high school students, the use of e-cigarettes declined from 14% in 2022 to 10% in 2023, although e-cigarettes remain the most often used tobacco product among this population in recent years. Factors that may have contributed to the overall decline in substance use among adolescents include public education initiatives and earlier intervention.

Substance Use Among High School Students Has Decreased Over Time

As adolescent substance use and related deaths showed slight signs of improvement in 2023, so did adolescent mental health. The share of high school students reporting feelings of sadness and hopelessness – which can be indicative of depressive disorder – increased from 30% in 2013 to 42% in 2021, before slightly declining to 40% in 2023. The co-occurrence of poor mental health and substance use is common, with one in five youth who had a major depressive episode in the last year also having a substance use disorder. In a recent, CDC convenience sample survey of teens (ages 13 to 18) who used substances in the last 30 days, many teenagers reported using substances to cope with negative emotions. Although it is too early to know whether adolescent substance use and poor mental health will continue to decline, efforts to identify and harness the driving factors behind this change may help continue the downward trend.

How and where do adolescents receive substance use messaging and treatment?

More than 6 in 10 adolescents report receiving information on drug and alcohol use disorder and prevention in school (Figure 4). This information is disseminated in multiple forms, including special substance use education classes, substance use-related films, lectures, and discussions outside of class, or substance use curricula integrated into health or physical education classes. A similar share of adolescents (63%) viewed messaging on substance use prevention outside of schools, while approximately half spoke with their parents on substance use harms (51%), and a small share participated in prevention programs outside of school settings (7%).

Most Adolescents Receive Substance Use Prevention Messaging in School

In 2023, only 2 out of 10 adolescents with a substance use disorder received treatment in the past year. In 2023, 8.5% of adolescents (or 2.2 million) had a substance use disorder in the past year.1  Among these adolescents, 19.3% (or 423,000) received substance use disorder treatment in the past year.

Adolescents face a number of barriers to substance use treatment, including limited access to residential treatment facilities and buprenorphine. Among the total adolescent population, treatment for any substance use issue was more commonly received in an outpatient setting (3.3%) (i.e. at a medical clinic, doctor’s office, or therapist’s office), followed by an inpatient setting (1.4%) (i.e. at a hospital or residential treatment center) in 2023. Many residential addiction treatment facilities do not accept adolescent patients, and among facilities that do, beds may not be immediately available. The number of treatment facilities by state varies greatly, as do costs. Additionally, few facilities provide buprenorphine, a medication that can reduce withdrawal symptoms and cravings, to adolescents with opioid use disorder or discontinue it prior to discharge. Buprenorphine, a standard treatment for opioid use disorder is not approved for use by those under the age of 16, though it is recommended by the Society for Adolescent Health and Medicine. Still, some pediatricians feel uncomfortable prescribing it to adolescent patients.

Which efforts have been implemented in response to the adolescent drug crisis?

Recent federal efforts, including proposed bipartisan legislation, aim to strengthen youth substance use prevention programs in schools. The bipartisan Keeping Drugs Out of Schools Act was recently introduced, requesting federal authorization of 7 million dollars per year over 5 years for elementary, middle, and high schools to improve their drug prevention programs. The Biden-Harris administration also continues to respond to the youth drug crisis, most recently by allocating $94 million to community efforts to prevent youth overdoses via the Drug Free Communities Support Program, an initiative that often involves partnering with school districts to reduce youth substance use. Further, the Biden-Harris administration’s Safer Communities Act facilitated expansions of behavioral health services in schools through Medicaid resources.

Many states have policies allowing schools to stock naloxone (the opioid overdose reversal drug), an effort that is supported by the Biden-Harris administration, American Medical Association, and National Association of School Nurses. Most states have passed laws explicitly allowing schools to stock, naloxone, but only a few states, including Rhode Island and Washington, require it. Additionally, as of 2023, just over half of the nation’s largest school districts reported they mandate stocking naloxone. Several school districts, including, most recently, Virginia’s Loudon County School Board, have proposed or passed policies allowing students to carry and administer naloxone at school, after meeting certain requirements such as completing overdose-recognition training and obtaining written permission from their guardians. Some states, such as Washington and Oregon, have also passed legislation that integrates fentanyl education into school curricula. Among schools that do not stock naloxone, some worry that doing so will impact their image and label the school as having a drug problem, while others believe that there are more effective uses for limited school funds, as schools are fairly low frequency overdose locations.

Outside of schools, federal and state lawmakers are attempting to address adolescent substance use through online safety legislation. At the federal level, accompanied by the Surgeon General’s advisory on social media and youth mental health, the Biden-Harris Administration announced the Kids Online Health and Safety Task Force, which aims to enhance the health and safety of children on the internet. Similarly, the Kids Online Safety Act, a bill designed to increase regulation and accountability for social media companies, has been passed by the Senate, and President Biden stated he will sign it if it passes the House. Additionally, senators have introduced bipartisan legislation that aims to protect the privacy and wellbeing of children online. Multiple states have introduced legislation focused on media literacy, age verification, and the online distribution of controlled substances. Social media platforms are facing pressure from parents and lawmakers alike to increase regulation and to prevent online drug sales. These tech companies are protected by Section 230 of the Communications Decency Act, which states that they are not liable for material posted on their platforms by third parties. In July of 2024, the Supreme Court turned away a case that would have warranted a thorough review of Section 230, thereby preserving the immunity of these social platforms. With mounting pressure, some social media companies are creating safety features to protect young users, including Meta’s recently announced Teen Accounts feature.

  1. NSDUH screens for substance use disorder based off of DSM-V criteria, asking substance-specific questions to all participants who indicate they have ever used a substance in order to determine the severity (mild, moderate, or severe) of the substance use disorder if one is present. Participants have a substance use disorder if they meet at least two of the eleven diagnostic criteria within the last 12 months. ↩︎

The Impact of HIV on Hispanic/Latino People in the United States

Published: Oct 15, 2024

Key Facts

  • Hispanic/Latino people have been disproportionately affected by HIV/AIDS since the epidemic’s beginning, and that disparity has deepened over time.
  • Between 2010-2022, while HIV diagnoses decreased by 12% overall, Hispanic/Latino people saw a 24% increase.
  • Although they represent only 19% of the U.S. population, Hispanic/Latino people account for a larger share of HIV diagnoses (31%) and people estimated to be living with HIV (26%) compared to their population size.1 
  • Among Hispanic/Latino people, youth and gay and bisexual men have been disproportionately impacted by HIV.
  • Several challenges contribute to the epidemic among Hispanic/Latino people, including poverty, limited access to health care and insurance, lower awareness of HIV status, stigma, and language or cultural barriers in health care settings.
  • Recent data indicates mixed trends, including increasing new HIV diagnoses among Hispanic/Latino people overall, especially among men, but a leveling off among women (see Figure 1), largely related to transmission patterns: HIV diagnoses attributed to male-to-male sexual contact increased but those attributed to heterosexual sex and injection drug use decreased.
  • As the largest and one of the fastest growing ethnic minority groups in the U.S., and one of the only groups to see an increase in HIV diagnoses in recent years, addressing HIV in the Hispanic/Latino community takes on increased importance in efforts to address the epidemic across the country.
HIV Diagnoses in the United States, All People and Among Hispanic/Latino People

Overview

  • Today, there are more than 1.2 million people estimated to be living with HIV in the U.S., including 316,900 who are Hispanic/Latino.
  • Although Hispanic/Latino people represent only 19% of the U.S. population, they accounted for 31% of new HIV diagnoses in 2022 (see Figure 2) and an estimated 26% of people estimated to be living with HIV.
  • Disparities persist in awareness of HIV status, linkage to care, and viral suppression between Hispanic/Latino people and White people.
  • Between 2010-2022, while HIV diagnoses decreased by 12% overall, Hispanic/Latino people saw a 24% increase.
  • The increase in the number of annual HIV diagnoses among Hispanic/Latino people in recent years was concentrated among men who accounted for almost nine in ten new diagnoses (88%) in 2022 (See Figure 1).
  • Of the 10,426 new HIV diagnoses among Hispanic/Latino men in 2022, 91% were attributable to diagnoses among gay and bisexual Hispanic/Latino men.
New HIV Diagnoses & U.S. Population, by Race/Ethnicity, 2022
  • The rate of new HIV diagnoses per 100,000 among adult and adolescent Hispanic/Latino people (23.4) was over 4 times that of White people (5.3) but about half that of Black people (41.6) in 2022 (see Figure 3). Looking by sex and race, the rate for Hispanic/Latino men (40.8) was the second highest of any group after Black men (66.3) and over 4 times that of White men (8.7). Latina women (5.5) had the third highest rate among women (tied with American Indian/Alaska Native women) after Multiracial women (8.2) and Black women (19.2).
Rates of New HIV Diagnoses per 100,000, by Race/Ethnicity, 2022
  • Hispanic/Latino people accounted for almost 1 in 5 (17%) deaths among people with an HIV diagnosis (deaths may be due to any cause) in 2022. The number of deaths among Latino individuals with an HIV diagnosis increased 24% between 2010 and 2022.
  • Rates for deaths where HIV was indicated as the leading cause of death are second highest among Hispanic/Latino people (after Black people) compared to people of other race/ethnicities. Hispanic/Latino people had the second highest age-adjusted HIV death rate per 100,000 – 1.4 compared to 0.6 per 100,000 White persons.

Transmission

  • Transmission patterns vary by race/ethnicity. While male-to-male sexual contact accounts for the largest share of HIV cases across racial/ethnic groups, proportionately, more Hispanic/Latino people contract HIV this way. Heterosexual sex accounts for a smaller proportion of HIV cases among Hispanic/Latino people than White people.
  • Among Hispanic/Latino people, 78% of new HIV diagnoses in 2022 were attributable to male-to-male sexual contact, with an additional 3% attributable to male-to-male sexual contact and injection drug use. 15% were attributable to heterosexual sex and the remainder of HIV diagnoses were attributable injection drug use only. This differs from transmission patterns among White people. Among White people, 63% of new HIV diagnoses in 2022 were attributable to male-to-male sexual contact with an additional 7% attributable to male-to-male sexual contact and injection drug use and 16% were attributable to heterosexual sex. The remainder were attributable injection drug use only.
  • Nearly 9 in 10 (87%) HIV diagnoses among Hispanic/Latina women are attributed to heterosexual contact and a smaller share of HIV are attributable to injection drug use compared to White women.

Geography

  • Although HIV diagnoses among Hispanic/Latino people have been reported throughout the country, the impact of the epidemic is not uniformly distributed.
  • In 2022, Hispanic/Latino people made up an estimated 19% of all people in the South, but accounted for a greater share of new diagnoses (42%) and estimated people living with HIV (34%) in that region.
  • HIV diagnoses among Hispanic/Latino people are concentrated in a handful of states. The top 10 states account for 82% of all HIV diagnoses among Hispanic/Latino people (see Figure 4).
Top Ten States/Territories by Number of HIV Diagnoses Among Hispanic/Latino People, 2022

Women

  • Hispanic/Latina women accounted for 1 in 5 (20%) new HIV diagnoses among women as well as 1 in 5 (20%) women estimated to be living with HIV. The rate of new diagnoses among Latina women (5.5) is nearly 3 times the rate among White women (1.9) but less than the rate among Black women (19.2).
  • After several years of decreases, new HIV diagnoses among Hispanic/Latina women increased by 16% between 2018 and 2022.
  • In 2022, Hispanic/Latina women represented 12% of new HIV diagnoses among all Hispanic/Latino people – a smaller share than White and Black women (who represented 18% and 24% of new diagnoses among their respective racial/ethnic groups).

Young People

  • In 2022, 30% of HIV diagnoses among young people ages 13-24 were among Hispanic/Latino people.
  • Looking at young people (those ages 13-24) by race/ethnicity, Hispanic/Latino youth, had the second highest number and rate of HIV diagnoses (2,124 and 16.3 per 100,000, respectively) after Black youth (3,555 and 48.7); the rate for Hispanic/Latino people was 4.5 times greater than that of White youth (3.6).
  • Hispanic/Latino gay and bisexual teens and young adults are especially impacted. Among all gay and bisexual teens and young adults diagnosed with HIV in 2022, 32% were Hispanic/Latino.

Gay and Bisexual Men

(Data in this section are based on individuals who acquired HIV through male-to-male sexual contact or male-to-male sexual contact and injection drug use.)

  • Between 2010 and 2022, HIV diagnoses among Hispanic/Latino people attributable to male-to-male sexual contact increased by 43%, including a 23% increase between 2018 to 2022.
  • Among Hispanic/Latino people, gay and bisexual men accounted for 85% those estimated to be living with HIV and 30% of all gay and bisexual men estimated to be living with HIV.
  • Young Hispanic/Latino gay and bisexual men are particularly affected, with those ages 13-24 accounting for 20% of new HIV diagnoses among Hispanic/Latino gay and bisexual men in 2022, higher than the share among White gay and bisexual men (12%).

HIV Testing and Access to Prevention & Care

  • In 2022, nearly one half (44%) of Hispanic/Latino adults reported ever having been tested for HIV, compared to a third of those who were White (32%).
  • Among those who are HIV positive, 21% of Hispanic/Latino people were diagnosed with HIV late – that is, were diagnosed with AIDS within 3 months of testing positive for HIV; similar to the share among White (21%) and Black (20%) people.
  • Looking across the care continuum, Hispanic/Latino people face disparities related to diagnosis, linkage to care and viral suppression. At the end of 2022, it was estimated that 84% of Hispanic/Latino people with HIV were diagnosed, 62% were linked to care, and 54% were virally suppressed. In comparison, an estimated 89% of White people with HIV were diagnosed, 70% were linked to care, and 63% were virally suppressed.
  1. Unless otherwise noted, HIV data come from KFF analysis of the Centers for Disease Control and Prevention (CDC) data in the CDC’s National Center for HIV, Viral Hepatitis, STD, and Tuberculosis Prevention tool: Atlas Plus. https://www.cdc.gov/nchhstp/about/atlasplus.html. ↩︎

Vice President Harris’ Proposal to Broaden Medicare Coverage of Home Care

Published: Oct 11, 2024

On October 8, 2024, Vice President Harris proposed to expand Medicare to provide home care to help families who are struggling with the costs of long-term care. If enacted, this would be the first major expansion of Medicare since the Medicare Modernization Act of 2003 that added a prescription drug benefit to the program.

Vice President Harris proposes to create a new home care benefit for eligible Medicare beneficiaries. Under the proposal, Medicare beneficiaries would be eligible for the new benefit if they are unable to perform activities of daily living such as bathing and eating or have a serious cognitive impairment, such as Alzheimer’s disease. Although the proposal is not fully specified, it “recognizes that the vast majority of seniors with long-term care needs are still able to live in their homes with an average of 20 hours or less a week of care,” suggesting that the benefit will be around 20 hours per week. The new benefit includes cost sharing requirements that vary by income. The proposal notes that similar home care proposals have been estimated to cost about $40 billion per year, prior to accounting for potential savings from reduced use of hospital and nursing facility care.

In addition, the proposal would expand Medicare to cover vision and hearing, and end a practice known as “estate recovery” when Medicaid recoups the costs of home care from the sale of decedents’ homes and estates (described below). The proposal would fund the additional costs of the new benefits by expanding Medicare drug negotiation provisions included in the Inflation Reduction Act; increasing the discounts covered by drug manufacturers for certain brand-name drugs; strengthening requirements for pharmacy benefit managers related to price transparency and competition; and by implementing international tax reforms.

KFF estimates that 14.7 million Medicare beneficiaries (23% of those living in the community) would potentially be eligible for the new Medicare home care benefit. This estimate is based on eligibility criteria used in similar proposals: having two or more limitations in activities of daily living and/or a serious cognitive impairment. The number of people eligible for this benefit could be higher or lower depending on how eligibility criteria are defined, and not all people who are eligible for the program will use the new benefits. This estimate is based on an analysis of the 2022 Medicare Current Beneficiary Survey and excludes beneficiaries living in nursing homes and other long-term settings (see Methods).

Former President Trump has endorsed “at home Senior Care” but has not put forward a specific proposal. Former President Trump proposes “shifting resources back to at-home Senior Care,” addressing disincentives that contribute to workforce shortages, and supporting unpaid family caregivers through tax credits. It’s unclear whether the Trump proposals would apply to people with disabilities who use home care, if they would make changes to Medicare or Medicaid, or how they align with broader proposed cuts to the Medicaid program. Although Vice President Harris’ fact sheet focuses on older adults, the proposal would expand Medicare, which includes both adults ages 65 and older and younger adults with disabilities, suggesting that Medicare beneficiaries with disabilities would also be eligible for the new benefit.

Under current law, Medicare coverage of home care is quite limited. Medicare covers home health aide services for people who need skilled services on a part-time or intermittent basis, such as nursing or physical therapy, and are “homebound.” Because of the skilled care requirement, Medicare does not cover home care for many people who need help on an ongoing basis due to limitations in activities of daily living or cognitive impairments, but don’t also require skilled services.

Medicaid pays for two-thirds of all spending on home care in the U.S., but coverage rules are complex and coverage is for people with limited financial resources. Most home care services in Medicaid are provided at the option of states, and optional services result in variability of available benefits. Roughly 700,000 are on waiting lists for home care because the number of people seeking services exceeds the number of people states can serve.

People who need home care and other long-term care services often pay substantial amounts out-of-pocket (see Figure 1). Those costs often exceed the median income for Medicare beneficiaries (about $36,000 per beneficiary in 2023) and may quickly exhaust the median savings ($103,800 per beneficiary in 2023). KFF polling finds over half of all people who used long-term care or paid for a family member’s care reported having to reduce their spending on food, clothing, or basic household items as a result of these costs.

Long-Term Care, Including Home Care, is Extremely Expensive and Not Generally Covered by Medicare

Vice President Harris’ proposal would also expand Medicare to cover vision and hearing. Under current law, traditional Medicare does not cover prescription eye wear (eyeglasses/contacts) or hearing aids, which can be prohibitively expensive for people living on fixed incomes. Difficulty with hearing and vision is relatively common among Medicare beneficiaries, with close to half (44%) of beneficiaries reporting difficulty hearing and more than one third (35%) reporting difficulty seeing in 2019. Limited hearing and vision benefits are typically offered by Medicare Advantage plans but the scope, value and provider networks of these benefits varies widely across plans. Beneficiaries in traditional Medicare may have access to some hearing and vision benefits if they also have supplemental coverage under Medicaid, employer or union-sponsored retiree health benefits, or other types of insurance.

Beyond changes to Medicare, Vice President Harris is proposing to end a practice in which Medicaid recoups the costs of home care from the sale of decedents’ homes and estates. Under Medicaid estate recovery, states are required to recoup the costs of long-term care and related hospital and prescription drug services for Medicaid enrollees ages 55 and older, and have the option to recover the costs for other services and populations. The Harris proposal proposes to work with Congress to end Medicaid estate recovery or use administrative action to expand the circumstances in which families may be exempted, if Congress fails to take action.

Estate recovery practices have been criticized for several reasons, including that it falls primarily on individuals with limited incomes, raises little revenue, and is applied very unevenly across the states. Democrats have recently proposed eliminating estate recovery while Republicans have recently proposed modifying the rules and prohibiting it under certain circumstances.

Nearly all provisions in Vice President Harris’ proposal would require a change in law. Without Congressional action, a new Administration would be unable to establish and fund new Medicare benefits for home care, vision, and hearing; generate savings by enacting changes to the Inflation Reduction Act’s Medicare prescription provisions; eliminate Medicaid estate recovery; or establish new taxes. Both Democrats and Republicans have proposed legislation to reduce the number of people waiting to receive Medicaid home care and address the issue of Medicaid estate recovery, suggesting that may be an area of potential compromise. There is also bipartisan interest in beefing up oversight and transparency for pharmacy benefit managers (PBMs).

As the proposal winds its way through Congress, many policy details would have to be worked through. For example, in addition to laying out more specifics about how to fully fund the benefit expansions, lawmakers would face questions about how eligibility for the new benefits would be determined; who could be paid to provide the new benefits; and how the new benefits would interact with existing Medicare benefits, and with supplemental coverage provided through Medicaid or private policies. Lawmakers would also likely debate how to support care workers, improve their wages, and address ongoing workforce shortages in the home care industry. The answers to these and other questions would impact how many people would be helped and the cost.

The proposal includes a small number of changes that could be enacted without new legislation, such as strengthening requirements for pharmacy benefit managers related to price transparency and competition and expanding the circumstances in which families may obtain exemptions from Medicaid estate recovery.

Methods

This analysis uses the Centers for Medicare & Medicaid Services’ Medicare Current Beneficiary Survey (MCBS), 2022 Survey File (the most recent year available) to obtain data on the number and share of Medicare beneficiaries who would potentially be eligible for the proposed home care benefit. The analysis assumed that Medicare beneficiaries with either two or more limitations in activities of daily living (ADLs) or a cognitive impairment would be eligible. The MCBS is a nationally representative survey of Medicare beneficiaries.

The analysis is limited to community-dwelling Medicare beneficiaries and excludes beneficiaries who live in long-term care or other residential facilities such as skilled nursing facilities or assisted living facilities.

For Medicare beneficiaries in the community, cognitive impairment is defined as at least one positive response to:

  • Having serious difficulty concentrating, remembering, or making decisions because of a physical, mental, or emotional condition
  • Trouble concentrating more than half the days or nearly every day during the past two weeks

Medicare beneficiaries in the community were defined as potentially eligible for the proposed home health care benefit if they reported difficulty performing two or more of the following ADLs because of a physical, mental, emotional, or memory problem: bathing or showering, getting in or out of bed or chairs, dressing, eating, using the toilet (including getting up and down), or walking. These difficulties may have been temporary or chronic at the time of the survey.

Recent Trends in Medicaid Outpatient Prescription Drugs and Spending

Published: Oct 11, 2024

Managing the Medicaid prescription drug benefit and pharmacy expenditures is a long-standing policy priority for state Medicaid programs. Prescription drugs account for approximately 6% of total Medicaid spending, and Medicaid gross and net spending on prescription drugs continues to rise, in part due to the emergence of new, high cost drugs, including anti-obesity medications and cell and gene therapies that treat, and sometimes cure, rare diseases. Under the federal Medicaid Drug Rebate Program (MDRP), states must cover nearly all FDA-approved drugs from rebating manufacturers, but most states are in the process of implementing various cost containment initiatives to combat rising pharmacy costs such as value-based purchasing arrangements and pharmacy benefit manager (PBM) reforms. There have also been various federal actions to address high prescription drug costs in recent years, including the passage of the Inflation Reduction Act, the lifting of the rebate cap, and a recently finalized federal rule aimed at strengthening the MDRP.

At the same time, the COVID-19 pandemic and the pandemic-related continuous enrollment provision substantially affected Medicaid enrollment and spending trends as well as Medicaid prescription drug trends and will continue to impact trends as states wrap up the unwinding of the continuous enrollment provision. The outcome of the election could also have major implications for the future of Medicaid, including Medicaid prescription drug spending and access given the Trump Administration and Biden-Harris Administration diverging records on the topic. This issue brief describes recent trends in the number of Medicaid outpatient prescriptions and the spending on those drugs and examines how the pandemic and pandemic-era policies may have impacted those trends. Key findings include:

  • The number of Medicaid prescriptions each year was on the decline until FY 2020 when the trend reversed; however, the number of prescriptions only increased by 3% overall from FY 2017 to FY 2023 and the number of prescriptions per enrollee declined.
  • At the same time, net spending (spending after rebates) on Medicaid prescription drugs is estimated to have increased by 72%, from $30 billion in FY 2017 to $51 billion in FY 2023, likely driven by the emergence of new high-cost specialty drugs.
  • Rebates reduce Medicaid spending on prescription drugs by over half, but the decrease is larger for fee-for-service (FFS) drug spending.

The number of prescriptions paid for by Medicaid each year was on the decline until FY 2020 when the trend reversed; however, the number of prescriptions only slightly increased overall from FY 2017 to FY 2023 and the number of prescriptions per enrollee declined (Figure 1). After declining from FY 2017 to FY 2020, the number of Medicaid prescriptions increased by 11% from FY 2020 to 2023 potentially reflecting enrollment growth during the continuous enrollment period. However, Medicaid prescriptions remained below FY 2017 levels until FY 2023, with the total number of prescriptions only increasing by 3% overall from FY 2017 to FY 2023. At the same time, the number of Medicaid prescriptions per person has declined by over 2 prescriptions per person since FY 2017. This could point to lower drug utilization during the continuous enrollment provision or increases in the number of days supplied per prescription (this analysis does not account for days supply, see Methods for more information). When the pandemic hit, many states relaxed their 30-day drug dispensing limits, which allowed for more 90-day prescriptions and likely contributed to trends seen here.

The Number of Medicaid Outpatient Prescriptions Was on the Decline Until FY 2020

Net spending (spending after rebates) on Medicaid prescription drugs is estimated to have grown substantially in recent years, increasing from $30 billion in FY 2017 to $51 billion in FY 2023, a 72% increase (Figure 2). Since FY 2017, gross Medicaid spending (spending before rebates) on Medicaid outpatient prescription drugs has grown by 62%. The difference between net and gross spending is drug rebates. Under the MDRP, drug manufacturers provide rebates to the federal government and states in exchange for Medicaid coverage of their drugs, and a Congressional Budget Office study found these rebates result in lower net drug prices in Medicaid compared with other federal programs. Growth in rebates on Medicaid prescription drugs was slower than gross spending growth over the period, with rebates increasing 54% from FY 2017 to FY 2023. The emergence of new high-cost specialty drugs, including new cell and gene therapies, is likely a key driver in spending increases, and studies show launch prices for new drugs have increased. Studies have also found substantial drug price increases beyond the rate of inflation in recent years. Overall, net Medicaid spending per prescription increased from $39 in FY 2017 to $65 in FY 2023, though recent changes in the number of days a prescription is supplied for could also be contributing to increases. Overall, net Medicaid spending on prescription drugs accounted for an estimated 6% of total Medicaid benefit spending in FY 2023, only a small increase from FY 2017 (5.2%).

Gross and Net Medicaid Spending on Prescriptions Drugs Have Increased in Recent Years

Rebates reduce Medicaid spending on prescription drugs by over half, but the decrease is larger for fee-for-service (FFS) drug spending (Figure 3). Over the period, the share of gross spending rebates accounted for has also declined slightly from 54% in FY 2017 to 51% in FY 2023 (Figure 2). In 2023, drug rebates comprised 61% of gross FFS spending but only 44% of gross managed care organization (MCO) spending. There are several possible reasons for that difference:

  • One study found the structure of the rebate program may incentivize the use of generic or lower priced drugs in MCOs since MCOs do not receive statutory rebates. States do receive a portion of statutory rebates (which are typically higher for brand drugs), so there may be muted incentive to shift to generics in FFS.
  • Some states also carve out specific drugs or drug classes from managed care, typically targeting high-cost, brand drugs (which have higher rebates).
  • While capitated managed care is now the predominant delivery system for Medicaid in most states, managed care penetration rates for different eligibility groups can vary by state. Adults ages 65+ and people eligible through disability are less likely to be enrolled in MCOs and may require more specialty brand medications which typically have higher rebates.
  • This analysis does not include any supplemental rebates that may be negotiated between managed care plans and manufacturers, but does include supplemental rebates negotiated between state Medicaid agencies and manufacturers.
Rebates Reduce Medicaid Spending on Prescription Drugs by Over Half, but the Decrease is Larger for Fee-for-Service Drug Spending

Methods

Number of Prescriptions and Gross Spending Data: This analysis uses 2016 through 2023 State Drug Utilization Data (SDUD) (downloaded in September 2024) converted to federal fiscal year (FY) 2017 through FY 2023. The SDUD is publicly available data provided as part of the Medicaid Drug Rebate Program (MDRP), and provides information on the number of prescriptions, Medicaid spending before rebates, and cost-sharing for rebate-eligible Medicaid outpatient drugs by NDC, quarter, managed care or fee-for-service, and state. It also provides this data summarized for the whole country. The data do not include information on the number of days supplied in each prescription. CMS has suppressed SDUD cells with fewer than 11 prescriptions, citing the Federal Privacy Act and the HIPAA Privacy Rule. This analysis used the national totals data because less data is suppressed at the national versus state level.

Rebate Data: This analysis uses CMS-64 Financial Management Reports (FMR) for FY 2017 through FY 2023 (downloaded in August 2023). These reports include total Medicaid expenditures broken out by various service categories, and this analysis pulls out the drug rebate line items, separating them by managed care or fee-for-service rebates. The rebate data used includes statutory rebates, state supplemental rebates, rebates under the ACA offset, rebates from VBAs, and rebates for opioid use disorder medication assisted treatment. Supplemental rebate agreements negotiated between Medicaid managed care plans and manufacturers are not included. The rebates collected in the CMS-64 were subtracted from the gross spending totals from the SDUD to estimate net Medicaid spending on prescription drugs each fiscal year.

Limitations: There are a number of limitations to the estimates of Medicaid prescriptions and spending found in this analysis, including:

  • This analysis examines the number of Medicaid prescriptions in the data and does not adjust for days supplied by each prescription. An increase in prescription lengths, especially during the pandemic, could contribute to fewer prescriptions.
  • The SDUD are updated quarterly; a new quarter of data is typically released, and the prior five years of data are also updated. This means utilization and gross spending totals can vary depending on when the data is downloaded, and totals may not match other outside sources or prior KFF analysis for this reason.
  • The spending collected on the CMS-64 and reported in the FMR data uses a cash-basis of accounting, meaning expenditures are based on the date of payment not particularly when the service occurred. In practice, states have two years following the date a service was rendered to report their spending. There may be timing differences causing misalignment between the prescriptions paid for by Medicaid in the SDUD and the rebates reported in the CMS-64.
  • Although states can collect drug rebates on physician-administered outpatient drugs that are not billed as a bundled service, physician-administered drugs subject to a rebate can vary from state to state. Because specialty drugs are often physician-administered, it is possible that the data reflects lower Medicaid spending and utilization of certain drugs of this kind.
  • Spending data is not adjusted for inflation.
News Release

KFF Revisits Women Voters Previously Surveyed in June and Finds Significant Shifts in VP Harris’ Favor Across a Range of Key Election Issues

Abortion Is Now the Most Important Issue for Women Under 30, Rising Above Inflation

Published: Oct 11, 2024

In a special follow-up poll of the same women voters who were previously interviewed in June (before President Biden announced he wouldn’t run for reelection), KFF finds substantial shifts in favor of Vice President Harris across a range of key election issues, including the handling of rising household and health care costs, as well as increased enthusiasm for the candidates and motivation to vote. As the presidential election draws near, the survey also shows a pronounced rise in the salience of abortion as a voting issue for women under age 30.

The follow-up KFF Survey of Women Voters is distinctive in that the same group of women voters were polled in both June and September 2024, following major events of the 2024 presidential election, including Biden’s departure from the race and Harris’ nomination.

Among the findings:

  • Women voters flip on who they believe can best address rising household costs. Roughly half (46%) of women voters now say they trust Harris over Trump (39%) when it comes to addressing household costs. In comparison, women voters in June were split evenly on which party they trusted more to deal with the rising cost of household expenses, giving neither party the advantage. Heading into the 2024 election, inflation remains the number one issue for this group overall (36%) and continues to be the top issue priority for Black (51%) and Hispanic (41%) women
  • Harris maintains the lead on health care costs that was held by the Democratic Party this summer; half of women voters (50%) say they trust her to do a better job on this issue, while one in three (34%) say they trust former President Trump.
  • A majority of women voters are now satisfied with the presidential candidate options. About two-thirds of women voters (64%) are now satisfied with their options for president, including three in four Democratic women voters (75%). The share of women voters who now report being satisfied has increased more than 20 percentage points since June (40% in June, 64% in September) and includes a nearly 40-point increase among Democratic women voters (36% in June, 75% in September).
  • Motivation to vote ramps up among women voters. The share of women voters who say they are more motivated to vote in this election than in past presidential elections has also increased nearly 20 percentage points (45% in June, 64% in September), with seven in 10 Democratic women now saying they are more motivated to vote (44% in June, 70% in September). On the other hand, Republican women voters, who were more positive in June than their Democratic counterparts, now trail in both satisfaction (54% in June, 52% in September) and motivation (53% in June, 61% in September).
  • Abortion surpasses inflation as the top election issue for women under age 30. Four in 10 (39%) women voters under 30 now say abortion is the most important issue to their vote, nearly doubling the share who said the same back in June (20%).
  • Women voters shift their perspective in Harris’ favor on whether the election will have a major impact on abortion access. Women voters are now 11-percentage points more likely to say that this presidential election will have a major impact on access to abortion and reproductive health care in the U.S. (65%, up from 54%). Among Democratic women of reproductive age—one-fourth (26%) of whom now say abortion is their most important voting issue—79% now say this November’s election matters in a major way for abortion access, up from 66% in June. Meanwhile, Republican women don’t see the election as a major tipping point on abortion access with a majority saying the presidential election will have either a “minor impact” or “no impact” (57%).
  • Democratic women voters are more trusting of Harris to deal with abortion policy. In June, before Harris was the Democratic nominee for president, about half of Democratic women voters (49%) said they trusted Harris “a lot” to speak about abortion policy even as she was already serving as the campaign spokesperson on reproductive health. In September, that share has increased to three in four (75%) since she became the Democratic nominee and made abortion one of the hallmarks of her campaign. Harris also holds a strong advantage over Trump on who women voters trust to do a better job deciding abortion policy (58% v. 29%), and fares better in the matchup than Biden did with Trump this summer (46% v. 28%).

Designed and analyzed by public opinion researchers at KFF, the follow up Survey of Women Voters was conducted September 11 – October 1, 2024, online and by telephone from a nationally representative sample of 678 registered women voters in the U.S. of the 1,383 women voters who previously took part in the first wave of the KFF Survey of Women voters from May 23 – June 5, 2024 .By re-surveying many of the same of women voters, the survey provides data on how voter attitudes and motivations have changed over the past three months.

The margins of sampling error including the design effect for the follow up survey is plus or minus 5 percentage points. For results based on other subgroups, the margin of sampling error may be higher.

Explore the results from both the June and September KFF Surveys of Women Voters using the project’s interactive dashboard. The dashboard includes findings about the top voting issues for key groups of women voters, views on reproductive health policies, and how the race has changed since Harris became the Democratic presidential candidate.