Understanding Racial and Ethnic Identity in Federal Data and Impacts for Health Disparities
Introduction
How we ask for, analyze, and report information on race and ethnicity affects our ability to understand the racial and ethnic composition of our nation’s population and our ability to identify and address racial disparities in health and health care. The accuracy and precision of such data have important implications for identifying needs and directing resources and efforts to address those needs. Race, ethnicity, and national origin are distinct concepts that are social constructs, and how they have been defined, identified, and/or categorized have evolved over time. This brief provides an overview of how the concepts of race, ethnicity, and nationality have been defined and measured by the federal government through the U.S. Census Bureau and the Office of Management and Budget (OMB) over time and the implications for health disparities. We acknowledge that this brief does not cover all the nuances and complexities of the topic of racial and ethnic identity and that there is variation in how people think, talk, and relate to race, ethnicity, and national identity.
What do Race, Ethnicity, and National Origin Represent?
The concepts of race, ethnicity, and national origin and their fluidity are reflective of these identities being social constructs. While different, the two concepts of race and ethnicity are connected. Race is defined as a social political category primarily based on physical characteristics such as skin color, and ethnicity is a social category primarily defined by culture, language, and history. National origin is defined by the country or region that an individual or their ancestors originate from. In a 2024 update, federal standards for collecting and reporting racial and ethnic data combined previously separate questions about race and Hispanic ethnicity into a single question, and a new category was added for Middle Eastern or North African (MENA) people. The updated federal standards utilize seven racial and ethnic categories that are identified with the following terms (see Appendix for more details):
- American Indian or Alaska Native (AIAN)
- Asian
- Black or African American
- Hispanic or Latino
- Middle Eastern or North African (MENA)
- Native Hawaiian or Pacific Islander (NHPI)
- White
There are distinctions in the meanings of and community preferences for different terms, such as Black and African American and Hispanic, Latino, or Latinx. Polling data over time show that half of those who trace their roots to Spanish-speaking Latin America and Spain have consistently said they have no preference for Hispanic or Latino, but that when asked to choose one term over another, Hispanic has been preferred to Latino. Surveys further show a preference for country-of-origin labels (such as Mexican, Cuban, or Ecuadorian) versus broader pan-ethnic terms. A 2023 survey of U.S. Hispanic adults found that 47% of U.S. adults who self-identify as Hispanic have heard of the term Latinx, and just 4% say they use it to describe themselves. A 2021 Gallup Poll similarly found that most people favor the use of the term Hispanic and few (4%) prefer Latinx. Polling data also show that most Black Americans do not have a preference between Black and African American when asked which term they would rather people use to describe their racial group.
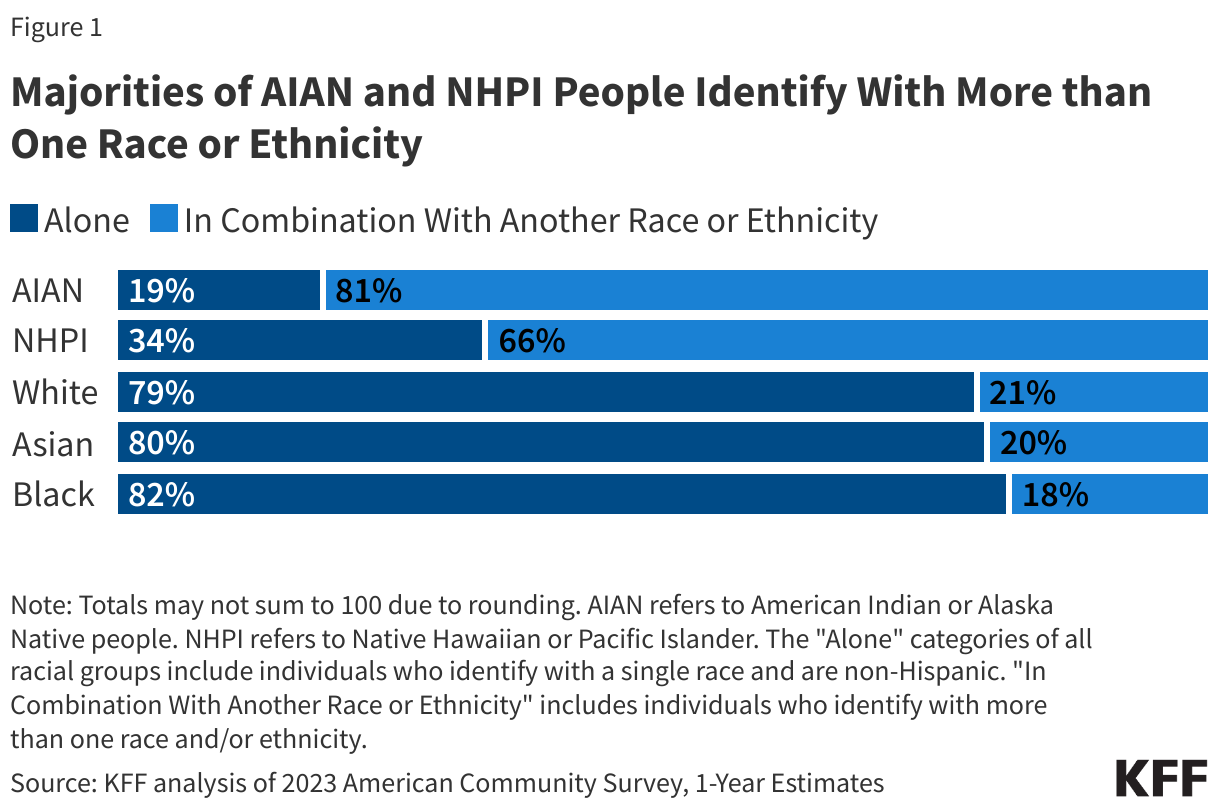
A large and growing share of people identify with more than one of the previous federal racial and ethnic categories (which do not reflect the 2024 changes to the standards). KFF analysis of 2023 American Community Survey (ACS) data finds that about eight in ten (81%) AIAN and two thirds (66%) of NHPI people identify with more than one racial and/or ethnic group. About one in five Asian (20%), Black (18%), and White (21%) people also identify with more than one racial and/or ethnic group (Figure 1). Under previous standards which had separate questions for Hispanic ethnicity and race, people of Hispanic ethnicity may be of any race.
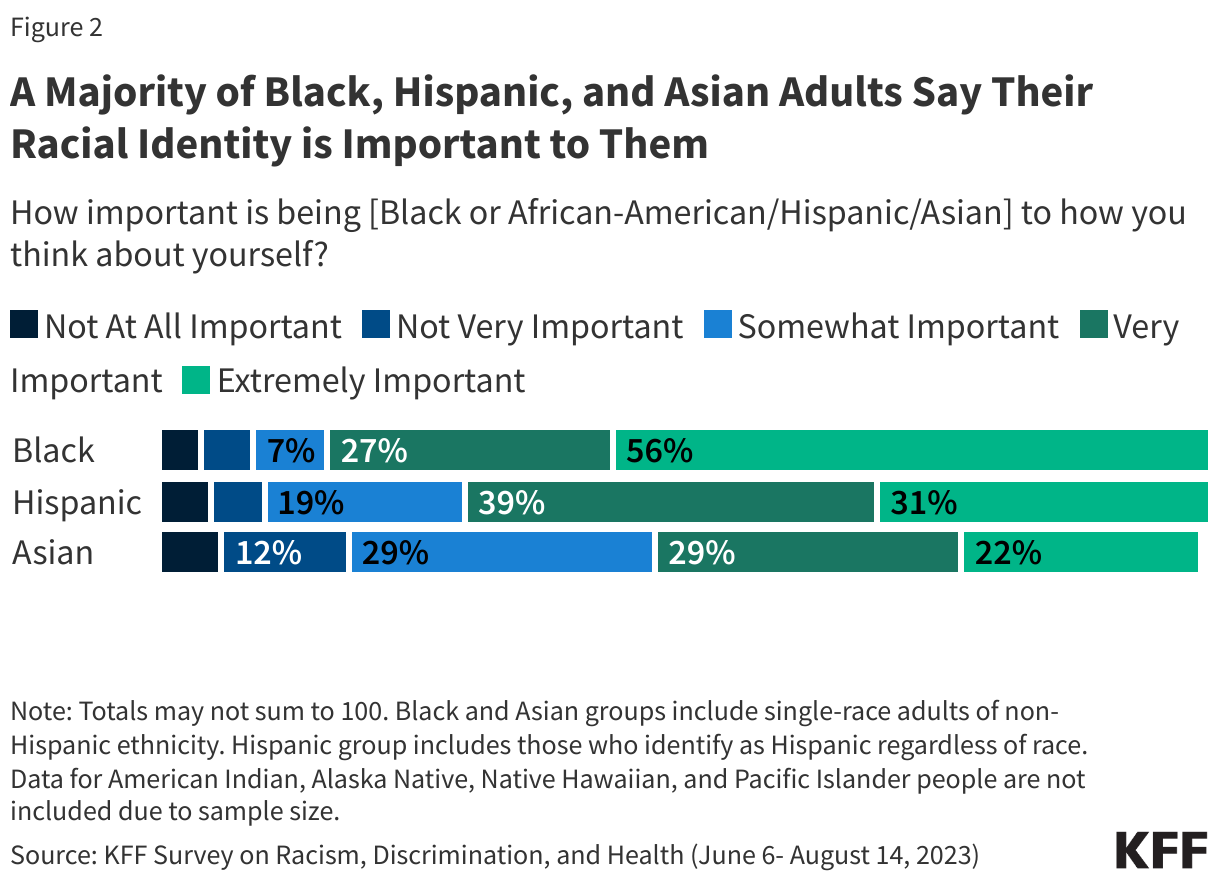
Racial identity is important to how people think about themselves, particularly for Black and Hispanic people. In a recent KFF survey, a majority of Black (83%) and Hispanic (70%) people said that their racial identity is very or extremely important to how they think about themselves. About half of Asian (51%) people say the same. Data were unavailable for other racial and ethnic groups (Figure 2).
How Have Measures of Race, Ethnicity, and National Origin Evolved Over Time?
Since its inception in 1790, the U.S. census has collected information on race and ethnicity that has informed policy, the allocation of resources, and scientific research on different groups within the country. The race and ethnicity data collected by the census is also used to evaluate the effectiveness of government programs and policies as well as to measure and ensure fairness, equity, and compliance with anti-discrimination laws and policies. In 1977, OMB established federal standards for race and ethnicity data through Statistical Policy Directive No. 15 to standardize how data are collected and reported at the federal level. The OMB standards guide not only the census but also other federal surveys, ensuring consistency across government data collection efforts. The census aligns its racial and ethnic categories with these standards, though it occasionally adjusts them to reflect evolving understandings of identity. The census recognizes that race is a social construct, stating that “The racial categories included in the census questionnaire generally reflect a social definition of race recognized in this country and not an attempt to define race biologically, anthropologically, or genetically. In addition, it is recognized that the categories of the race item include racial and national origin or sociocultural groups.”
How the census has collected and categorized information on race and ethnicity has evolved significantly over time, reflecting social and political shifts and the growing diversity of the U.S. population (Figure 3).
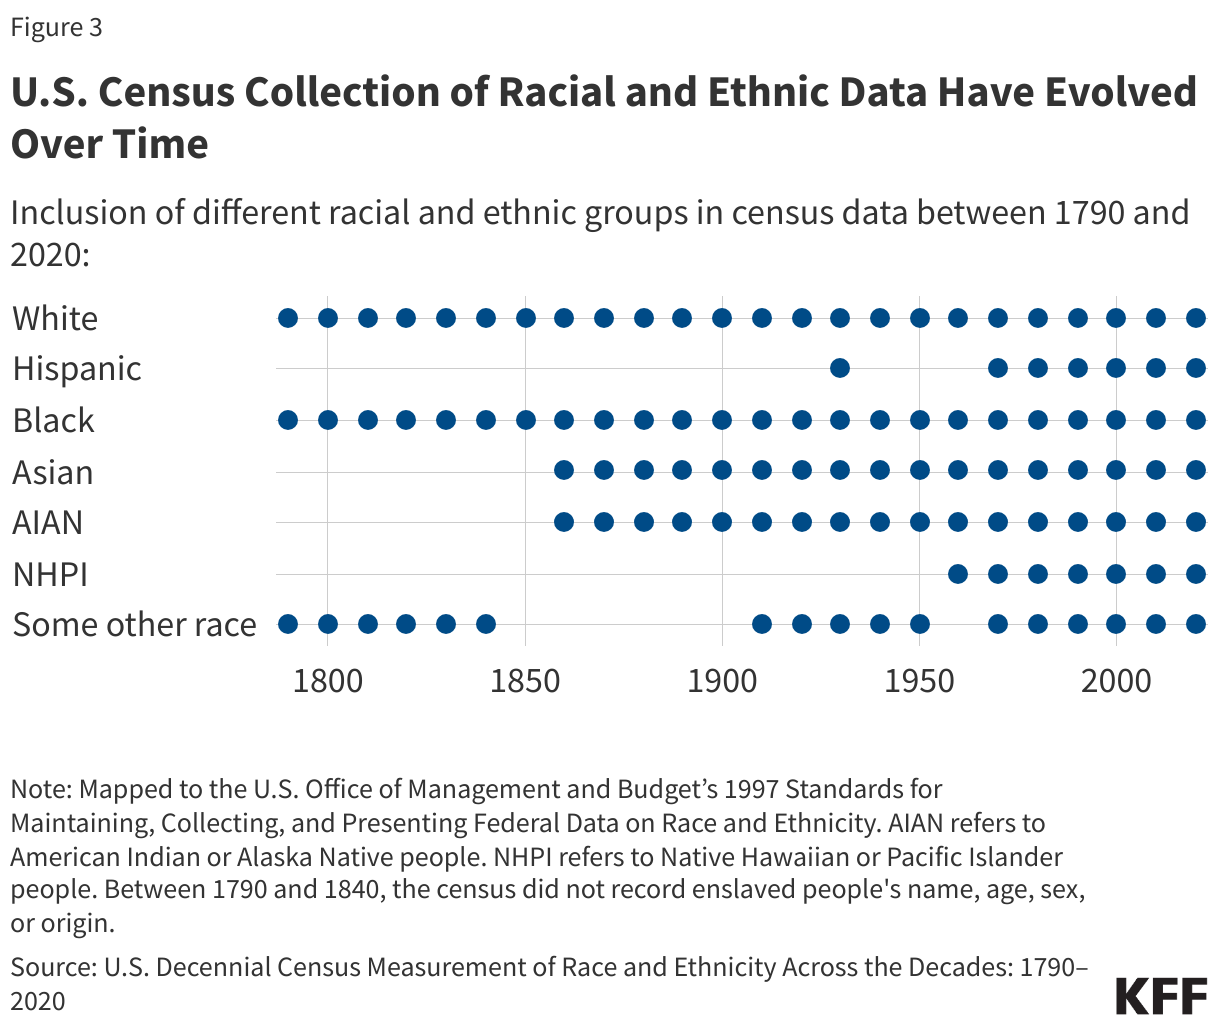
- Between 1790 and the mid-20th century, race and ethnicity information was collected via enumerators who conducted an interview for each household. Enumerators identified individuals’ racial and ethnic identities through their observations based on criteria that included physical characteristics, social norms and principles, national origin, and Tribal affiliation. Between 1790 and 1860, the census collected information on White, Black (enslaved and free), and Other Free Persons.1
- Additional categories were added to the census in the 1800s, which were motivated by slavery and race science and maintaining rights and privileges for White people. The 1840 census introduced a new category, free colored people (including Black and mixed-race Black people). In the mid to late 1800s, mixed-race categories were added — “mulatto, quadroon, and octoroon”. The definitions of these categories evolved over time, but they were based on perceived shares of Black ancestry and are no longer used. American Indian people who renounced Tribal rule, exercised the rights of U.S. citizens, and paid taxes were counted in the census for the first time in 1860. Prior to that, the Constitution excluded American Indian people who lived on reservations, lived on unsettled land, or were not taxed from being enumerated. By the late 1800s, the census began collecting national origin information, coinciding with the entry of Chinese migrant workers.
- Amid the rise of Jim Crow laws, the 1930 census dropped mixed-race categories and focused on the collection of single race data. Up until 1970, census enumerators classified people of mixed-race heritage based on specific rules: those with White ancestry and another racial group were classified as “non-White,” and people with two “non-White” ancestries were classified by the father’s race. If a person was Black or AIAN, their racial identity was instead based on blood quantum rules. Blood quantum measures the percentage of American Indian or Alaska Native ancestry or blood that an individual has and is used to determine Tribal affiliation. People who were both Black and White were categorized as Black under the one-drop rule, which meant that a person with any percentage of Black ancestry or blood would be counted as Black.
- Also during this period, more disaggregated Asian national origin data were collected, and Mexican national origin data were collected for the first time. Before 1930, Mexican Americans were classified as White. There was an organized movement to remove the Mexican category and reclassify Mexican people as White. Mexican people were reclassified as White in the 1940 census until 1970 when the census added the Hispanic/Latin origin category to a version of the questionnaire that was sent to a small share of the U.S. population.
- In the mid-20th century, the census shifted to allow respondents to self-identify their own race and/or ethnicity. Respondents were instructed to select the race that they most closely identified with from the single-race categories available or to use the father’s race if they were uncertain. Further, the addition of two new states in 1959, Alaska and Hawaii, prompted the addition of new categories to the census in 1960; Eskimo, Aleut, Hawaiian, and part-Hawaiian.
- In 1980, the census added a separate question on Hispanic ethnicity, following lobbying efforts from Hispanic advocacy groups in the 1970s in response to undercounting of the Hispanic population in the census. The Asian Pacific Islander (API) category was also added at this time in response to lobbying by Asian American legislators and advocacy groups, who similarly found that Asian American and Pacific Islander people were being undercounted. The API indicator included nine detailed Asian and Pacific Islander origin categories.
- In 1997, the OMB revised its race and ethnicity standards to allow individuals to select more than one racial category, reflecting a growing recognition of multiracial identities. This revision aimed to improve data accuracy and better capture the diversity of the U.S. population. Other open-ended questions on ancestry or ethnic origin were added that led to broader ethnic identification among American Indian people with a large share of the population claiming some Indian ancestry even if they didn’t identify racially as American Indian. This may have reflected increased American Indian pride movements that prompted people with multiracial American Indian heritage to identify with their American Indian ancestry.
- The second major change that impacted people with mixed-race heritage occurred in 2000, when the census allowed people to select more than one racial category. This change was driven by the multiracial movement of the 1980s and 1990s. In 2000, the census combined the American Indian and Alaska Native categories to form the AIAN category to capture original peoples with origins in North, Central, and/or South America. It also asked respondents to provide the names of their enrolled or principal Tribes. Additionally, it began collecting information separately on NHPI people, which it defined as people having origins in any of the original peoples of Hawaii, Guam, Samoa, or other Pacific Islands.
- The 2020 census allowed people to include detailed information about their race and/or ethnicity in addition to marking multiple race categories. The census now allows respondents to provide write-in responses describing their race and ethnicity, with clearer instructions and examples based on the largest population groups for each category. The multiracial population grew significantly between 2010 and 2020, with the U.S. Census Bureau indicating that changes in the design, data processing, and coding of the race and ethnicity questions over this time period (including the write-in responses) contributed to this growth, highlighting the impact of these decisions. This change also led to more people of MENA heritage providing detailed information about their ancestry, whereas before they were aggregated into the White category.
- In 2024, OMB released revised Standards for Maintaining, Collecting, and Presenting Federal Data on Race and Ethnicity to better reflect the growing diversity of the U.S. population. The revisions include using a single combined question for race and ethnicity, adding MENA as a minimum category, clarifying instructions for individuals to select multiple racial and ethnic categories that represent their identity, and requiring collection of more detail beyond the minimum categories. In addition, the standards require that data tabulation procedures result in the production of as much information on race and/or ethnicity as possible, including data for people reporting multiple racial and/or ethnic categories. These changes will impact how race and ethnicity data are collected in the census, as the U.S. Census Bureau has to adhere to the OMB standards on race and ethnicity.
While the census and OMB standards have been the standard for measuring race and ethnicity in the U.S. government at the federal level, states, localities, and other organizations often differ in their measurement of racial and ethnic data. For example, states vary in the number of categories they use to collect race and ethnicity data, as well as how these variables are named and combined. In Oregon, as part of an effort to eliminate health inequities, Oregon’s Health Authority has taken steps to accurately and expansively report demographic data. This includes collecting detailed and more granular race, ethnicity, language, and disability data. Oregon collects data for 42 race and ethnicity groups, answers are self-reported, and respondents are given the opportunity to select more than one race and/or ethnicity. Some states have narrower race and ethnicity categories, combining groups such as Asian and Native Hawaiian or Pacific Islanders into one group, API.
How Do Measures of Race, Ethnicity, and National Origin Impact Policies and Health Disparities?
How race, ethnicity, and nationality have been defined and measured has important implications for health disparities. Historically, these measures affected who can access health care, social services, education, and employment opportunities and have reinforced racial misinformation that limit access to resources for marginalized groups. Narrow and inconsistent race and ethnicity categories have obscured inequities and made it more difficult to meet the diverse needs of different populations. Conversely, data on race and ethnicity have also been used to address disparities by informing policies and interventions and to ensure compliance with antidiscrimination laws.
There are historic examples of racial and ethnic data being used in ways that have worsened and perpetuated racism and disparities. For example, in 1840, an “insane or idiot” category was added to the census to identify the number of people with mental disabilities in the country. However, the census enumerators disproportionately overcounted free colored people as “insane” to support the inaccurate idea that “freedom drove Black people mad.” Advocates of slavery used the 1840 census data to justify that slavery was beneficial for the health and well-being of Black people. In 1850, scientists petitioned the addition of a new racial category, “Mulatto” (people with mixed Black ancestry), to study the health of multiracial enslaved people. Census data from this period contributed greatly to scientific racism. Scientists used this data to suggest people of color were inferior to White people, test theories of polygenism, and codify racial hierarchies. As the multiracial population grew, so did ideologies surrounding the rules of hypodescent, under which multiracial individuals are assigned the race of the parent from the marginalized racial group. This included the one-drop rule, which required that anyone with a discernible trace of African ancestry be considered Black. This concept ensured that the children of enslaved Black people and their White enslavers would remain slaves. Blood quantum categorization eventually led to the codification of the one-drop rule in some states during the Jim Crow era as a means of supporting segregation. Similarly, the census began collecting information on American Indian blood quantum in 1930. Blood quantum was not only used to determine Tribal membership but was also used to study any perceived biological and intellectual differences between American Indian and White people.
In addition, race has historically and continues to play a role in medical teaching and clinical decision making within health care. Historically, the medical and scientific community used race to explain differences in disease prevalence and outcomes, contributing to misperceptions about biological differences by race that were used to justify mistreatment. Within U.S. medical curricula, the concept of race led to since disproven theories of biological inferiority of people of color and White supremacy, which fueled an array of atrocities in medicine including the forced sterilization efforts targeting Black and Native American women, the use of Henrietta Lacks’ cells for scientific research without consent, and the infamous U.S. Public Health Service Untreated Syphilis Study at Tuskegee, among others. Today, research suggests that provider and institutional bias and discrimination are drivers of disparities and health. Race also continues to be used as a factor in some clinical algorithms, although there is growing movement to eliminate the use of race and to ensure that disparities are not perpetuated amid the growing use of artificial intelligence and algorithms to guide clinical decision making.
Conversely, racial and ethnic measures have also been used to mitigate inequities in policies, employment, health care, and other sectors. For example, the Civil Rights Movement in the mid-20th century prompted the standardization of racial and ethnic classification as well as documentation of trends in racial and ethnic discrimination. This resulted in the establishment of the OMB Statistical Policy Directive No. 15 in 1977 that has since standardized the collection of race and ethnicity data at the federal level. The collection of standardized data facilitates the ability for policymakers and institutions to identify and address areas of inequality. For instance, racial and ethnic data can inform resource allocation, ensuring communities facing systemic disadvantages receive essential services, such as health care, education, and social programs. Additionally, it can help track and mitigate racial bias and discriminatory practices in health care, employment, housing, and other social and economic domains. These data also allow for the evaluation of the effectiveness of interventions designed to reduce disparities. For example, public health programs can measure the impact of vaccinations, screenings, or outreach efforts in marginalized communities, using racial and ethnic data to refine strategies and ensure more equitable access to care.
Availability of racial and ethnic data also has impacts on efforts to address health disparities. Missing or inconsistent data on race, ethnicity, and nationality can hinder effective resource allocation and policy decision-making, particularly in efforts to address health disparities. AIAN people were excluded in early versions of the census, beginning a trend of exclusion from national data inquiry that continues to the present day. This exclusion from data and analysis has contributed to limiting the visibility and understanding of challenges faced by AIAN people and other smaller racial and ethnic groups, including NHPI people. The negative impacts of missing or incomplete data were evidenced during the COVID-19 pandemic, when inconsistencies and limitations in how states reported their data limited the ability to understand racial and ethnic disparities in COVID-19 health impacts as well as take-up of COVID-19 vaccinations. Arab Americans and people with ancestry in the Middle East or North Africa have been invisible in key datasets, resulting in a limited understanding of their health outcomes, experiences accessing health care, and engagement with the health care system. Increasing the availability of disaggregated racial and ethnic data facilitates a greater understanding of disparities in health and health care and can help focus efforts to address them. For example, while aggregate data on Asian people suggest that they fare the same or better as compared to White people across most measures of health and health care, they mask underlying disparities among smaller subgroups within the Asian community. Having more disaggregated data allows for a more nuanced understanding of people’s experiences and can facilitate focused efforts to address disparities as well as to measure impacts of interventions to address them.
What are Future Issues to Consider Related to Measuring Race, Identity, and National Origin and Health Disparities?
As the U.S. becomes more diverse, it will be increasingly important to consider how to identify people’s identities, particularly among multiracial people. The census projects that people of color will account for over half of the population by 2050 with the largest growth occurring among people who identify as Asian or Hispanic. This shift underscores the importance of refining racial and ethnic categories to capture the complexity of modern identities. Continued adaptation of data collection and reporting methods will be important for reflecting experiences among multiracial people.
Continued efforts to further disaggregate racial and ethnic data may be important for guiding efforts to address health and health disparities. Significant data gaps persist for smaller groups, including AIAN and NHPI people, with very limited information available for subgroups of these populations. Moreover, Asian and Hispanic people are often treated as monolithic in policy discussions, but the diversity in experiences among these groups is vast, encompassing differences in national origin, language, immigration status, and socioeconomic factors that all influence health. Disaggregating data by subgroup can allow for more nuanced understanding of the challenges faced by specific groups and facilitate tailored efforts to address them. For example, the health care experiences of Asian immigrants vary in meaningful ways due to the intersections of race and ethnicity, national origin, income, and other factors that may impact access to health care services. Moreover, data are often key for justifying allocation of resources toward specific communities or groups.
Increased recognition of the intersectional nature of people’s identities and other factors that may affect their health and health care experiences may also have important implications for efforts to address disparities. For example, the combination of race, ethnicity, and gender, highlights disproportionate discrimination for certain groups. Large federal surveys collect demographic and social data, including race and/or ethnicity, gender, educational attainment, and income that can allow researchers to examine how intersectional social and economic factors shape people’s health and experiences. However, in some cases, data are limited to examine experiences by multiple factors. Beyond an individual’s racial or ethnic identity, other factors that are less routinely collected in surveys, such as self-perceived skin color, can also influence their experiences. Socially-assigned race—that is the race that others perceive someone to be—may also be a factor. For example, studies have found that Hispanic or Latino individuals who are socially perceived as White report better health outcomes than those who are perceived as Hispanic or Latino. As efforts to address health disparities continue and evolve, it will be important to consider how these other factors influence people’s experiences and outcomes.
Appendix: Examples of Race and/or Ethnicity Questions Consistent with Revised OMB Standards
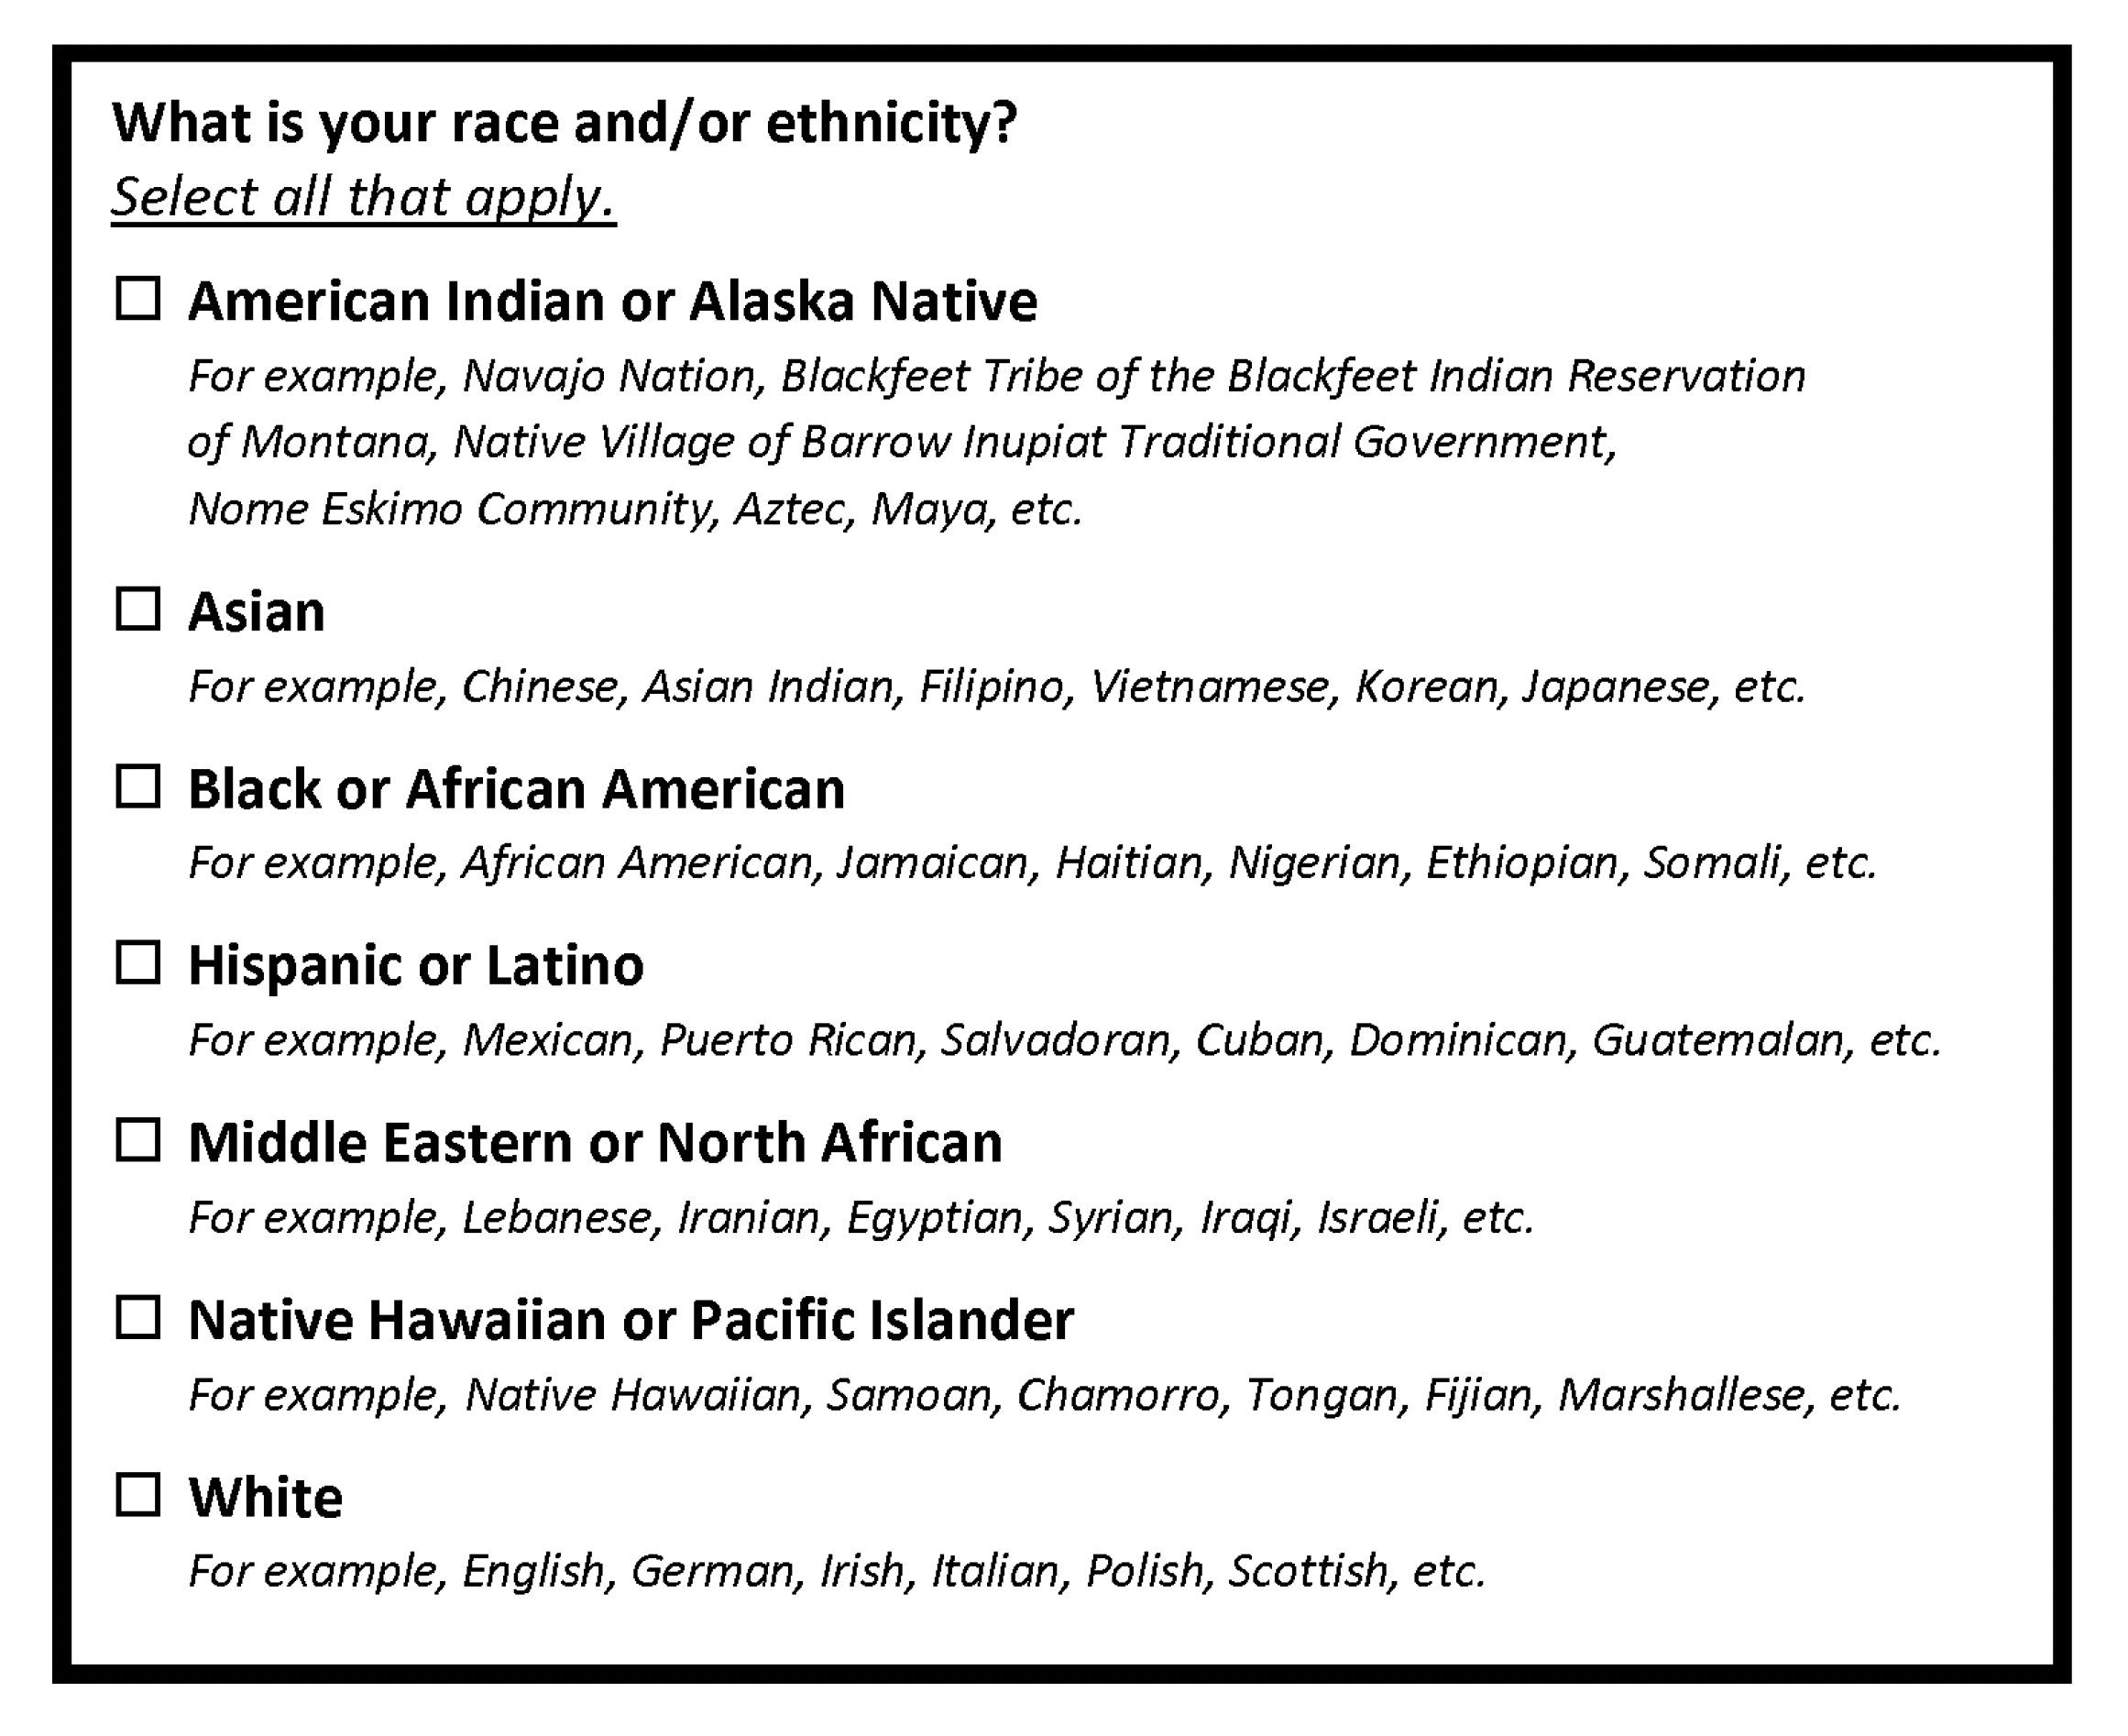
Source: Office of Management and Budget, Revisions to OMB’s Statistical Policy Directive No. 15: Standards for Maintaining, Collecting, and Presenting Federal Data on Race and Ethnicity
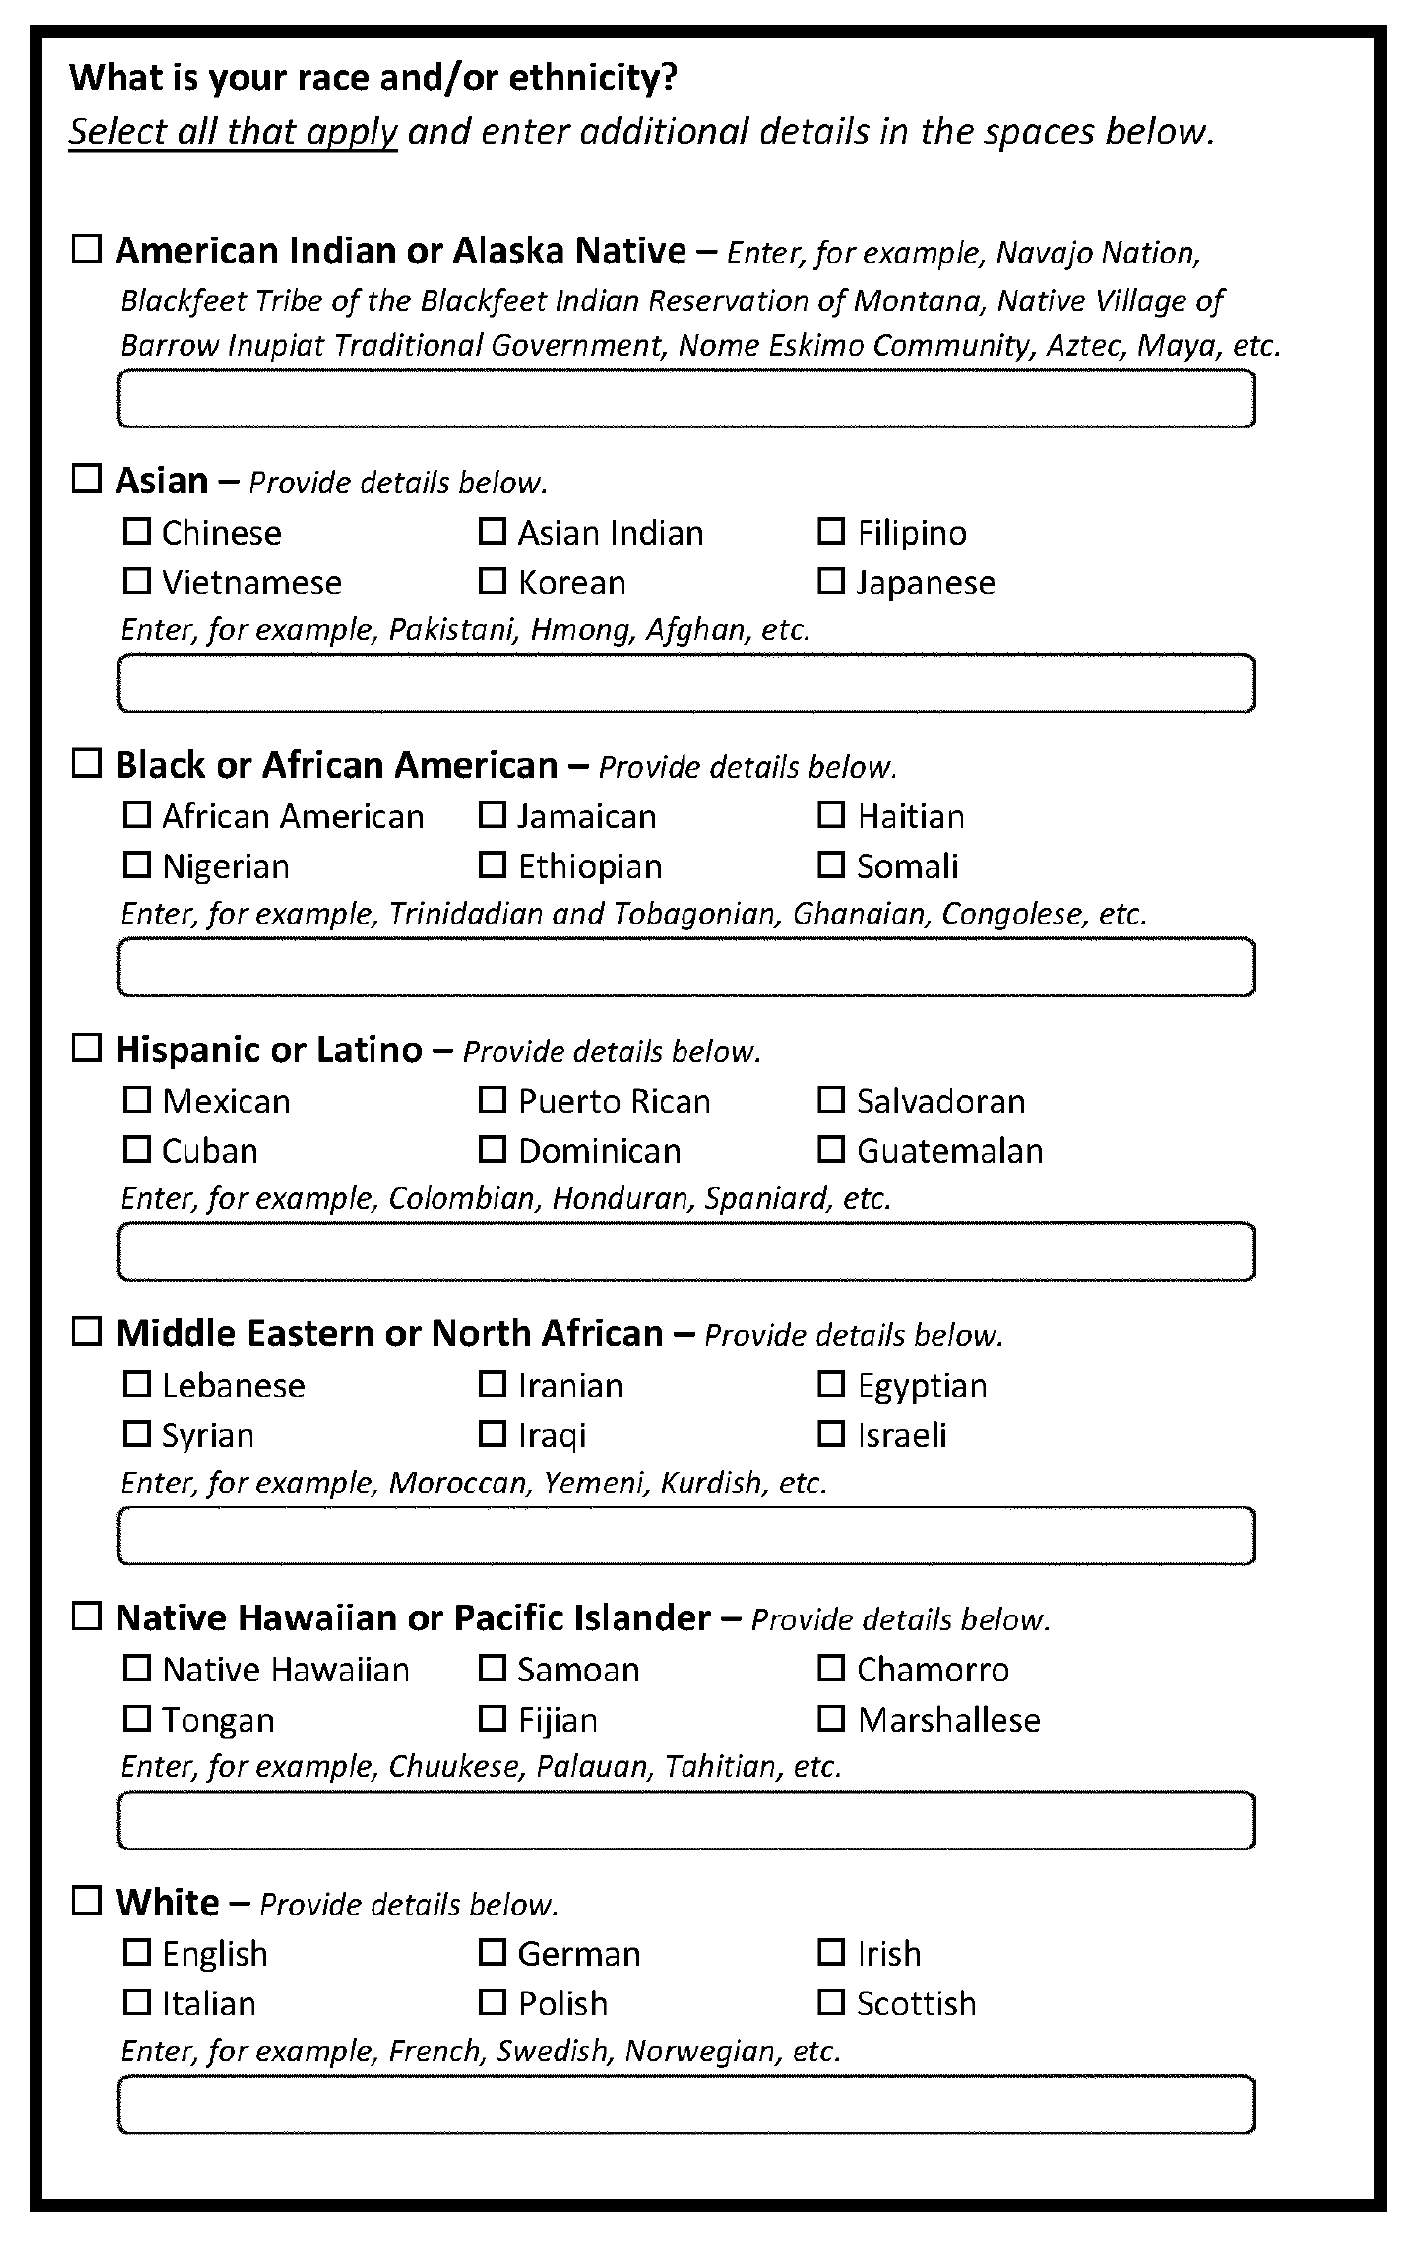
Source: Office of Management and Budget, Revisions to OMB’s Statistical Policy Directive No. 15: Standards for Maintaining, Collecting, and Presenting Federal Data on Race and Ethnicity
- Between 1790 and 1840 only the heads of free households appeared in early census records, enslaved people were not recorded by name, age, sex, or origin. They only included additional demographic data on White people. ↩︎