How Will the 2025 Reconciliation Bill Affect the Uninsured Rate in Each State? Allocating CBO’s Estimates of Coverage Loss
 Note: KFF’s analysis was updated on June 6 to reflect new estimates from the Congressional Budget Office (CBO) on the increase in the number of people who would be without health insurance because of changes to Medicaid and the ACA in the House’s version of the One Big Beautiful Bill Act.
House Republicans have passed a reconciliation package (the “One Big Beautiful Bill Act”) that would make significant changes to Medicaid and the Affordable Care Act (ACA) Marketplaces. The Congressional Budget Office (CBO) estimates that the bill would increase the number of people without health insurance by 10.9 million, because of changes to Medicaid and the ACA. Additionally, these legislative changes come at a time when enhanced premium tax credits for ACA Marketplace enrollees are set to expire later this year. When combining the reconciliation bill’s effects with that of the expected expiration of the ACA’s enhanced premium tax credits, CBO expects 16.0 million more people will be uninsured in 2034 than would otherwise be the case.
This analysis apportions the increase in the number of uninsured across the 50 states and the District of Columbia and shows that number as a percentage of each state’s population. The number of newly uninsured as a percent of the population is equivalent to the percentage point increase in the 2034 uninsured rate. Nationally, CBO projected an uninsured rate of under 10% in 2034 under current law, which assumed the enhanced ACA premium tax credits would expire. The analysis here includes two maps: one showing the effects of the House reconciliation package, and another showing those effects combined with expiration of the ACA enhanced premium tax credits and full impact of the program integrity rule.
Anticipating how states will respond to changes in Medicaid policy is a major source of uncertainty in CBO’s cost estimates. Instead of making state-by-state predictions about policy responses, CBO estimates the percentage of the affected population that lives in states with different types of policy responses. For example, in the reconciliation bill, Medicaid work requirements account for nearly half of the federal savings on Medicaid, suggesting they may contribute to the largest loss of insurance coverage in CBO’s estimates. However, different states might choose to implement a work requirement with reporting requirements that are easier or harder for enrollees to comply with. Reflecting the uncertainty, this analysis illustrates the potential variation by showing a range of enrollment effects in each state, varying by plus or minus 25% from a midpoint estimate.
The interactive table at the end is sortable by state and size of coverage loss.
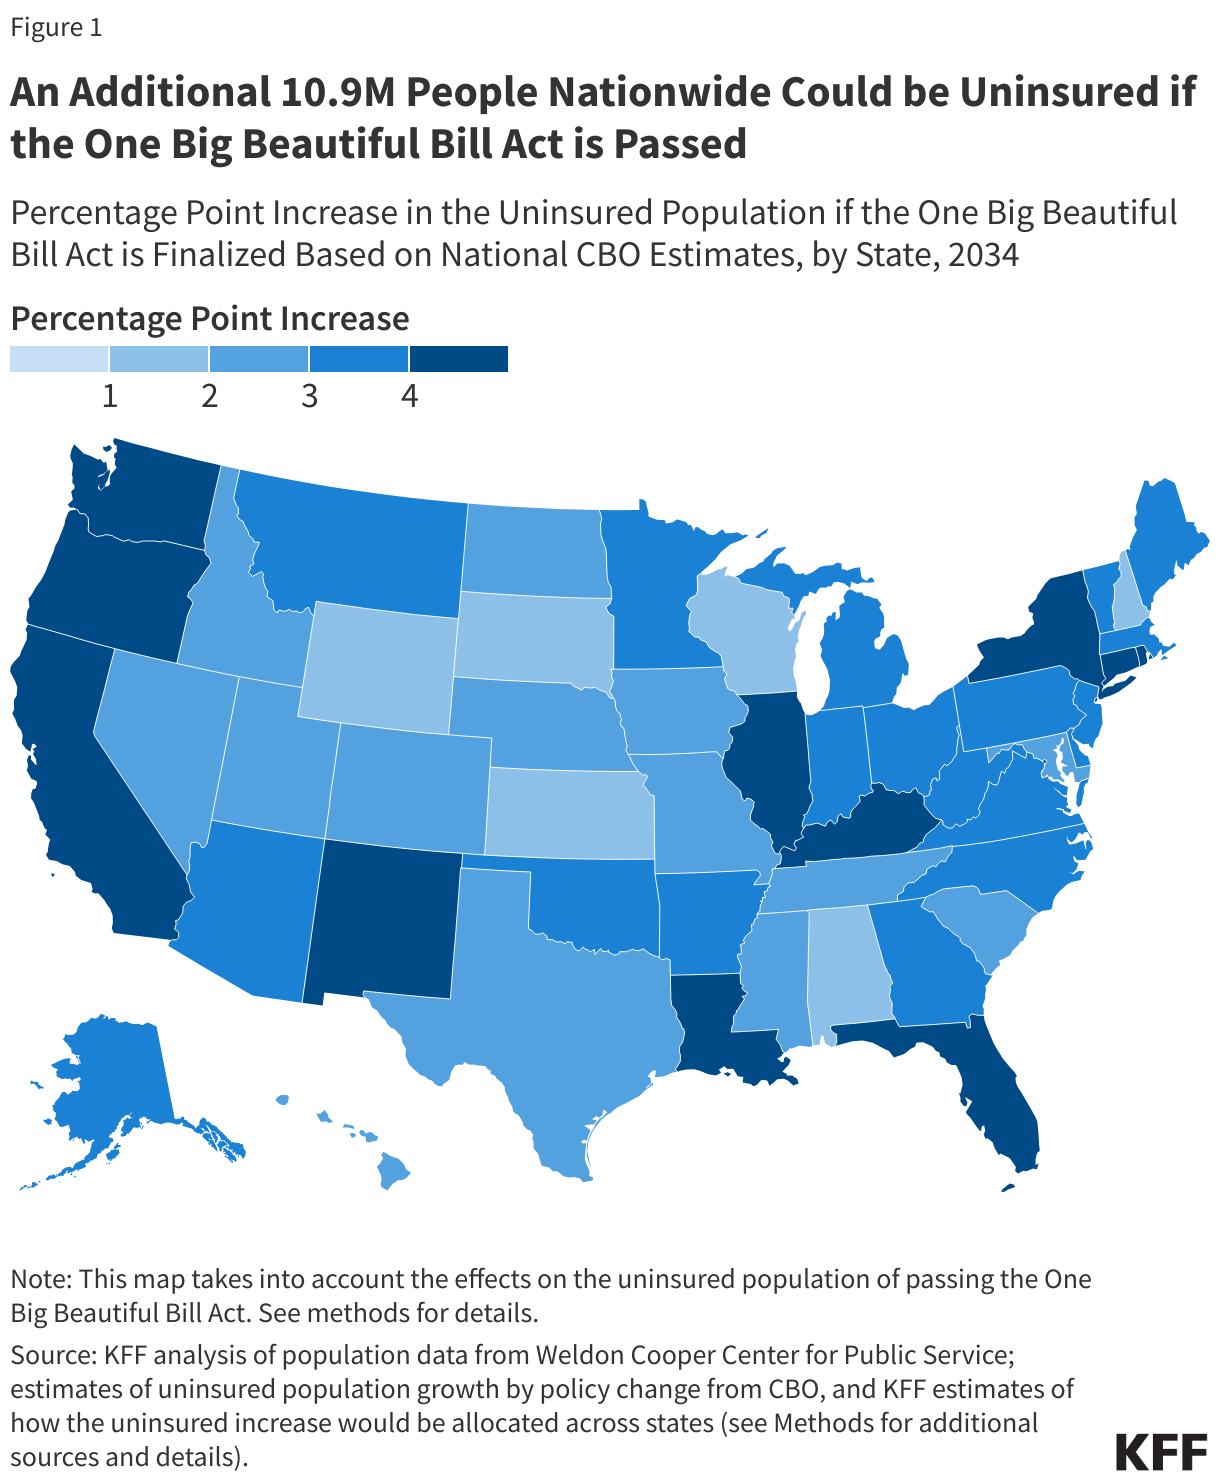
The One Big Beautiful Bill Act would result in increases in the uninsured rates of 3 percentage points or more in 16 states (Washington, Oregon, Louisiana, New York, Kentucky, Florida, California, Illinois, New Mexico, Rhode Island, Connecticut, Arizona, New Jersey, West Virginia, Arkansas and Alaska) and District of Columbia. These increases are attributable to the One Big Beautiful Bill Act alone and do not include the effect of the expiration of the enhanced premium tax credits nor the full impact of the proposed Marketplace integrity rule.
In terms of increases in the number of uninsured people, California and Florida are the top two states (1.7M and 990k, respectively). New York, Texas, and Illinois would follow at 920K, 770k, and 500k, respectively.
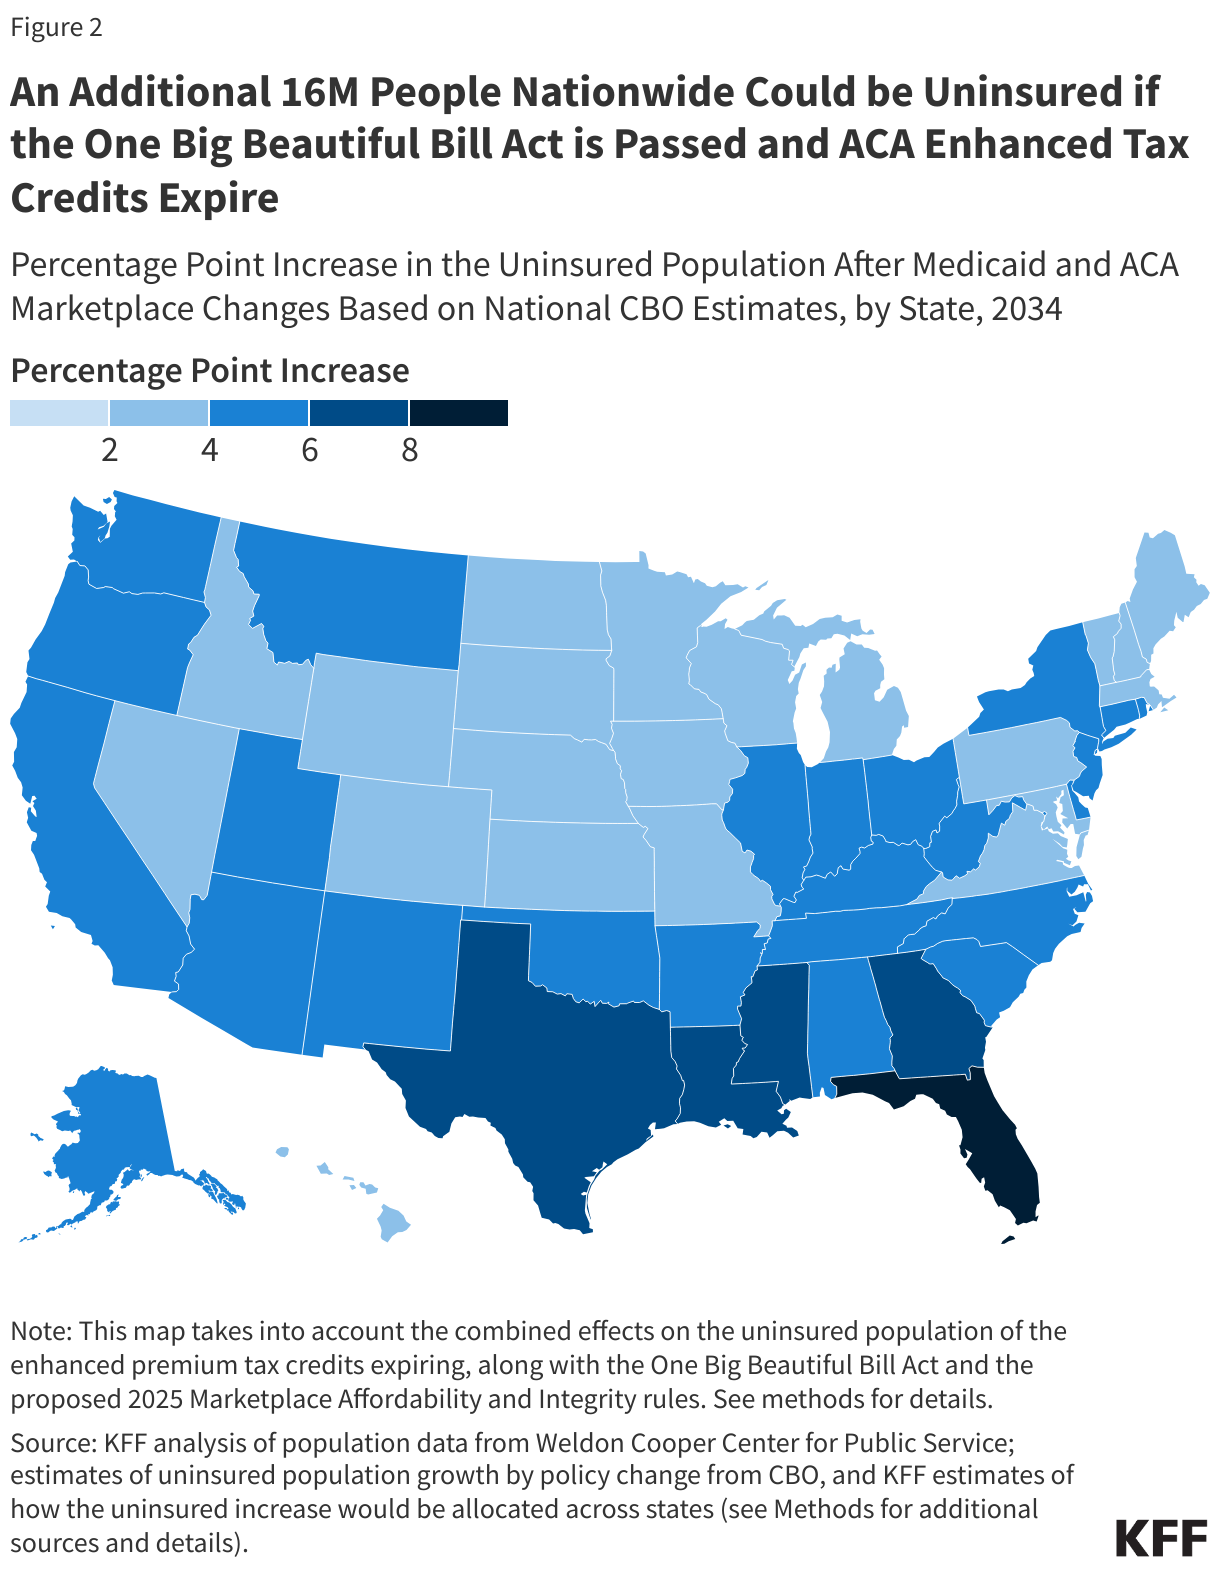
The combined effects of the House reconciliation package with the expiration of the ACA enhanced tax credits, compared to a scenario where the enhanced subsidies are in place and the proposed integrity rule was not in effect, results in the greatest uninsured increases in Florida, Georgia, Louisiana, Texas, Mississippi, Washington, and the District of Columbia, where the uninsured rate is expected to increase by at least 5 percentage points. Thirty-five states and the District of Columbia may see an increase in their uninsured rates of 3 percentage points or more.
About half (48%) of the 16 million more people who would be uninsured in this scenario live in Florida (2.3M), Texas (1.9M), California (1.8M), New York (920k), and Georgia (750k). The largest growth in ACA Marketplace enrollment since 2020, the year before the enhanced premium tax credits became available, occurred in Texas (2.8M), Florida (2.8M), and Georgia (1.0M).

Methods |
|||||||||||||||||||||||||||||||||
| This analysis first separates the number of newly uninsured people into two groups: those newly uninsured because of changes in Medicaid (7.8 million) and those newly uninsured because of changes in the Affordable Care Act exchanges (3.1 million or 8.2 million depending on the scenario). Increases in the number of uninsured by policy change were sourced from Congressional Budget Office (CBO) estimates.
Changes in Medicaid: CBO estimates that changes in Medicaid from the House reconciliation bill are expected to trigger two types of health insurance loss. First, an estimated 10.3 million people are expected to lose Medicaid. Second, an estimated 1.4 million people are expected to lose coverage provided to immigrants regardless of immigration status through programs financed entirely by the states. KFF uses the ratio of those numbers to first allocate the newly uninsured population (7.8 million) to Medicaid or state-funded coverage categories. This analysis allocates the newly uninsured population stemming from a loss of Medicaid across the states proportionally to each state’s estimated federal funding loss. In a prior analysis, KFF estimated how the federal Medicaid cuts would be allocated across the states using prior modeling work and state-level data. Data sources include:
The analysis allocates the newly uninsured stemming from a loss of state-funded coverage across the states proportionally to the federal spending reductions resulting from the new penalty on ACA expansion states that offer state-funded coverage. Changes in the ACA Marketplaces: Increases in the uninsured population are taken from Congressional Budget Office estimates. Impacts of individual provisions within the Energy and Commerce and Ways and Means sections of the One Big Beautiful Bill Act are broken out in detail and separately apportioned to calculate state-level estimates.
Because the policy changes in the Trump administration’s proposed program integrity rule have already been proposed through regulation, CBO assigned half of the effect of codifying the proposed rule (900,000 increase in uninsured) to the reconciliation legislation while the other half is accounted for in the baseline. Therefore, this analysis considers only half of the estimated state-level impact from the proposed rule for Figure 1 (900,000), and the whole effect in Figure 2 (1.8 million). Due to rounding in the CBO estimates, increases in the uninsured due to individual provisions have been scaled to sum up to the totals provided by CBO. Downward scaling was subsequently applied to all provisions other than program to account for the interaction effects within the reconciliation package. Population Estimates: Decennial state-level population projections from the Weldon Cooper Center for Public Service are used to interpolate the population in 2034 assuming compound population growth. The percentage point increase of the uninsured population per state reflects the estimated increase in the uninsured as a share of the projected population. The total impact from all changes were aggregated then rounded to two significant figures, with the percentage point increase in the uninsured population rounded to the nearest whole number. |