5 Key Facts About Children with Special Health Care Needs and Medicaid
Options under consideration in Congress to reduce Medicaid spending to help pay for tax cuts could have major implications for children with special health care needs. Medicaid provides comprehensive health coverage to about 4 in 10 children nationwide, including over 8 in 10 children in poverty, and is a major source of coverage for children with special health care needs. Medicaid also accounts for over half of all long-term care spending, including home care, which can provide the support children with special health care needs require to live at home with their families. Major cuts to federal Medicaid funding would put states at significant financial risk, forcing them to make tough choices about reducing the number of people covered, covering fewer benefits, or reducing payment rates for physicians, hospitals, nursing homes, and other providers. Proposals to limit federal spending on Medicaid could potentially result in reductions in eligibility or coverage or make it more difficult for children with special health care needs to access the care they need. Amid debates to limit federal Medicaid support, this brief analyzes key characteristics of children with special health care needs and explores how Medicaid provides coverage for them.
1. Medicaid is a major source of coverage for children with special health care needs.
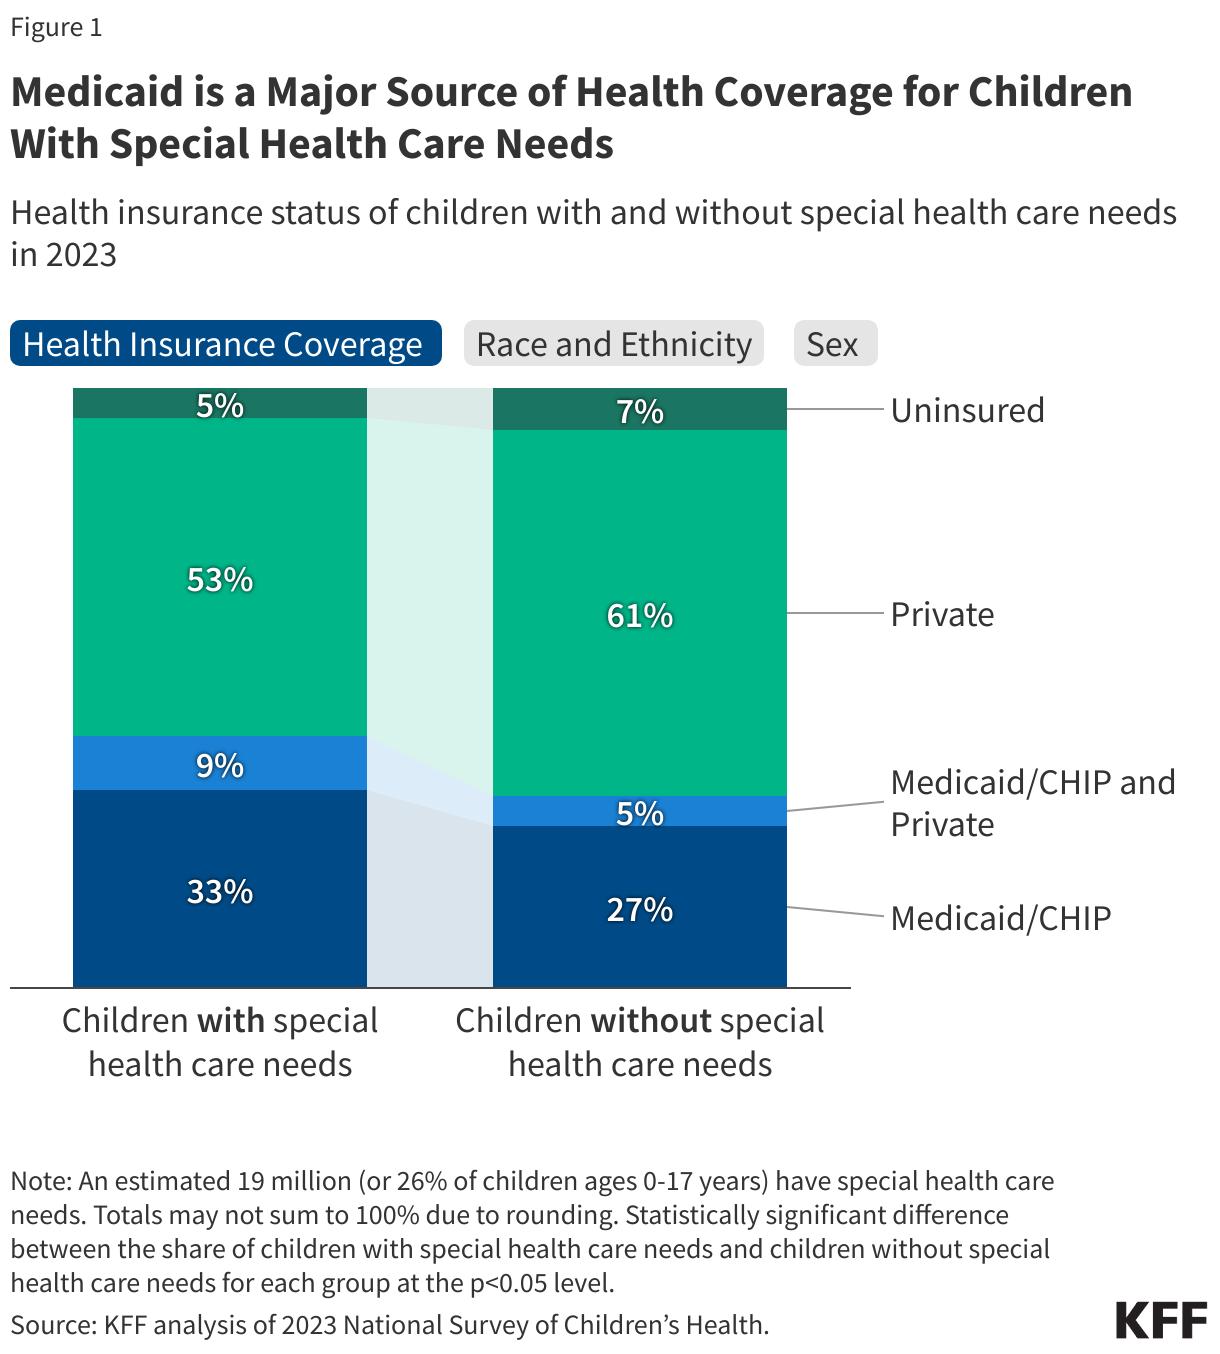
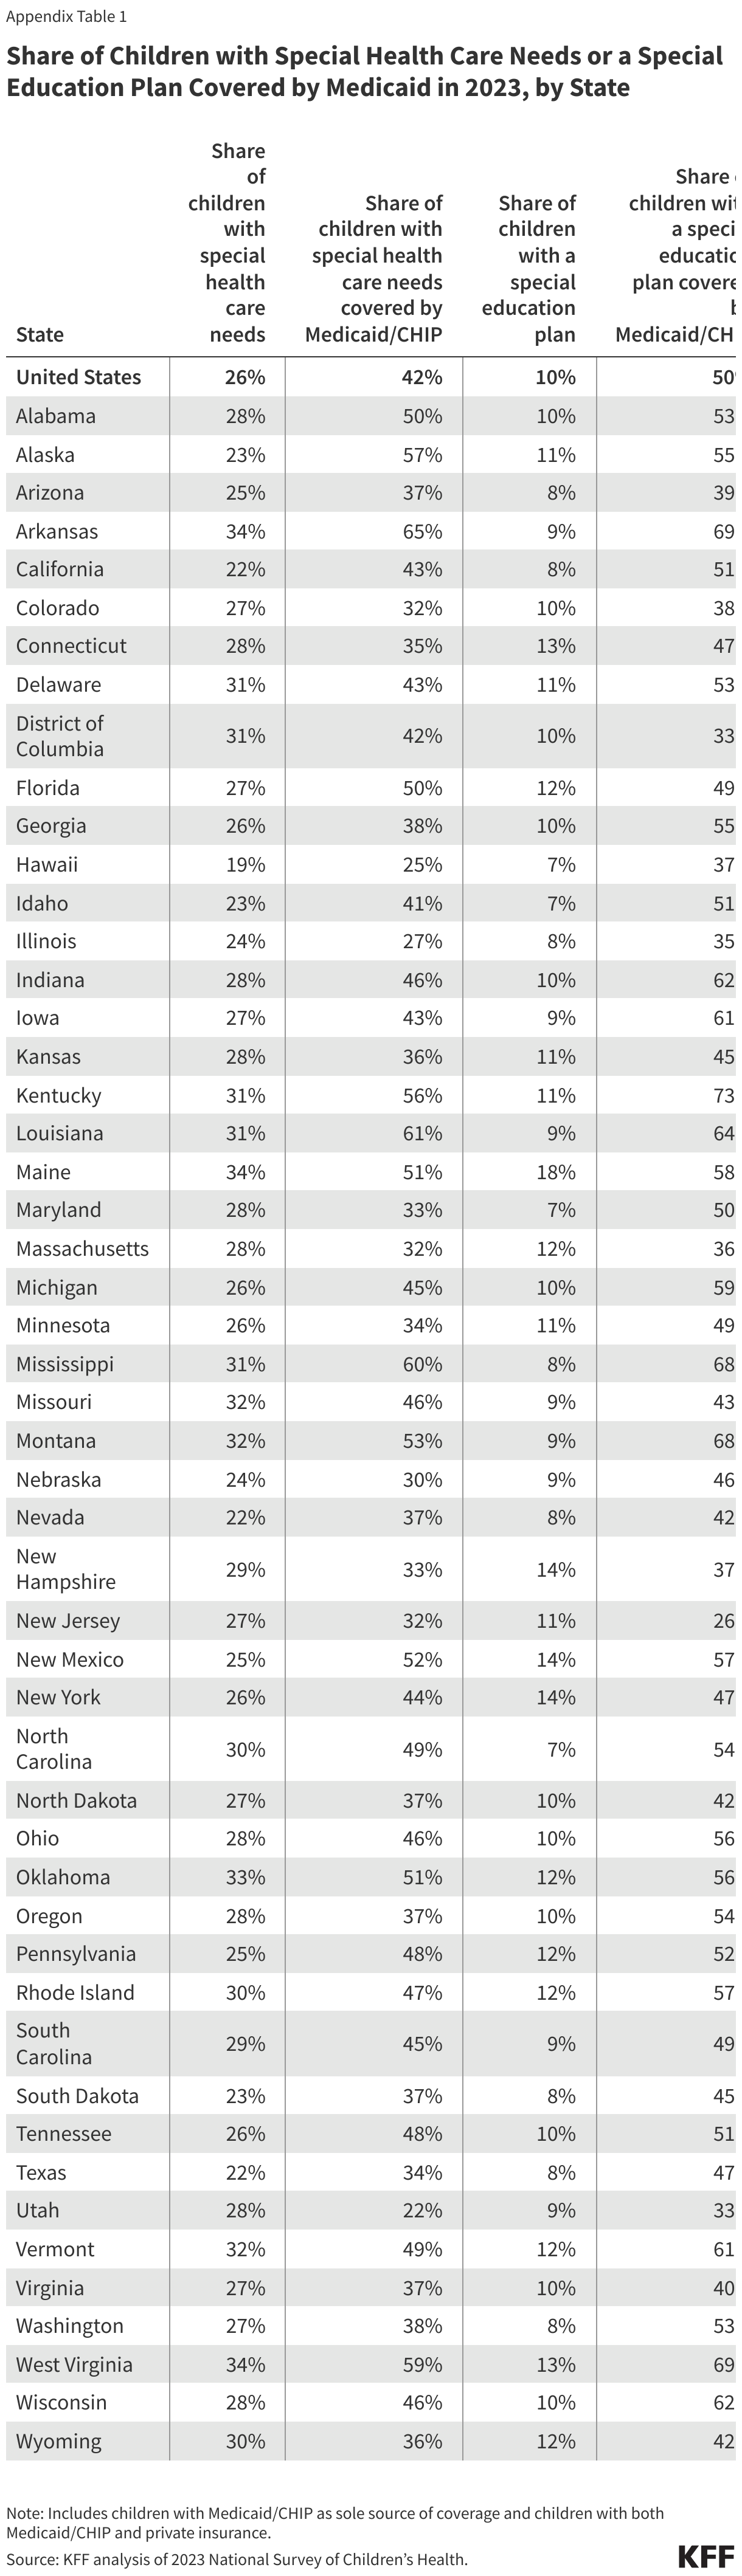
Children with special health care needs (CSHCN) are “children who have chronic physical, developmental, behavioral, or emotional conditions and who require health and related services of a type or amount beyond that required by children generally”. An estimated 19 million or more than one-quarter of children have special health care needs in the US (Appendix Table 1).
Medicaid (in addition to CHIP) covers more than four in ten children with special health care needs compared with one-third of children without special health care needs (Figure 1). Medicaid is the only source of coverage for one in three children with special health care needs, while another 9% have Medicaid to supplement private insurance. Medicaid covers services that private insurance typically does not, including long-term care and home care, and has cost-sharing protections that help keep health care more affordable for families. Further, when compared with children without special health care needs, larger shares of children with special health care needs are White or Black, while smaller shares are Hispanic or Asian, and a larger share of children with special health care needs are male compared with children without special health care needs.
Children with special health care needs utilize more health care services, including inpatient, outpatient, emergency, and specialty care, and account for a larger share of health care expenditures compared with children without special health care needs. KFF analysis also shows Medicaid spending per child enrolled through an eligibility pathway for children with disabilities (known as the Katie Beckett pathway) was almost six times higher ($17,500) than Medicaid spending per child overall ($3,023).
2. The share of children with special health care needs covered by Medicaid varies by state.
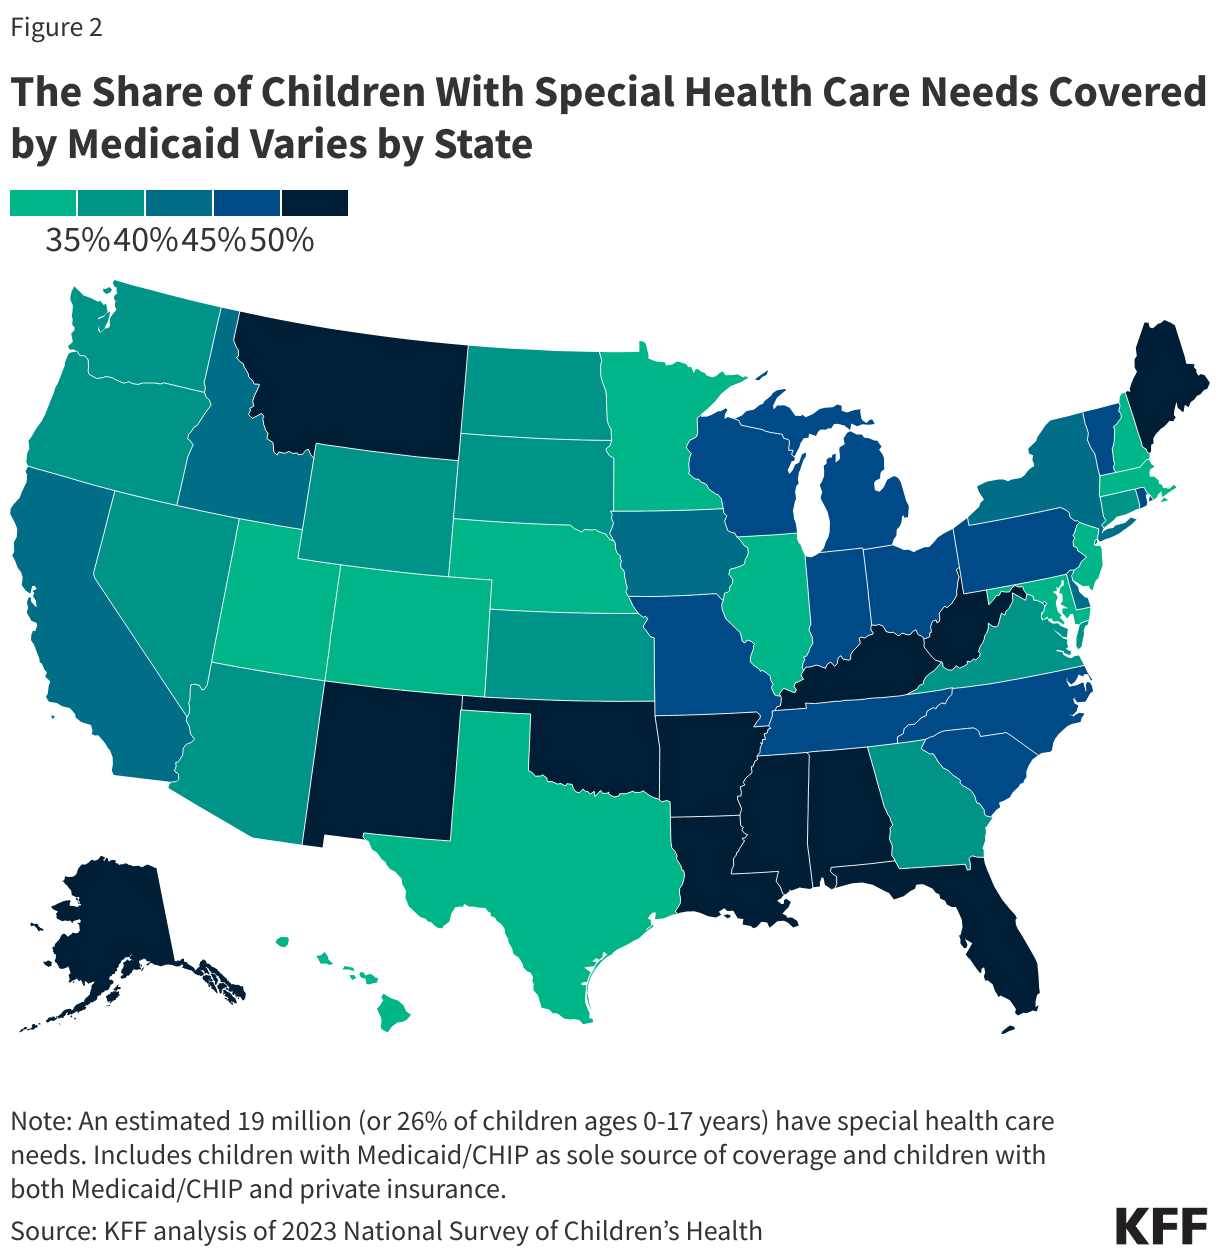
The share of children with special heath care needs covered by Medicaid (in addition to CHIP) ranges from under 30% in Utah, Hawaii, and Illinois to 60% or higher in Mississippi, Louisiana, and Arkansas (Figure 2, Appendix Table 1). This includes children covered by Medicaid alone as well as those with Medicaid to supplement private insurance.
Factors that can contribute to state Medicaid programs covering more children with special health care needs include Medicaid income eligibility limits in the state and the state’s disability-related eligibility pathway options. Children with special health care needs may be eligible for Medicaid on the basis of age and income alone or through pathways that are specific to people with disabilities. Federal Medicaid rules require states cover children with household incomes up to 138% of the federal poverty level (FPL), but all states opt to expand financial eligibility to higher income levels. As of January 2025, the median financial eligibility level for Medicaid/CHIP children nationally was 255% FPL ($67,957/year for a family of three) but ranged from 190% to 405% FPL across states. States are also generally required to cover children who receive Supplemental Security Income, which provides monthly income to low-income children whose physical or mental impairments result in marked and severe functional limitations and are expected to last for at least 12 months or result in death.
States may choose to offer other disability-related pathways, which have higher income limits. There are two pathways that are specific to children. Children who qualify for Medicaid through those pathways may have both Medicaid and private health insurance, which reflects the fact that private insurance often does not cover all of the services that children with I/DD typically need. Under the Katie Beckett option, 43 states cover children under age 19 who are disabled and living at home and who would be eligible for Medicaid if they were living in an institution. Available in 9 states, the Family Opportunity Act pathway is an optional program for states to adopt that provides coverage to children with significant disabilities living at home. This program allows children with disabilities whose family income is below 300% FPL to buy into Medicaid.
Managed care is the dominant delivery system for people enrolled in Medicaid, and most states cover at least some children with special health care needs through comprehensive, risk-based managed care organizations (MCOs). However, how managed care plans structure their health care delivery for children with special health care needs varies by state.
3. Children with special health care needs covered by Medicaid have greater health care needs compared with private insurance.
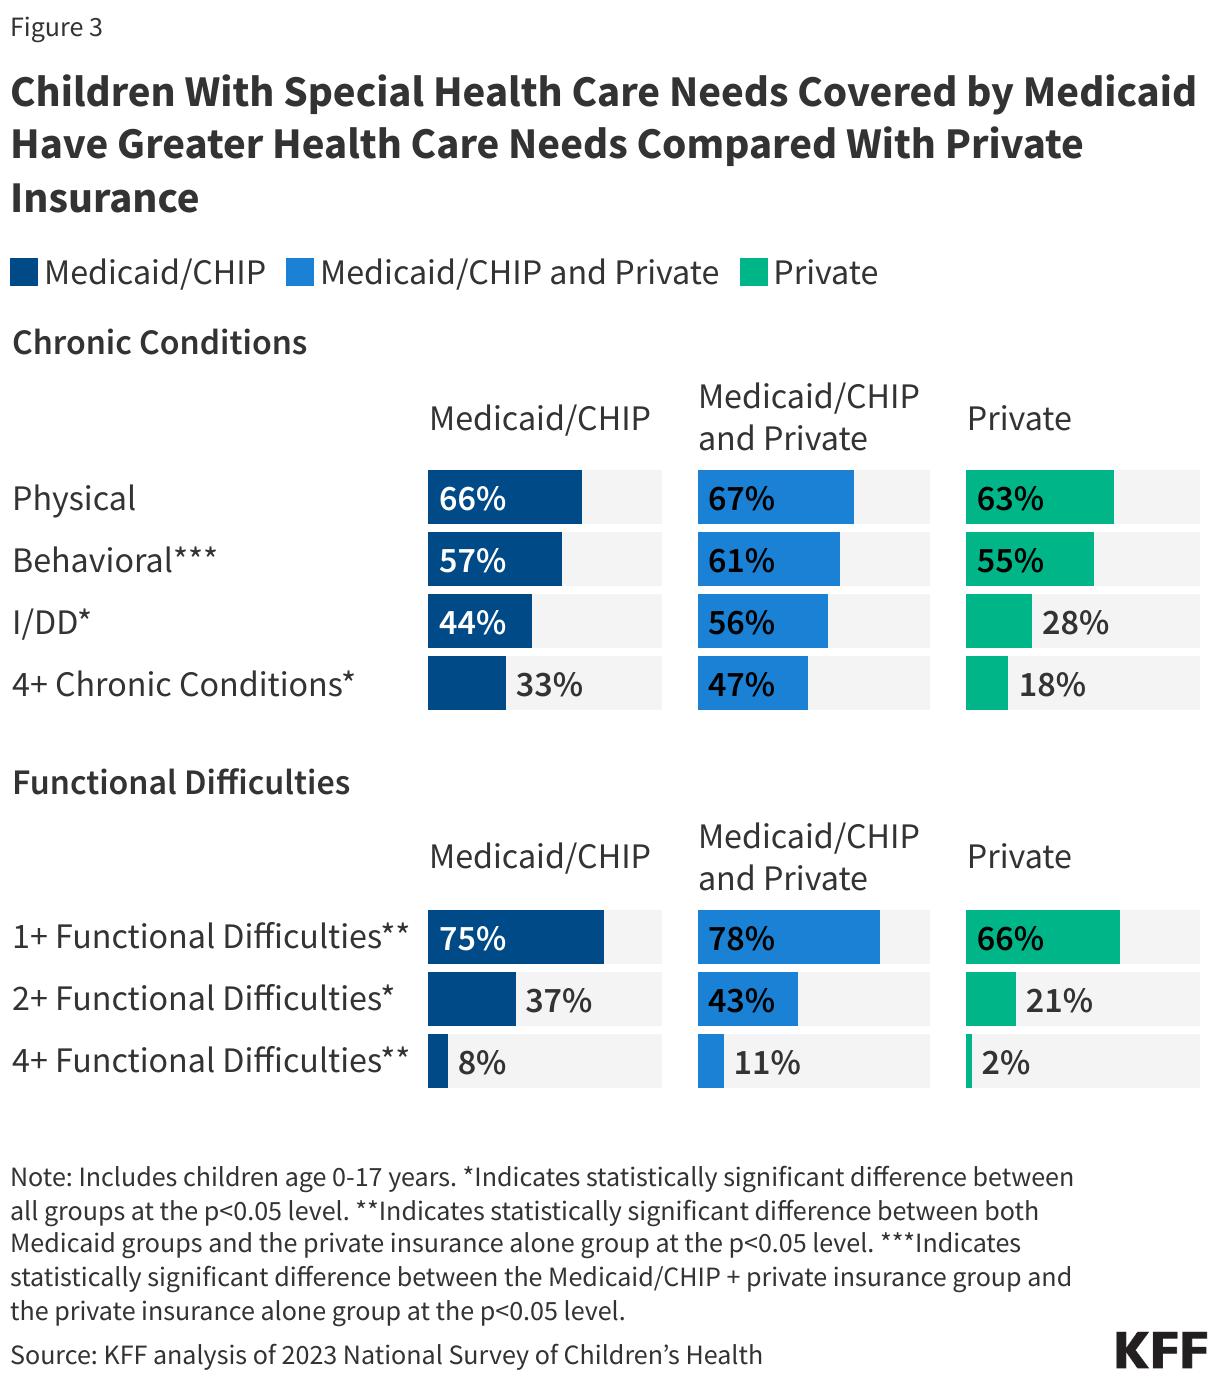
Children with special health care needs covered by Medicaid are more likely to have an intellectual or developmental disability (I/DD) compared with children with special health care needs covered by private insurance alone (Figure 3). I/DD are typically diagnosed during childhood and include a number of conditions (see Methods). Just under half (44%) of children with Medicaid alone and over half (56%) with Medicaid and private insurance have an I/DD compared with 28% of private insurance. Rates of physical health conditions among children with special health care needs are similar across Medicaid alone (66%), Medicaid and private (67%), and private insurance alone (63%). Rates of behavioral health conditions are similar for Medicaid alone (57%) and private insurance alone (55%) but higher for children with both Medicaid and private insurance (61%).
Children with special health care needs covered by Medicaid are also more likely to have multiple chronic conditions and report functional difficulties compared with private insurance alone. One-third (33%) of children with Medicaid alone and almost half of children (47%) with Medicaid and private insurance report having four or more chronic conditions, compared with almost one-fifth (18%) of those covered by private insurance. Children with special health care needs and Medicaid also report more functional difficulties (one or more, two or more, four or more functional difficulties) compared with children with private insurance only. Functional difficulties impact the day-to-day life of children with special health care needs and can include challenges such as difficulty concentrating, walking or climbing stairs, dressing or bathing, or problems with hearing or vision. Children with both Medicaid and private insurance typically have the greatest health care needs, with larger shares of children with Medicaid and private reporting multiple co-occurring chronic conditions (data not shown) as well as four or more chronic conditions.
4. EPSDT helps children with special health care needs meet their health care needs and protects them from high out-of-pocket costs.
Medicaid’s benefit package for children, Early and Periodic Screening, Diagnostic and Treatment (EPSDT), provides a set of comprehensive health care services to Medicaid enrollees under age 21. Under EPSDT, states are required to cover all screening services for children as well as any services “necessary… to correct or ameliorate” a child’s physical or mental health condition. Through the EPSDT benefit, Medicaid provides more comprehensive coverage for these children than the typical private insurance plan and increases access to needed services that improve the quality of daily life. Under EPSDT, states provide primary care and screenings for developmental and behavioral health conditions, as well as for vision, hearing, and dental conditions. States also cover needed therapies, long-term care and home care, assistive technology, and non-emergency medical transportation. Some children with special health care needs covered by Medicaid also receive services and supports from Title V agencies, which can include the coordination of EPSDT with other federal programs like supplemental food programs.
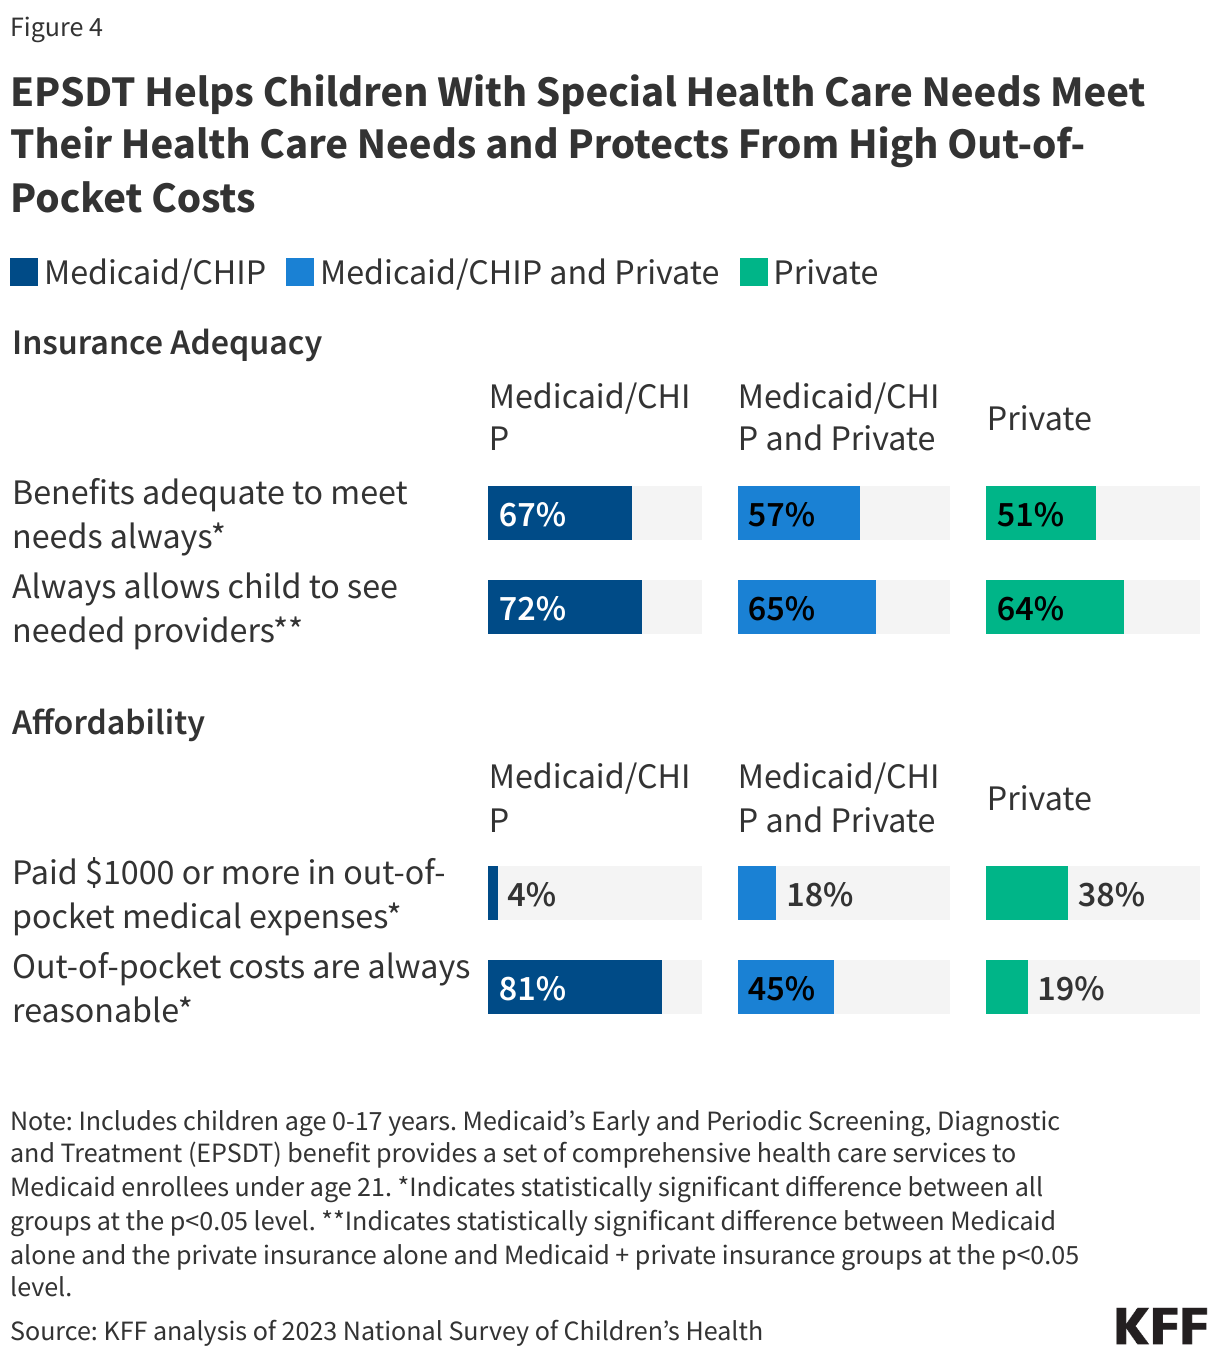
Due in part to the EPSDT benefit, children with special health care needs and Medicaid alone are more likely to report that their benefits are adequate to meet their needs and that they can see needed providers compared with children with private insurance alone (Figure 4). Medicaid generally protects beneficiaries from high out-of-pocket costs; parents of children with special health care needs and Medicaid alone are more likely to report their out-of-pocket costs are reasonable and under $1000 compared with those with private insurance alone.
Children with special health care needs can encounter barriers to coverage and care when transitioning out of children’s Medicaid eligibility pathways and the EPSDT benefit. Families of children with special health care needs who are aging out of child benefits report that there is frequently a lack of clear information available to them and that they are often unprepared for the transition. Medicaid eligibility for children generally and for children with disabilities is typically more expansive than that of adults, meaning some children with special health care needs could lose Medicaid coverage when they age out (especially in states that have not expanded Medicaid under the Affordable Care Act). Adult Medicaid benefits are typically more limited than EPSDT, resulting in potential decreases in services relative to what is available to children with special health care needs.
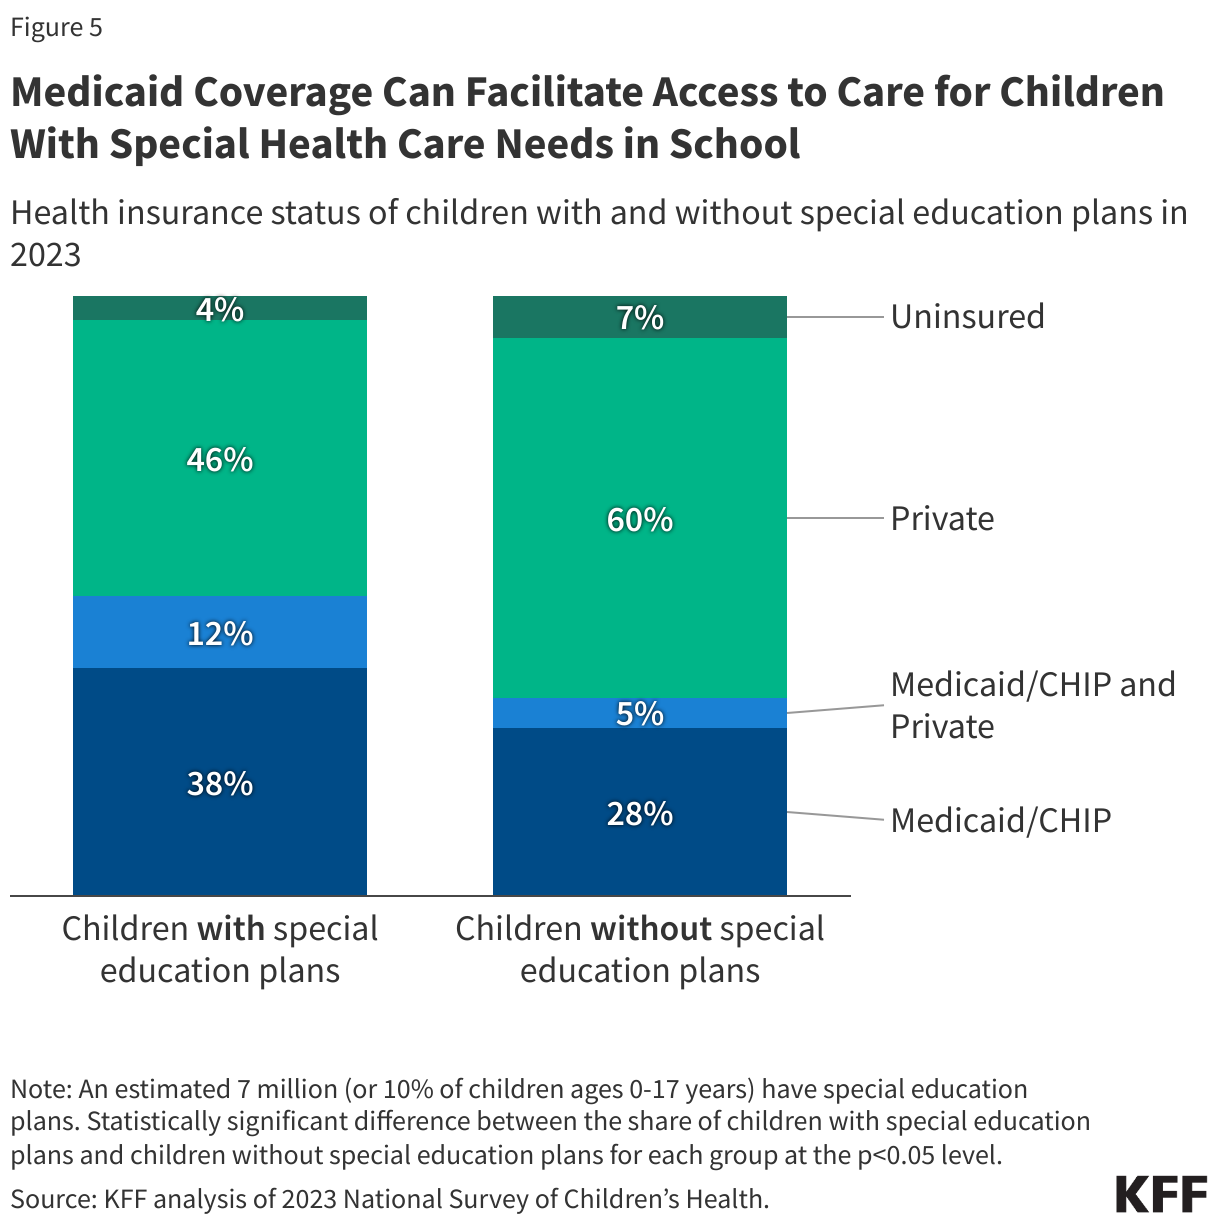
5. Medicaid coverage can facilitate access to care for children with special health care needs in school.
There are an estimated 7 million children, or 10% of all children in the U.S., who currently have special education plans, and over two-thirds of these children have special health care needs. This includes children receiving special education services under a special education or early intervention plan (often an Individualized Education Plan (IEP) or Individualized Family Service Plan). Medicaid covers half of all children with special education plans compared with one-third of children without special education plans (Figure 5). The share varies by state, ranging from about 30% in New Jersey, Utah, and DC to about 70% in West Virginia, Arkansas, and Kentucky (Appendix Table 1). If a child is eligible for both special education services and Medicaid, federal law requires state Medicaid programs to pay for services that are both educationally and medically necessary. This is an exception to the general rule that usually makes Medicaid the payer of last resort when other sources of coverage are available. If a device or service included in a child’s special education plan under the Individuals with Disabilities Education Act (IDEA) is also medically necessary, then Medicaid is obliged to pay before the school district (see 34 CFR Sections 300.301-300.306).
School-based Medicaid supports can include reimbursement for medically necessary services that are part of a student’s IEP as well as reimbursement for eligible health services provided more broadly for students with Medicaid coverage. Medicaid may cover a range of health services provided to children in schools including health screening services, speech or physical therapy for children with disabilities, and a range of medically necessary physical, mental health, and SUD services. As youth mental health concerns have grown in recent years, both the federal government and states have worked to increase access to behavioral health services by expanding school-based care for students. This includes leveraging Medicaid to improve and address gaps in school-based behavioral health services.
Appendix
Methods
Data: This analysis uses the 2023 National Survey of Children’s Health (NSCH), the most current data available.
Defining CSHCN: The NSCH continues to use the CSHCN Screener to identify children with special health care needs. To meet the criteria for having a special health care need, a child must experience a health consequence that is due to a medical or other health condition that has lasted or is expected to last for 12 months or longer. However, research has shown that some children with special health care needs may be excluded from this definition, and, in 2024, the definition of CSHCN was slightly broadened to incorporate more children who may need supportive services. The CSHCN screener remains in use and is the basis of the expanded definition, which is used in this analysis. Using the original definition, 15 million or 21% of children ages 0-17 have special health care needs compared with 19 million or 26% of children using the expanded definition.
Identifying chronic conditions: This analysis identifies any chronic condition as having one or more conditions from a list of 24 health conditions asked about in the 2023 survey (following methodology from the Data Resource Center). Those 24 health conditions were then categorized into three groups: physical, behavioral, and I/DD. To the extent possible across data sources, these definitions align with other KFF analysis of chronic conditions.
- Physical: Allergies, asthma, autoimmune disease, cerebral palsy, type 2 diabetes, epilepsy or seizure disorder heart condition, frequent/severe headaches/migraines, blood disorders, cystic fibrosis, hearing problems, and vision problems.
- Behavioral: Tourette syndrome, anxiety problems, depression, behavioral or conduct problems, and ADD/ADHD.
- I/DD: Down syndrome, developmental delay, intellectual disability, speech or other language disorder, learning disability, autism or ASD, and fetal alcohol spectrum disorder.
Limitations: The NSCH is based on parent recollection, and studies have shown there can be differences between self-reported survey data and claims data. This analysis breaks down indicators by health insurance coverage status for children with special health care needs but does not include estimates for uninsured children or children who did not report coverage status. This is due to many of the estimates for these children not meeting the minimum standards for reliability.
