Disparities in Health Measures By Race and Ethnicity Among Beneficiaries in Medicare Advantage: A Review of the Literature
Executive Summary
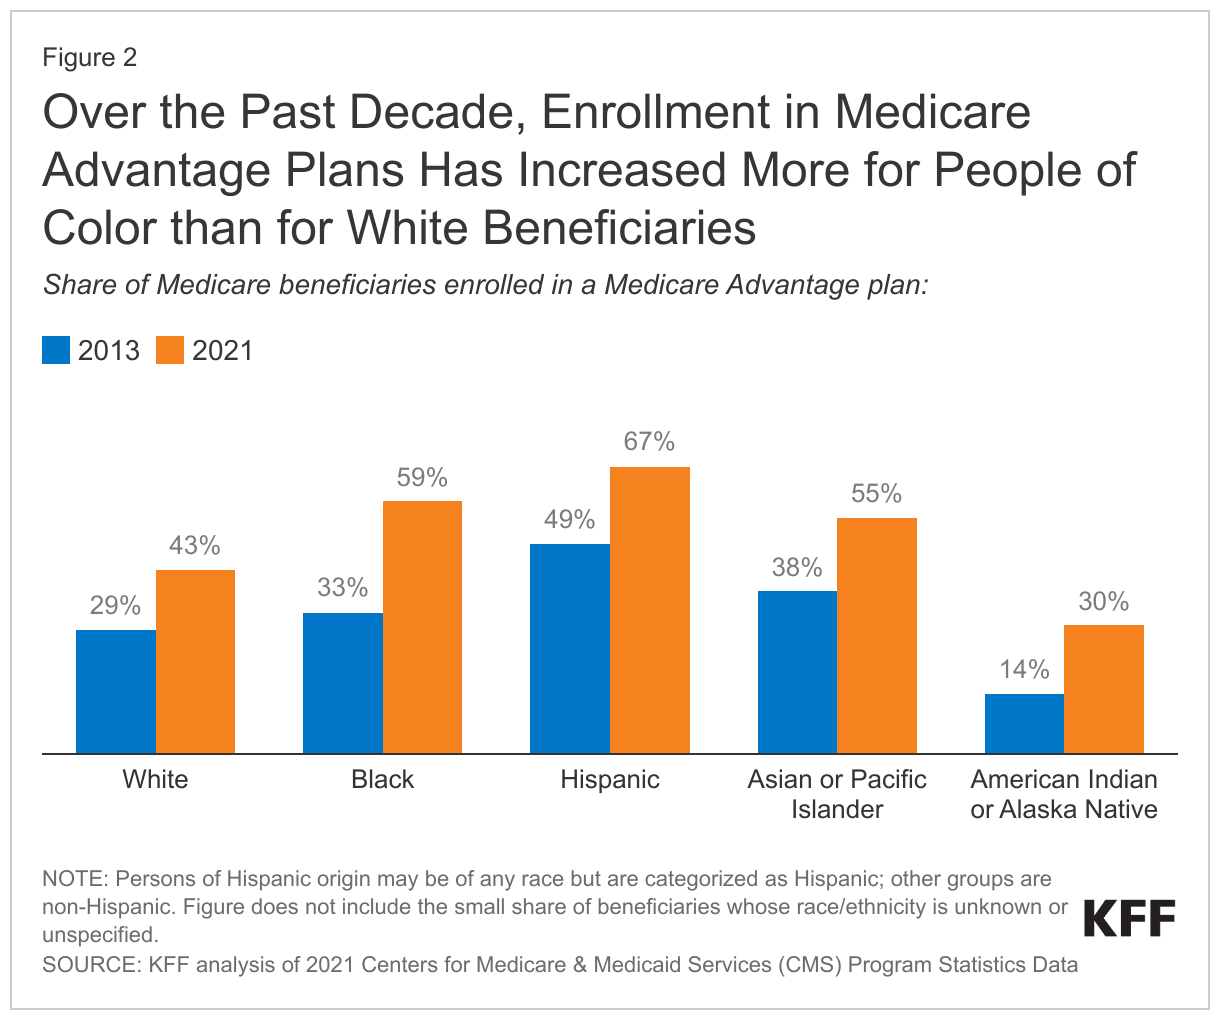
During the past decade, Medicare Advantage enrollment has increased steadily, with particularly rapid growth among people of color. Today, just over half of all eligible Medicare beneficiaries are enrolled in Medicare Advantage plans, with higher enrollment rates among Black, Hispanic, and Asian and Pacific Islander beneficiaries than among White beneficiaries. As of 2021, 59% of Black Medicare beneficiaries, 67% of Hispanic beneficiaries, and 55% of Asian and Pacific Islander beneficiaries were enrolled in a Medicare Advantage plan as compared with 43% of White beneficiaries.
Despite the relatively high Medicare Advantage enrollment rates among people of color relative to White beneficiaries, little is known about whether there are racial and ethnic disparities in quality of care and health care experiences among Medicare Advantage enrollees.
A previous KFF review of 62 studies compared Medicare Advantage and traditional Medicare on measures of beneficiary experience and quality of care. The prior review identified relatively few studies that examined differences among beneficiaries by race and ethnicity between Medicare Advantage and traditional Medicare, making it difficult to compare the experiences of people of color across the two sources of Medicare coverage.
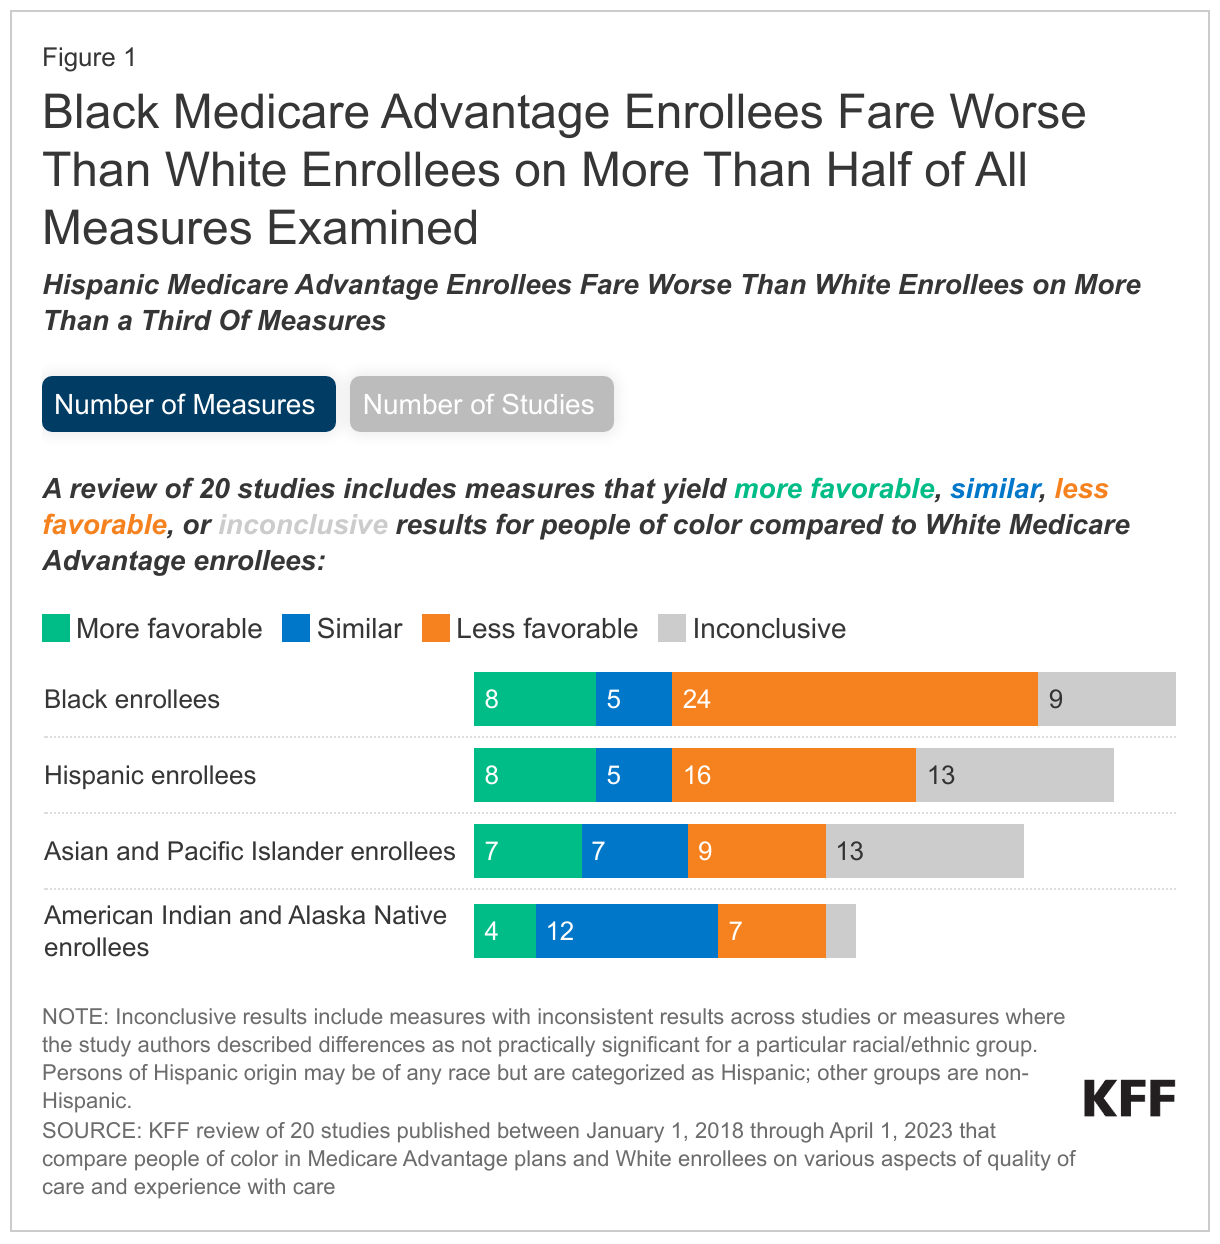
This review examines differences in measures of quality of care and beneficiary experience between people of color in Medicare Advantage plans and White Medicare Advantage enrollees or the total Medicare Advantage population. The analysis synthesizes findings from 20 identified studies that were published during the 5-year period between January 2018 and April 2023. These 20 studies collectively report on 46 different measures of quality of care and beneficiary experience, but not all studies examined all groups or included all measures. All differences described in this report are statistically significant unless noted otherwise (e.g., for results that are reported as similar). Most of the studies (17 of 20) controlled for differences in enrollee health status and other demographic characteristics in some fashion. (See Methods for additional information about the criteria used to select studies, Appendix Table 1 for a complete list of measures included in these studies, and Appendix Table 2 for more a detailed description of each study.)
While the scope of this review is limited to Medicare Advantage enrollees, the racial and ethnic disparities in quality of care and beneficiary described in this report mirror disparities in health and health care in traditional Medicare, the overall Medicare population, and more broadly, the U.S adult population.
Key Takeaways
Black enrollees: Results are less favorable for Black Medicare Advantage enrollees than White Medicare Advantage enrollees on more than half (24) of the 46 measures examined for this group in 19 studies. Results were more favorable on eight measures, similar on five measures, inconsistent across studies on two measures, and for seven measures, study authors described differences as not practically significant. For example:
- Preventive service use: a higher share of Black Medicare Advantage enrollees than White enrollees received breast cancer screenings, colorectal cancer screenings, and pap smears, but a lower share of Black enrollees received prostate cancer screenings and flu vaccines.
- Hospitalizations: a higher share of Black than White Medicare Advantage enrollees were admitted to the hospital for an ambulatory care sensitive condition – a measure of potentially preventable hospitalizations – and a higher share of Black than White enrollees were readmitted to the hospital within 30 days.
- Mental health: a lower share of Black than White enrollees with depression were treated with antidepressant medication and remained on the medication for at least 12 weeks.
- Experiences with care: a lower share of Black than White Medicare Advantage enrollees reported seeing a specialist in the past year, but similar shares of Black and White enrollees reported having well-coordinated care and getting needed prescription drugs.
- Plan ratings: a lower share of Black than White enrollees were enrolled in higher-rated Medicare Advantage plans.
Hispanic enrollees: Findings are less favorable for Hispanic than White Medicare Advantage enrollees on more than a third (16) of the 42 measures examined for this group in 17 studies. Findings were more favorable on eight measures, similar on five measures, inconsistent across studies on three measures, and for 10 measures, study authors described differences as not practically significant. For example:
- Preventive service use: a higher share of Hispanic than White Medicare Advantage enrollees reported getting screenings for breast cancer, but a lower share received flu vaccines.
- Disease management: a lower share of Hispanic than White Medicare Advantage enrollees received follow-up care after emergency department visits for certain conditions, such as for mental health and a set of multiple high-risk chronic conditions.
- Experiences with care: a lower share of Hispanic than White Medicare Advantage enrollees reported getting appointments and care quickly.
- Hospitalizations: Hispanic and White enrollees had similar rates of hospital readmissions and hospitalizations for ambulatory care sensitive conditions.
- Plan ratings: A lower share of Hispanic than White enrollees were enrolled in higher-rated Medicare Advantage plans.
Asian and Pacific Islander enrollees: Findings are less favorable for Asian and Pacific Islander enrollees than White enrollees on nine of the 36 measures in 13 studies. Findings were more favorable on seven measures, similar on seven measures, inconsistent across studies on three measures, and for 10 measures, study authors described differences as not practically significant. For example:
- Preventive services: a higher share of Asian and Pacific Islander than White enrollees received a flu vaccine, while similar shares received colorectal cancer screenings.
- Disease management: a higher share of Asian and Pacific Islander enrollees than White enrollees received statin therapy as part of their diabetes care, but a lower share of Asian and Pacific Islander enrollees with a new episode of alcohol or other drug dependence initiated treatment for alcohol or other drug dependence.
- Hospitalizations: Asian and Pacific Islander and White enrollees had similar rates of hospitalizations for ambulatory care sensitive conditions.
American Indian and Alaska Native enrollees: Less than half of the studies identified in this review (9 of 20 studies) presented findings for American Indian and Alaska Native Medicare Advantage enrollees, and collectively, they included fewer measures (25) than studies of Black (46), Hispanic (42) or Asian and Pacific Islander (36) Medicare Advantage enrollees. Findings were less favorable for American Indian and Alaska Native enrollees that White Medicare Advantage enrollees on seven measures, more favorable on four measures, similar on 12 measures, inconsistent across studies on one measure, and for one measure, study authors described differences as not practically significant. For example:
- Preventive services: a higher share of American Indian and Alaska Native enrollees than White enrollees received breast cancer screenings, and similar shares received a flu vaccine.
- Disease management: a lower share of American Indian and Alaska Native enrollees than White enrollees had their blood sugar and blood pressure controlled as part of diabetes care.
Gaps in the research and data present challenges in understanding the experiences of specific racial and ethnic groups in Medicare Advantage plans.
- Medicare Advantage insurers do not report data on prior authorization rates and denials by race or ethnicity, or the use of supplemental benefits for the overall Medicare Advantage population or by race or ethnicity.
- None of the studies examine outcomes of care such as mortality rates or hospital-acquired infections.
- None examine the use of post-acute care among Medicare Advantage enrollees by race and ethnicity.
- None of the studies report findings for Native Hawaiians or other Pacific Islanders separately from other groups, and none of the studies compare measures of quality of care and beneficiary experience between people identifying as two or more racial or ethnic groups with White enrollees.
- None of the studies present stratified estimates for all of the racial and ethnic groups listed in current federal minimum standards. Studies also varied in how they identified race and ethnicity, with some using self-identified data and others using imputed race/ethnicity data.
- Few studies stratify race/ethnicity findings among Medicare Advantage enrollees by gender or rural residence.
- None of the studies stratify findings among Medicare Advantage enrollees by race/ethnicity and dual eligibility status, even though people of color comprise a disproportionate share of Medicare Advantage enrollees who are dual-eligible individuals.
With more than half of Black, Hispanic, and Asian and Pacific Islander beneficiaries enrolled in Medicare Advantage plans, the studies in this review provide some insight into how well Medicare Advantage plans are serving people of color relative to White enrollees. However, the relatively small number of studies coupled with gaps in research present challenges for beneficiaries in making coverage decisions and for policymakers in understanding how best to make Medicare Advantage work well generally and for people of color.
Report
Racial and Ethnic Health Equity in Medicare Advantage: Literature Review
Medicare Advantage is now the dominant form of Medicare coverage for Black, Hispanic, and Asian or Pacific Islander beneficiaries, while the share of American Indian or Alaska Native enrollees in these plans has more than doubled within the past decade (Figure 2). Medicare Advantage plans have several features that may attract enrollees, including people of color. These private plans are often available at little or no extra premium (other than the Part B premium), generally include an out-of-pocket limit (unlike traditional Medicare), and typically offer extra benefits such as dental, vision, and hearing services. Given relatively high Medicare Advantage enrollment rates among people of color, questions have emerged from policy makers, consumers, and others in the general community about whether there are racial and ethnic disparities in quality of care and beneficiary experience among Medicare Advantage enrollees.
To inform these questions, this brief summarizes findings from 20 studies published between January 1, 2018 and April 1, 2023 that compare quality of care and beneficiary experiences between people of color in Medicare Advantage and White enrollees, or the total Medicare Advantage population. These studies evaluated 46 different measures of quality of care and enrollee experience in Medicare Advantage. This report also discusses gaps in data and in the literature that contribute to challenges in understanding racial and ethnic disparities in quality of care and beneficiary experience in Medicare Advantage.
How do measures of quality of care and beneficiary experience compare between Black and White Medicare Advantage enrollees?
Nineteen studies examined 46 measures of quality of care and beneficiary experience among non-Hispanic Black enrollees (hereafter referred to as “Black enrollees”), including 17 studies that compared estimates for Black enrollees to White enrollees, and two studies that compared estimates for Black enrollees to the overall Medicare Advantage population, which is comprised of mostly White enrollees. These 19 studies examined hospital readmission rates (1 study), potentially avoidable hospitalizations for ambulatory care sensitive conditions (ACSCs) (2 studies), specific measures of disease management (8 studies), quality of plans (3 studies), measures related to experiences with care (8 studies), and utilization of preventive services (7 studies) (Appendix Table 1, Appendix Table 2). Most studies included multiple measures, and some measures were examined among enrollees with different conditions (e.g., receipt of statin therapy examined separately for enrollees with diabetes and cardiovascular conditions).
Among the 19 studies included in this review that compared measures for Black and White Medicare Advantage enrollees, results were less favorable for Black Medicare Advantage enrollees on more than half (24) of the measures examined for this group, more favorable on eight measures, similar on five measures, inconsistent across studies on two measures, and for seven measures, study authors described differences as not practically significant. A description of these results follows.
Hospital Readmissions and Potentially Avoidable Hospitalization
- Black Medicare Advantage enrollees had higher rates of hospitalization for ambulatory care sensitive conditions than White enrollees, based on two studies that controlled for differences in enrollees’ health status.1 , 2 One of these studies also examined hospitalizations for ambulatory care sensitive conditions in different health care markets and found that differences persisted across geographic areas.3
- An additional study found that among enrollees in skilled nursing facilities, Black enrollees had higher rates of 30-day hospital readmissions than White enrollees after adjusting for differences in enrollee health status and other demographic characteristics.4 The differences were lower, but persisted when comparing Black and White enrollees who had stays at the same skilled nursing facility.
Disease management
- Mental health and substance use care: Compared to both White enrollees and the overall Medicare Advantage population, a lower share of Black enrollees with depression received antidepressant medication management (i.e., treated with antidepressant medication and remained on the medication for at least 12 weeks),5 , 6 , 7 and among those who were hospitalized or who had an emergency department visit for treatment of selected mental health conditions, a lower share of Black enrollees received follow-up care within 30 days of the hospital stay8 , 9 , 10 or emergency department visit.11 , 12 However, among enrollees with a new episode of alcohol or other drug dependence, a higher share of Black enrollees than White enrollees and the overall Medicare Advantage population initiated treatment for alcohol or other drug dependence within 14 days of diagnosis.13 , 14
- Cardiovascular health: Compared to White enrollees and the overall Medicare Advantage population, a lower share of Black enrollees who were hospitalized and discharged with a diagnosis of acute myocardial infarction (i.e., a heart attack) received beta-blocker treatments;15 , 16 a lower share of Black enrollees with cardiovascular disease adhered to statin therapy;17 , 18 and a lower share of Black enrollees with hypertension had their blood pressure controlled.19 , 20 , 21 Additionally, among enrollees with a history of a cardiac event, a lower share of Black enrollees than White enrollees had their cholesterol adequately controlled.22
- Diabetes care: Among enrollees with diabetes, a lower share of Black enrollees than White enrollees and the overall Medicare Advantage population had their blood sugar and blood pressure under control and adhered to statin therapy.23 , 24 A lower share of Black enrollees than White enrollees used diabetes technology (e.g., insulin pump, continuous glucose monitoring).25 Conversely, a higher share of Black enrollees with diabetes than White enrollees and the overall Medicare Advantage population received eye exams.26 , 27
- Multiple high-risk chronic conditions: Among enrollees with multiple high-risk chronic conditions, a lower share of Black enrollees than White enrollees and the overall Medicare Advantage population received follow-up care within seven days of an emergency department visit.28 , 29
- Other conditions: Among enrollees with chronic kidney disease, a lower share of Black enrollees than White enrollees were not dispensed a prescription for a potentially harmful medication,30 and a higher share of Black enrollees than White enrollees had their kidney function decline at a faster rate over time.31 Conversely, among enrollees with dementia, a higher share of Black enrollees than White enrollees and the overall Medicare Advantage population were not dispensed a prescription for a potentially harmful medication for dementia.32 , 33 A similar share of Black and White women ages 67 to 85 years who suffered a fracture had their osteoporosis adequately managed,34 and a similar share of Black and White enrollees were dispensed a prescription for their rheumatoid arthritis.35
Experiences with care
- A lower share of Black enrollees than White enrollees reported having a specialist visit in the past year, having a usual source of care, and having a primary care clinician as the source of regular care.36
- A similar share of Black and White enrollees reported well-coordinated care and getting needed prescription drugs.37 Findings related to getting needed care were mixed: one study found that a similar share of Black and White enrollees reported getting needed care,38 while a second study, which did not control for differences in enrollee characteristics, found that a lower share of Black enrollees than White enrollees reported getting needed care.39
- A similar share of Black enrollees and the overall Medicare Advantage population reported getting appointments and care quickly and that it was easy to get needed prescription drugs.40
- A similar share of Black and White enrollees were enrolled in plans with narrow networks (i.e., less than 25% of available providers included in network) of primary care, psychiatry, and mental and behavioral health providers, based on a study that calculated the share of enrollees with various characteristics who were enrolled in plans with networks of different breadths.41 In a second study, a lower share of Black enrollees with end-stage renal disease were enrolled in plans with narrow networks of dialysis facilities than White enrollees.42
Utilization of preventive services
- Vaccines: A lower share of Black enrollees than White enrollees and the overall Medicare Advantage population received flu vaccines43 , 44 , 45 , 46 and pneumonia vaccines,47 but a higher share of Black enrollees than White enrollees completed the full regimen of COVID-19 vaccines.48
- Preventive cancer screenings: A lower share of Black enrollees than White enrollees and the overall Medicare Advantage population received prostate cancer screenings49 but a higher share of Black enrollees received breast cancer screenings.50 , 51 , 52 A higher share of Black enrollees than White enrollees received colorectal cancer screenings53 and pap smears.54 However, a similar share of Black enrollees and the overall Medicare population received colorectal cancer screenings.55
- Other preventive screenings: A lower share of Black enrollees than White enrollees had their cholesterol levels tested.56 A similar share of Black and White enrollees without diabetes had their blood sugar tested to detect diabetes.57
Quality Ratings of plans
- A lower share of Black enrollees than White enrollees were enrolled in higher-rated plans (i.e., 4-, 4.5- or 5-star plans), a result attributed to limited offerings of higher-rated Medicare plans in counties where Black enrollees reside.58
- Black enrollees were more likely than White beneficiaries to be enrolled in lower-rated plans based on quality ratings calculated from the subset of measures included in the Consumer Assessment of Healthcare Providers and Systems (CAHPS) survey responses.59
- A lower share of Black enrollees than White enrollees were in a vertically integrated plan (defined by the study authors as plans that were associated with a hospital health system that provides care), which the study found had higher overall star ratings.60
How do measures of quality of care and beneficiary experience compare between Hispanic and White Medicare Advantage enrollees?
Seventeen studies examined 42 measures of quality of care and beneficiary experience among Hispanic enrollees, including 15 studies that compared estimates for Hispanic enrollees to White enrollees, and two studies that compared estimates for Hispanic enrollees to the overall Medicare Advantage population. These 17 studies examined hospital readmission rates (1 study), potentially avoidable hospitalizations for ACSCs (1 study), specific measures for disease management (8 studies), quality of plans (3 studies), and measures related to experiences with care (7 studies) (Appendix Table 1, Appendix Table 2). Most studies included multiple measures, and some measures were examined among enrollees with different conditions (e.g., receipt of statin therapy examined separately for enrollees with diabetes and cardiovascular conditions).
Among the 17 studies included in this review that compared measures for Hispanic and White Medicare Advantage enrollees, results were less favorable for Hispanic than White Medicare Advantage enrollees on more than a third (16) of measures examined for this group, more favorable on eight measures, similar on five measures, inconsistent across studies on three measures, and for 10 measures, study authors described differences as not practically significant. A description of these results follows.
Hospital Readmissions and Potentially Avoidable Hospitalization
- Hispanic and White enrollees had similar rates of hospitalization for ambulatory care sensitive conditions after controlling for differences in enrollees’ characteristics, including health status.61
- An additional study found that among enrollees in skilled nursing facilities, Hispanic and White enrollees had similar rates of 30-day hospital readmissions, after adjusting for differences in enrollee characteristics, such as health status.62
Disease management
- Mental health and substance use care: Compared to White Medicare Advantage enrollees and the overall Medicare Advantage population, a lower share of Hispanic enrollees received antidepressant medication management (among those with depression),63 , 64 , 65 received follow-up care within 30 days of an emergency department visit for treatment of selected mental health conditions,66 , 67 and initiated treatment within 14 days of a new episode of alcohol or other drug dependence.68 , 69 , 70 Among two studies that examined the share of enrollees receiving a follow-up visit within 30 days of hospitalization for treatment of select mental health conditions, one study found that a similar share of Hispanic and White enrollees received this follow-up care,71 while the other study found that a higher share of Hispanic enrollees than White enrollees received this follow-up care.72
- Cardiovascular health: Compared to White enrollees and the overall Medicare Advantage population, a lower share of Hispanic enrollees who were hospitalized for a heart attack received beta-blocker treatments,73 , 74 and a lower share of Hispanic enrollees with cardiovascular disease adhered to statin therapy.75 , 76 A similar share of Hispanic and White enrollees with a history of a cardiac event had their cholesterol adequately controlled.77 Findings on a measure related to blood pressure control were mixed: one study found that a higher share of Hispanic enrollees with hypertension had their blood pressure under control compared to White enrollees with hypertension,78 while the second study found that the rates were similar between Hispanic and White enrollees.79
- Diabetes care: Among Medicare Advantage enrollees with diabetes, a lower share of Hispanic enrollees than White enrollees and the overall Medicare Advantage population adhered to statin therapy80 and used diabetes technology,81 but a higher share of Hispanic enrollees received eye exams82 , 83 and statin therapy,84 , 85 and had their blood pressure under control.86 While a similar share of Hispanic and the overall Medicare Advantage population had their blood sugar controlled,87 differences between Hispanic and White enrollees on this measure were mixed: one study found that a lower share of Hispanic enrollees than White enrollees had their blood sugar under control,88 while the second study found that the rates were similar between Hispanic and White enrollees.89
- Multiple high-risk chronic conditions: Among enrollees with multiple high-risk chronic conditions, a lower share of Hispanic enrollees than White enrollees and the overall Medicare Advantage population received follow-up care within seven days of an emergency department visit.90 , 91
- Other conditions: Among enrollees with chronic kidney disease, a lower share of Hispanic enrollees than White enrollees and the overall Medicare Advantage population were not dispensed a prescription for a potentially harmful medication,92 , 93 and Hispanic enrollees had their kidney function decline at a faster rate over time than White enrollees.94 Among enrollees with dementia, a lower share of Hispanic enrollees than White enrollees and the overall Medicare Advantage population were not dispensed a prescription for a potentially harmful medication.95 , 96 , 97 Conversely, among women ages 67 to 85 years in Medicare Advantage plans who suffered a fracture, a higher share of Hispanic enrollees than White enrollees and the overall Medicare Advantage population had their osteoporosis adequately managed.98 , 99
Experiences with care
- A lower share of Hispanic enrollees than White enrollees and the overall Medicare Advantage population reported getting appointments and care quickly.100 , 101 Additionally, a lower share of Hispanic than White enrollees reported getting needed care,102 , 103 including in one study that did not control for differences in enrollee characteristics.104
- A similar share of Hispanic enrollees and the overall Medicare Advantage population reported that it was easy to get needed prescription drugs.105
- Higher shares of Hispanic enrollees than White enrollees were enrolled in plans with narrow networks (i.e., less than 25% of available providers included in network) of primary care providers,106 psychiatrists,107 and dialysis facilities.108 The study that looked at narrow networks of primary care and psychiatry providers presented bivariate comparisons of enrollees with various characteristics who were enrolled in plans with networks of different breadths,109 while the study that focused on narrow networks of dialysis facilities presented both bivariate and multivariate comparisons.110
Utilization of preventive services
- Vaccines: A lower share of Hispanic enrollees than White enrollees received flu vaccines,111 , 112 including a study that did not present multivariate comparisons.113 A higher share of Hispanic enrollees than White enrollees received COVID-19 vaccinations.114
- Preventive cancer screenings: A higher share of Hispanic enrollees than White enrollees and the overall Medicare population received appropriate screenings for breast cancer115 , 116 and pap smears.117 A similar share of Hispanic and White enrollees were screened for prostate cancer.118
- Other preventive screenings: A higher share of Hispanic enrollees than White enrollees had their cholesterol levels tested119 and among enrollees without diabetes, a higher share of Hispanic enrollees than White enrollees had their blood sugar tested to detect diabetes.120
Quality of plans
- A lower share of Hispanic enrollees than White enrollees were enrolled in 5-star rated plans, but a somewhat higher share of Hispanic than White enrollees were enrolled in 4-, 4.5, or lower (2- to 3.5) star rated plans, after adjusting for availability of plans at the county level.121
- A separate study found that Hispanic enrollees were more likely than White enrollees to be enrolled in lower-rated plans based on quality ratings calculated from the subset of measures included in the Consumer Assessment of Healthcare Providers and Systems (CAHPS) survey responses. 122
- A third study found similar shares of Hispanic and White beneficiaries were enrolled in vertically integrated Medicare Advantage plans (i.e., plans associated with a hospital health system that provides care), which the study found had higher overall star ratings.123
How do measures of quality of care and beneficiary experience compare between Asian and Pacific Islander and White Medicare Advantage enrollees?
Thirteen studies examined 36 measures of quality of care and beneficiary experience among Asian and Pacific Islander enrollees, including 11 studies that compared estimates for Asian and Pacific Islander enrollees to White enrollees and two studies that compared estimates for Asian and Pacific Islander enrollees to the overall Medicare Advantage population. Of the 13 studies, three studies presented estimates for Asian enrollees separately, seven studies presented findings for Asian and Pacific Islander enrollees as a single category, and three studies grouped Asian, Pacific Islander, and Native Hawaiians into a single category (See Appendix Table 1 for results for each group).
These 13 studies examined potentially avoidable hospitalizations for ACSCs (1 study), specific measures of disease management (8 studies), quality of plans (2 studies), measures related to experiences with care (6 studies), and utilization of preventive services (4 studies) (Appendix Table 1, Appendix Table 2). Most studies included multiple measures, and some measures were examined among enrollees with different conditions (e.g., receipt of statin therapy examined separately for enrollees with diabetes and cardiovascular conditions).
Among the 13 studies that compared measures for Asian and Pacific Islander and White Medicare Advantage enrollees, results were less favorable for Asian and Pacific Islander enrollees than White enrollees on nine of the measures examined for this group, more favorable on seven measures, similar on seven measures, inconsistent across studies on three measures, and for 10 measures, study authors described differences as not practically significant. A description of these results follows.
Potentially Avoidable Hospitalization
- Asian and Pacific Islander and White enrollees had similar rates of hospitalization for ambulatory care sensitive conditions, after controlling for differences in enrollee health status.124
Disease management
- Mental health care: Among Medicare Advantage enrollees with depression, a lower share of Asian and Pacific Islander enrollees than White enrollees and the overall Medicare Advantage population received antidepressant medication management,125 , 126 , 127 and among enrollees with a new episode of alcohol or other drug dependence, a lower share of Asian and Pacific Islander enrollees than both groups initiated treatment for the condition.128 , 129 Conversely, a higher share of Asian and Pacific Islander enrollees than White enrollees and the overall Medicare Advantage population were not prescribed opioids at a high dosage for more than 14 days.130 , 131 A similar share of Asian and Pacific Islander enrollees and White enrollees received follow-up care within 30 days of an emergency department visit for select mental health conditions.132 Findings on receipt of follow-up care after hospital stays for mental illness were mixed: one study found that a higher share of Asian and Pacific Islander enrollees than White enrollees received this follow-up care,133 while the second study found that a similar share of Asian and Pacific Islander and White enrollees received this follow-up care.134
- Diabetes care: A lower share of Asian and Pacific Islander enrollees with diabetes than White enrollees used diabetes technology (either insulin pump or continuous glucose monitoring).135 Conversely, among enrollees with diabetes, a higher share of Asian and Pacific Islander enrollees than White enrollees and the overall Medicare Advantage population received statin therapy and eye exams,136 , 137 and a higher share of Asian and Pacific Islander than White enrollees with diabetes had their blood pressure under control.138 Two studies that examined blood sugar control for Asian and Pacific Islander enrollees compared to White enrollees had mixed findings: one study found that a lower share of Asian and Pacific Islander enrollees than White enrollees had their blood sugar controlled,139 while a second study found that a higher share of Asian and Pacific Islander enrollees than White enrollees had their blood sugar controlled.140 An additional study found that a higher share of Asian and Pacific Islander enrollees than the share of Medicare Advantage enrollees overall had their blood sugar controlled.141 Among enrollees with diabetes, a similar share of Asian and Pacific Islander enrollees and the overall Medicare Advantage population had their blood pressure under control.142
- Cardiovascular health: Compared to White enrollees and the overall Medicare Advantage population, a similar share of Asian and Pacific Islander enrollees who were hospitalized for a heart attack received beta-blocker treatments,143 and a similar share of Asian and Pacific Islander enrollees with a history of a cardiac event had their cholesterol adequately controlled.144 In the two studies that examined the share of enrollees with hypertension who had their blood pressure under control, differences in the shares of Asian and Pacific Islander and White enrollees on this measure were mixed.145 , 146 An additional study comparing the share of Asian and Pacific Islander enrollees with hypertension to the overall Medicare Advantage population found that a higher share of Asian and Pacific Islander enrollees had their blood pressure controlled than the overall Medicare Advantage population.147
- Other conditions: Compared to White enrollees and the overall Medicare Advantage population, a higher share of Asian and Pacific Islander enrollees with dementia were not dispensed a prescription for a potentially harmful medication,148 , 149 , 150 and a higher share of Asian and Pacific Islander women ages 67 to 85 years who suffered a fracture had their osteoporosis adequately managed.151 , 152 Asian and Pacific Islander and White enrollees with chronic kidney failure experienced similar progression of the disease over time.153
- Multiple high-risk chronic conditions: Among enrollees with multiple high-risk chronic conditions, a higher share of Asian and Pacific Islander enrollees than the overall Medicare Advantage population received follow-up care within seven days of an emergency department visit.154
Experiences with care
- A lower share of Asian and Pacific Islander enrollees than White enrollees and the overall Medicare Advantage population reported getting needed care, getting appointments and care quickly, having their care well-coordinated, and getting needed prescription drugs.155 , 156
- A higher share of Asian and Pacific Islander enrollees than White enrollees were enrolled in plans with narrow networks (i.e., less than 25% of available providers included in network) of primary care providers,157 psychiatrists,158 mental and behavioral health providers,159 and dialysis facilities.160 One of these studies presented bivariate comparisons of enrollees with various characteristics who were enrolled in plans with networks of primary care, psychiatry, and mental health providers of different breadths,161 while the other study, focusing on networks of dialysis facilities, presented both bivariate and multivariate comparisons.162
Utilization of preventive services
- Vaccines: A higher share of Asian and Pacific Islander than White enrollees and the overall Medicare Advantage population received a flu vaccine.163 , 164 Preventive cancer screenings: The share of Asian and Pacific Islander enrollees receiving colorectal cancer screenings was similar to the share among White enrollees and the overall Medicare Advantage population.165 , 166
Quality of plans
- A lower share of Asian and Pacific Islander enrollees than White enrollees were enrolled in 4-, 4.5-, and 5-star rated plans and a higher share of Asian and Pacific Islander than White enrollees were enrolled in plans with ratings of 3.5 stars or below, after adjusting for availability of plans at the county level. 167
- A similar share of Asian and Pacific Islander and White enrollees were enrolled in vertically integrated Medicare Advantage plans.168
How do measures of quality of care and beneficiary experience compare between American Indian and Alaska Native Medicare Advantage enrollees and White enrollees?
Nine studies examined 25 measures of quality of care received by American Indian and Alaska Native enrollees, including seven studies that compared estimates for American Indian and Alaska Native enrollees to White enrollees, and two studies that compared estimates for American Indian and Alaska Native enrollees to the overall Medicare Advantage population. These nine studies examined measures for disease management (5 studies), quality of plans (1 study), experiences with care (7 studies), and utilization of preventive services (7 studies) (Appendix Table 1, Appendix Table 2). Most studies included multiple measures, and some measures were examined among enrollees with different conditions (e.g., receipt of statin therapy examined separately for enrollees with diabetes and cardiovascular conditions). These nine studies did not further disaggregate American Indian and Alaska Native enrollees living in tribal areas, likely due to sample size limitations.
Among the nine studies included in this review that compared American Indian and Alaska Native and White Medicare Advantage enrollees, findings were less favorable for American Indian and Alaska Native enrollees that White Medicare Advantage enrollees on seven measures, more favorable on four measures, similar on 12 measures, inconsistent across studies on one measure, and for one measure, study authors described differences as not practically significant.
Disease management
- Mental health care: A lower share of American Indian and Alaska Native enrollees than White enrollees initiated treatment for alcohol or other drug dependence within 14 days of diagnosis,169 but a higher share of American Indian and Alaska Native enrollees was not prescribed opioids at a high dosage.170 A similar share of American Indian and Alaska Native enrollees and White enrollees with depression received antidepressant medication management.171 Compared to the overall Medicare Advantage population, a lower share of American Indian and Alaska Native enrollees received antidepressant medication management, but a higher share of American Indian and Alaska Native enrollees with a new episode of alcohol or other drug dependence initiated treatment for the condition.172
- Cardiovascular health: A lower share of American Indian and Alaska Native enrollees with hypertension than White enrollees with hypertension had their blood pressure under control.173 A similar share of American Indian and Alaska Native and White enrollees with cardiovascular disease received and adhered to statin therapy,174 and a similar share of both groups of enrollees with a prior-year history of a cardiac event had their cholesterol under control.175 However, compared to the overall Medicare Advantage population, a lower share of American Indian and Alaska Native enrollees with cardiovascular disease received and adhered to statin therapy.176
- Diabetes care: Among enrollees with diabetes, a lower share of American Indian and Alaska Native enrollees than White enrollees and the overall Medicare Advantage population adhered to statin therapy177 , 178 and had their blood sugar controlled.179 , 180 Additionally, a lower share of American Indian and Alaska Native enrollees with diabetes than White enrollees had their blood pressure controlled.181 A similar share of American Indian and Alaska Native and White enrollees with diabetes received statin therapy and blood sugar testing.182 Compared to the overall population of Medicare Advantage enrollees with diabetes, a lower share of American Indian and Alaska Native enrollees received statin therapy, and a similar share received eye exams.183
- Other conditions: Among enrollees with rheumatoid arthritis, a higher share of American Indian and Alaska Native enrollees than White enrollees received therapy for rheumatoid arthritis, and among enrollees with dementia, a higher share of American Indian and Alaska Native enrollees than White enrollees were not dispensed a prescription for a potentially harmful medication.184 The share of American Indian and Alaska Native enrollees who were not dispensed a prescription for a potentially harmful medication for chronic renal failure was similar to the share among White enrollees185 and the overall Medicare Advantage population.186 Compared to the overall population of Medicare Advantage enrollees with dementia, a similar share of American Indian and Alaska Native enrollees with dementia were not dispensed a prescription for a potentially harmful medication.187
- Multiple high-risk chronic conditions: Among enrollees with multiple high-risk chronic conditions, the share of American Indian and Alaska Native enrollees receiving follow-up care within seven days of an emergency department visit was similar to the share among White enrollees188 and the overall Medicare Advantage population.189
Experiences with care
- Compared to White enrollees and the overall Medicare Advantage population, a similar share of American Indian and Alaska Native enrollees reported getting needed care, getting appointments and care quickly, and having their care coordinated.190 , 191 However, a lower share of American Indian and Alaska Native enrollees than White enrollees reported that it was easy to get needed prescription drugs.192
- Among enrollees with end-stage renal disease, a higher share of American Indian and Alaska Native enrollees than White enrollees were enrolled in plans with narrow networks (e., less than 25% of available providers included in network) of dialysis facilities.193 A similar share of American Indian and Alaska Native enrollees and White enrollees were enrolled in plans with narrow networks of primary care, psychiatry, and mental and behavioral health providers, based on a study that calculated the share of enrollees with various characteristics who were enrolled in plans with networks of different breadths.194
Utilization of preventive services
- Vaccines: A similar share of American Indian and Alaska Native and White enrollees received a flu vaccine.195 This review did not identify studies that compared utilization of other vaccines (e.g., pneumonia and COVID-19 vaccines) among American Indian and Alaska Native enrollees to White enrollees or to the total Medicare Advantage population.
- Preventive cancer screenings: A higher share of American Indian and Alaska Native women ages 50 to 74 in Medicare Advantage plans than White women of the same age in Medicare Advantage plans received breast cancer screening,196 but a lower share of American Indian and Alaska Native women than women in the overall Medicare Advantage population received this screening.197
Findings related to subgroups of people of color in Medicare Advantage plans
Gender. Only three studies in this review further stratified findings pertaining to Medicare Advantage enrollees by race and ethnicity and gender, with findings that generally mirrored the overall pattern for each racial or ethnic groups.198 , 199 , 200 For example, one study found that compared to White women and men enrolled in Medicare Advantage, a lower share of Asian and Pacific Islander women and men in Medicare Advantage, respectively, reported getting needed care, getting appointments and care quickly, having their care well-coordinated, and getting needed prescription drugs, and a higher share of Asian and Pacific Islander women and men than White women and men in Medicare Advantage reported getting an annual flu vaccine.201
Rural residence. Just two studies examine measures of quality of care and beneficiary experience among enrollees in rural areas by race and ethnicity, with findings that mirrored the overall pattern in some, but not all measures.202 , 203 For example, consistent with the overall pattern, a lower share of Black and Hispanic enrollees in rural areas than White enrollees in rural areas received beta-blocker treatments, but higher shares of Black and Hispanic enrollees in rural areas received breast cancer screenings.204 However, while a lower share of Hispanic enrollees than White enrollees overall reported getting appointments and care quickly, a similar share of Hispanic and White enrollees in rural areas reported getting appointments and care quickly. 205
Dual-eligible individuals. This review did not identify any studies that examined how measures of quality of care and beneficiary experience compare between dual-eligible people of color and dual-eligible White beneficiaries. Among dual-eligible individuals, higher shares of people of color are enrolled in Medicare Advantage plans than White beneficiaries: in 2020, a higher share of Black (54%), Hispanic (65%), and Asian/Pacific Islander (48%) dual-eligible individuals were enrolled in Medicare Advantage plans than White (41%) and American Indian or Alaska Native (25%) dual-eligible individuals. A better understanding of how these groups compare on measures of quality of care and beneficiary experiences could help inform an understanding of the extent to which Medicare Advantage plans are meeting the needs of dually-eligible individuals enrolled in these plans.
Discussion
With Medicare Advantage now covering more than half of all Black, Hispanic, and Asian and Pacific Islander Medicare beneficiaries, this review of the literature provides some insight into quality of care and beneficiary experiences for people of color enrolled in Medicare Advantage plans compared to White Medicare Advantage enrollees.
Overall, this review of these studies finds that while higher shares of Black Medicare Advantage enrollees than White enrollees received some preventive services, such as breast cancer screenings, findings were less favorable for Black enrollees than White enrollees on other preventive services, such as receipt of prostate cancer screenings, along with more than half of quality of care and beneficiary experience measures analyzed across the studies, such as higher rates of hospitalization for ambulatory care sensitive conditions. This review of the literature also finds that while higher shares of Hispanic enrollees than White enrollees received preventive services such as breast cancer screenings, findings were less favorable for Hispanic enrollees than White enrollees on more than a third of the measures, such as antidepressant medication management.
While a higher share of Asian and Pacific Islander enrollees than White enrollees received flu vaccines, few differences were found for Asian and Pacific Islander enrollees relative to White enrollees on other measures. Overall, fewer studies focused on American Indian and Alaska Native enrollees, making it difficult to assess the strength of the findings or how broadly they apply for this population. For instance, while a few studies examined receipt of breast cancer screenings among this population, this report did not identify studies that examined, or had sufficient sample size to examine, use of other preventive cancer screenings (e.g., colorectal, prostate, and cervical cancer screenings) among American Indian and Alaska Native enrollees compared with White enrollees or the overall Medicare Advantage population. None of the studies examined outcomes of care such as mortality rates or hospital-acquired infections by race and ethnicity, and very few studies focused on subgroups within each racial or ethnic group, such as gender and rural status. None of the identified studies examined the use of post-acute care or the total number or duration of hospital admissions among Medicare Advantage enrollees by race and ethnicity.
Substantial gaps in Medicare Advantage data hinder researchers’ ability to examine specific areas of interest in the context of Medicare Advantage, such as use of supplemental benefits offered by Medicare Advantage plans or the application of prior authorization and denials, by race and ethnicity. More concerted research efforts and more robust data to understand the experiences of people of color in Medicare Advantage plans would help inform policymakers and beneficiaries as enrollment in these plans continues to climb.
While the scope of this review is limited to Medicare Advantage enrollees, reflecting higher enrollment of Black, Hispanic, and Asian and Pacific Islander enrollees in these plans, the racial and ethnic disparities described in this report mirror disparities in health and health care in traditional Medicare, the overall Medicare population, and more broadly, the U.S adult population. Such disparities are influenced by a multitude of structural factors including systemic racism that accumulate over the course of a lifetime and may contribute to racial disparities in health experiences and outcomes in older ages.
This work was supported in part by Arnold Ventures. KFF maintains full editorial control over all of its policy analysis, polling, and journalism activities.
Appendix
Data and Methods for Comparing Racial/Ethnic Disparities in Medicare Advantage
Study inclusion and exclusion criteria
This literature review summarizes findings from 20 studies published between January 1, 2018 and April 1, 2023. These 20 studies include 18 studies that compare measures of quality of care and beneficiary experience between people of color in Medicare Advantage plans and White enrollees, and two studies that report findings for people of color relative to all Medicare Advantage enrollees rather than just White enrollees. Two of the 20 studies presented estimates for specific subgroups (e.g., Black enrollees in rural areas in Medicare Advantage plans) without presenting overall estimates for a particular racial or ethnic group (e.g., Black enrollees in Medicare Advantage plans overall).
Studies were selected for the review if they included data for at least one year from 2013 or later. Twelve studies used data from a year between 2018 and 2023, while the remaining (8 studies) used data from a year between 2013 and 2017 (Appendix Table 2). The data period is relevant because the Affordable Care Act made substantial changes to how Medicare Advantage plans are paid, which were not fully phased in for several years after that legislation was enacted in 2010, and so their effects may not be fully captured by studies that use older data.
To meet the inclusion criteria, studies also had to include a transparent discussion of methods and data sources, including discussion of limitations. Most studies included in this literature review are articles from peer-reviewed journals, but this review also includes studies published by independent policy and research groups as well as government reports. The brief excludes studies that were fully funded by advocacy or industry groups.
To collect relevant studies, keyword searches were conducted of PubMed, Google Scholar, and other academic search engines, as well as the websites of governmental, research, and policy organizations that publish work related to health care. Additional studies were found using a snowball technique based on bibliographies of previously pulled studies. While the approach was designed to be as comprehensive as possible in including studies that meet the criteria, it is possible that some relevant studies were overlooked.
All differences reported in the text are statistically significant (with p-value less than or equal to 0.05) unless noted otherwise (e.g., for results that are reported as similar). In a few studies, researchers distinguished differences that were statistically significant, but not practically significant due to very small differences in estimates, although the threshold for practical significance varied across studies (Appendix Table 1).
Methods and data used in studies to compare Medicare Advantage enrollees by race and ethnicity
Studies in this review presented stratified estimates for some but not all of the racial and ethnic groups listed in current federal minimum standards. Current federal minimum standards for collecting and presenting data on race and ethnicity, as specified by the Office of Management and Budget (OMB), include the following ethnic groups: 1) not Hispanic or Latino and 2) Hispanic or Latino; and the following racial groups: 1) American Indian and Alaska Native, 2) Asian, 3) Black or African American, 4) Native Hawaiian or Other Pacific Islander, and 5) White. These standards were last updated in 1997, with OMB proposing to update them again in 2023 to reflect the increasing diversity of the U.S population and evolved immigration patterns. A report by the Office of Inspector General (OIG) found that Medicare’s enrollment data are inconsistent with federal data collection standards, limiting researchers’ ability to ensure that their racial/ethnic stratifications are in alignment with federal data collection standards. This report describes results for each of the racial or ethnic groups included in the 20 studies. If a particular racial or ethnic group is not mentioned, it means that estimates for that particular racial or ethnic group for that specific measure were not presented.
Data sources used in these studies varied in how they identified race and ethnicity of enrollees. For example, a study that used the Health Outcomes Survey used self-reported data to identify enrollees’ race and ethnicity. The Healthcare Effectiveness Data and Information Set (HEDIS), which was used as a source of data in eight studies, uses an imputed methodology that combines CMS' administrative data, surname, and residential information to identify enrollees by race or ethnicity. This method is recommended for providing estimates for White, Black, Hispanic, and Asian and Pacific Islander enrollees, but not for American Indian and Alaska Native enrollees. Therefore, some studies were able to present estimates for American Indian and Alaska Native enrollees on CAHPS measures, but not HEDIS measures. Two studies used claims data from a single insurer (UnitedHealth), which uses a proprietary imputation method that cross-references enrollees' names and zip code to a nationally recognized supplier of consumer marketing data to generate a weighted prediction of race/ethnicity from over 180 ethnicities.
Analyses varied in data sources used to compare measures of quality of care and beneficiary experience by race and ethnicity. Most studies reviewed here (17 out of 20 studies) used nationally representative data sources (Appendix Table 2), such as the Medicare Current Beneficiary Survey and the HEDIS. Two studies used claims data collected from a single health plan (UnitedHealth) that covered enrollees within the plan nationally, and one study used electronic health records data from primary care facilities across 10 states. No studies were identified that used Medicare Advantage encounter data.
Most studies used multivariate regression models to account for differences in beneficiary characteristics, including differences in health status. Of the 20 studies in this review, most (17 studies) used multivariate models to account for differences in the characteristics of enrollees in Medicare Advantage including demographic, socioeconomic, and health risks, though they varied in methodology and transparency (Appendix Table 2). A few studies further controlled for plan and contract-level characteristics, such as county-level market penetration rates, plan type (e.g., HMO versus PPO), integrated health system status, and whether the contract had one or more Special Needs Plans. In the case of studies that presented both bivariate and multivariate estimates, the adjusted estimates are reported in this review. The remaining three studies that did not present findings from multivariate models examined measures of beneficiary experience, rather than quality of care.
The use of more advanced statistical methods varied. Two studies created matched samples (e.g., using propensity score matching to balance samples of enrollees in vertically-integrated plans versus other Medicare Advantage plans) or included inverse probability of treatment weights in the regression model as a further attempt to adjust for differences in the likelihood of certain groups to enroll in certain Medicare Advantage plans over others (i.e., integrated plans versus non-integrated plans) (Appendix Table 2). No studies were identified that used a quasi-experimental design, such as difference-in-differences or an instrumental variable approach, to isolate the effect of race/ethnicity among Medicare Advantage enrollees on outcomes of interest.
Appendix Tables


Endnotes
- Sungchul Park, Paul Fishman, and Norma B. Coe, “Racial Disparities in Avoidable Hospitalizations in Traditional Medicare and Medicare Advantage,” Medical Care 59 no. 11 (November 2021): 989-996, doi:10.1097/MLR.0000000000001632 ↩︎
- Sungchul Park, Rachel Werner, and Norma Coe, “Association of Medicare Advantage Star Ratings With Racial and Ethnic Disparities in Hospitalizations for Ambulatory Care Sensitive Conditions,” Medical Care 60 no. 12 (December 2022): 872-879, DOI: 10.1097/MLR.0000000000001770 ↩︎
- Sungchul Park, Paul Fishman, and Norma B. Coe, “Racial Disparities in Avoidable Hospitalizations in Traditional Medicare and Medicare Advantage,” Medical Care 59 no. 11 (November 2021): 989-996, doi:10.1097/MLR.0000000000001632 ↩︎
- Maricruz Rivera-Hernandez, Momotazur Rahman, Vincent Mor, and Amal N. Trivedi, “Racial disparities in readmission rates among patients discharged to skilled nursing facilities,” Journal of the American Geriatrics Society 67 no. 8 (August 2019): 1672-1679, https://doi.org/10.1111/jgs.15960 ↩︎
- Steven C. Martino et al, Racial, Ethnic, & Gender Disparities in Health Care in Medicare Advantage (Baltimore, MD: Centers for Medicare & Medicaid Services Office of Minority Health, April 2021), https://www.cms.gov/files/document/racial-ethnic-gender-disparities-health-care-medicare-advantage.pdf ↩︎
- Joshua Breslau et al., “Racial And Ethnic Differences In The Attainment Of Behavioral Health Quality Measures In Medicare Advantage Plans,” Health Affairs 37 no. 10 (October 2018): 1685-1692, https://doi.org/10.1377/hlthaff.2018.0655 ↩︎
- Steven C. Martino et al, Disparities in Health Care in Medicare Advantage by Race, Ethnicity, and Sex (Baltimore, MD: Centers for Medicare & Medicaid Services Office of Minority Health, April 2023), https://www.cms.gov/files/document/disparities-health-care-medicare-advantage-race-ethnicity-and-sex.pdf-0 ↩︎
- Steven C. Martino et al, Racial, Ethnic, & Gender Disparities in Health Care in Medicare Advantage (Baltimore, MD: Centers for Medicare & Medicaid Services Office of Minority Health, April 2021), https://www.cms.gov/files/document/racial-ethnic-gender-disparities-health-care-medicare-advantage.pdf ↩︎
- Steven C. Martino et al, Disparities in Health Care in Medicare Advantage by Race, Ethnicity, and Sex (Baltimore, MD: Centers for Medicare & Medicaid Services Office of Minority Health, April 2023), https://www.cms.gov/files/document/disparities-health-care-medicare-advantage-race-ethnicity-and-sex.pdf-0 ↩︎
- Shayla N. M. Durfey et al, “Neighborhood disadvantage and chronic disease management,” Health Services Research 54 no.S1 (February 2019): 206-216, https://doi.org/10.1111/1475-6773.13092 ↩︎
- Shayla N. M. Durfey et al, “Neighborhood disadvantage and chronic disease management,” Health Services Research 54 no.S1 (February 2019): 206-216, https://doi.org/10.1111/1475-6773.13092 ↩︎
- Steven C. Martino et al, Racial, Ethnic, & Gender Disparities in Health Care in Medicare Advantage (Baltimore, MD: Centers for Medicare & Medicaid Services Office of Minority Health, April 2021), https://www.cms.gov/files/document/racial-ethnic-gender-disparities-health-care-medicare-advantage.pdf ↩︎
- Steven C. Martino et al, Disparities in Health Care in Medicare Advantage by Race, Ethnicity, and Sex (Baltimore, MD: Centers for Medicare & Medicaid Services Office of Minority Health, April 2023), https://www.cms.gov/files/document/disparities-health-care-medicare-advantage-race-ethnicity-and-sex.pdf-0 ↩︎
- Mallika Kommareddi, Kael Wherry, and Robert A Vigersky, “Racial/Ethnic Inequities in Use of Diabetes Technologies Among Medicare Advantage Beneficiaries With Type 1 Diabetes,” Journal of Clinical Endocrinology & Metabolism (January 2023), https://doi.org/10.1210/clinem/dgad046 ↩︎
- Steven C. Martino et al, Racial, Ethnic, & Gender Disparities in Health Care in Medicare Advantage (Baltimore, MD: Centers for Medicare & Medicaid Services Office of Minority Health, April 2021), https://www.cms.gov/files/document/racial-ethnic-gender-disparities-health-care-medicare-advantage.pdf ↩︎
- Steven C. Martino et al, Disparities in Health Care in Medicare Advantage by Race, Ethnicity, and Sex (Baltimore, MD: Centers for Medicare & Medicaid Services Office of Minority Health, April 2023), https://www.cms.gov/files/document/disparities-health-care-medicare-advantage-race-ethnicity-and-sex.pdf-0 ↩︎
- Steven C. Martino et al, Racial, Ethnic, & Gender Disparities in Health Care in Medicare Advantage (Baltimore, MD: Centers for Medicare & Medicaid Services Office of Minority Health, April 2021), https://www.cms.gov/files/document/racial-ethnic-gender-disparities-health-care-medicare-advantage.pdf ↩︎
- Clarissa Diamantidis et al., “Disparities in Chronic Kidney Disease Progression by Medicare Advantage Enrollees,” American Journal of Nephrology 52 no. 12 (January 2022): 949–957, https://doi.org/10.1159/000519758 ↩︎
- Steven C. Martino et al, Racial, Ethnic, & Gender Disparities in Health Care in Medicare Advantage (Baltimore, MD: Centers for Medicare & Medicaid Services Office of Minority Health, April 2021), https://www.cms.gov/files/document/racial-ethnic-gender-disparities-health-care-medicare-advantage.pdf ↩︎
- Joshua Breslau et al., “Racial And Ethnic Differences In The Attainment Of Behavioral Health Quality Measures In Medicare Advantage Plans,” Health Affairs 37 no. 10 (October 2018): 1685-1692, https://doi.org/10.1377/hlthaff.2018.0655 ↩︎
- Steven C. Martino et al, Racial, Ethnic, & Gender Disparities in Health Care in Medicare Advantage (Baltimore, MD: Centers for Medicare & Medicaid Services Office of Minority Health, April 2021), https://www.cms.gov/files/document/racial-ethnic-gender-disparities-health-care-medicare-advantage.pdf ↩︎
- Steven C. Martino et al, Racial, Ethnic, & Gender Disparities in Health Care in Medicare Advantage (Baltimore, MD: Centers for Medicare & Medicaid Services Office of Minority Health, April 2021), https://www.cms.gov/files/document/racial-ethnic-gender-disparities-health-care-medicare-advantage.pdf ↩︎
- Kenton J. Johnston et al., “Association of Race and Ethnicity and Medicare Program Type With Ambulatory Care Access and Quality Measures,” JAMA 326, no. 7 (August 2021): 628-636, doi:10.1001/jama.2021.10413 ↩︎
- Steven C. Martino et al, Racial, Ethnic, & Gender Disparities in Health Care in Medicare Advantage (Baltimore, MD: Centers for Medicare & Medicaid Services Office of Minority Health, April 2021), https://www.cms.gov/files/document/racial-ethnic-gender-disparities-health-care-medicare-advantage.pdf ↩︎
- Steven C. Martino et al, Racial, Ethnic, & Gender Disparities in Health Care in Medicare Advantage (Baltimore, MD: Centers for Medicare & Medicaid Services Office of Minority Health, April 2021), https://www.cms.gov/files/document/racial-ethnic-gender-disparities-health-care-medicare-advantage.pdf ↩︎
- Anuj Gangopadhyaya, Stephen Zuckerman, and Nikhil Rao, “Assessing the Difference in Racial and Ethnic Disparities in Access to and Use of Care Between Traditional Medicare and Medicare Advantage,” Health Services Research (March 2023): 1-10, https://doi.org/10.1111/1475-6773.14150 ↩︎
- Steven C. Martino et al, Disparities in Health Care in Medicare Advantage by Race, Ethnicity, and Sex (Baltimore, MD: Centers for Medicare & Medicaid Services Office of Minority Health, April 2023), https://www.cms.gov/files/document/disparities-health-care-medicare-advantage-race-ethnicity-and-sex.pdf-0 ↩︎
- David J. Meyers, Momotazur Rahman, and Amal N. Trivedi, “Narrow Primary Care Networks in Medicare Advantage,” Journal of General Internal Medicine 37 (February 2022): 488-491, https://doi.org/10.1007/s11606-020-06534-2 ↩︎
- Eunhae Grace Oh, David J. Meyers, Kevin H. Nguyen, and Amal N. Trivedi, “Narrow Dialysis Networks In Medicare Advantage: Exposure By Race, Ethnicity, And Dual Eligibility,” Health Affairs 42, no. 2 (February 2022): 252-260, https://doi.org/10.1377/hlthaff.2022.01044 ↩︎
- Steven C. Martino et al, Racial, Ethnic, & Gender Disparities in Health Care in Medicare Advantage (Baltimore, MD: Centers for Medicare & Medicaid Services Office of Minority Health, April 2021), https://www.cms.gov/files/document/racial-ethnic-gender-disparities-health-care-medicare-advantage.pdf ↩︎
- Steven C. Martino et al, Disparities in Health Care in Medicare Advantage by Race, Ethnicity, and Sex (Baltimore, MD: Centers for Medicare & Medicaid Services Office of Minority Health, April 2023), https://www.cms.gov/files/document/disparities-health-care-medicare-advantage-race-ethnicity-and-sex.pdf-0 ↩︎
- Kenton J. Johnston et al., “Association of Race and Ethnicity and Medicare Program Type With Ambulatory Care Access and Quality Measures,” JAMA 326, no. 7 (August 2021): 628-636, doi:10.1001/jama.2021.10413 ↩︎
- Anuj Gangopadhyaya, Stephen Zuckerman, and Nikhil Rao, “Assessing the Difference in Racial and Ethnic Disparities in Access to and Use of Care Between Traditional Medicare and Medicare Advantage,” Health Services Research (March 2023): 1-10, https://doi.org/10.1111/1475-6773.14150 ↩︎
- Kenton J. Johnston et al., “Association of Race and Ethnicity and Medicare Program Type With Ambulatory Care Access and Quality Measures,” JAMA 326, no. 7 (August 2021): 628-636, doi:10.1001/jama.2021.10413 ↩︎
- Jason Lane et al., “Access to Health Care Improves COVID-19 Vaccination and Mitigates Health Disparities Among Medicare Beneficiaries,” Journal of Racial and Ethnic Health Disparities (September 2022): https://doi.org/10.1007/s40615-022-01343-1 ↩︎
- Anuj Gangopadhyaya, Stephen Zuckerman, and Nikhil Rao, “Assessing the Difference in Racial and Ethnic Disparities in Access to and Use of Care Between Traditional Medicare and Medicare Advantage,” Health Services Research (March 2023): 1-10, https://doi.org/10.1111/1475-6773.14150 ↩︎
- Steven C. Martino et al, Racial, Ethnic, & Gender Disparities in Health Care in Medicare Advantage (Baltimore, MD: Centers for Medicare & Medicaid Services Office of Minority Health, April 2021), https://www.cms.gov/files/document/racial-ethnic-gender-disparities-health-care-medicare-advantage.pdf ↩︎
- Steven C. Martino et al, Disparities in Health Care in Medicare Advantage by Race, Ethnicity, and Sex (Baltimore, MD: Centers for Medicare & Medicaid Services Office of Minority Health, April 2023), https://www.cms.gov/files/document/disparities-health-care-medicare-advantage-race-ethnicity-and-sex.pdf-0 ↩︎
- Anuj Gangopadhyaya, Stephen Zuckerman, and Nikhil Rao, “Assessing the Difference in Racial and Ethnic Disparities in Access to and Use of Care Between Traditional Medicare and Medicare Advantage,” Health Services Research (March 2023): 1-10, https://doi.org/10.1111/1475-6773.14150 ↩︎
- Kenton J. Johnston et al., “Association of Race and Ethnicity and Medicare Program Type With Ambulatory Care Access and Quality Measures,” JAMA 326, no. 7 (August 2021): 628-636, doi:10.1001/jama.2021.10413 ↩︎
- Anuj Gangopadhyaya, Stephen Zuckerman, and Nikhil Rao, “Assessing the Difference in Racial and Ethnic Disparities in Access to and Use of Care Between Traditional Medicare and Medicare Advantage,” Health Services Research (March 2023): 1-10, https://doi.org/10.1111/1475-6773.14150 ↩︎
- Steven C. Martino et al, Disparities in Health Care in Medicare Advantage by Race, Ethnicity, and Sex (Baltimore, MD: Centers for Medicare & Medicaid Services Office of Minority Health, April 2023), https://www.cms.gov/files/document/disparities-health-care-medicare-advantage-race-ethnicity-and-sex.pdf-0 ↩︎
- Anuj Gangopadhyaya, Stephen Zuckerman, and Nikhil Rao, “Assessing the Difference in Racial and Ethnic Disparities in Access to and Use of Care Between Traditional Medicare and Medicare Advantage,” Health Services Research (March 2023): 1-10, https://doi.org/10.1111/1475-6773.14150 ↩︎
- Anuj Gangopadhyaya, Stephen Zuckerman, and Nikhil Rao, “Assessing the Difference in Racial and Ethnic Disparities in Access to and Use of Care Between Traditional Medicare and Medicare Advantage,” Health Services Research (March 2023): 1-10, https://doi.org/10.1111/1475-6773.14150 ↩︎
- Sungchul Park, Rachel M. Werner, and Norma B. Coe, “Racial and ethnic disparities in access to and enrollment in high-quality Medicare Advantage plans,” Health Services Research 58 no.2 (April 2023): 303-313, https://doi.org/10.1111/1475-6773.13977 ↩︎
- David J. Meyers et al., “Association of Medicare Advantage Star Ratings With Racial, Ethnic, and Socioeconomic Disparities in Quality of Care,” JAMA Health Forum 2 no.6 (June 2021): e210793, doi:10.1001/jamahealthforum.2021.0793 ↩︎
- Sungchul Park, Brent A. Langellier, and David J. Meyers, “Differences between integrated and non-integrated plans in Medicare Advantage,” Health Services Research (November 2022): 1-9 https://doi.org/10.1111/1475-6773.14101 ↩︎
- Sungchul Park, Rachel Werner, and Norma Coe, “Association of Medicare Advantage Star Ratings With Racial and Ethnic Disparities in Hospitalizations for Ambulatory Care Sensitive Conditions,” Medical Care 60 no. 12 (December 2022): 872-879, DOI: 10.1097/MLR.0000000000001770 ↩︎
- Maricruz Rivera-Hernandez, Momotazur Rahman, Vincent Mor, and Amal N. Trivedi, “Racial disparities in readmission rates among patients discharged to skilled nursing facilities,” Journal of the American Geriatrics Society 67 no. 8 (August 2019): 1672-1679, https://doi.org/10.1111/jgs.15960 ↩︎
- Steven C. Martino et al, Racial, Ethnic, & Gender Disparities in Health Care in Medicare Advantage (Baltimore, MD: Centers for Medicare & Medicaid Services Office of Minority Health, April 2021), https://www.cms.gov/files/document/racial-ethnic-gender-disparities-health-care-medicare-advantage.pdf ↩︎
- Joshua Breslau et al., “Racial And Ethnic Differences In The Attainment Of Behavioral Health Quality Measures In Medicare Advantage Plans,” Health Affairs 37 no. 10 (October 2018): 1685-1692 https://doi.org/10.1377/hlthaff.2018.0655 ↩︎
- Steven C. Martino et al, Disparities in Health Care in Medicare Advantage by Race, Ethnicity, and Sex (Baltimore, MD: Centers for Medicare & Medicaid Services Office of Minority Health, April 2023), https://www.cms.gov/files/document/disparities-health-care-medicare-advantage-race-ethnicity-and-sex.pdf-0 ↩︎
- Steven C. Martino et al, Racial, Ethnic, & Gender Disparities in Health Care in Medicare Advantage (Baltimore, MD: Centers for Medicare & Medicaid Services Office of Minority Health, April 2021), https://www.cms.gov/files/document/racial-ethnic-gender-disparities-health-care-medicare-advantage.pdf ↩︎
- Joshua Breslau et al., “Racial And Ethnic Differences In The Attainment Of Behavioral Health Quality Measures In Medicare Advantage Plans,” Health Affairs 37 no. 10 (October 2018): 1685-1692 https://doi.org/10.1377/hlthaff.2018.0655 ↩︎
- Steven C. Martino et al, Disparities in Health Care in Medicare Advantage by Race, Ethnicity, and Sex (Baltimore, MD: Centers for Medicare & Medicaid Services Office of Minority Health, April 2023), https://www.cms.gov/files/document/disparities-health-care-medicare-advantage-race-ethnicity-and-sex.pdf-0 ↩︎
- Joshua Breslau et al., “Racial And Ethnic Differences In The Attainment Of Behavioral Health Quality Measures In Medicare Advantage Plans,” Health Affairs 37 no. 10 (October 2018): 1685-1692 https://doi.org/10.1377/hlthaff.2018.0655 ↩︎
- Steven C. Martino et al, Racial, Ethnic, & Gender Disparities in Health Care in Medicare Advantage (Baltimore, MD: Centers for Medicare & Medicaid Services Office of Minority Health, April 2021), https://www.cms.gov/files/document/racial-ethnic-gender-disparities-health-care-medicare-advantage.pdf ↩︎
- Steven C. Martino et al, Racial, Ethnic, & Gender Disparities in Health Care in Medicare Advantage (Baltimore, MD: Centers for Medicare & Medicaid Services Office of Minority Health, April 2021), https://www.cms.gov/files/document/racial-ethnic-gender-disparities-health-care-medicare-advantage.pdf ↩︎
- Steven C. Martino et al, Disparities in Health Care in Medicare Advantage by Race, Ethnicity, and Sex (Baltimore, MD: Centers for Medicare & Medicaid Services Office of Minority Health, April 2023), https://www.cms.gov/files/document/disparities-health-care-medicare-advantage-race-ethnicity-and-sex.pdf-0 ↩︎
- Shayla N. M. Durfey et al, “Neighborhood disadvantage and chronic disease management,” Health Services Research 54 no.S1 (February 2019): 206-216, https://doi.org/10.1111/1475-6773.13092 ↩︎
- Steven C. Martino et al, Racial, Ethnic, & Gender Disparities in Health Care in Medicare Advantage (Baltimore, MD: Centers for Medicare & Medicaid Services Office of Minority Health, April 2021), https://www.cms.gov/files/document/racial-ethnic-gender-disparities-health-care-medicare-advantage.pdf ↩︎
- Mallika Kommareddi, Kael Wherry, and Robert A Vigersky, “Racial/Ethnic Inequities in Use of Diabetes Technologies Among Medicare Advantage Beneficiaries With Type 1 Diabetes,” Journal of Clinical Endocrinology & Metabolism (January 2023), https://doi.org/10.1210/clinem/dgad046 ↩︎
- Steven C. Martino et al, Racial, Ethnic, & Gender Disparities in Health Care in Medicare Advantage (Baltimore, MD: Centers for Medicare & Medicaid Services Office of Minority Health, April 2021), https://www.cms.gov/files/document/racial-ethnic-gender-disparities-health-care-medicare-advantage.pdf ↩︎
- Steven C. Martino et al, Disparities in Health Care in Medicare Advantage by Race, Ethnicity, and Sex (Baltimore, MD: Centers for Medicare & Medicaid Services Office of Minority Health, April 2023), https://www.cms.gov/files/document/disparities-health-care-medicare-advantage-race-ethnicity-and-sex.pdf-0 ↩︎
- Steven C. Martino et al, Racial, Ethnic, & Gender Disparities in Health Care in Medicare Advantage (Baltimore, MD: Centers for Medicare & Medicaid Services Office of Minority Health, April 2021), https://www.cms.gov/files/document/racial-ethnic-gender-disparities-health-care-medicare-advantage.pdf ↩︎
- Steven C. Martino et al, Disparities in Health Care in Medicare Advantage by Race, Ethnicity, and Sex (Baltimore, MD: Centers for Medicare & Medicaid Services Office of Minority Health, April 2023), https://www.cms.gov/files/document/disparities-health-care-medicare-advantage-race-ethnicity-and-sex.pdf-0 ↩︎
- Steven C. Martino et al, Disparities in Health Care in Medicare Advantage by Race, Ethnicity, and Sex (Baltimore, MD: Centers for Medicare & Medicaid Services Office of Minority Health, April 2023), https://www.cms.gov/files/document/disparities-health-care-medicare-advantage-race-ethnicity-and-sex.pdf-0 ↩︎
- Steven C. Martino et al, Disparities in Health Care in Medicare Advantage by Race, Ethnicity, and Sex (Baltimore, MD: Centers for Medicare & Medicaid Services Office of Minority Health, April 2023), https://www.cms.gov/files/document/disparities-health-care-medicare-advantage-race-ethnicity-and-sex.pdf-0 ↩︎
- Steven C. Martino et al, Racial, Ethnic, & Gender Disparities in Health Care in Medicare Advantage (Baltimore, MD: Centers for Medicare & Medicaid Services Office of Minority Health, April 2021), https://www.cms.gov/files/document/racial-ethnic-gender-disparities-health-care-medicare-advantage.pdf ↩︎
- Shayla N. M. Durfey et al, “Neighborhood disadvantage and chronic disease management,” Health Services Research 54 no.S1 (February 2019): 206-216, https://doi.org/10.1111/1475-6773.13092 ↩︎
- Steven C. Martino et al, Racial, Ethnic, & Gender Disparities in Health Care in Medicare Advantage (Baltimore, MD: Centers for Medicare & Medicaid Services Office of Minority Health, April 2021), https://www.cms.gov/files/document/racial-ethnic-gender-disparities-health-care-medicare-advantage.pdf ↩︎
- Steven C. Martino et al, Disparities in Health Care in Medicare Advantage by Race, Ethnicity, and Sex (Baltimore, MD: Centers for Medicare & Medicaid Services Office of Minority Health, April 2023), https://www.cms.gov/files/document/disparities-health-care-medicare-advantage-race-ethnicity-and-sex.pdf-0 ↩︎
- Steven C. Martino et al, Racial, Ethnic, & Gender Disparities in Health Care in Medicare Advantage (Baltimore, MD: Centers for Medicare & Medicaid Services Office of Minority Health, April 2021), https://www.cms.gov/files/document/racial-ethnic-gender-disparities-health-care-medicare-advantage.pdf ↩︎
- Steven C. Martino et al, Disparities in Health Care in Medicare Advantage by Race, Ethnicity, and Sex (Baltimore, MD: Centers for Medicare & Medicaid Services Office of Minority Health, April 2023), https://www.cms.gov/files/document/disparities-health-care-medicare-advantage-race-ethnicity-and-sex.pdf-0 ↩︎
- Clarissa Diamantidis et al., “Disparities in Chronic Kidney Disease Progression by Medicare Advantage Enrollees,” American Journal of Nephrology 52 no. 12 (January 2022): 949–957, https://doi.org/10.1159/000519758 ↩︎
- Steven C. Martino et al, Racial, Ethnic, & Gender Disparities in Health Care in Medicare Advantage (Baltimore, MD: Centers for Medicare & Medicaid Services Office of Minority Health, April 2021), https://www.cms.gov/files/document/racial-ethnic-gender-disparities-health-care-medicare-advantage.pdf ↩︎
- Joshua Breslau et al., “Racial And Ethnic Differences In The Attainment Of Behavioral Health Quality Measures In Medicare Advantage Plans,” Health Affairs 37 no. 10 (October 2018): 1685-1692 https://doi.org/10.1377/hlthaff.2018.0655 ↩︎
- Steven C. Martino et al, Disparities in Health Care in Medicare Advantage by Race, Ethnicity, and Sex (Baltimore, MD: Centers for Medicare & Medicaid Services Office of Minority Health, April 2023), https://www.cms.gov/files/document/disparities-health-care-medicare-advantage-race-ethnicity-and-sex.pdf-0 ↩︎
- Steven C. Martino et al, Racial, Ethnic, & Gender Disparities in Health Care in Medicare Advantage (Baltimore, MD: Centers for Medicare & Medicaid Services Office of Minority Health, April 2021), https://www.cms.gov/files/document/racial-ethnic-gender-disparities-health-care-medicare-advantage.pdf ↩︎
- Anuj Gangopadhyaya, Stephen Zuckerman, and Nikhil Rao, “Assessing the Difference in Racial and Ethnic Disparities in Access to and Use of Care Between Traditional Medicare and Medicare Advantage,” Health Services Research (March 2023): 1-10, https://doi.org/10.1111/1475-6773.14150 ↩︎
- Anuj Gangopadhyaya, Stephen Zuckerman, and Nikhil Rao, “Assessing the Difference in Racial and Ethnic Disparities in Access to and Use of Care Between Traditional Medicare and Medicare Advantage,” Health Services Research (March 2023): 1-10, https://doi.org/10.1111/1475-6773.14150 ↩︎
- Steven C. Martino et al, Disparities in Health Care in Medicare Advantage by Race, Ethnicity, and Sex (Baltimore, MD: Centers for Medicare & Medicaid Services Office of Minority Health, April 2023), https://www.cms.gov/files/document/disparities-health-care-medicare-advantage-race-ethnicity-and-sex.pdf-0 ↩︎
- David J. Meyers, Momotazur Rahman, and Amal N. Trivedi, “Narrow Primary Care Networks in Medicare Advantage,” Journal of General Internal Medicine 37 (February 2022): 488-491, https://doi.org/10.1007/s11606-020-06534-2 ↩︎
- David J. Meyers, Momotazur Rahman, and Amal N. Trivedi, “Narrow Primary Care Networks in Medicare Advantage,” Journal of General Internal Medicine 37 (February 2022): 488-491, https://doi.org/10.1007/s11606-020-06534-2 ↩︎
- Eunhae Grace Oh, David J. Meyers, Kevin H. Nguyen, and Amal N. Trivedi, “Narrow Dialysis Networks In Medicare Advantage: Exposure By Race, Ethnicity, And Dual Eligibility,” Health Affairs 42, no. 2 (February 2022): 252-260, https://doi.org/10.1377/hlthaff.2022.01044 ↩︎
- Steven C. Martino et al, Racial, Ethnic, & Gender Disparities in Health Care in Medicare Advantage (Baltimore, MD: Centers for Medicare & Medicaid Services Office of Minority Health, April 2021), https://www.cms.gov/files/document/racial-ethnic-gender-disparities-health-care-medicare-advantage.pdf ↩︎
- Anuj Gangopadhyaya, Stephen Zuckerman, and Nikhil Rao, “Assessing the Difference in Racial and Ethnic Disparities in Access to and Use of Care Between Traditional Medicare and Medicare Advantage,” Health Services Research (March 2023): 1-10, https://doi.org/10.1111/1475-6773.14150 ↩︎
- Anuj Gangopadhyaya, Stephen Zuckerman, and Nikhil Rao, “Assessing the Difference in Racial and Ethnic Disparities in Access to and Use of Care Between Traditional Medicare and Medicare Advantage,” Health Services Research (March 2023): 1-10, https://doi.org/10.1111/1475-6773.14150 ↩︎
- Jason Lane et al., “Access to Health Care Improves COVID-19 Vaccination and Mitigates Health Disparities Among Medicare Beneficiaries,” Journal of Racial and Ethnic Health Disparities (September 2022): https://doi.org/10.1007/s40615-022-01343-1 ↩︎
- Steven C. Martino et al, Racial, Ethnic, & Gender Disparities in Health Care in Medicare Advantage (Baltimore, MD: Centers for Medicare & Medicaid Services Office of Minority Health, April 2021), https://www.cms.gov/files/document/racial-ethnic-gender-disparities-health-care-medicare-advantage.pdf ↩︎
- Anuj Gangopadhyaya, Stephen Zuckerman, and Nikhil Rao, “Assessing the Difference in Racial and Ethnic Disparities in Access to and Use of Care Between Traditional Medicare and Medicare Advantage,” Health Services Research (March 2023): 1-10, https://doi.org/10.1111/1475-6773.14150 ↩︎
- Anuj Gangopadhyaya, Stephen Zuckerman, and Nikhil Rao, “Assessing the Difference in Racial and Ethnic Disparities in Access to and Use of Care Between Traditional Medicare and Medicare Advantage,” Health Services Research (March 2023): 1-10, https://doi.org/10.1111/1475-6773.14150 ↩︎
- Anuj Gangopadhyaya, Stephen Zuckerman, and Nikhil Rao, “Assessing the Difference in Racial and Ethnic Disparities in Access to and Use of Care Between Traditional Medicare and Medicare Advantage,” Health Services Research (March 2023): 1-10, https://doi.org/10.1111/1475-6773.14150 ↩︎
- Anuj Gangopadhyaya, Stephen Zuckerman, and Nikhil Rao, “Assessing the Difference in Racial and Ethnic Disparities in Access to and Use of Care Between Traditional Medicare and Medicare Advantage,” Health Services Research (March 2023): 1-10, https://doi.org/10.1111/1475-6773.14150 ↩︎
- Anuj Gangopadhyaya, Stephen Zuckerman, and Nikhil Rao, “Assessing the Difference in Racial and Ethnic Disparities in Access to and Use of Care Between Traditional Medicare and Medicare Advantage,” Health Services Research (March 2023): 1-10, https://doi.org/10.1111/1475-6773.14150 ↩︎
- Sungchul Park, Rachel M. Werner, and Norma B. Coe, “Racial and ethnic disparities in access to and enrollment in high-quality Medicare Advantage plans,” Health Services Research 58 no.2 (April 2023): 303-313, https://doi.org/10.1111/1475-6773.13977 ↩︎
- David J. Meyers et al., “Association of Medicare Advantage Star Ratings With Racial, Ethnic, and Socioeconomic Disparities in Quality of Care,” JAMA Health Forum 2 no.6 (June 2021): e210793, doi:10.1001/jamahealthforum.2021.0793 ↩︎
- Sungchul Park, Brent A. Langellier, and David J. Meyers, “Differences between integrated and non-integrated plans in Medicare Advantage,” Health Services Research (November 2022): 1-9 https://doi.org/10.1111/1475-6773.14101 ↩︎
- Sungchul Park, Rachel Werner, and Norma Coe, “Association of Medicare Advantage Star Ratings With Racial and Ethnic Disparities in Hospitalizations for Ambulatory Care Sensitive Conditions,” Medical Care 60 no. 12 (December 2022): 872-879, DOI: 10.1097/MLR.0000000000001770 ↩︎
- Steven C. Martino et al, Racial, Ethnic, & Gender Disparities in Health Care in Medicare Advantage (Baltimore, MD: Centers for Medicare & Medicaid Services Office of Minority Health, April 2021), https://www.cms.gov/files/document/racial-ethnic-gender-disparities-health-care-medicare-advantage.pdf ↩︎
- Joshua Breslau et al., “Racial And Ethnic Differences In The Attainment Of Behavioral Health Quality Measures In Medicare Advantage Plans,” Health Affairs 37 no. 10 (October 2018): 1685-1692 https://doi.org/10.1377/hlthaff.2018.0655 ↩︎
- Steven C. Martino et al, Disparities in Health Care in Medicare Advantage by Race, Ethnicity, and Sex (Baltimore, MD: Centers for Medicare & Medicaid Services Office of Minority Health, April 2023), https://www.cms.gov/files/document/disparities-health-care-medicare-advantage-race-ethnicity-and-sex.pdf-0 ↩︎
- Steven C. Martino et al, Racial, Ethnic, & Gender Disparities in Health Care in Medicare Advantage (Baltimore, MD: Centers for Medicare & Medicaid Services Office of Minority Health, April 2021), https://www.cms.gov/files/document/racial-ethnic-gender-disparities-health-care-medicare-advantage.pdf ↩︎
- Joshua Breslau et al., “Racial And Ethnic Differences In The Attainment Of Behavioral Health Quality Measures In Medicare Advantage Plans,” Health Affairs 37 no. 10 (October 2018): 1685-1692 https://doi.org/10.1377/hlthaff.2018.0655 ↩︎
- Steven C. Martino et al, Racial, Ethnic, & Gender Disparities in Health Care in Medicare Advantage (Baltimore, MD: Centers for Medicare & Medicaid Services Office of Minority Health, April 2021), https://www.cms.gov/files/document/racial-ethnic-gender-disparities-health-care-medicare-advantage.pdf ↩︎
- Mallika Kommareddi, Kael Wherry, and Robert A Vigersky, “Racial/Ethnic Inequities in Use of Diabetes Technologies Among Medicare Advantage Beneficiaries With Type 1 Diabetes,” Journal of Clinical Endocrinology & Metabolism (January 2023), https://doi.org/10.1210/clinem/dgad046 ↩︎
- Steven C. Martino et al, Racial, Ethnic, & Gender Disparities in Health Care in Medicare Advantage (Baltimore, MD: Centers for Medicare & Medicaid Services Office of Minority Health, April 2021), https://www.cms.gov/files/document/racial-ethnic-gender-disparities-health-care-medicare-advantage.pdf ↩︎
- Steven C. Martino et al, Disparities in Health Care in Medicare Advantage by Race, Ethnicity, and Sex (Baltimore, MD: Centers for Medicare & Medicaid Services Office of Minority Health, April 2023), https://www.cms.gov/files/document/disparities-health-care-medicare-advantage-race-ethnicity-and-sex.pdf-0 ↩︎
- Steven C. Martino et al, Racial, Ethnic, & Gender Disparities in Health Care in Medicare Advantage (Baltimore, MD: Centers for Medicare & Medicaid Services Office of Minority Health, April 2021), https://www.cms.gov/files/document/racial-ethnic-gender-disparities-health-care-medicare-advantage.pdf ↩︎
- Shayla N. M. Durfey et al, “Neighborhood disadvantage and chronic disease management,” Health Services Research 54 no.S1 (February 2019): 206-216, https://doi.org/10.1111/1475-6773.13092 ↩︎
- Steven C. Martino et al, Racial, Ethnic, & Gender Disparities in Health Care in Medicare Advantage (Baltimore, MD: Centers for Medicare & Medicaid Services Office of Minority Health, April 2021), https://www.cms.gov/files/document/racial-ethnic-gender-disparities-health-care-medicare-advantage.pdf ↩︎
- Steven C. Martino et al, Disparities in Health Care in Medicare Advantage by Race, Ethnicity, and Sex (Baltimore, MD: Centers for Medicare & Medicaid Services Office of Minority Health, April 2023), https://www.cms.gov/files/document/disparities-health-care-medicare-advantage-race-ethnicity-and-sex.pdf-0 ↩︎
- Steven C. Martino et al, Disparities in Health Care in Medicare Advantage by Race, Ethnicity, and Sex (Baltimore, MD: Centers for Medicare & Medicaid Services Office of Minority Health, April 2023), https://www.cms.gov/files/document/disparities-health-care-medicare-advantage-race-ethnicity-and-sex.pdf-0 ↩︎
- Steven C. Martino et al, Racial, Ethnic, & Gender Disparities in Health Care in Medicare Advantage (Baltimore, MD: Centers for Medicare & Medicaid Services Office of Minority Health, April 2021), https://www.cms.gov/files/document/racial-ethnic-gender-disparities-health-care-medicare-advantage.pdf ↩︎
- Shayla N. M. Durfey et al, “Neighborhood disadvantage and chronic disease management,” Health Services Research 54 no.S1 (February 2019): 206-216, https://doi.org/10.1111/1475-6773.13092 ↩︎
- Steven C. Martino et al, Racial, Ethnic, & Gender Disparities in Health Care in Medicare Advantage (Baltimore, MD: Centers for Medicare & Medicaid Services Office of Minority Health, April 2021), https://www.cms.gov/files/document/racial-ethnic-gender-disparities-health-care-medicare-advantage.pdf ↩︎
- Shayla N. M. Durfey et al, “Neighborhood disadvantage and chronic disease management,” Health Services Research 54 no.S1 (February 2019): 206-216, https://doi.org/10.1111/1475-6773.13092 ↩︎
- Steven C. Martino et al, Disparities in Health Care in Medicare Advantage by Race, Ethnicity, and Sex (Baltimore, MD: Centers for Medicare & Medicaid Services Office of Minority Health, April 2023), https://www.cms.gov/files/document/disparities-health-care-medicare-advantage-race-ethnicity-and-sex.pdf-0 ↩︎
- Steven C. Martino et al, Racial, Ethnic, & Gender Disparities in Health Care in Medicare Advantage (Baltimore, MD: Centers for Medicare & Medicaid Services Office of Minority Health, April 2021), https://www.cms.gov/files/document/racial-ethnic-gender-disparities-health-care-medicare-advantage.pdf ↩︎
- Joshua Breslau et al., “Racial And Ethnic Differences In The Attainment Of Behavioral Health Quality Measures In Medicare Advantage Plans,” Health Affairs 37 no. 10 (October 2018): 1685-1692 https://doi.org/10.1377/hlthaff.2018.0655 ↩︎
- Steven C. Martino et al, Disparities in Health Care in Medicare Advantage by Race, Ethnicity, and Sex (Baltimore, MD: Centers for Medicare & Medicaid Services Office of Minority Health, April 2023), https://www.cms.gov/files/document/disparities-health-care-medicare-advantage-race-ethnicity-and-sex.pdf-0 ↩︎
- Steven C. Martino et al, Racial, Ethnic, & Gender Disparities in Health Care in Medicare Advantage (Baltimore, MD: Centers for Medicare & Medicaid Services Office of Minority Health, April 2021), https://www.cms.gov/files/document/racial-ethnic-gender-disparities-health-care-medicare-advantage.pdf ↩︎
- Steven C. Martino et al, Disparities in Health Care in Medicare Advantage by Race, Ethnicity, and Sex (Baltimore, MD: Centers for Medicare & Medicaid Services Office of Minority Health, April 2023), https://www.cms.gov/files/document/disparities-health-care-medicare-advantage-race-ethnicity-and-sex.pdf-0 ↩︎
- Clarissa Diamantidis et al., “Disparities in Chronic Kidney Disease Progression by Medicare Advantage Enrollees,” American Journal of Nephrology 52 no. 12 (January 2022): 949–957, https://doi.org/10.1159/000519758 ↩︎
- Steven C. Martino et al, Racial, Ethnic, & Gender Disparities in Health Care in Medicare Advantage (Baltimore, MD: Centers for Medicare & Medicaid Services Office of Minority Health, April 2021), https://www.cms.gov/files/document/racial-ethnic-gender-disparities-health-care-medicare-advantage.pdf ↩︎
- Steven C. Martino et al, Racial, Ethnic, & Gender Disparities in Health Care in Medicare Advantage (Baltimore, MD: Centers for Medicare & Medicaid Services Office of Minority Health, April 2021), https://www.cms.gov/files/document/racial-ethnic-gender-disparities-health-care-medicare-advantage.pdf ↩︎
- Steven C. Martino et al, Disparities in Health Care in Medicare Advantage by Race, Ethnicity, and Sex (Baltimore, MD: Centers for Medicare & Medicaid Services Office of Minority Health, April 2023), https://www.cms.gov/files/document/disparities-health-care-medicare-advantage-race-ethnicity-and-sex.pdf-0 ↩︎
- David J. Meyers, Momotazur Rahman, and Amal N. Trivedi, “Narrow Primary Care Networks in Medicare Advantage,” Journal of General Internal Medicine 37 (February 2022): 488-491, https://doi.org/10.1007/s11606-020-06534-2 ↩︎
- David J. Meyers, Momotazur Rahman, and Amal N. Trivedi, “Narrow Primary Care Networks in Medicare Advantage,” Journal of General Internal Medicine 37 (February 2022): 488-491, https://doi.org/10.1007/s11606-020-06534-2 ↩︎
- David J. Meyers, Momotazur Rahman, and Amal N. Trivedi, “Narrow Primary Care Networks in Medicare Advantage,” Journal of General Internal Medicine 37 (February 2022): 488-491, https://doi.org/10.1007/s11606-020-06534-2 ↩︎
- Eunhae Grace Oh, David J. Meyers, Kevin H. Nguyen, and Amal N. Trivedi, “Narrow Dialysis Networks In Medicare Advantage: Exposure By Race, Ethnicity, And Dual Eligibility,” Health Affairs 42, no. 2 (February 2022): 252-260, https://doi.org/10.1377/hlthaff.2022.01044 ↩︎
- Steven C. Martino et al, Racial, Ethnic, & Gender Disparities in Health Care in Medicare Advantage (Baltimore, MD: Centers for Medicare & Medicaid Services Office of Minority Health, April 2021), https://www.cms.gov/files/document/racial-ethnic-gender-disparities-health-care-medicare-advantage.pdf ↩︎
- Steven C. Martino et al, Disparities in Health Care in Medicare Advantage by Race, Ethnicity, and Sex (Baltimore, MD: Centers for Medicare & Medicaid Services Office of Minority Health, April 2023), https://www.cms.gov/files/document/disparities-health-care-medicare-advantage-race-ethnicity-and-sex.pdf-0 ↩︎
- Sungchul Park, Rachel M. Werner, and Norma B. Coe, “Racial and ethnic disparities in access to and enrollment in high-quality Medicare Advantage plans,” Health Services Research 58 no.2 (April 2023): 303-313, https://doi.org/10.1111/1475-6773.13977 ↩︎
- David J. Meyers et al., “Association of Medicare Advantage Star Ratings With Racial, Ethnic, and Socioeconomic Disparities in Quality of Care,” JAMA Health Forum 2 no.6 (June 2021): e210793, doi:10.1001/jamahealthforum.2021.0793 ↩︎
- Steven C. Martino et al., “Disparities In The Quality Of Clinical Care Delivered To American Indian/Alaska Native Medicare Advantage Enrollees,” Health Affairs 41, no. 5 (May 2022): 663:670, https://doi.org/10.1377/hlthaff.2021.01830 ↩︎
- Steven C. Martino et al., “Disparities In The Quality Of Clinical Care Delivered To American Indian/Alaska Native Medicare Advantage Enrollees,” Health Affairs 41, no. 5 (May 2022): 663:670, https://doi.org/10.1377/hlthaff.2021.01830 ↩︎
- Steven C. Martino et al., “Disparities In The Quality Of Clinical Care Delivered To American Indian/Alaska Native Medicare Advantage Enrollees,” Health Affairs 41, no. 5 (May 2022): 663:670, https://doi.org/10.1377/hlthaff.2021.01830 ↩︎
- Steven C. Martino et al, Disparities in Health Care in Medicare Advantage by Race, Ethnicity, and Sex (Baltimore, MD: Centers for Medicare & Medicaid Services Office of Minority Health, April 2023), https://www.cms.gov/files/document/disparities-health-care-medicare-advantage-race-ethnicity-and-sex.pdf-0 ↩︎
- Shayla N. M. Durfey et al, “Neighborhood disadvantage and chronic disease management,” Health Services Research 54 no.S1 (February 2019): 206-216, https://doi.org/10.1111/1475-6773.13092 ↩︎
- Steven C. Martino et al., “Disparities In The Quality Of Clinical Care Delivered To American Indian/Alaska Native Medicare Advantage Enrollees,” Health Affairs 41, no. 5 (May 2022): 663:670, https://doi.org/10.1377/hlthaff.2021.01830 ↩︎
- Shayla N. M. Durfey et al, “Neighborhood disadvantage and chronic disease management,” Health Services Research 54 no.S1 (February 2019): 206-216, https://doi.org/10.1111/1475-6773.13092 ↩︎
- Steven C. Martino et al, Disparities in Health Care in Medicare Advantage by Race, Ethnicity, and Sex (Baltimore, MD: Centers for Medicare & Medicaid Services Office of Minority Health, April 2023), https://www.cms.gov/files/document/disparities-health-care-medicare-advantage-race-ethnicity-and-sex.pdf-0 ↩︎
- Steven C. Martino et al., “Disparities In The Quality Of Clinical Care Delivered To American Indian/Alaska Native Medicare Advantage Enrollees,” Health Affairs 41, no. 5 (May 2022): 663:670, https://doi.org/10.1377/hlthaff.2021.01830 ↩︎
- Steven C. Martino et al, Disparities in Health Care in Medicare Advantage by Race, Ethnicity, and Sex (Baltimore, MD: Centers for Medicare & Medicaid Services Office of Minority Health, April 2023), https://www.cms.gov/files/document/disparities-health-care-medicare-advantage-race-ethnicity-and-sex.pdf-0 ↩︎
- Shayla N. M. Durfey et al, “Neighborhood disadvantage and chronic disease management,” Health Services Research 54 no.S1 (February 2019): 206-216, https://doi.org/10.1111/1475-6773.13092 ↩︎
- Steven C. Martino et al, Disparities in Health Care in Medicare Advantage by Race, Ethnicity, and Sex (Baltimore, MD: Centers for Medicare & Medicaid Services Office of Minority Health, April 2023), https://www.cms.gov/files/document/disparities-health-care-medicare-advantage-race-ethnicity-and-sex.pdf-0 ↩︎
- Steven C. Martino et al., “Disparities In The Quality Of Clinical Care Delivered To American Indian/Alaska Native Medicare Advantage Enrollees,” Health Affairs 41, no. 5 (May 2022): 663:670, https://doi.org/10.1377/hlthaff.2021.01830 ↩︎
- Steven C. Martino et al., “Disparities In The Quality Of Clinical Care Delivered To American Indian/Alaska Native Medicare Advantage Enrollees,” Health Affairs 41, no. 5 (May 2022): 663:670, https://doi.org/10.1377/hlthaff.2021.01830 ↩︎
- Steven C. Martino et al, Disparities in Health Care in Medicare Advantage by Race, Ethnicity, and Sex (Baltimore, MD: Centers for Medicare & Medicaid Services Office of Minority Health, April 2023), https://www.cms.gov/files/document/disparities-health-care-medicare-advantage-race-ethnicity-and-sex.pdf-0 ↩︎
- Steven C. Martino et al, Disparities in Health Care in Medicare Advantage by Race, Ethnicity, and Sex (Baltimore, MD: Centers for Medicare & Medicaid Services Office of Minority Health, April 2023), https://www.cms.gov/files/document/disparities-health-care-medicare-advantage-race-ethnicity-and-sex.pdf-0 ↩︎
- Steven C. Martino et al., “Disparities In The Quality Of Clinical Care Delivered To American Indian/Alaska Native Medicare Advantage Enrollees,” Health Affairs 41, no. 5 (May 2022): 663:670, https://doi.org/10.1377/hlthaff.2021.01830 ↩︎
- Steven C. Martino et al, Disparities in Health Care in Medicare Advantage by Race, Ethnicity, and Sex (Baltimore, MD: Centers for Medicare & Medicaid Services Office of Minority Health, April 2023), https://www.cms.gov/files/document/disparities-health-care-medicare-advantage-race-ethnicity-and-sex.pdf-0 ↩︎
- Steven C. Martino et al, Racial, Ethnic, & Gender Disparities in Health Care in Medicare Advantage (Baltimore, MD: Centers for Medicare & Medicaid Services Office of Minority Health, April 2021), https://www.cms.gov/files/document/racial-ethnic-gender-disparities-health-care-medicare-advantage.pdf ↩︎
- Steven C. Martino et al, Disparities in Health Care in Medicare Advantage by Race, Ethnicity, and Sex (Baltimore, MD: Centers for Medicare & Medicaid Services Office of Minority Health, April 2023), https://www.cms.gov/files/document/disparities-health-care-medicare-advantage-race-ethnicity-and-sex.pdf-0 ↩︎
- Steven C. Martino et al, Racial, Ethnic, & Gender Disparities in Health Care in Medicare Advantage (Baltimore, MD: Centers for Medicare & Medicaid Services Office of Minority Health, April 2021), https://www.cms.gov/files/document/racial-ethnic-gender-disparities-health-care-medicare-advantage.pdf ↩︎
- Eunhae Grace Oh, David J. Meyers, Kevin H. Nguyen, and Amal N. Trivedi, “Narrow Dialysis Networks In Medicare Advantage: Exposure By Race, Ethnicity, And Dual Eligibility,” Health Affairs 42, no. 2 (February 2022): 252-260, https://doi.org/10.1377/hlthaff.2022.01044 ↩︎
- David J. Meyers, Momotazur Rahman, and Amal N. Trivedi, “Narrow Primary Care Networks in Medicare Advantage,” Journal of General Internal Medicine 37 (February 2022): 488-491, https://doi.org/10.1007/s11606-020-06534-2 ↩︎
- Steven C. Martino et al, Racial, Ethnic, & Gender Disparities in Health Care in Medicare Advantage (Baltimore, MD: Centers for Medicare & Medicaid Services Office of Minority Health, April 2021), https://www.cms.gov/files/document/racial-ethnic-gender-disparities-health-care-medicare-advantage.pdf ↩︎
- Steven C. Martino et al., “Disparities In The Quality Of Clinical Care Delivered To American Indian/Alaska Native Medicare Advantage Enrollees,” Health Affairs 41, no. 5 (May 2022): 663:670, https://doi.org/10.1377/hlthaff.2021.01830 ↩︎
- Steven C. Martino et al, Disparities in Health Care in Medicare Advantage by Race, Ethnicity, and Sex (Baltimore, MD: Centers for Medicare & Medicaid Services Office of Minority Health, April 2023), https://www.cms.gov/files/document/disparities-health-care-medicare-advantage-race-ethnicity-and-sex.pdf-0 ↩︎
- Steven C. Martino et al, Racial, Ethnic, & Gender Disparities in Health Care in Medicare Advantage (Baltimore, MD: Centers for Medicare & Medicaid Services Office of Minority Health, April 2021), https://www.cms.gov/files/document/racial-ethnic-gender-disparities-health-care-medicare-advantage.pdf ↩︎
- Steven C. Martino et al, Disparities in Health Care in Medicare Advantage by Race, Ethnicity, and Sex (Baltimore, MD: Centers for Medicare & Medicaid Services Office of Minority Health, April 2023), https://www.cms.gov/files/document/disparities-health-care-medicare-advantage-race-ethnicity-and-sex.pdf-0 ↩︎
- Anuj Gangopadhyaya, Stephen Zuckerman, and Nikhil Rao, “Assessing the Difference in Racial and Ethnic Disparities in Access to and Use of Care Between Traditional Medicare and Medicare Advantage,” Health Services Research (March 2023): 1-10, https://doi.org/10.1111/1475-6773.14150 ↩︎
- Steven C. Martino et al, Racial, Ethnic, & Gender Disparities in Health Care in Medicare Advantage (Baltimore, MD: Centers for Medicare & Medicaid Services Office of Minority Health, April 2021), https://www.cms.gov/files/document/racial-ethnic-gender-disparities-health-care-medicare-advantage.pdf ↩︎
- Steven C. Martino et al., Rural-Urban Disparities in Health Care in Medicare (Baltimore, MD: Centers for Medicare & Medicaid Services Office of Minority Health, November 2020), https://www.cms.gov/files/document/omh-rural-urban-report-2020.pdf ↩︎
- Steven C. Martino et al., Rural-Urban Disparities in Health Care in Medicare (Baltimore, MD: Centers for Medicare & Medicaid Services Office of Minority Health, November 2022), https://www.cms.gov/files/document/rural-urban-disparities-11-2022.pdf ↩︎
- Steven C. Martino et al., Rural-Urban Disparities in Health Care in Medicare (Baltimore, MD: Centers for Medicare & Medicaid Services Office of Minority Health, November 2020), https://www.cms.gov/files/document/omh-rural-urban-report-2020.pdf ↩︎
- Steven C. Martino et al, Racial, Ethnic, & Gender Disparities in Health Care in Medicare Advantage (Baltimore, MD: Centers for Medicare & Medicaid Services Office of Minority Health, April 2021), https://www.cms.gov/files/document/racial-ethnic-gender-disparities-health-care-medicare-advantage.pdf ↩︎