Medical Frailty and Medicaid Work Requirements: Challenges for People with HIV

Published: Jul 1, 2026

On June 1, 2026, the Centers for Medicare and Medicaid Services (CMS) issued an interim final rule providing states with guidance for implementing Medicaid “community engagement” or Medicaid work requirements as part of the 2025 federal budget reconciliation law. The law requires states to condition Medicaid eligibility for enrollees with coverage through the Affordable Care Act (ACA) expansion or under certain waivers on meeting these requirements or qualifying for an exclusion, including one related to being “medically frail or otherwise” having “a special medical need.” In defining medical frailty, the rule introduces a two-part test, requiring an enrollee to both have a qualifying condition and demonstrate that the condition impairs their ability to fulfill the community engagement requirement, differing from stakeholders’ expectations. Early on, and as with Nebraska’s early implementation, states believed they would be able to exclude people based on presence of a condition alone and several states planned to exclude all people with HIV.

On June 29, 2026, twenty-four (24) states and two (2) state governors sued CMS in Massachusetts District Court challenging aspects of the regulation, including its requirement that to qualify for the medical frailty exclusion an enrollee’s condition must significantly impair their ability to comply with community engagement requirements. Among other arguments, the plaintiff states claim this additional requirement is contrary to the reconciliation law (H.R.1) and that “H.R. 1’s broad statutory exclusions exist for good reason. People with disabilities, patients in the middle of cancer treatment, or those struggling with another serious or complex health condition, shouldn’t be at risk of losing the care that helps maintain their health.” Whether the court grants their request to enjoin and vacate the challenged provisions, including the medical frailty two-part test, is yet to be seen.

In the meantime, because Medicaid is the primary source of insurance coverage for people with HIV, this new requirement and state implementation decisions, will have a significant impact on this population’s access to Medicaid going forward and could affect the nation’s efforts to address HIV.

This analysis reviews the implications of the rule’s definition of medical frailty for people with HIV. (For a broad overview of medical frailty, definition of terms, and the impact of the regulation beyond HIV, see this KFF analysis.)

Medicaid expansion is the most common pathway for Medicaid coverage for people with HIV, so many with HIV will be subject to new work / community engagement requirements. Medicaid is the largest source of insurance coverage for people with HIV and plays a larger role in covering adults with HIV than adults without HIV. Nationwide, nearly half (46%) of people with HIV had coverage through the Medicaid program in 2023. In states that have expanded their Medicaid programs, Medicaid expansion is the primary pathway to coverage for people with HIV. In 2023, 60% of adults under age 65 with HIV in expansion states had coverage through the expansion pathway and would be subject to work requirements (see Figure 1). Before states expanded Medicaid programs under the ACA, many people with HIV did not have access to affordable coverage until they had an advanced condition to qualify through a permanent disability pathway and many were uninsured, despite coverage and access to care having the potential to stave disability off in the first place.

In Medicaid Expansion States, Six in Ten (60%) Medicaid Enrollees with HIV Have Coverage Through the Expansion Pathway (Stacked column chart)

The approach to determining medical frailty specified in the rule will make it more difficult for individuals with HIV to obtain a medical frailty exclusion from work requirements. The rule imposes a two-part test that defines as medically frail an individual who is blind or disabled; has a substance use disorder; has a “disabling” mental disorder; has a physical, intellectual, or developmental disability that limits the ability to perform one or more activities of daily living (ADL); or has a “serious or complex” medical condition and whose condition impairs their ability to fulfill the community engagement requirements (including but not limited to work). While the rule includes HIV/AIDS as one of 19 example conditions that would be reasonable for states to consider as a serious or complex medical condition, it further specifies, using HIV as an example, that, “Individuals with HIV/AIDS are medically frail if they are determined to have a serious or complex medical condition that significantly impairs the individual's ability to comply with the community engagement requirement, which is less likely to be the case if the acuity of their condition is not severe.” Access to antiretroviral medication, including through Medicaid, is necessary to manage HIV and prevent immune system dysfunction, illness, and ultimately death. To the extent people with HIV lose access to Medicaid due to work requirements, including failure to navigate reporting rules, they may develop more severe conditions. 

People with HIV whose condition is well managed may qualify as medically frail if they have another medical condition that limits their ability to work. Nearly three-quarters (73%) of people with HIV enrolled in Medicaid have chronic conditions (other than HIV), compared with four in ten (42%) of those without HIV. Alternatively, people with HIV may qualify as medically frail under one of the other categories. Notably, people with HIV are more likely than other Medicaid enrollees to have an SUD or mental health condition. Nearly, one-quarter (23%) of people with HIV had an SUD diagnosis compared to 8% of Medicaid enrollees without HIV and over one-third (36%) of Medicaid enrollees with HIV had a mental health condition diagnosis, some of which may be considered “disabling,” compared to 16% of Medicaid enrollees without HIV. People with HIV also experience high rates of disability--half (50%) of likely Medicaid expansion enrollees with HIV have a disability, including a functional disability (e.g. difficulty climbing stairs, dressing oneself, etc.) or an AIDS (stage III HIV) diagnosis.

The rule requires states to use claims and encounter data to identify individuals who may be medically frail, but does not provide guidance on how to assess whether a condition limits an individual’s ability to meet the community engagement requirements. States will be required to maintain an auditable list of medically frail conditions (in the form of diagnosis codes) that could include HIV. States will have discretion over the creation of this list and may include only some codes for each condition. For example, Nebraska’s list of ICD-10 codes released before the state implemented work requirements on May 1, 2026 only included one of several codes for HIV which would not capture all enrollees with HIV. The rule also makes clear that diagnoses alone cannot be used to determine medical frailty because of the need to assess whether the condition impairs the ability to work or engage in community service. This additional requirement will limit the ability to verify medical frailty on an automated, or ex parte, basis and will require states to use other verification methods.

The regulation offers examples of the types of providers that states could use to verify medical frailty including a range of clinicians. CMS’s inclusion of “clinical social workers” on this list could be especially meaningful for people with HIV given that many get care through clinics with integrated social and support services whose staff help with insurance navigation. However, the administrative burden on treating providers is likely to be significant

For people with HIV, the reliance on data sharing, confirmation from treating providers, and health screeners and self-attestation to verify medical frailty exclusion status may raise unique privacy issues and barriers due to stigma: 

  • Data sharing: Some states are exploring using a data-sharing process between the state Medicaid and state public health/HIV office which could help them identify enrollees without HIV related claims histories, including those new to Medicaid. Some states already have a data sharing agreement in place. However, this public health data is highly sensitive, and some have raised concerns about data privacy and security related to HIV status. 
  • Provider documentation. As noted, the rule permits states to accept documentation of qualifying conditions and medical frailty from providers. However, the requirement to assess and report the severity of patients’ conditions and the impact on their ability to meet the work requirements may raise ethical concerns for these providers, particularly given the emphasis in HIV care on care engagement for both the patient’s and public health.
  • Health screeners and self-attestation. The rule encourages states to use health screeners at application and renewal to identify individuals who may be medically frail, which could include people with HIV. Separately, though its use will be more limited starting in January 2028, most states will also likely allow self-attestation when existing data sources are insufficient to document a qualifying condition and the inability to work. However, the stigma associated with HIV may discourage individuals from disclosing their condition and how it impacts their life.

Coverage loss for people with HIV could negatively impact individual health, public health, and place an increased burden on already stretched HIV programs. Given the new requirements in the regulation, a blanket exclusion for people with HIV will not be possible which will mean a greater staff burden (at the state Medicaid agency and in clinics), higher costs, and potentially wide scale churn, disenrollment, or coverage rejections for those with HIV. While earlier KFF research found that one-third (33%) of likely expansion enrollees with HIV were working at least 20 hours per week and another 4% had dependents at home, the need to document work compliance or medical frailty status, could challenge coverage retention for people with HIV which could lead to disruptions in care and treatment and subsequently increased risk of morbidity, mortality, and HIV transmission. Such a scenario also runs counter to federal goals in the Administration’s Ending the HIV Epidemic Initiative and the Ryan White Program Moving Forward (formerly Ryan White Program 2030) vision. Indeed, four in ten new HIV transmissions are associated with someone who is aware of their HIV status but not in care. Treatment interruptions can also lead to antiretroviral resistance, making future treatment and care more complex. Additionally, if people with HIV lose Medicaid coverage some may turn to the federal Ryan White Program. This comes at a time when state Ryan White Programs across the country are facing budget crises due to a range of factors and coverage losses due to work requirements represent an additional challenge for programs to weather.

KFF Tracker: America First MOU Bilateral Global Health Agreements

Published: Jul 1, 2026

Editorial Note: Originally published on January 13, 2026, this resource will be updated as needed, most recently on July 1, 2026, to reflect additional developments.

On September 18, 2025, the U.S. government (USG) released its new America First Global Health Strategy, which details how the U.S. will engage in global health efforts moving forward. As part of this new strategy, the U.S. has announced that it will be establishing bilateral health cooperation agreements with countries that receive U.S. global health assistance. These agreements, or Memorandums of Understanding (MOUs), between the U.S. and partner countries represent five-year plans (for the period 2026-2030) outlining U.S. engagement in each country’s health efforts with the goal of “helping countries move toward more resilient and durable health systems.” Central to these plans is transitioning country programs from U.S. assistance to long-term country ownership, with a pledge from each partner country to increase its domestic health spending, or co-investment in health, over the next five years as the U.S. decreases its health assistance. The U.S. began signing these agreements in late 2025 and this process is ongoing. Implementation is slated for later this year.

This tracker provides an overview of the MOUs signed to date. Data are based on press releases issued by the State Department, U.S. embassies, and partner country Ministries of Health, as well as MOU documents (if publicly available). See Methods for more information. This tracker will be updated as agreements are signed and more data become available.

USG Global Health MOUs by Country (Table)
Signed USG Global Health MOUs by Country (Choropleth map)
Global Health MOU Funding by Country (Bar Chart)
USG Global Health MOU Co-Financing Share by Country (Stacked Bars)
USG Global Health MOU Program Areas by Country (Table)
Historical vs. Proposed 5-Year USG Global Health MOU Funding by Country (Grouped Bars)

Methods

This tracker provides information on U.S. MOU bilateral global health agreements to date. Information is sourced from publicly available U.S. Department of State, U.S. embassies, and partner country Ministries of Health press release statements and MOU texts, and will be updated as more information becomes available and when additional agreements are signed. Currently, MOU text, which contains the most detailed information of these sources, is publicly available for only a limited number of countries; for these countries, data were sourced directly from these MOU documents. For countries with available MOU documents, overall totals are based on the sum of annual amounts presented in the text. 

Program areas are captured using keyword searches; for global health security (GHS) specifically, country agreements were categorized as targeting GHS if they specifically mentioned GHS, or if they included descriptions of outbreak preparedness and response activities and containing health threats. Due to the limited nature of press release statements, this tracker may not comprehensively capture the global health program areas targeted in each country’s agreement.

How Has Projected Medicaid Spending and Enrollment Changed Since Passage of the 2025 Reconciliation Law?

Published: Jul 1, 2026

The Congressional Budget Office (CBO), known as Congress’s “scorekeeper,” projects federal spending and revenues over the next decade and cost estimates of proposed legislation are measured against those projections. Those projections include spending on major federal programs, such as Medicaid. CBO also typically releases a detailed baseline for federal spending on Medicaid that includes estimates of enrollment by eligibility group and spending by service category. The 2025 reconciliation law, signed into law by President Trump on July 4, 2025, made major changes to federal revenues and spending, with CBO estimating the new law would reduce federal spending on Medicaid by $911 billion over the 2025-2034 period, relative to its January 2025 baseline projections of Medicaid spending under the law and regulations at the time.

CBO’s latest projections of Medicaid spending and enrollment from February 2026 show how enrollment and spending are expected to change over the next decade, accounting for the historic policy changes and their expected reductions in future federal Medicaid spending as well as other economic and technical changes. This policy watch compares CBO’s February 2026 projections of Medicaid spending and enrollment to earlier CBO projections. Projections of spending are compared to those from January 2025 (the baseline used to score the 2025 reconciliation law), but the most recent prior Medicaid enrollment projections are from June 2024. CBO’s newest projections show that enrollment is estimated to be 13% lower and spending 8% lower at the end of the budget windows, highlighting a significant shift in baselines stemming from Medicaid cuts in the 2025 reconciliation law. However, those changes understate the true effects of the 2025 reconciliation law because other factors caused Medicaid baseline spending to increase. 

CBO’s most recent Medicaid projections highlight the effects of the 2025 reconciliation law in reducing future Medicaid spending. The most recently released detailed CBO baseline shows that, following passage of the Medicaid changes in the reconciliation law, Medicaid spending is now expected to grow more slowly over time relative to earlier projections. As a result, 2035 spending is projected to be 8% lower than it was in the January 2025 baseline ($941 billion instead of $1.03 trillion, Figure 1). Over the entire 2025-2035 period, federal Medicaid spending in CBO’s latest baseline is projected to be $503 billion lower than estimated in the January 2025 baseline, before the passage of the 2025 reconciliation law. The reconciliation law included major changes to Medicaid eligibility, including the implementation of new Medicaid work requirements, and substantial changes to Medicaid financing, which together contribute to Medicaid’s lower baseline compared with prior years. CBO projects that federal Medicaid spending will still grow but more slowly because of the reductions in the reconciliation law. As a result, fewer people will be covered, and aggregate federal Medicaid spending will likely not keep pace with the increase in health care costs.

CBO’s Most Recent Medicaid Projections Highlight the Effects of the 2025 Reconciliation Law in Reducing Future Medicaid Spending (Line chart)

CBO’s latest spending projections also account for economic and technical changes that increased Medicaid spending relative to the January 2025 baseline, so comparing baselines may understate the effects of Medicaid cuts in the 2025 reconciliation law. One of the biggest reasons for increased spending was higher-than-expected per enrollee spending in 2025. CBO reports that costs per enrollee grew by 16% in that year, primarily because of declining health status after the COVID-19 continuous enrollment period ended. Those higher 2025 costs per enrollee compound over time due to inflation and rising health care costs. If the most recent baseline projections did not account for those 2025 cost increases, the differences between January 2025 and February 2026 Medicaid spending projections, driven by the Medicaid policy changes in the reconciliation law, would be larger.

CBO’s latest Medicaid projections also show the impact of the 2025 reconciliation law on reducing future Medicaid enrollment. The latest baseline shows that total average annual Medicaid enrollment is expected to decline, falling to 74 million enrollees by 2034 (a 13% reduction) compared with 85 million projected in the detailed baseline released before the new law’s passage. Many individuals who lose Medicaid coverage do not have another source of affordable health coverage and will become uninsured. CBO’s earlier estimates of the Medicaid policy changes in the reconciliation law found the new law will reduce Medicaid enrollment by more than 11 million and increase the number of people without insurance by 7.5 million in 2034, though these estimates do not account for recently released rules related to work requirements that could affect enrollment projections. CBO may release updated coverage estimates in the coming months. Data show that being uninsured has implications for access to care, financial stability, and health outcomes.

CBO's Latest Medicaid Projections Also Show the Impact of the 2025 Reconciliation Law on Reducing Future Medicaid Enrollment (Line chart)

Reductions in future Medicaid enrollment shown in CBO’s most recent projections are concentrated among ACA expansion adults, other adults, and children. The eligibility changes in the 2025 reconciliation law primarily affect adults in the ACA Medicaid expansion group (including new work requirements and more frequent eligibility determinations). Comparing CBO’s projections with those prior to passage of the reconciliation law shows the largest change in enrollment among the ACA Medicaid expansion group (5 million fewer expansion enrollees in 2034). The latest detailed baseline also shows 3 million fewer children and 2 million fewer other adult enrollees than the previous detailed baseline, likely due to provisions that affect groups beyond the expansion group and research showing that coverage loss among parents may reduce enrollment among children.

Reductions in Future Medicaid Enrollment Shown in CBO’s Most Recent Projections Are Concentrated Among ACA Expansion Adults, Other Adults, and Children (Grouped column chart)

Decoding Medicare Advantage Coding Intensity

Published: Jul 1, 2026

In recent years, federal payments to Medicare Advantage plans, and how they are adjusted for enrollee health status, have come under increased scrutiny. Medicare Advantage plans receive a capitated amount for each enrollee, and these payments are “risk adjusted” based on the diagnosis codes reported by the insurer to the Centers for Medicare & Medicaid Services (CMS) for each enrollee. Plans receive higher payments for enrollees who are sicker and expected to have higher health care spending, and lower payments for enrollees who are healthier and expected to have lower health care spending. The purpose of this risk adjustment is to ensure plans receive adequate payments to treat sicker, higher-cost patients and reduce incentives to enroll primarily healthier, lower cost, beneficiaries. However, since the approach to risk adjusting payments relies heavily on the diagnosis codes recorded for Medicare Advantage enrollees, it provides a strong financial incentive for private insurers to capture as many diagnosis codes for each enrollee as possible, which increases payments and contributes to higher Medicare spending.  

In contrast, payments under traditional Medicare only require the diagnosis codes necessary to support the services delivered. This means physicians and other health care providers do not have the same incentive to maximize the number of health care conditions documented through diagnosis codes. Differences in coding practices between traditional Medicare and Medicare Advantage (also referred to as coding intensity) mean that Medicare Advantage enrollees appear to be in worse health than they would if they received their Medicare benefits through traditional Medicare. Since the Medicare Advantage risk adjustment model is calibrated on traditional Medicare beneficiaries, the payments to Medicare Advantage plans are higher than necessary to cover expected costs, on average. According to the Medicare Payment Advisory Commission (MedPAC), in 2026, total payments to Medicare Advantage plans are $76 billion higher than traditional Medicare would spend for the same beneficiaries, of which $28 billion is attributed to coding intensity.

CMS has expressed a commitment to improving the accuracy of payments to Medicare Advantage and reducing the role coding practices play in determining the amount private plans receive from the federal government. Toward this end, the 2027 rate notice finalized a policy changing how certain diagnoses are considered when adjusting federal payments to Medicare Advantage plans for an enrollee’s health status. As policymakers and administration officials consider issues related to Medicare Advantage payments, this issue brief answers key questions about coding intensity, recent steps taken by CMS to address the impact of coding on payment, the effects on Medicare beneficiaries, and other proposals to improve Medicare Advantage payment accuracy.

What is coding?

Doctors and other health care providers include diagnosis codes on claims they submit to payers (either Medicare Administrative Contractors (MACs) for traditional Medicare or private insurers for Medicare Advantage) indicating a patient’s health conditions that support the health care services they delivered. The diagnosis codes for traditional Medicare beneficiaries are also used by CMS, along with other information, to develop a risk adjustment model estimating the relationship between a person’s health status (expressed as a “risk score”) and their projected health care spending. Medicare Advantage insurers submit the diagnosis codes documented by health care providers serving their enrollees to CMS for use in adjusting the payments the plans receive from the federal government using this risk adjustment model.

While the diagnosis codes used to develop the risk adjustment model only come from the claims providers submit for services rendered to traditional Medicare beneficiaries, those used to adjust payments to Medicare Advantage plans can be supplemented in two ways. First, Medicare Advantage plans may conduct health risk assessments (HRAs) and include the diagnosis codes for any conditions identified during this questionnaire in what is submitted to CMS – even when there are no related services delivered during the year to treat those conditions. KFF analysis finds that insurers often use rewards and incentives to encourage enrollees to complete HRAs. Second, Medicare Advantage plans may conduct chart reviews, which examine a person’s medical records, sometimes using AI tools, to determine if they are consistent with the information submitted by health care providers to the insurer. KFF analysis finds that chart reviews are used to add diagnosis codes that do not otherwise appear on a record for an encounter with a physician, increasing payments from CMS to Medicare Advantage insurers for one in six Medicare Advantage enrollees.

What is coding intensity?

Coding intensity is the degree to which a person’s health care conditions are documented through diagnosis codes. Differences in coding patterns across groups of beneficiaries, such as Medicare Advantage enrollees and traditional Medicare beneficiaries, or those in Medicare Advantage plans sponsored by different insurers, are described as differences in coding intensity. Higher coding intensity is not necessarily fraudulent, but fraud can contribute to higher coding intensity.

Because Medicare Advantage payments are generally higher for enrollees with more diagnosis codes (and therefore higher risk scores), private insurers have an incentive to document more health conditions, but there is no similar incentive in traditional Medicare. Recognizing this incentive, lawmakers have required CMS to reduce Medicare Advantage risk scores by at least 5.9% across the board before adjusting payments to private plans. However, that adjustment does not fully account for difference in coding patterns, and a number of studies have documented that risk scores are still higher in Medicare Advantage after applying the coding intensity adjustment than they would be if enrollees received their Medicare benefits under traditional Medicare. The magnitude of the uncorrected coding intensity after the adjustment has varied over time, ranging from as low as 2% in 2016 to 10% in 2023, and is estimated to be approximately 4% in 2026, according to MedPAC. The magnitude also varies by insurer and is larger for insurers comprising a larger share of enrollment. See Box 1 for an illustrative example of higher coding intensity and the effect on Medicare Advantage payments.

Box 1. Illustrative Example of How Higher Coding Intensity in Medicare Advantage Increases Payments to Private Insurers.

The risk adjustment model, which is used to assign a risk score to all Medicare Advantage enrollees, specifies “coefficients” for each factor that contributes to a person’s risk score. Each coefficient reflects the average marginal impact, or how much higher traditional Medicare spending is expected to be, due to that factor. To illustrate how coding intensity increases Medicare Advantage payments, consider Mr. Smith, who is 73-years old, living in the community, and received health care services to treat type 2 diabetes and heart failure last year. He is enrolled in a Medicare Advantage plan that receives $12,000 per year for an average Medicare beneficiary (risk score = 1).

If Mr. Smith’s Medicare Advantage plan codes consistent with traditional Medicare, the coefficients from the 2026 Risk Adjustment Model for each of the factors contributing to Mr. Smith’s risk score would be: Male 70-74 years – 0.396, Diabetes with Chronic Complications (HCC37) – 0.166, Heart Failure (HC226) – 0.336, and an interaction for having both diabetes and heart failure – 0.112. Mr. Smith’s risk score would be equal to the sum of these coefficients, 1.034, or 0.912 after applying the 1.067 normalization factor for the 2026 plan payment year (which is used to ensure the average risk score is equal to 1 in years beyond the initial estimation year) and the 5.9% coding adjustment (which applies to all plans regardless of whether they code consistent with traditional Medicare or have higher coding intensity). The plan would receive payments totaling $10,943 for Mr. Smith if he is enrolled the entire year ($12,000 * 0.912).

If instead the Medicare Advantage plan has higher coding intensity, it is possible that an additional diagnosis (or diagnoses) could be added to Mr. Smith’s record. For example, if the plan does a chart review and uncovers that Mr. Smith also meets the definition for morbid obesity, a condition that is documented more often in Medicare Advantage than traditional Medicare, his unadjusted risk score would increase by 0.186, bringing it up to 1.220. After applying the 1.067 normalization factor and 5.9% coding adjustment, his risk score would be 1.076. The plan would receive payments totaling $12,911 if Mr. Smith is enrolled the entire year ($12,000 * 1.076).

As a result of higher coding intensity, the plan receives nearly $2,000 more over the year for Mr. Smith – 18% more – than if it coded consistent with traditional Medicare (Figure 1).

Illustrative Example of Impact of Higher Coding Intensity on Total Medicare Advantage Payments for the Year (Stacked column chart)

What has CMS done to reduce coding intensity?

Risk Model Revisions. CMS periodically revises the risk adjustment model. Most recently, CMS updated the data used to calibrate the model and changed how certain conditions that were coded more frequently in Medicare Advantage than traditional Medicare were incorporated (or not). The move to the new model (referred to as V28 because it is the 28th version of the model) was phased in between 2024 and 2026.

Following full implementation of the new risk adjustment model, MedPAC estimated that the impact of coding intensity on Medicare Advantage payments has declined from increasing payments by 10% in 2022 to 4% in 2026 (the first year the V28 model is fully in effect). A recent analysis from CMS staff approached the analysis from a different angle – examining what the impact of using V28 would have been in 2022 if it had been in effect. That analysis finds uncorrected coding intensity (after applying the 5.9% adjustment) would have been between 1.5% and 2.0%, compared to 10% under the previous risk adjustment model (V24) that was in effect in 2022. This is consistent with the findings of other researchers, but the estimate for 2022 is not directly comparable to the MedPAC analysis because the CMS analysis modeled the impact of V28 in an earlier year in which it was not in effect, while MedPAC looks at the uncorrected coding intensity using the risk model in effect in the current payment year (2026).

Analyses of Medicare Advantage risk score trends have consistently found that coding intensity grows over time. Thus, the CMS staff estimate that uncorrected coding intensity would have been between 1.5% and 2.0% if the V28 model had been fully implemented in 2022 is consistent with MedPAC’s higher estimate of uncorrected coding intensity in 2026 of 4%, which incorporates growth in coding intensity between 2022 and 2026.

Coding Intensity. CMS also routinely makes other changes to the risk adjustment process separate from moving to a new model. For example, in the 2027 rate notice, CMS finalized a policy to exclude diagnosis codes added for enrollees based on chart review records that are not linked to an encounter with a health care provider (referred to as “unlinked” chart reviews). CMS estimates the new policy will reduce average payments to Medicare Advantage plans by 1.5% compared to what they would have been otherwise. While that estimate is similar in magnitude to the CMS staff estimate of uncorrected coding intensity in 2022 if the V28 model had been in effect, the two are not directly comparable because the impact of removing unlinked chart reviews applies to the 2027 plan year payment.

The use of chart reviews has come under scrutiny because analysis of Medicare Advantage insurers’ coding practices consistently finds that chart reviews are the primary contributor to higher coding intensity in Medicare Advantage. However, chart reviews are likely to continue to contribute to higher coding intensity in Medicare Advantage even after excluding diagnoses from unlinked chart reviews. Based on KFF analysis of Medicare Advantage encounter data for 2022, diagnoses from unlinked chart reviews comprised one-third of all diagnoses added through the chart review process in 2022, meaning that diagnoses from chart reviews that were linked to an encounter account for most of the diagnosis codes added during the chart review process.

Additionally, it is likely that an even smaller share of all diagnoses added on chart reviews will be impacted by the new policy to exclude diagnosis codes from unlinked chart reviews because the condition categories for which specific diagnoses were most commonly added in an unlinked chart review in 2022 were substantially impacted by the move to the V28 risk adjustment model. For example, vascular disease was among the most common conditions added on an unlinked chart review in 2022 that increased payment, but this condition category was substantially narrowed as part of the shift to V28 – meaning that many of these diagnoses codes would no longer count towards payment under the risk adjustment model regardless of the policy change related to unlinked chart reviews. Finally, the impact could be less than CMS estimates if insurers put more effort into linking chart reviews to encounters so that included diagnoses can be considered for risk adjustment purposes.

How are Medicare beneficiaries impacted by coding intensity and changes to the risk adjustment model?

Since higher risk scores increase Medicare payments to plans, higher coding intensity provides plans with the option to offer more extra benefits to enrollees, such as dental, vision, and hearing coverage, as well as reduced cost sharing. In addition, this additional funding from the federal government can be used for other purposes, such as increasing plan margins or paying for more advertising, as long as the Medicare Advantage insurer meets the minimum medical loss ratio required under law. (The medical loss ratio is the share of premium revenues going to pay for claims versus administrative overhead and profit.) 

Industry representatives have raised concerns that payment changes, including efforts to address coding intensity, could result in plans offering fewer extra benefits or raising costs for Medicare Advantage enrollees. While there have been some changes to plan benefits and costs following the implementation of V28, including modest increases in out-of-pocket limits and decreases in some extra benefits, such as the availability of funds provided to pay for over-the-counter drugs and supplies, private insurers have generally absorbed a large portion of payment changes. An analysis of the first two years of the phase in of the new risk score model finds that insurers reduced benefits or raised costs by between 17% and 24% of the anticipated reduction in plan payments. That is a smaller effect than previous analysis of the impact of changes to Medicare Advantage payments, which found that private insurers passed through about half of the payment change in the form of fewer benefits and/or higher costs.

What additional steps can be taken to improve the accuracy of Medicare Advantage payments?

Policy proposals to address the remaining uncorrected coding intensity in Medicare Advantage include expanding the sources of diagnoses that are ineligible for risk adjustment to include all chart reviews and HRAs, increasing the 5.9% across-the-board adjustment to risk scores, or applying a tiered adjustment to risk scores based on historical coding intensity (so plans with higher coding intensity in previous years would have larger adjustments to their risk scores). Additionally, updates to the risk score model, such as those proposed but not finalized by CMS for 2027, may also better align the adjustments for health status to the expected impact on spending by incorporating more recent data to better reflect current treatment patterns and costs.

Beyond coding intensity, favorable selection into Medicare Advantage also increases payments above what traditional Medicare would spend for the same beneficiaries. Favorable selection occurs when the people who enroll in Medicare Advantage have lower actual health care use and spending, on average, than what is predicted by the risk score model. For example, previous KFF analysis found that Medicare beneficiaries who enroll in Medicare Advantage have lower spending than those who remain in traditional Medicare, after adjusting for health risk using the risk adjustment model. MedPAC estimates that the largest component of higher payments to Medicare Advantage plans relative to traditional Medicare is favorable selection into Medicare Advantage. The impact of favorable selection has been relatively stable over time, ranging between 9% and 11%, according to MedPAC; in other words, resulting in payments to Medicare Advantage plans for enrollees that are 9% to 11% higher than costs would be in traditional Medicare. In 2026, favorable selection is estimated to add $57 billion to Medicare spending.

To address the impact of favorable selection on Medicare Advantage payments, policymakers could make changes to the maximum amount the federal government is willing to pay Medicare Advantage plans, also known as benchmarks. One approach is an across-the-board reduction in benchmarks, such as the “discount rate” proposed by MedPAC. This would account for Medicare Advantage enrollees having lower expected health care spending, before any effects of Medicare Advantage plan design, than traditional Medicare beneficiaries with similar risk profiles, on which current benchmarks are based. Other options include expanding the sources of data used in the risk adjustment model to predict a Medicare Advantage enrollee’s costs, such as prescription drug claims, clinical data from electronic health records, or certain measures currently included in the Consumer Assessment of Healthcare Providers and Systems (CAHPS) (see for example, a recent proof-of-concept study). These measures could be applied on equal footing between Medicare Advantage and traditional Medicare, and among different Medicare Advantage plans. In addition, two-sided reinsurance, which would provide additional payments to insurers with enrollees who have extremely high and unexpected costs and require insurers with enrollees with substantially lower than predicted spending to make payments into the program, could be added to the Medicare Advantage payment system. That would reduce the financial rewards for attracting enrollees who use substantially fewer health care services and protect insurers against the financial costs of enrollees who use substantially more health care services.

This work was supported in part by Arnold Ventures. KFF maintains full editorial control over all of its policy analysis, polling, and journalism activities.

Medicare Will Spend More Than $13 Billion on the Medicare Advantage Quality Bonus Program in 2026

Published: Jul 1, 2026

The Medicare Advantage quality bonus program, established by the Affordable Care Act, increases Medicare payments to Medicare Advantage plans that qualify by having a star rating of 4 or above (on a five-star rating system). (See the KFF brief on Medicare Advantage payments for more detail.) Plans may, but are not required to, use the increase in payments to cover the cost of supplemental benefits, including reduced cost sharing, extra benefits not covered by traditional Medicare (e.g., vision, hearing and dental), lowering Part B premiums, and/or subsidizing Part D prescription drug coverage. The star ratings are intended to help consumers make informed decisions when choosing among Medicare Advantage plans and the potential for additional funding is intended to encourage plans to improve quality. However, the Medicare Payment Advisory Commission (MedPAC) and others have suggested that the star ratings incorporate too many measures, do not adequately account for social risk factors, and may not be a useful indicator of quality because star ratings are reported at the contract rather than the plan level. Medicare Advantage contracts typically include multiple plans, which may have different benefits, costs, networks, service areas, and enroll different populations (i.e., plans that are open for general enrollment and special needs plans that limit enrollment to dual-eligible individuals).

Critiques of the quality bonus program have led to calls to replace, reform or end the program. In 2018, the Congressional Budget Office estimated that eliminating the quality bonus program would lower federal spending by almost $100 billion over ten years. Given the sharp increase in both actual and projected Medicare Advantage enrollment since CBO’s analysis, the savings from eliminating the quality bonus program could be substantially higher. For example, 35 million people are enrolled in Medicare Advantage in 2026, which is 5 million more than CBO projected at the time of the analysis. The degree to which changes to the quality bonus program would impact plan quality or the availability of supplemental benefits would depend on the specifics of any proposal and how insurers modified plan offerings in response.

Recently, the Centers for Medicare & Medicaid Services (CMS) finalized changes to the star ratings system (effective for 2029 star ratings, based on the 2027 plan year performance) that include removing several administrative measures and others that CMS stated no longer meaningfully differentiate plan quality. Though this change is a step toward simplifying the quality measurement system, because it is not combined with other changes to the Medicare Advantage payment system, the change is projected to increase Medicare Advantage spending by $18.6 billion over the next 10 years. That increase in spending is in part because more Medicare Advantage plans are expected to qualify for a payment increase under the quality bonus program as a result of the changes.

This analysis examines trends in Medicare spending resulting from the quality bonus program, enrollment in plans in bonus status (plans that qualify for a benchmark increase based on their quality star rating), and how these measures vary across plan types and insurers using publicly available information on Medicare Advantage enrollment, payment rates, and quality ratings (see methods).

Key Takeaways:

  • Federal spending related to the Medicare Advantage quality bonus program will reach at least $13.4 billion in 2026, somewhat more than in 2025 ($12.7 billion), and more than four times higher than in 2015.
  • More than two-thirds of Medicare Advantage enrollees (68%) are in plans that qualify for the quality bonus program in 2026, a decline from 75% in 2025, and the lowest share since 2018.
  • The average increase in payment per enrollee because of the quality bonus program is highest for employer- and union-sponsored Medicare Advantage plans ($466) and lowest for special needs plans ($318).  
  • Medicare spending under the quality bonus program varies across firms with UnitedHealth Group receiving the largest increase in payments ($3.9 billion) because of the quality bonus program (relative to what payments would have been otherwise) and Kaiser Foundation Health Plans receiving the largest increase in payments per person ($577). The variation is largely due to the share of enrollees in plans that qualify for increases under the quality bonus program but also relates to the average star ratings of plans that qualify.

Medicare will spend more than $13 billion on the Medicare Advantage quality bonus program in 2026.

Estimated federal spending on the Medicare Advantage quality bonus program will total at least $13.4 billion in 2026, somewhat more than 2025 ($12.7 billion). Spending on the quality bonus program has increased sharply since the program started, more than quadrupling from $3.0 billion in 2015 to $13.4 billion in 2026 (Figure 1). Total spending on the quality bonus program is 2.3% of the projected payments to Medicare Advantage plans in 2026 ($574 billion).

Total Medicare Spending Under the Medicare Advantage Quality Bonus Program Will Increase to Over  Billion in 2026 (Column Chart)

These estimates are a lower bound because they assume that, on average, Medicare beneficiaries enrolled in each plan that qualifies for additional payments under the quality bonus program are of average health status as measured by their risk score (that is, having a risk score equal to 1). However, increased coding intensity in Medicare Advantage suggests the risk scores are likely higher, which would increase the additional payments. For example, MedPAC estimates the increase to risk-adjusted benchmarks under the quality bonus program will add about $16 billion in Medicare spending in 2026. The estimates also do not include additional Medicare spending that results if plans increase their bids when their benchmark is higher because of being in bonus status (See Box 1 for more detail on star ratings and Medicare Advantage payments). For example, a plan might increase its bid to increase payments to providers, add more expensive providers to its network, or retain a larger amount as profit, provided they meet medical loss ratio requirements. (The medical loss ratio is the share of premium revenues going to pay for claims versus administrative overhead and profit.)   

Medicare spending under the quality bonus program has grown faster than enrollment in Medicare Advantage, which has doubled since 2015. This spending comes at a time when the Medicare program is facing growing fiscal pressures. Medicare Advantage benchmarks (and corresponding spending) grew faster than traditional Medicare spending between 2017 and 2024 in part because of the increase in spending under the quality bonus program. The quality bonus program also exacerbates the impact of higher coding intensity and favorable selection in Medicare Advantage, which together add $76 billion to Medicare spending in 2026. (Note, the higher spending under the quality bonus program is not additive to the $76 billion.)

More than two-thirds of Medicare Advantage enrollees (68%) are in plans that qualify for the quality bonus program.

In 2026, nearly 24 million people, or 68% of Medicare Advantage enrollees, are in plans that qualify for higher payments under the quality bonus program. That compares to just under 9 million people (55%) in 2015 (Figure 2). Both the number and share of enrollees in plans that receive bonuses in 2026 declined from the previous year (26 million or 75% of Medicare Advantage enrollees) and is the lowest share since 2018. That is a result of changes to the cut points, or scores plans are required to achieve to get higher quality ratings, values that CMS recalculates every year. In particular, substantially fewer Medicare Advantage contracts achieved at least a 4-star rating in 2026 compared to the previous year (209 vs 261). Star ratings are based on a Medicare Advantage contract’s performance on about 40 different measures, such as the share of enrollees that receive certain cancer screenings and annual flu vaccinations, whether people with chronic conditions are getting recommended services, enrollees’ ratings of their health plan, and customer service. For each measure, CMS establishes “cut points”, which are used to assign a rating between one and five stars for that measure. These are then combined into an overall rating for the Medicare Advantage contract. 

More Than Two-Thirds of Medicare Advantage Enrollees (68%) are in Plans That Qualify for Bonuses in 2026, a Somewhat Smaller Share Than in 2025 (Stacked column chart)

The average annual increase in payments per person under the quality bonus program are highest for employer- and union-sponsored plans.

Employer- and union- sponsored Medicare Advantage plans account for a larger share of spending under the quality bonus program (20%, or $2.6 billion) than enrollment in Medicare Advantage (16%) (Appendix Table 1). Consistent with this, and similar to previous years, the average increase in payments per person as a result of the quality bonus program to group employer- and union-sponsored plans ($466) are higher than for individual ($381) or special needs plans ($318) (Figure 3).     

Annual Increase in Payments Per Person Under the Medicare Advantage Quality Bonus Program are Highest for Employer Plans (Line chart)

The increase in payments per enrollee stemming from the quality bonus program are higher for employer- and union-sponsored plans because these plans have higher average star ratings, resulting in a larger share of enrollees receiving coverage from plans that qualify for bonuses. Across the entire period of 2015 to 2026, the share of all enrollees in employer- or union-sponsored plans that qualified for the quality bonus program never dropped below 80%. In contrast, the share of enrollees in individual and special needs plans that qualified for the quality bonus program exceeded 80% in only one year – 2023 (Figure 4).

The Share of Enrollees in Medicare Advantage Plans Sponsored by Employers That Qualified for the Quality Bonus Program has Exceeded 80% Since 2015 (Line chart)

Special needs plans serve higher need beneficiaries, including people who are dually eligible for Medicare and Medicaid and people who require an institutional level of care. Despite critiques of the quality star rating system, lower star ratings for special needs plans, on average, raise questions about how well these plans are serving the needs of their enrollees. The higher share of employer- and union-sponsored plans that qualify for the quality bonus program also raises questions about whether these plans, which are restricted to retirees of specific employers or unions, include more generous coverage or extra benefits. However, gaps in Medicare Advantage data, including the lack of information about the costs and benefits of employer- and union-sponsored plans, mean it is difficult to examine these questions.

Total Medicare spending under the quality bonus program varies across Medicare Advantage parent organizations.

UnitedHealth Group enrolls just over one-quarter (26%) of Medicare Advantage enrollees and is expected to receive 29% of total Medicare spending under the quality bonus program, or $3.9 billion dollars in 2026 (Figure 5). Humana Inc., which has the second largest share of Medicare Advantage enrollment (20%), will receive a disproportionately smaller share of bonus spending (11%), or $1.5 billion in 2026. Humana’s average star rating dropped considerably for the 2025 plan year (which is the year used for 2026 bonus eligibility), after the star rating for one of its largest contracts dropped from 4.5 to 3.5. Humana sued CMS over the change, but to date, the courts have sided with the Administration. In recent years, Medicare Advantage insurers have increasingly challenged the star ratings calculations, and have prevailed in a handful of cases, prompting CMS to recalculate the ratings on occasion. For example, in response to a decision following a legal challenge from Clover Health, CMS announced it will recalculate the 2026 star ratings for all plans (which will affect the 2027 payment year), though only plans that see an increase in star ratings as a result of the recalculation will have their ratings changed.

The average increase in payments per enrollee under the quality bonus program ranges from $23 for people in Centene Corporation plans to $577 for those in plans sponsored by Kaiser Foundation Health Plans. The variation in total bonus spending across firms corresponds to differences in the share of enrollees in plans that are eligible for the quality bonus program, which is based on the ratings of those plans. Virtually all of the more than 2 million enrollees in a plans sponsored by Kaiser Foundation Health Plans (100%) are in a plan that receives increased payments under the quality bonus program because it has a quality rating of at least four stars, while just 6% of Centene’s 938,000 Medicare Advantage enrollees are in a plan that receives bonus payments in 2026. The only Centene sponsored Medicare Advantage contracts that qualify for the quality bonus program payments in 2026 are those that are too new or have too low enrollment to receive star ratings. Differences also reflect variation in the star ratings of plans that qualify for the quality bonus program, because plans with at least 4.5 stars get a larger increase.

Total Medicare Spending Under the Quality Bonus Program Varies Across Medicare Advantage Parent Organizations (Table)

Box 1. Medicare Advantage Star Ratings

A key feature of the quality bonus program is the star rating system. Star ratings are used to determine two parts of a Medicare Advantage plan’s payment: (1) whether the plan is eligible for a bonus, and (2) the portion of the difference between the benchmark and the plan’s bid that is paid to the plan. The benchmark is the maximum amount the federal government will pay for a Medicare Advantage enrollee and is a percentage of estimated spending in traditional Medicare in the same county, ranging from 95 percent in high-cost counties to 115 percent in low-cost counties. The bid is the plan’s estimated cost for providing services covered under Medicare Parts A and B.

Since 2015, plans that receive at least four (out of five) stars have their benchmark increased. For most plans in bonus status, the benchmark is increased by five percentage points. Plans in “double bonus” counties – defined as urban counties with low traditional Medicare spending and historically high Medicare Advantage enrollment—have their benchmark increased by 10 percentage points. In addition, the benchmarks for plans without ratings due to low enrollment or being too new are increased by 3.5 percentage points. The benchmarks are capped and cannot be higher than they would have been prior to the ACA. This can result in plans that are eligible under the quality bonus program receiving a smaller increase to their benchmark, or in some cases, no increase at all.

The benchmark increases under the quality bonus program for qualifying plans mean that per enrollee payments are higher than if the plan did not qualify. There is no separate bonus payment. Rather, the bid and/or rebate components of the payment are higher.

This work was supported in part by Arnold Ventures. KFF maintains full editorial control over all of its policy analysis, polling, and journalism activities.

This work was supported in part by Arnold Ventures. KFF maintains full editorial control over all of its policy analysis, polling, and journalism activities.

Appendix

Total Medicare Spending Under the Quality Bonus Program by Type of Medicare Advantage Plan, 2015 - 2026 (Table)
Average Annual Increase in Payment Per Enrollee Under the Quality Bonus Program by Medicare Advantage Plan Type, 2015 - 2026 (Table)

Methods

This analysis uses data from the Centers for Medicare & Medicaid Services (CMS) Medicare Advantage Enrollment, Crosswalk and Landscape files for the respective year.This analysis includes HMO, POS, local PPO, regional PPO, and PFFS plans. Enrollment counts in publications by firms operating in the Medicare Advantage market, such as company financial statements, might differ from KFF estimates due to inclusion or exclusion of certain plan types, such as SNPs or employer plans.To calculate federal spending on the quality bonus program, we first obtained information on star ratings from the Part C and Part D Performance Data, Star Ratings Data Table for the previous plan year. These are the ratings on which a plan’s benchmark is based. We then determined each plan’s benchmark using these data and information from the Medicare Advantage Rate Book, Rate Calculation Data, which provides the benchmark by county for plans with a 5%, 3.5% and 0% bonus. A plan’s increase in payment per enrollee under the quality bonus program is equal to the difference between its quality adjusted benchmark (either the 5% or 3.5% bonus rate) and the benchmark if the plan was not in bonus (0% bonus rate), multiplied by the relevant percentage based on its star rating and year (for example, 65% for plans with 4 stars and 70% for plans with at least 4.5 stars in 2026). The increase per enrollee is multiplied by enrollees in March of each year to get total spending. Actual bonus spending will depend on the risk scores of Medicare Advantage enrollees. According to the plan payment data release by CMS, the average risk score of MA enrollees was above 1 for every year from 2015 through 2024 (the most recent year for which data are available), meaning our estimates likely understate actual spending.

HHS Public Health Policy Actions Under the Trump Administration 2025-2026

Published: Jun 30, 2026

Note: Originally published on Nov. 12, 2025, this resource is updated as needed, most recently on June 30, 2026, to reflect additional developments. 

Since assuming office for a second term, President Trump and officials in his administration have instituted numerous policy actions through the Department of Health and Human Services (HHS) affecting public health in the U.S. This resource lists and briefly describes key actions in the order in which they were first issued, reported or announced, with subsequent linked actions and related outcomes also included with each entry. As new policy changes occur, they will be added. 

This resource is not meant to be exhaustive of all administration actions related to public health, as many other federal policy changes – including outside of HHS – have public health implications but are not captured here.

Additional KFF resources on administrative actions related to global health, LGBTQ+ health, and mental health and substance abuse are also available.

Date

|

Action/Description

January 20, 2025Presidential Executive Orders precipitate removal of some HHS websites and health data.
– In the first days of his second term President Trump issued a number of Executive Orders (EOs), including EOs that revoked many Biden administration orders and programs, and instituted new federal guidance related to “gender ideology,” “diversity, equity, and inclusion (DEI),” and “merit-based opportunities.” These EOs have implications for public health, particularly related to the collection and presentation of data and websites by the federal government. For example, in response to the EOs, HHS began to remove thousands of websites and numerous federal databases with public health information deemed to be related to DEI, LGBTQ, reproductive health, HIV/AIDS research, health disparities, and more, and limited some data collection and analysis in these areas. A lawsuit was filed to reverse these removals, and some information has been restored over time. In September, the administration agreed to restore all previously removed health-focused websites and data to versions that had existed on January 29, 2025.
February 7, 2025NIH announces change to indirect cost rate guidance.
– As part of grants for health research, the National Institutes of Health (NIH) provides “indirect cost” funding to grant recipients, which supports administration and facilities costs at grantee institutions. On February 7, NIH announced it would apply a new 15% “standard indirect cost rate” on all grants, which would apply to any new grants and to existing grants for expenses as of February 10, 2025. This was challenged in federal court and federal judges placed holds on the policy, first through a temporary restraining order affecting 22 states on February 10, a nationwide preliminary injunction on March 5, and a permanent injunction on April 4; prior rates still apply for the time being. The administration appealed the ruling and legal proceedings continue. If implemented, a 15% indirect cost rate would be a much lower rate compared to historical NIH rates and would amount to a significant cut in funding for institutions performing NIH-sponsored health research.
February 13, 2025Robert F. Kennedy, Jr. confirmed as HHS Secretary under President Trump.
– The Senate voted 52-48, along party lines, to confirm Robert F. Kennedy, Jr. as the Secretary of Health and Human Services.
February 13, 2025President Trump issues Executive Order (EO) establishing MAHA policy agenda and MAHA Commission.
– The EO outlines the purpose and objectives of the Trump administration’s Make American Healthy Again (MAHA) efforts. Stating that the U.S. must “re-direct our national focus…toward understanding and drastically lowering chronic disease rates and ending childhood chronic disease,” it directs federal agencies to “aggressively combat” mental health disorders, obesity, diabetes, and other conditions. It also establishes the MAHA Commission to advise the President, naming Secretary Kennedy as Chair. The EO directs the Commission to submit an assessment on how to combat the “childhood chronic disease crisis” within 100 days, and a strategy to address the crisis within 180 days, setting in motion processes to develop further public health strategies and plans (discussed in other entries below). 
February 14, 2025White House, DOGE initiate “reduction in force (RIF)”, including for HHS personnel.
– The EO outlines the purpose and objectives of the Trump administration’s Make American Healthy Again (MAHA) efforts. Stating that the U.S. must “re-direct our national focus…toward understanding and drastically lowering chronic disease rates and ending childhood chronic disease,” it directs federal agencies to “aggressively combat” mental health disorders, obesity, diabetes, and other conditions. It also establishes the MAHA Commission to advise the President, naming Secretary Kennedy as Chair. The EO directs the Commission to submit an assessment on how to combat the “childhood chronic disease crisis” within 100 days, and a strategy to address the crisis within 180 days, setting in motion processes to develop further public health strategies and plans (discussed in other entries below). 
February 14, 2025President Trump issues Executive Order prohibiting federal funding to schools and universities with COVID-19 vaccine requirements.
– The EO requires HHS to work with the Department of Education to prohibit COVID-19 mandates in schools, by issuing guidelines for compliance and barring federal funds from going to any educational agency, K-12 school, or institution of higher education that requires COVID-19 vaccination to attend in-person education programs (educational vaccine mandates are set at the state level). Educational vaccine requirements are set at the state and local levels. At the time the EO was released in February, no state required K-12 students to be vaccinated against COVID-19 while 15 colleges required Covid vaccines for students. However, by March 14, 2025 all of those colleges had ended their COVID-19 vaccine requirements for students.
February 18, 2025Secretary Kennedy announces public health policy priorities during HHS welcome ceremony.
– In his first remarks to HHS staff, Secretary Kennedy announces the public health priorities for his tenure. This include investigating the childhood vaccine schedule, tackling corruption and promoting transparency, and addressing a “chronic disease epidemic” especially in children, which he says may be linked to pesticides, food additives, antidepressants, microplastics, cellphone emissions, and other factors.
February 28, 2025Secretary Kennedy issues new rule ending public comment requirement for HHS grants and contracts.
– The new rule rescinds a prior HHS policy on “Public Participation in Rule Making” (the “Richardson Waiver,” dating back to 1971) and “re-aligns the Department’s rule-making procedures with the Administrative Procedure Act.”  As a result, “matters relating to agency management or personnel or to public property, loans, grants, benefits, or contracts” are exempt from the notice and comment procedures. This removes what had been a key step in the rulemaking process requiring public notification and a comment period. For example, changes to HHS policies related to work requirements for Medicaid and NIH funding would no longer require public comments under the new rule. This could streamline implementation of HHS policy, but also reduce public visibility on changes before they take effect.  Some lawmakers and public health focused groups have asked HHS to return to the prior requirements under the Richardson Waiver. 
March 7, 2025HHS announces that CDC will conduct a study of factors contributing to the rise in autism in the U.S.
– In statements to the press, HHS officials indicate CDC will initiate a study looking at the factors that are contributing to the rise in autism diagnoses in the U.S.. To date, no new CDC study results on this topic have been released though in a related development, in September 2025 President Trump and HHS leadership announced at a press conference and through a White House Fact Sheet that they believe there is a link between acetaminophen (e.g., Tylenol) use in pregnancy to autism (further details provided below). President Trump and Secretary Kennedy both have a history of linking vaccines and autism, even though there is no evidence of such a link.
March 13, 2025Food and Drug Administration (FDA) releases guidance on 2025-2026 influenza vaccine composition.
– The FDA guidance identifies which influenza virus strains manufacturers should use as components of 2025-2026 influenza vaccines. To develop these recommendations, FDA convened meetings of federal scientific and public health experts, including from FDA, CDC, and Department of Defense, but did not consult with the FDA’s Vaccines and Related Biological Products Advisory Committee (VRBPAC) or other professional groups outside the government. FDA had canceled the scheduled VRBPAC meeting on this topic, and the lack of input from outside experts was a break from past years’ practices. In addition, in past years there was active participation and coordination between U.S. federal experts and global technical experts working under the auspices of the World Health Organization (WHO), but official communications with WHO-linked experts has been curtailed since the Trump administration announced in January 2025 that the U.S. was withdrawing its membership from the UN agency.
March 17, 2025NIH initiates termination of numerous grants for HIV prevention and treatment programs.
– The canceled NIH grants include support for researchers investigating use of PrEP, medication used pre-exposure to prevent HIV infections, and programs focused on HIV/AIDS in adolescents and young adults. Even as the first Trump administration supported HIV/AIDS prevention and treatment efforts, including through a highly visible federal effort to “end the HIV epidemic” in the U.S. by 2030, these same programs have now been targeted for cuts (further details below).   
March 17, 2025HHS removes Surgeon General warning declaring gun violence a public health crisis.
– The HHS website was changed, removing a 2024 advisory from the Surgeon General on the public health impacts of gun violence. In addition to removing the Surgeon General’s warning, the administration has rolled back a number of gun safety policies in place during the Biden administration. The White House Office of Gun Violence Prevention, established during the Biden administration was shut down in early 2025. Further, significant numbers of staff at CDC’s Injury Center, which collects data on violent deaths and injuries, and CDC’s Division of Violence Prevention have been let go as part of the Trump administration’s reduction in force efforts.
March 25, 2025HHS and CDC seek to pull back $11 billion in supplemental COVID-19 and public health funding from state and local health departments.
– In a statement, HHS says it intends to pull back $11.4 billion in supplemental funding that had been provided by Congress for state and local public health departments through CDC for pandemic response activities. Following the announcement, on April 1, a group of 23 mostly Democratic-led states sued the Trump administration over the attempt to pull back this funding.  On April 3, a federal judge placed a temporary block on the administration’s actions, and on May 16, another federal judge indefinitely blocked the administration from enacting its funding pull back for the states that are part of the lawsuit. As of late August 2025, almost 80% of the funds initially targeted for cuts by the Trump administration had been restored for the 23 states that won in court. However, funding has not been restored to the remaining states, the majority of which are Republican-led.
March 27, 2025HHS announces a major re-organization and job cuts plan.
– HHS announces plans for a major restructuring of the department, in accordance with President Trump’s February 26 EO on “Implementing the President’s ‘Department of Government Efficiency’ Workforce Optimization Initiative.” The announcement says HHS will create an Administration for a Healthy America (AHA), which would combine several existing HHS offices including the Office of the Assistant Secretary of Health (OASH, which contains the Surgeon General’s Office), the Health Research and Services Administration (HRSA), the Substance Abuse and Mental Health Services Administration (SAMSHA), the Agency for Toxic Substance and Disease Registry (ATSDR), and the National Institute for Occupational Safety and Health (NIOSH). In addition, the Administration for Strategic Preparedness and Response (ASPR) at HHS would be moved under CDC. The announcement also says HHS will reduce its workforce by eliminating 10,000 full-time positions. Combined with other reduction in force efforts, a total of 20,000 HHS workers are expected to lose their jobs.

On May 5, a coalition of 19 Democratic-led states and the District of Columbia filed a lawsuit against the mass firing of federal health workers and re-organization of HHS. On May 10, a court ordered a temporary pause on sweeping federal firings at HHS and other agencies. On July 1, a federal judge blocked mass firings at HHS, saying they are likely unlawful. However, on July 8 the Supreme Court overturned the lower court decisions, allowing the Trump administration to proceed with job cuts. As of August it is estimated that over 20,000 jobs at HHS have already been cut, meaning the administration already met its initial workforce reduction goal.

Regarding re-organization, some organizational changes have been implemented at HHS, with major cuts or closures to public health related offices such as the HHS Office of Infectious Diseases & HIV Policy, the HHS Office of Minority Health, and HRSA’s Bureau of Primary Health Care.  However, other proposals such as the formation of an Administration for a Healthy America (AHA), have not yet been implemented. Implementing AHA to the extent proposed is likely to require approval from Congress, though so far Congress has not acted on legislation codifying these proposals.
March 31, 2025HHS withholds portion of Title X family planning service grants. 
– HHS notifies one in five current grantees of the federal Title X family planning program that a portion of their funding would be temporarily withheld. This funding freeze affects all nine Planned Parenthood grantees, in addition to 7 other nonprofit grantees, and it is estimated that a total of 879 clinics (24% of all Title X clinics) in 23 states are affected. After several months, funds were reinstated to some organizations, but the Planned Parenthood grantees have still not had their funding reinstated.
April 1, 2025HHS ends federal support for the “Safe to Sleep” program, which focuses on prevention of infant deaths during sleep.
– The Trump Administration ends federal participation in Safe to Sleep, a national campaign that focused on educating parents of newborns about safer sleeping practices for infants that can prevent death. The program, supported through the NIH’s National Institute of Child Health and Human Development (NICHD) Office of Communications in recent years, had been in existence for over 30 years and had contributed to a major decline in sudden infant deaths. The NICHD office was eliminated on April 1, along with federal support for “Safe to Sleep.”
April 2, 2025HHS requires CDC to reduce contract spending by $2.9 billion as part of DOGE cost reduction efforts.
– According to reports, HHS orders CDC to reduce its contract spending by $2.9 billion by April 18.CDC contract funding has been used to support several services at the agency including security, cleaning, and computers/technology. The sudden requirement to cut this spending by approximately 35% affects CDC operations. 
April 7, 2025HHS Secretary Kennedy announces changes to fluoride policies.
– Secretary Kennedy announces a plan to implement a number of changes to federal policy related to water fluoridation, including stating that CDC will stop recommending water fluoridation as a public health intervention (though to date, HHS and CDC still recommend community water fluoridation). In addition, Kennedy says the defunct Community Preventive Services Task will be revived and reconvened, with a goal of studying and making recommendations about water fluoridation. Kennedy also called on states to ban fluoride in their drinking water. Already this year Utah and Florida have banned community water fluoridation, the first states ever to do so.
April 17, 2025FDA informs Pfizer/Moderna that mRNA COVID vaccines will require an expanded warning label about myocarditis.
– In letters sent April 17, the FDA informs Pfizer and Moderna they must alter the warning labels for their COVID-19 mRNA vaccines to include expanded risks for myocarditis and pericarditis. Previously, the warning labels for these vaccines noted risks for these conditions for those aged 18 to 24 years (Moderna) and 12 to 17 years (Pfizer). However, updated labels are required to include new language saying “the observed risk of myocarditis and pericarditis following vaccination with mRNA COVID-19 vaccines has been highest in males 12 through 24 years of age” and that “persistence of abnormal cardiac magnetic resonance imaging (CMR) findings that are a marker for myocardial injury was common.”  According to FDA, the labels must also include more information about these conditions and their health risks.  Since the letters were sent, the companies have complied with the new FDA requirements. FDA approved the updated label language on June 25.
April 22, 2025FDA and HHS announce measures to phase out use of petroleum-based food dyes.
– FDA and HHS announce a series of steps the federal government will take to remove petroleum-based synthetic dyes from the U.S. food supply. These actions include initiating a process to revoke federal authorization for two such dyes and planning phase-outs by the food industry for others. In addition, the government will support research on food additives and children’s health and authorize natural alternative coloring options. Under the current plan, the phase-outs will occur through voluntary action taken by food companies.
May 1, 2025HHS announces a $500 million investment in a “next generation universal vaccine platform.”
– HHS and NIH announce that $500 million in funding will be directed to a new effort  to develop a “universal vaccine platform for pandemic-prone viruses.” The platform uses inactivated whole viruses, and is part of a broader federal effort to develop universal vaccines called “Generation Gold Standard.” The funds for this new investment appear to be re-purposed vaccine development funds from the Biden Administration’s NextGen initiative to develop next generation COVID-19 vaccines.
May 2, 2025White House Releases FY 2026 President’s Budget Request calling for major fundings cuts at HHS.
– The White House released an outline of the administration’s budget request for FY2026 and on May 30, the White House submitted the full Budget Request for FY2026 to Congress. The request proposes steep cuts to the HHS budget, including cuts for CDC, HRSA, SAMHSA, NIH, eliminating the Hospital Preparedness Program at ASPR, and reducing funding and cutting some programs focused on HIV/AIDS research and response. The budget request also asks Congress for $500 million to support a new “Administration for a Healthy America (AHA)” and MAHA-related priorities. The President’s Budget Request is only a proposal, as it is Congress that ultimately decides how much money the federal government appropriates. So far, Congressional spending bills for FY2026 have not included cuts to HHS of the magnitude requested by the President, and Congress has not provided the requested $500 million for AHA though budget negotiations continue.   
May 5, 2025White House Executive Order restricts funding and increases oversight for “gain of function” research at HHS.
– In an EO titled “Improving the Safety and Security of Biological Research” the White House cites concerns with federally funded “gain-of-function” (GOF) research on biological agents and states the Biden administration allowed dangerous GOF research to occur without sufficient oversight. The EO directs the Secretary of HHS to coordinate with other relevant Executive branch offices to establish guidance to end federal funding of “foreign entities” where GOF is being undertaken or in countries lacking oversight of GOF research. The EO requires the relevant Executive offices to submit updated policies and guidance for all federally supported GOF-related research, and to develop a strategy for managing risks of non- federally funded GOF research. The full implications of the EO are not yet clear, as the Executive branch offices must develop and implement specific guidance and regulations. According to outside experts, potential benefits of the EO include more transparency and stricter enforcement of dangerous research, while potential risks include hindering beneficial research that is not GOF and researchers choosing to curtail beneficial research to avoid potential repercussions under evolving federal restrictions.
May 20, 2025FDA leaders announce clinical trials will be needed for approval of certain new COVID vaccine formulations.
– In a medical journal article, FDA leaders indicate that going forward, for federal approval of new or updated COVID-19 vaccines (“boosters”) for use in individuals who are not considered at higher risk (defined as persons 65 or older or those with certain health conditions), will require vaccine makers to present evidence from randomized, placebo-controlled trials that demonstrate safety and efficacy. The announced policy is a departure from prior years when FDA did not require new trial data to authorize or approve boosters, but instead allowed approvals based on immune response evidence. The new policy could hinder investments by pharmaceutical companies in developing new COVID vaccine formulations, given the greater expense and time required to conduct new, full clinical trials.
May 22, 2025MAHA Commission Report on childhood chronic disease published.
– The first official report from the MAHA Commission (established by the February 13 EO discussed above) discusses factors contributing to a “chronic disease crisis” for U.S. children and provides a “call to action”. The report highlights four main drivers of the crisis: poor diet (primarily due to consumption of ultra-processed foods), exposure to chemicals, lack of physical activity and chronic stress, and “overmedicalization (excessive use of prescription drugs, such as antidepressants). The report calls for federal agencies to “close critical research gaps and guide efforts to better combat” these issues. It also says the MAHA Commission will develop and release a strategy in August (discussed below). The report expanded on the ideas initially outlined in the February EO and provided more details on Secretary Kennedy’s priorities to address chronic disease in children. There was some criticism of the report after its publication, with experts questioning some of the evidence and conclusions and pointing out significant errors and studies cited that did not exist, which indicated that artificial intelligence was likely used to help write the report. 
May 23, 2025Administration ends NIH funding for several HIV vaccine research projects. 
– NIH notifies two grant recipients working on broadly neutralizing antibody research for HIV vaccines of the cancelation of their funding.  The canceled grants supported early-stage vaccine development research that uses a different approach than other HIV vaccine candidates. Some other HIV vaccine candidates remain in the development pipeline and clinical trials continue, but the absence of this early-stage research could jeopardize the development of additional candidates going forward.
May 27, 2025HHS Secretary Kennedy announces CDC will no longer recommend COVID vaccines for healthy pregnant women and children.
– In a video post on X, Secretary Kennedy announces “the COVID vaccine for healthy children and healthy pregnant women has been removed from the CDC recommended immunization schedule.” The announcement was a departure from the typical process for changing vaccine recommendations, which includes review and input from the Advisory Committee on Immunization Practices (ACIP) and a notification from the CDC Director. Initially, the implications of changing CDC guidance without ACIP input were unclear given that no-cost insurance coverage for vaccination is linked to ACIP and CDC recommendations. On May 30, CDC changed the language on its website for COVID-19 vaccines, removing its prior recommendation for pregnant women to be routinely vaccinated and stating that healthy children 6 months to 17 years old could be vaccinated in consultation with health care providers/parents – a recommendation known as “shared decision-making,” which would mean insurance would still have to cover such vaccinations. On July 7, a coalition of professional medical organizations filed a lawsuit against HHS over the new COVID-19 vaccine recommendations, saying the department did not follow federal procedures in making the change and also mislead the public on the issue (on January 6, 2026, a federal court confirmed these plaintiffs have standing to challenge HHS’s actions on the COVID-19 vaccine recommendations, allowing the case to proceed to arguments). On August 19, independent expert groups, including the AAP, issued their own recommendations for COVID vaccines in infants and young children in contrast with CDC’s new recommendations.  On Aug 22, ACOG issued their own recommendations for pregnant patients.
June 9, 2025HHS Secretary Kennedy announces removal of all sitting members of ACIP.  
– In a post on X and a subsequent HHS press notice, Secretary Kennedy announces that all 17 sitting members of the CDC’s Advisory Committee on Immunization Practices (ACIP) are dismissed, to be replaced with new members selected by the Secretary. Kennedy says the move is “prioritizing the restoration of public trust above any specific pro- or anti-vaccine agenda.” The HHS Secretary does have the discretion to remove and nominate ACIP members, though no previous Secretary has dismissed all ACIP members at once. In a subsequent X post on June 11, Kennedy announces the nomination of eight new members to ACIP, several of whom have been critical of COVID-19 vaccines and have expressed concerns about harms caused by vaccinations more generally. In a later press release from September 15, HHS announces five more members to be appointed to ACIP, including several with a history of criticism of COVID-19 vaccine policies. 
June 17, 2025FDA announces National Priority Vouchers for expedited regulatory review of new drugs that support “U.S. national interest.
– FDA announces a Commissioner’s National Priority Voucher (CNPV) program, which can be “redeemed by drug developers to participate in a novel priority program” that shortens regulatory review time from 10-12 months to 1-2 months. FDA says it will determine the availability of vouchers for companies that are aligned with the “national health priorities” of: addressing a health crisis in the U.S.; delivering more innovative cures for the American people; addressing unmet public health needs; and, increasing domestic drug manufacturing as a national security issue. On October 16, FDA announced the first nine CNPV recipients, and on November 6, announced six more recipients.  The impact of this new priority voucher program on speeding drug approvals and onshoring drug manufacturing capacity is as yet unclear. In addition, there are several other existing priority review processes at FDA so adding another could strain FDA staff capacity at the same time there has been significant reductions in FDA’s staff and budget.  These strains have already slowed FDA review times in general.
June 18, 2025FDA approves lenacapavir – a new HIV prevention drug.
– FDA approves Gilead Sciences’ lenacapavir, a new injectable PrEP drug that has been shown to be highly effective at preventing HIV infection, and which requires just one dose every 6 months, making it the first ever twice-a-year drug option for HIV prevention. In September, CDC issued clinical guidance for use of injectable lenacapavir as PrEP, though that guidance did not include reference to transgender people, a group intentionally included in the clinical trials and at increased risk of HIV. FDA’s approval also precipitated a review by the World Health Organization (WHO) and on October 6, WHO pre-qualified lenacapavir for prevention of HIV. WHO pre-qualification can speed regulatory approval for the drug in many low- and middle-income countries with a high burden of HIV/AIDS and can also allow for global health mechanisms like the Global Fund to Fight AIDS, Tuberculosis and Malaria to procure the drug.
June 25-26, 2025The newly reconstituted ACIP makes recommendations and policy changes related to RSV and influenza vaccines, and designates new workgroups on hepatitis B, MMRV, and the childhood immunization schedule.
– ACIP votes to recommend respiratory syncytial virus (RSV) injections for babies and RSV vaccine for people 50 and older, and a ban on the use of thimerosal in multi-dose influenza vaccine vials. ACIP also agrees to stand up three new workgroups that will review the U.S. childhood vaccination schedule, hepatitis B guidance, and combination MMRV vaccine.  Subsequently, on July 3, CDC issued new RSV guidance that mirrored ACIP recommendations. On July 23, Secretary Kennedy enacted ACIP’s recommendation on thimerosal, rescinding federal recommendations for any influenza vaccines containing thimerosal (a change that only affects a very small percentage of the overall influenza vaccine market that is comprised of multidose vials).
July 1, 2025HHS alters program requirements and withholds funding from sex education and teen pregnancy prevention programs.
– HHS notifies all Teen Pregnancy Prevention (TPP) program grantees and Personal Responsibility Education Program (PREP) grantees in 46 states and territories that their material must align with President Trump’s executive orders, including those that ban the promotion of gender inclusivity, risk losing federal funding. TPP is a national grant program that funds grantees to replicate, develop, test, and evaluate evidence-based approaches to prevent teen pregnancy, while PREP awards grants to state agencies to use evidence-based models in educating adolescents on both abstinence and contraception. In August, the Trump administration cancelled a $12.3 million PREP grant to California after state officials refused to revise curricula in compliance with the EOs. In September 2025, 16 states and D.C. sued HHS alleging that the new PREP grant conditions are unlawful, unconstitutional, and harmful to gender diverse youth. Similarly, a federal judge blocked the HHS policy changes for TPP in October 2025.
July 2, 2025CDC deactivates its emergency response for H5N1 influenza (bird flu) and limits tracking and reporting of data on bird flu infections in humans and animals.
– CDC ends its emergency response for H5N1 bird flu in the U.S., which had been active since April 4, 2024. CDC reports the change is due to a decline in animal infections and no reports of human cases since February 2025. CDC also says data on the number of people tested for H5N1 will be reported only monthly, and no further data on infection rates in animals will be reported on the CDC website. Even so, reporting from states showed the number of H5N1 cases in birds, which had declined over the summer, began to increase again in fall 2025. However, much of the federal research and response efforts for H5N1 have been closed down or significantly limited following funding and staff cuts and a prolonged government shutdown. The limited federal tracking and reporting of H5N1 infections can slow identification of outbreaks and potentially slow response times.
July 9, 2025HHS Secretary Kennedy cancels a scheduled meeting of the U.S. Preventive Services Task Force (USPSTF).
– Secretary Kennedy cancels a meeting of the USPSTF several days before it was scheduled to take place, with no reason given and no re-scheduled meeting date provided. Typically, the task force meets three times a year, though no meeting has yet occurred under Secretary Kennedy. USPSTF is responsible for reviewing and recommending preventive health services. USPSTF recommendations have implications for what services insurers must cover with no cost-sharing, under the Affordable Care Act (ACA). Such services can include screening tests, behavioral counseling, and medications that can prevent diseases and illness (other than vaccines, which are tied to ACIP recommendations). However, along with other parts of the ACA, USPSTF has faced court challenges. On June 27 (prior to Kennedy’s cancelation of the meeting), while the Supreme Court ruled the ACA requirement that insurers cover USPSTF-recommended services is indeed constitutional, it also found that the HHS Secretary has the power to add and remove USPSTF members at will, which underscores the possibility that Secretary Kennedy may choose to dismiss some or all of the existing USPSTF members and appoint new members (as Kennedy has done with ACIP), or simply not name any new members, and has the power to choose not to adopt USPSTF recommendations. In light of Kennedy’s cancellation and the Supreme Court ruling, 104 public health focused organizations called on Congress to “protect the integrity of the USPSTF” through legislative action. The subsequent USPSTF meeting was scheduled to occur in November but that was also canceled, with HHS citing the government shutdown as the reason. 
July 31, 2025FDA announces new safety label requirement for opioid pain medications.
– The FDA says will require safety labels on opioid medications so that users can better understand that risks of long-term opioid use. The updated labels should include a summary on the risk of addiction, misuse, and overdose, treatment guidance and the risk of higher doses, how to safely discontinue opioid use, drug interactions, digestive complications, and overdose reversal medications. Drug companies received notification letters and have 30 days to submit updated labels for review.
July 31, 2025HHS Secretary Kennedy swears in Susan Monarez as CDC Director.
– In a statement welcoming the newly Senate-confirmed CDC Director, Secretary Kennedy says Monarez has “unimpeachable scientific credentials” and he has “full confidence in her ability to restore the CDC’s role as the most trusted authority in public health.” However, 28 days later (on August 27) the White House removed Monarez from her position at CDC. According to Kennedy, she was removed because he lost trust in her ability to serve as CDC Director and to implement the policies of the Trump Administration. According to Monarez, she was removed because she would not provide “blanket approval” for vaccine policy changes in advance and would not fire, as requested by Kennedy, CDC employees without cause. On August 28, Secretary Kennedy announced in a letter to CDC staff that Deputy Health and Human Services Secretary Jim O’Neill would serve as acting CDC Director.
August 1, 2025Newly announced CDC policy prevents outside professional medical and public health organizations from participating in working group meetings of ACIP.
– Officials at HHS notify professional medical organizations such as the American Academy of Pediatrics (AAP), the American Medical Association (AMA), the American College of Obstetricians and Gynecologists (ACOG), and others that they will be excluded from joining ACIP working group discussions going forward. Professional groups representing medical doctors and other stakeholders in vaccine policies have long participated as non-voting members, including in ACIP working groups. Working groups are typically responsible for helping review available data about topics prior to ACIP meetings, and helping develop recommendation language for ACIP to vote on, as well as other activities in support of ACIP. While the outside groups can be present and can participate in full ACIP meetings, the new policy removes them from providing any input through working groups.
August 5, 2025HHS announces a “coordinated wind down” of $500 million in federal funding for mRNA vaccine research
– HHS announces that it will cancel and begin to wind down mRNA vaccine development activities funded through the Biomedical Advanced Research and Development Authority (BARDA). In total, HHS reports it is canceling 22 projects worth nearly $500 million because “these vaccines fail to protect effectively against upper respiratory infections like COVID and flu…Going forward, BARDA will focus on platforms with stronger safety records and transparent clinical and manufacturing data practices.”  mRNA COVID-19 vaccines are effective in preventing severe illness and death from the disease, and mRNA vaccine technology has potential applications for other infectious diseases, as well as chronic diseases like cancer. The cancellation removes the bulk of U.S. federal funding for mRNA research, leaving questions about future progress by the U.S. in this area of vaccine technology.
August 15, 2025HHS reinstates the defunct Task Force on Safer Childhood Vaccines.
– The original Task Force on Safer Childhood Vaccines, a federal panel created by Congress in 1986 “to improve the safety, quality, and oversight of vaccines” was disbanded in 1998, but HHS announces that the group will be re-instated at NIH with participation from officials at FDA, CDC, and other government agencies. The goal of the reconstituted Task Force will be “the development, promotion, and refinement of childhood vaccines that result in fewer and less serious adverse reactions than those vaccines currently on the market, and improvements in vaccine development, production, distribution, and adverse reaction reporting” to help increase federal oversight and investigation of vaccine injuries.  The Task Force will come together to develop recommendations to be submitted to Congress within two years, with updates every two years after. Reinstatement of this panel has been a goal of anti-vaccine advocates for years, including the Children’s Health Defense, the anti-vaccine organization Secretary Kennedy founded, which supported a lawsuit earlier in 2025 against Kennedy that sought to require him to reconvene the Task Force.
August 27, 2025FDA approves COVID-19 vaccines for 2025-2026, while limiting scope of approval to certain ages and risk profiles.
– FDA approves updated COVID-19 vaccines for 2025-2026, but also limited the approval to persons 65 and older and those between 18 and 64 with a health condition that puts them at higher risk for severe disease. Previously, the FDA had approved the use of vaccines for all ages (over 6 months) regardless of risk profile.
September 9, 2025MAHA Commission releases strategy to address childhood chronic disease.
– A new MAHA Commission strategy document outlines actions the federal government is taking or plans to take to address childhood chronic disease in the U.S. These include “more than 120 initiatives” that together represent “the most ambitious national effort ever to confront childhood chronic disease,” and which outline a “blueprint for the entire government” to address chronic disease. Elements of the strategy include: changing federal science and research priorities, reforming dietary guidelines, changing nutrition and food regulations through reducing additives and ultra-processed foods, and improving effort to raise public awareness about chronic disease. The strategy highlights the risks of vaccine injuries, fluoride in drinking water, among many other areas.
September 18, 2025Secretary Kennedy renews the declaration of the national opioid crisis as a public health emergency.
– In a declaration on an HHS website, Secretary Kennedy renews the declaration of the opioid crisis as a national public health emergency (PHE).  The opioid crisis was initially declared a public health emergency in 2017; renewal is required every 90 days to continue the PHE.
September 19, 2025Secretary Kennedy announces that the FDA will launch a new review of mifepristone.
– Secretary Kennedy announced that the FDA will undergo a review of the current Risk Evaluation and Mitigation Strategy (REMS) for mifepristone, due to new evidence including an April 2025 report from the Ethics and Public Policy Center (EPPC) which claims that mifepristone has a higher rate of adverse events than previously reported. This report has drawn criticism due to methodological flaws and lack of transparency regarding its data sources.
September 19, 2025ACIP makes several new recommendations related to MMRV and COVID-19 vaccines
– In its September 18-19 meeting, ACIP members vote on several new recommendations including to no longer recommend the combination MMRV (measles, mumps, rubella, and varicella) vaccine for children under the age of 4 and instead to recommend that children in this age group receive measles, mumps, and rubella (MMR) vaccine separately from the varicella vaccine (V). In addition, ACIP members vote to change what had been a universal COVID-19 vaccine recommendation (except for HHS’ recent change for healthy children and pregnant women) to “shared clinical decision-making”, including for those 65 and older, along with a recommendation for new language on risk-benefit for COVID-19 vaccinations. ACIP’s recommendations were adopted by CDC on October 6. While the separate MMR+V vaccines had been recommended as preferred by the CDC for many years, the combination MMRV provided an option for parents to reduce the number of injections their children receive. Now, insurers will no longer be required to cover this vaccine at no-cost. The new COVID-19 vaccine recommendations mean people of all age groups are now recommended to have an interaction with a health care provider (which could include a doctor, nurse, or pharmacist) to determine whether getting a COVID-19 vaccination is recommended for them. If that determination is made, insurers must cover the vaccine at no-cost, although it is possible that some consumers may face challenges in accessing providers in the first place or demonstrating that they have consulted with a medical provider seeking vaccination in some cases.    
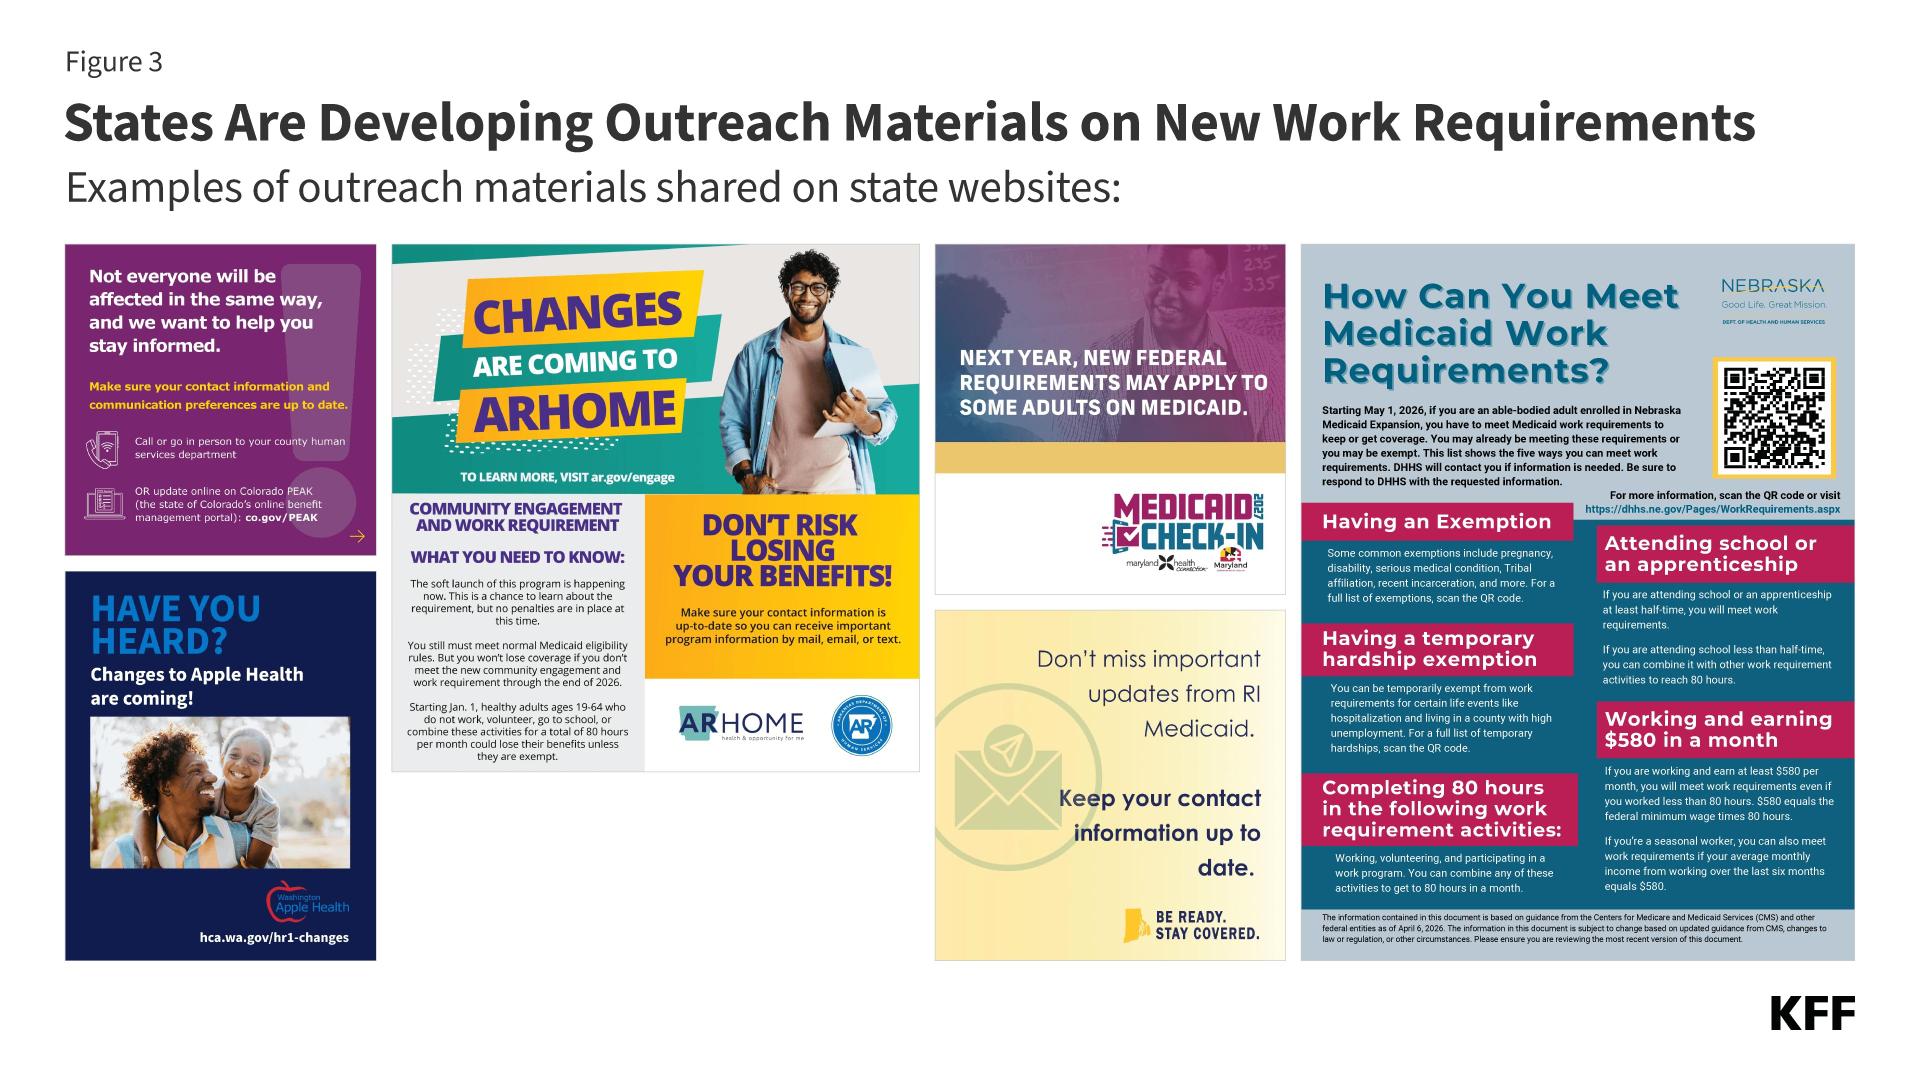
September 22, 2025President Trump and Secretary Kennedy announce new actions to address autism spectrum disorder in the U.S.
– In a press conference and via an HHS press statement and Fact Sheet, President Trump and HHS Secretary announce several actions to address the issue of autism spectrum disorder (ASD) in the U.S. This includes FDA authorization for leucovorin, a treatment option for some children with autism, a regulatory change that will allow state Medicaid programs to newly cover leucovorin for the indication of ASD. President Trump and Secretary Kennedy also highlight what they say are risks of acetaminophen use during pregnancy and association with autism. The press release notes “HHS wants to encourage clinicians to exercise their best judgment in use of acetaminophen for fevers and pain in pregnancy by prescribing the lowest effective dose for the shortest duration when treatment is required.”  In his remarks, President Trump also implicated childhood vaccines as a potential risk factor for autism, though no new evidence was presented and that link has already been repeatedly and conclusively ruled out. In a subsequent press statement on September 22, HHS announced FDA was initiating a labeling change for leucovorin, and a safety label change for acetaminophen to include information about the “potential risks of acetaminophen so patients can make a more informed decision.” Public health groups and experts criticized the conclusions linking acetaminophen use in pregnancy and autism, and expressed doubts about leucovorin as a treatment for autism. President Trump’s remarks also precipitated a lawsuit filed on October 28 in Texas against the maker of Tylenol.
September 30, 2025FDA approves a new generic mifepristone product.
– The FDA approved Evita’s Solutions application for a generic version of mifepristone.   The approval included a reminder that the generic mifepristone is subject to the same  Risk Evaluation and Mitigation Strategy (REMS) as the brand-name.
September 30, 2025HHS awards $60 million in grants to support prevention of falls and related programs for older adults and those with disabilities.
– Secretary Kennedy announced 59 new grants totaling $60 million is being awarded to states, territories, tribes, and local organizations supporting older adults and Americans with disabilities, including programs for “preventing falls among seniors, managing chronic conditions…and funding dementia-capable programs.”
October 10, 2025Trump Administration fires thousands of HHS employees, including hundreds at CDC, during federal government shutdown.
– In the midst of a government shutdown and an ongoing federal funding impasse in Congress, the White House Office of Personnel and Management says over 4,000 federal workers are to be fired. At HHS, over a thousand workers are notified that they have lost their jobs, with most of those losses concentrated at CDC. Some of those job losses were reversed over the next few days, with HHS officials stating some notices were sent in error. Even so, as of October 14 it is estimated that about 600 CDC employees remain fired, including staff in areas such as injury prevention, health statistics, and Congressional relations. There is a question about whether such firings during a government shutdown are legal, and groups representing federal workers have filed lawsuits to halt these mass layoffs.
October 31, 2025FDA announces new restrictions on ingestible fluoride products for children.
– FDA announces new enforcement actions “to restrict the sale of unapproved ingestible fluoride products for children” and sends letters to health care professionals warning about the risks associated with these products. The actions come after FDA conducted a review and published a scientific evaluation of these products. In the announcement. FDA says it will be developing a “fluoride research agenda” and “the first national oral health strategy” for the U.S. in partnership with NIH and other HHS agencies.
November 10, 2025FDA announces a warning label change on hormone replacement therapy (HRT) products for addressing symptoms of menopause.
– In a press release, a fact sheet, and a live press event, FDA leaders announce that they will initiate the removal of broad “black box” warnings from HRT products for menopause. The FDA also announces approvals for two new drugs for menopausal symptoms. According to the FDA, women have been “under-utilizing approved therapies” since the “black box” warnings about risks associated with the drugs were placed on these products over 20 years ago. Labels will be rewritten with guidance saying that there are long-term health benefits if HRT is begun within 10 years of the onset of menopause.
November 19, 2025CDC changes language on its website to say a link between vaccines and autism cannot be ruled out.
– A CDC website providing information to the public on Autism and Vaccines, is changed to include language saying “studies have not ruled out the possibility that infant vaccines cause autism.” The new site also discusses the “state of the evidence” on common childhood vaccines and supposed links to autism. The new language is a reversal from previous CDC statements saying “vaccines do not cause autism,” and contradicts the long established scientific consensus that there is no link between vaccines and autism. The new CDC webpage language has been criticized by professional medical organizations such as the American Medical Association and the American Academy of Pediatrics, as well as autism organizations such as Autism Speaks and the Autism Science Foundation.
November 21, 2025CDC staff ordered to end all monkey research programs, potentially affecting development of prevention tools for HIV and other infectious diseases.
– According to reports, CDC staff are ordered to halt its monkey research program by the end of 2025. This program has helped develop HIV prevention tools such as pre-exposure prophylaxis (PrEP) and microbicides, as well supported prevention research for other infectious diseases.
November 28, 2025Internal FDA communication proposes stricter federal requirements for testing and approving vaccines.
– According to reports, the head of FDA’s Center for Biologics Evaluation and Research (CBER), which is responsible for regulating vaccines, issues an email to staff proposing new, stricter federal requirements for vaccine testing, evidence, and approval. The email states that in the future FDA will “demand pre-market randomized trials assessing clinical endpoints for most new products” and that FDA “will not be granting marketing authorization to vaccines in pregnant women” without this kind of evidence. Newly developed pneumonia, influenza, and COVID-19 vaccines are specifically mentioned as vaccines that would be subject to these new requirements. The rationale given for this policy change is a new analysis of vaccine safety data indicating “COVID-19 vaccines have killed American children,” though no evidence to support that statement is provided in the email.
December 5, 2025ACIP votes to end recommendation that all newborns receive hepatitis B vaccine dose at birth
On the second day of the Advisory Committee on Immunization Practices’ (ACIP) December 4-5 meeting, members vote to end a long-standing recommendation that all newborns in the U.S. receive a dose of hepatitis B vaccine. The committee now recommends parents of infants born to mothers who test negative for hepatitis B consult with their provider to help decide if and when their child should receive the first hepatitis B dose. ACIP continues to recommend that infants born to mothers who test positive for hepatitis B, or whose hepatitis B test status is unknown, receive the first hepatitis B vaccine dose at birth. A recommendation from ACIP becomes part of the official CDC immunization schedule once it is adopted by the CDC director.
December 30, 2025HHS ends certain requirements for state reporting of immunization data to the Centers for Medicare and Medicaid Services (CMS).
December 30 letter from the Centers for Medicare and Medicaid Services (CMS) informs state health officials that starting in 2026, states will no longer be required to report several measures related to immunization status to CMS. Specifically, CMS removes the following from its “Child and Adult Core Sets”: “Childhood Immunization Status”, “Immunizations for Adolescents”, “Prenatal Immunization Status: Under Age 21”; and “Prenatal Immunization Status: Age 21 and Older.” In addition, in its letter CMS informs state health officials it will “explore options to facilitate the development of new vaccine measures that capture information about whether parents and families were informed about vaccine choices, vaccine safety and side effects, and alternative vaccine schedules” and “how religious exemptions for vaccinations can be accounted for.” Data reported by states and included in the Child and Adult Core Sets are used by Medicaid and CHIP to monitor access to and quality of health care for their beneficiaries, so an absence of this data could make monitoring immunization coverage in this population more challenging.
January 5, 2026HHS announces changes to the federal childhood vaccination schedule that reduce the number of routinely recommended vaccines
Health and Human Services (HHS) issues a memo implementing major changes to the government’s recommended vaccination schedule for children. Under the new guidelines, there are vaccines for 11 diseases recommended for all children, down from 17 diseases a year ago. In addition to COVID-19 (which HHS stopped recommending for all children back in October 2025), the new schedule no longer recommends routine vaccinations for five other diseases: rotavirus, COVID-19, influenza, hepatitis A, hepatitis B, and meningococcal. These vaccines have been moved from routine recommendation to “shared clinical decision making,” a process that is “individually based and informed by a decision process between the health care provider and the patient or parent/guardian.”  The HPV vaccine remains recommended for routine vaccinations, though under the new guidelines HHS reduces the number of recommended doses of HPV drops from two or three (depending on age of initial vaccination) to one. Coverage for all of these immunizations should remain the same through public and private insurance mechanisms. On March 16, 2026, a federal judge issued a ruling that stayed changes to the vaccine schedule from being implemented, as the government did not follow required procedures. On April 29, HHS appealed the judge’s stay and court review continues.
February 3, 2026BARDA opens solicitations for a $100 million prize program for development of novel antivirals targeting dengue, West Nile, and other viruses.
In a news release, HHS’ Biomedical Advanced Research and Development Authority (BARDA) announces it is opening solicitations for a share of a new $100 million SMART Antiviral prize intended to speed the development of “broad-spectrum, small-molecule antiviral therapies” targeting families of viruses that include dengue, Zika, West Nile, and Chikungunya. This first stage is designed to receive solicitations at the concept stage, with solicitations for further development stages anticipated in the future.
February 4, 2026Trump Administration instructs CDC to rescind $600 million in public health funds going to four Democratic-led states
According to reports, the Office of Management and Budget ordered CDC to cut $600 million in funding that had been earmarked for state and local public health programs in California, Colorado, Illinois, and Minnesota. Most of the funding cuts affect programs focused on HIV and STD prevention, are are to be terminated because they “do not reflect agency priorities” according to an HHS spokesperson. On February 11, affected states filed a lawsuit in federal court against these cuts, and on February 12 a federal judge issued a temporary restraining order blocking the cuts from taking effect.
February 10, 2026FDA refuses to review Moderna’s license application for its investigational mRNA-based influenza vaccine
Moderna announces it received a “Refusal to File” letter from FDA stating that the agency will not initiate a review of the company’s biological license application for its investigational mRNA-based seasonal influenza vaccine. According to FDA, the refusal is due to the company’s use of an inadequate comparison arm in its study. Moderna states the letter is “inconsistent with previous written communications” with FDA staff. On February 18, Moderna announced that FDA had reversed its decision, and will now review the application, following further discussions with the company.
February 18, 2026FDA to allow drug approvals with evidence from one clinical trial rather than two
In an opinion article published in the New England Journal of Medicine, FDA leaders announce a new FDA policy that will make the default requirement for FDA approvals to be results from one clinical trial instead of the prior requirement of two clinical trials.  The stated goal of the change is to accelerate the approval and availability of new medicines.
February 19, 2026CDC delays February ACIP meeting
HHS/CDC announces the ACIP meeting previously scheduled for February 25-27 will be postponed. The postponement occurs amid an ongoing federal lawsuit filed by the American Academy of Pediatrics (AAP) and other medical groups that argues the recent revisions made by HHS to the federal child immunization schedule were arbitrary and violated administrative procedures and seeks to have the ACIP panel appointed by HHS Secretary Kennedy removed and replaced and its decisions overturned. On February 26, CDC announced the ACIP meeting had been rescheduled for March 18-19. On March 16, 2025, the judge ruled that 13 of 15 ACIP member appointments did in fact violate administrative procedures and their appointments are stayed along with any ACIP votes since the appointments were made. As a result, the planned March 18-19 ACIP meeting has been canceled.
February 23, 2026FDA launches new framework for speeding development and approval of therapies for rare diseases
FDA announces draft guidance for drug developers that seek approval for targeted, individualized therapies. The new framework outlines new approaches to regulatory review and evidence requirements on the safety and efficacy for rare diseases, given that traditional randomized clinical trials may not be feasible for these conditions.
March 4, 2026HHS Postpones Third Straight Meeting of US Preventive Services Task Force (USPTF)
USPTF, which makes recommendations on preventive health care services, has not met since March of 2026. Five of the 16 USPTF members’ terms have ended as of January 1 and have not been replaced.  
April 10, 2026HHS Publishes Updated ACIP Charter
The Trump Administration published an updated version of the Advisory Committee on Immunization Practices (ACIP) charter. The revised charter features language that broadens the inclusion criteria for ACIP member expertise, including mentions of vaccine safety and recovery from serious vaccine injuries as areas of expertise that members can possess.  The charter language was updated yet again in May, with the newest version published on May 27, 2026. The newest version places oversight of ACIP more directly under the CDC director, includes language that emphasizes potential gaps or limitations in vaccine data, and does not commit to a set schedule of ACIP meetings annually (previously, the charter required three ACIP meetings a year).
April 22, 2026CDC Study on COVID-19 Vaccine Effectiveness Held Back From Publication
Reports find that Jay Bhattacharya, who is overseeing CDC operations while the Director position remains unfilled, held back publication of a CDC study on the effectiveness of the COVID-19 vaccine over the 2025-2026 winter season. The study was scheduled to be published in the CDC’s flagship MMWR publication on March 19, but Bhattacharya objected to the study’s design, although it is a very common design that has been used to study vaccine effectiveness in dozens of prior published studies. The study had found vaccination cut the likelihood of emergency visits due to Covid by 50 percent and of hospitalizations by 55 percent. Eventually, the study was published in a different journal in June 2026.
May 29, 2026 Executive Order On Childhood Vaccines Directs HHS to Review and Update U.S. Childhood Vaccine Schedule
The White House issues an executive order titled “Realigning United States Core Childhood Vaccine Recommendations with Best Practices from Peer, Developed Countries” that instructs federal agencies, including HHS, that the childhood vaccine schedule “should be aligned with scientific evidence and best practices from peer, developed countries while preserving access to vaccines currently available to Americans.” This follows an earlier memorandum from December 5, 2025 instructing HHS to align the childhood vaccine schedule with that of “peer, developed nations.”
June 18, 2026FDA Advisory Committee Unanimously Recommends Approval of mRNA Influenza Vaccine
The Food and Drug Administration’s (FDA’s) Vaccines and Related Biological Products Advisory Committee (VRBPAC) votes unanimously to recommend approval of Moderna’s mRNA vaccine candidate for older adults. In February of this year FDA had said it would not review Moderna’s application for this vaccine, but several weeks later reversed course and agreed to review after Moderna proposed a revised approach to regulatory review. The FDA reports it is likely to make its decision on this vaccine by August 5 this year.
June 30, 2026Secretary Kennedy Terminates COVID-19 Emergency Use Authorization Declarations for Drugs, Biological Products, and Medical Devices
HHS announces Secretary Kennedy has terminated COVID-19 Emergency Use Authorization (EUA) declarations for drugs and biological products and for medical devices after determining these authorizations are no longer needed. The declaration for drugs and biological products will terminate 12 months after the Secretary’s determination, while the declarations for medical devices will terminate 180 days after the Secretary’s determination. EUAs for COVID-19 vaccines had already been terminated.

Recent Research on How Experiencing Racial Discrimination Impacts Health

Published: Jun 30, 2026

Introduction

Racial discrimination is an underlying driver of health disparities that affects experiences across many aspects of everyday life as well as in health care settings. Repeated and ongoing exposure to racial discrimination can negatively affect individuals’ health and well-being, increasing risks of poor outcomes across multiple domains. Understanding how exposure to racial discrimination affects health can inform efforts to reduce health disparities. Racial and ethnic health and health care disparities result in higher rates of illness and death across a wide range of health conditions and are costly to the health care system, resulting in excess medical care costs and lost productivity, as well as additional economic losses due to premature deaths each year. Amid current federal efforts to reduce resources and initiatives focused on addressing disparities, identifying and understanding the continued evidence base about the role of racial discrimination in contributing to negative health outcomes remains important.

This brief provides an overview of the relationship between racial discrimination and health and highlights research published since 2015 examining mechanisms underlying health outcomes linked to self-reported experiences of racial discrimination, including biological changes, chronic stress, mental health, substance use, pregnancy-related outcomes, and sleep. Other research has also identified how structural racism negatively impacts health but is beyond the scope of this brief.

A large body of research conducted over several decades prior to 2015 has linked experiences of racial discrimination to negative health outcomes. While not exhaustive, this brief builds on past analyses by capturing more recent literature, including large-scale longitudinal studies and those based on methodological advances that study genetic, protein, and brain imaging biomarkers to better understand biological changes linking experiences of racial discrimination to health outcomes. Criteria for inclusion included studies conducted among U.S. populations that used validated measures of racial discrimination experiences and examined associations with biomarkers or health outcomes by race. Key takeaways include the following:

  • Recent research builds upon earlier evidence that racial discrimination is associated with worse health across multiple domains, which may contribute to health disparities. Research linked self-reported experiences of racial discrimination to a greater risk of chronic disease, mental health disorders, substance use, adverse pregnancy outcomes, and sleep problems among people of color compared to White people. For example, Black and Hispanic people who reported experiencing racial discrimination had elevated risk for cardiovascular disease compared to those who did not report discrimination. Exposure to racial discrimination also is associated with higher rates of preterm births and low birth weight among infants born to Black women compared to White women.
  • Emerging studies suggest racial discrimination may impact health outcomes through biological mechanisms linked to stress, inflammation, and changes in the brain. Recent findings associated experiences of racial discrimination with elevated stress and inflammation, shortened telomere length, and changes in brain structure and activity that can increase the risk of chronic disease, poor mental health outcomes, and shortened lifespans.
  • Some research gaps and limitations remain. Most studies relied on self-reported experiences of discrimination, which researchers identified as challenging to measure. Moreover, most research focused primarily on Black populations and therefore gaps remain in understanding impacts for other groups who experience ongoing discrimination. Some studies controlled for a more robust set of potential confounding factors, such as age, gender, income, and education, than others, largely due to limitations in sample size. Additionally, studies had mixed findings on the protective social and coping factors that mitigate the negative effects of racial discrimination.

Future research into how experiences of racial discrimination impact health may be limited due to actions by Trump administration, including executive orders eliminating federal diversity, equity, inclusion, and accessibility (DEIA) programs and related initiatives. A major impact of these efforts has been a reduction in federal support for health disparities research, which may limit the information available to track disparities and better understand the underlying factors affecting health outcomes.

Background

Racism and discrimination at all levels contribute to differences in experiences across many aspects of everyday life which can negatively impact people’s health and well-being. It contributes to underlying inequities in social and economic factors that reflect historical and contemporary policies and drive racial and ethnic disparities in health, including access to housing, food, and economic and educational opportunities. However, racial health disparities persist even when controlling for differences in socioeconomic status. Many people of color continue to report experiences with daily discrimination. KFF survey data from 2023 found that at least half of American Indian or Alaska Native (AIAN) (58%), Black (54%), Hispanic adults (50%), and about 4 in 10 Asian adults (42%) say they experienced at least one type of interpersonal discrimination in daily life in the past year. These experiences included receiving poorer service than others at restaurants or stores; people acting as if they are afraid of them or as if they aren’t smart; being threatened or harassed; or being criticized for speaking a language other than English. 

A large body of research conducted over several decades has consistently documented strong associations between self-reported experiences of racial discrimination and negative health outcomes. These outcomes include poor mental health, such as depression, anxiety, and psychological distress. In addition, numerous studies have linked racial discrimination to physical health outcomes, such as hypertension, cardiovascular disease, obesity, asthma, and breast cancer, underscoring its broad impact on both physical and psychological well-being. Two conceptual frameworks help explain the mechanisms through which these associations may arise. The weathering hypothesis describes how chronic exposure to social and economic adversity, including racism and socioeconomic disadvantages, can accelerate health deterioration and contribute to racial health disparities. Allostatic load theory similarly focuses on cumulative physiologic “wear and tear” from repeated or chronic stress activation, which is associated with poorer health outcomes. Allostatic load is typically measured using various indicators, including blood pressure, cardiometabolic indicators, and other biomarkers. Research has found elevated allostatic load among adults who experienced various types of discrimination, including childhood racial discrimination.

Recent Research on Racial Discrimination and Health

Building on existing research, studies since 2015 have sought to replicate previous studies to confirm and extend findings by applying existing theories to more subgroups and outcomes and using new tools. The research often relies on associating health outcomes and biological indicators with self-reported experiences of racial discrimination, most commonly captured using validated survey instruments which measure individuals’ exposure to racial discrimination, such as the Experiences of Discrimination Scale. As this is an evolving body of research, several research limitations exist. Nearly all research studies utilize self-reported experiences of racial discrimination, which may underestimate actual exposure due to social desirability bias, recall errors, or confounds with other intersectional social factors. Some survey instruments that assess perception of racial discrimination may not perform equivalently across different racial and socioeconomic groups, which could affect cross-group comparisons. Most studies focus on Black people, while studies including populations such as AIAN and Native Hawaiian and Pacific Islander (NHPI) people are limited, reducing the generalizability of findings to these and other groups, such as Hispanic and Asian people, who experience ongoing racism. While most studies also analyzed interactions and effects due to variables other than exposure to racial discrimination, such as age, gender, income, and education, some used a less robust set of potential confounding factors due to limitations in sample size.

Impacts on Chronic Disease, Biological Changes, and Stress

Multiple studies find that racial discrimination is associated with a higher risk of chronic diseases and other conditions that may increase mortality risk. Research suggests that racial discrimination is associated with higher risk for cardiovascular and metabolic diseases, including high blood pressure, obesity, diabetes, chronic kidney disease, and other health conditions. A study found that people who reported experiencing racial discrimination had a 5% elevated risk for cardiovascular disease compared to those who did not report discrimination, with the strongest association between racial discrimination and cardiovascular disease risk seen among Asian and Latino people and among women compared to men. Additionally, exposure to experiences of racial discrimination during childhood among Black adults was associated with poorer cardiovascular health outcomes in adulthood compared to those who did not report discrimination. Other studies have highlighted a connection between racial discrimination and higher rates of obesity among women, as well as other health outcomes, including lupus and organ damage among Black women. One study found that experiencing discrimination was associated with an increase in mortality risk due to cardiovascular disease among Black people regardless of health behaviors, clinical risk factors, or social factors such as gender or racial and ethnic residential segregation. Another study found that experiencing racial discrimination was associated with higher risk of mortality due to any cause among Black adults ages 50 and older, even when controlling for health, behavioral, and economic factors.

Experiencing racial discrimination is associated with biological changes that increase inflammation and stress, which may increase the risk of developing chronic conditions and shorten lifespan. Inflammation is a natural response to injury and illness, but chronic inflammation that occurs in the absence of injury or illness can lead to various health issues, including cardiovascular disease, diabetes, and immune function. A longitudinal study found that elevated inflammation and higher levels of cumulative lifespan stress, which included experiences of discrimination, partly accounted for the shorter lifespans seen among Black participants compared to those who were White. Recent studies showed that individuals who experienced discrimination, including racial discrimination, exhibited higher levels of inflammation biomarkers compared to those who did not report discrimination. For example, one study found that Black people experienced more stress than White people across various measures, including due to racial discrimination, and that stress exposure was strongly associated with higher levels of a protein associated with inflammation. Research also found a similar pattern among pregnant Black women who reported experiencing racial discrimination compared to those who had not. Further, research at the genetic level, including the mechanisms that control inflammation levels, found that Black study participants had higher inflammatory signaling than White participants, and that racial discrimination explained over half of the race-related differences in expression of genes that promote inflammation. Another study of Black and White adults found that, among participants reporting high perceived discrimination, Black adults had a higher expression of a different set of genes linked to immune function and inflammation compared with White participants, suggesting a unique gene expression linked to experiences of racial discrimination.

Racial discrimination is also associated with shortened telomere length, which contributes to accelerated biological aging. Telomeres, which protect the ends of chromosomes, naturally shorten over time and serve as an indicator of aging. Chronic stress can accelerate telomere shortening and is associated with earlier onset of age-related disease, such as heart disease and cancer. Research found that, among Black people, those who reported racial discrimination had faster telomere shortening over a ten-year period than those who did not, though a separate study observed this effect only among Black adults ages 50 and older due to everyday discrimination rather than racial discrimination specifically. Another study found that experiences of racial discrimination were associated with shorter telomere length among Black women, Black people with high socioeconomic status, Black adults under age 40, and White men under age 40, illustrating complex interactions between experiences of discrimination and other sociodemographic factors. One hypothesis for the association observed among younger White men is that younger White males feeling “targeted” due to perceptions of race-related disadvantages as a result of increases in diversity efforts. Such perceptions may be especially pronounced among younger adults navigating educational and career advancement, although additional research is needed to better understand these relationships.

Research also has identified mitigating social and coping factors that may limit the impact of racial discrimination on stress and allostatic load, but some findings on protective buffers are mixed. Research among Black youth ages 16–18 found that higher parental and peer emotional support was associated with lower allostatic loads. A study found that, among Black women who reported experiences of racial discrimination, those with higher education levels and lower poverty status had lower allostatic load regardless of how much racial discrimination they reported experiencing compared to those with lower education levels. However, a study comparing allostatic load between Black and White adults found that experiencing higher levels of racial discrimination was associated with higher allostatic load regardless of education level, income, or wealth. Another study found that “John Henryism” among Black people, a high-effort, active coping style in response to racism and sociodemographic challenges, was associated with fewer depressive episodes but higher allostatic load, suggesting that some social coping strategies may come at the expense of health. Similarly, research conducted on the “superwoman schema” among Black women, where resilience, self-reliance, and other social processes are central to coping with discrimination, found mixed results where some coping strategies limit stress while others exacerbate it.

Pregnancy and Birth Outcomes

Recent research expands on a large body of research that shows racial discrimination is associated with adverse pregnancy outcomes. Research has documented that racism and chronic stress contribute to poor maternal and infant health outcomes, including higher rates of pregnancy-related depression and preterm birth among Black women and higher rates of mortality among Black infants. Racial discrimination during pregnancy may contribute to disparities in maternal and infant health outcomes as research has found that women of color experienced greater stress from experiencing racial discrimination than White women. Pregnancy-specific stress and lifetime exposure to racial discrimination disproportionately affect Black women and other women of color, and racial discrimination is associated with increased risk of psychological distress and reduced social support during pregnancy. Exposure to racial discrimination is associated with higher rates of preterm births, small for gestational age, and low weight births among infants born to Black women compared to White women. Additionally, experiencing racial discrimination during pregnancy is associated with elevated stress-related inflammatory markers and poor sleep among Black women, which may negatively affect maternal and perinatal health outcomes. Research among Black women also links maternal experiences of racial discrimination to poor sleep health among their children.

Mental Health and Substance Use

Recent evidence builds upon prior literature linking racism and discrimination to negative mental health outcomes, including post-traumatic stress disorder (PTSD), depression, and anxiety. Racial discrimination is associated with depression, anxiety, post-traumatic stress symptoms, and suicidal ideation and attempts among Black people. Recent studies indicated that exposure to discrimination exacerbated PTSD symptoms following traumatic injuries, as the added stress of racial bias may compound the psychological impact of the original trauma. Additionally, research among Black adults found that higher experiences of racial discrimination were associated with non-remitting PTSD, or PTSD that does not improve over time. Among Black youth between ages 9–14, higher levels of racial discrimination were associated with a greater risk of developing depressive symptoms over time. A study of school-age youth between 6th and 12th grade found that experiences of racial discrimination were associated with serious psychological distress and suicidality, most prominently among Black, Asian, and multiracial students. Research among Black youth between ages 11–19 found associations between online racial discrimination, PTSD symptoms, and suicidal ideation.

Emerging research also suggests that racial discrimination may contribute to changes to brain structure and activity that may increase risk of brain disorders and poor mental health outcomes. Brain structure plays a role in determining cognitive function and emotional regulation, with certain changes in brain volume, white matter integrity, and connectivity between different parts of the brain potentially increasing vulnerability to brain disorders and mental health conditions such as PTSD, depression, and anxiety. Research utilizing brain imaging methods has shown that experiencing racial discrimination is linked to reduced white matter integrity among Black adults 55 and older, which may increase the risk of stroke, dementia, and cognitive decline, and lower overall brain volume, which may be associated with depression. Among Black women, experiencing racial discrimination was associated with further reduced white matter integrity even when accounting for changes associated with trauma and PTSD. Research among Black youth found that coping with racial discrimination was associated with changes in brain activity that increased anxiety, depression, aggression, and rule-breaking symptoms. Research among trauma-exposed Black women also found that experiencing racial discrimination was associated with changes in connectivity between certain brain regions, including heightened activation in brain regions associated with threat vigilance and response, a state of chronic heightened stress. Another study among those who experienced a traumatic brain injury found that exposure to racial discrimination was associated with heightened connections in brain areas responsible for threat arousal, which is a state of heightened alertness that typically activates a stress response due to danger.

Experiencing racial discrimination is associated with an increased risk of substance use and alcohol use disorders. A review of studies found significant links between experiences of racial discrimination and both substance use and negative mental health outcomes. Experiences of racial discrimination were found to be associated with an increased risk for alcohol use disorder among AIAN, Black, Hispanic, and NHPI adults. Research also found that, among Hispanic college students, racial discrimination was a significant risk factor for the development of maladaptive alcohol use. A study of Black adults ages 18–24 found that experiences of racial discrimination were associated with past-year drug use and with frequent drug use, with a stronger association seen among those with a higher socioeconomic status compared to adults with lower socioeconomic status.

Sleep Disruption

Data suggest that racial discrimination is associated with sleep disruption, which may contribute to a range of negative health outcomes. Poor sleep is associated with a range of negative health outcomes, including increased inflammation, heightened risk for diabetes and obesity, and mental health issues such as depression and anxiety. Among youth ages 13–15, experiences of racial discrimination were linked to shorter sleep duration, more frequent disturbances, increased depressive symptoms, and lower levels of self-esteem. Additionally, research among college students found that experiences of racial discrimination contributed to greater increases in sleep problems among Black students compared to White students. Other research among people diagnosed with insomnia disorder found that experiences of racial discrimination were a significant factor in the link between race and insomnia severity for Black, Asian, and multiracial individuals.

References

Agbonlahor, O., DeJarnett, N., Hart, J. L., Bhatnagar, A., McLeish, A. C., & Walker, K. L. (2024). Racial/Ethnic discrimination and cardiometabolic diseases: A systematic review. Journal of Racial and Ethnic Health Disparities, 11(2), 783–807. https://doi.org/10.1007/s40615-023-01561-1

Allen, A. M., Thomas, M. D., Michaels, E. K., Reeves, A. N., Okoye, U., Price, M. M., Hasson, R. E., Syme, S. L., & Chae, D. H. (2019). Racial discrimination, educational attainment, and biological dysregulation among midlife African American women. Psychoneuroendocrinology, 99, 225–235. https://doi.org/10.1016/j.psyneuen.2018.09.001

Allen, A. M., Wang, Y., Chae, D. H., Price, M. M., Powell, W., Steed, T. C., Rose Black, A., Dhabhar, F. S., Marquez‐Magaña, L., & Woods‐Giscombe, C. L. (2019). Racial discrimination, the superwoman schema, and allostatic load: Exploring an integrative stress‐coping model among African American women. Annals of the New York Academy of Sciences, 1457(1), 104–127. https://doi.org/10.1111/nyas.14188

Artiga, S., Hamel, L., Gonzalez-Barrera, A., Montero, A., Hill, L., Presiado, M., Kirzinger, A., & Lopes, L. (2023, December 5). Survey on Racism, Discrimination and Health. KFF. https://www.kff.org/racial-equity-and-health-policy/poll-finding/survey-on-racism-discrimination-and-health/

Bastos, J. L., & Harnois, C. E. (2020). Does the Everyday Discrimination Scale generate meaningful cross-group estimates? A psychometric evaluation. Social Science & Medicine, 265(113321). https://doi.org/10.1016/j.socscimed.2020.113321

Beldon, M. A., Clay, S. L., Uhr, S. D., Woolfolk, C. L., & Canton, I. J. (2024). Exposure to racism and adverse pregnancy outcomes for Black women: A systematic review and meta-analysis. Journal of Immigrant and Minority Health, 27. https://doi.org/10.1007/s10903-024-01641-2

Berger, M., & Sarnyai, Z. (2014). “More than skin deep”: Stress neurobiology and mental health consequences of racial discrimination. Stress, 18(1), 1–10. https://doi.org/10.3109/10253890.2014.989204

Bernardo, C. de O., Bastos, J. L., González-Chica, D. A., Peres, M. A., & Paradies, Y. C. (2017). Interpersonal discrimination and markers of adiposity in longitudinal studies: A systematic review. Obesity Reviews, 18(9), 1040–1049. https://doi.org/10.1111/obr.12564

Bird, C. M., Webb, E. K., Schramm, A. T., Torres, L., Larson, C., & deRoon ‐Cassini, T. A. (2021). Racial Discrimination is associated with acute posttraumatic stress symptoms and predicts future posttraumatic stress disorder symptom severity in trauma‐exposed Black adults in the United States. Journal of Traumatic Stress, 34(5). https://doi.org/10.1002/jts.22670

Boen, C. (2019). Death by a thousand cuts: Stress exposure and Black–White disparities in physiological functioning in late life. The Journals of Gerontology: Series B, 75(9), 1937–1950. https://doi.org/10.1093/geronb/gbz068

Boyd, D. T., Quinn, C. R., Durkee, M. I., Williams, E.-D. G., Constant, A., Washington, D., Butler-Barnes, S. T., & Ewing, A. P. (2024). Perceived discrimination, mental health help-seeking attitudes, and suicide ideation, planning, and attempts among black young adults. BMC Public Health, 24(1). https://doi.org/10.1186/s12889-024-19519-1

Brody, G. H., Lei, M.-K., Chae, D. H., Yu, T., Kogan, S. M., & Beach, S. R. H. (2014). Perceived discrimination among African American adolescents and allostatic load: A longitudinal analysis with buffering effects. Child Development, 85(3), 989–1002. https://doi.org/10.1111/cdev.12213

Cahill, M., Illback, R., & Peiper, N. (2024). Perceived racial discrimination, psychological distress, and suicidal behavior in adolescence: Secondary analysis of cross-sectional data from a statewide youth survey. Healthcare, 12(10), 1011. https://doi.org/10.3390/healthcare12101011

Carliner, H., Delker, E., Fink, D. S., Keyes, K. M., & Hasin, D. S. (2016). Racial discrimination, socioeconomic position, and illicit drug use among US Blacks. Social Psychiatry and Psychiatric Epidemiology, 51(4), 551–560. https://doi.org/10.1007/s00127-016-1174-y

Cave, L., Cooper, M. N., Zubrick, S. R., & Shepherd, C. C. J. (2020). Racial discrimination and child and adolescent health in longitudinal studies: a systematic review. Social Science & Medicine, 250(112864), 112864. https://doi.org/10.1016/j.socscimed.2020.112864

Chae, D. H., Martz, C. D., Fuller-Rowell, T. E., Spears, E. C., Smith, T. T. G., Hunter, E. A., Drenkard, C., & Lim, S. S. (2019). Racial discrimination, disease activity, and organ damage: The Black women’s experiences living with lupus (BeWELL) study. American Journal of Epidemiology, 188(8). https://doi.org/10.1093/aje/kwz105

Chae, D. H., Wang, Y., Martz, C. D., Slopen, N., Yip, T., Adler, N. E., Fuller-Rowell, T. E., Lin, J., Matthews, K. A., Brody, G. H., Spears, E. C., Puterman, E., & Epel, E. S. (2020). Racial discrimination and telomere shortening among African Americans: The coronary artery risk development in young adults (CARDIA) study. Health Psychology, 39(3), 209–219. https://doi.org/10.1037/hea0000832

Chen, S., & Mallory, A. B. (2021). The effect of racial discrimination on mental and physical health: A propensity score weighting approach. Social Science & Medicine, 285(114308). https://doi.org/10.1016/j.socscimed.2021.114308

Cheng, H.-L., & Mallinckrodt, B. (2015). Racial/ethnic discrimination, posttraumatic stress symptoms, and alcohol problems in a longitudinal study of Hispanic/Latino college students. Journal of Counseling Psychology, 62(1), 38–49. https://doi.org/10.1037/cou0000052

Cheng, P., Cuellar, R., Johnson, D. A., Kalmbach, D. A., Joseph, C. L., Cuamatzi Castelan, A., Sagong, C., Casement, M. D., & Drake, C. L. (2020). Racial discrimination as a mediator of racial disparities in insomnia disorder. Sleep Health, 6(5), 543–549. https://doi.org/10.1016/j.sleh.2020.07.007

Cleveland Clinic. (2024, March 22). Inflammation: What is it, causes, symptoms & treatment. Cleveland Clinic. https://my.clevelandclinic.org/health/symptoms/21660-inflammation

Cobb, R. J., Sheehan, C., Louie, P., & Erving, C. L. (2021). Multiple reasons for perceived everyday discrimination and all-cause mortality risk among older Black adults. The Journals of Gerontology, 77(2), 310–314. https://doi.org/10.1093/gerona/glab281

Cohen, M. F., Corwin, E. J., Johnson, D. A., Amore, A. D., Brown, A. L., Barbee, N. R., Brennan, P. A., & Dunlop, A. L. (2022). Discrimination is associated with poor sleep quality in pregnant Black American women. Sleep Medicine, 100, 39–48. https://doi.org/10.1016/j.sleep.2022.07.015

Cohen, M. F., Dunlop, A. L., Johnson, D. A., Dunn Amore, A., Corwin, E. J., & Brennan, P. A. (2022). Intergenerational effects of discrimination on Black American children’s sleep health. International Journal of Environmental Research and Public Health, 19(7), 4021. https://doi.org/10.3390/ijerph19074021

Colten, H. R., Altevogt, B. M., & Institute of Medicine (US) Committee on Sleep Medicine and Research. (2006). Extent and health consequences of chronic sleep loss and sleep disorders. NIH.gov; National Academies Press (US). https://www.ncbi.nlm.nih.gov/books/NBK19961/

Cuevas, A. G., Ho, T., Rodgers, J., DeNufrio, D., Alley, L., Allen, J., & Williams, D. R. (2021). Developmental timing of initial racial discrimination exposure is associated with cardiovascular health conditions in adulthood. Ethnicity & Health, 26(7), 949–962. https://doi.org/10.1080/13557858.2019.1613517

Cuevas, A. G., McSorley, A.-M., Adiammi Lyngdoh, Fatoumata Kaba-Diakité, Harris, A., Brennan Rhodes-Bratton, & Rouhani, S. (2024). Education, income, wealth, and discrimination in Black-White allostatic load disparities. American Journal of Preventive Medicine, 67(1), 97–104. https://doi.org/10.1016/j.amepre.2024.02.021

Cuevas, A. G., Ong, A. D., Carvalho, K., Ho, T., Chan, S. W. (Celine), Allen, J. D., Chen, R., Rodgers, J., Biba, U., & Williams, D. R. (2020). Discrimination and systemic inflammation: A critical review and synthesis. Brain, Behavior, and Immunity, 89, 465–479. https://doi.org/10.1016/j.bbi.2020.07.017

Fani, N., Carter, S. E., Harnett, N. G., Ressler, K. J., & Bradley, B. (2021). Association of racial discrimination with neural response to threat in Black women in the US exposed to trauma. JAMA Psychiatry, 78(9). https://doi.org/10.1001/jamapsychiatry.2021.1480

Fani, N., Harnett, N. G., Bradley, B., Mekawi, Y., Powers, A., Stevens, J. S., Ressler, K. J., & Carter, S. (2021). Racial discrimination and white matter microstructure in trauma-exposed Black women. Biological Psychiatry, 91(3). https://doi.org/10.1016/j.biopsych.2021.08.011

Forde, A. T., Crookes, D. M., Suglia, S. F., & Demmer, R. T. (2019). The weathering hypothesis as an explanation for racial disparities in health: A systematic review. Annals of Epidemiology, 33, 1–18. https://doi.org/10.1016/j.annepidem.2019.02.011

Fuller-Rowell, T. E., Curtis, D. S., El-Sheikh, M., Duke, A. M., Ryff, C. D., & Zgierska, A. E. (2017). Racial discrimination mediates race differences in sleep problems: a longitudinal analysis. Cultural Diversity and Ethnic Minority Psychology, 23(2), 165–173. https://doi.org/10.1037/cdp0000104

Giurgescu, C., Engeland, C. G., Templin, T. N., Zenk, S. N., Koenig, M. D., & Garfield, L. (2016). Racial discrimination predicts greater systemic inflammation in pregnant African American women. Applied Nursing Research: ANR, 32, 98–103. https://doi.org/10.1016/j.apnr.2016.06.008

Giurgescu, C., Zenk, S. N., Engeland, C. G., Garfield, L., & Templin, T. N. (2017). Racial discrimination and psychological wellbeing of pregnant women. MCN, the American Journal of Maternal/Child Nursing, 42(1), 8–13. https://doi.org/10.1097/nmc.0000000000000297

Glass, J. E., Williams, E. C., & Oh, H. (2020). Racial/ethnic discrimination and alcohol use disorder severity among United States adults. Drug and Alcohol Dependence, 216(108203), 108203. https://doi.org/10.1016/j.drugalcdep.2020.108203

Guidi, J., Lucente, M., Sonino, N., & Fava, Giovanni A. (2020). Allostatic load and its impact on health: A systematic review. Psychotherapy and Psychosomatics, 90(1), 1–17. https://doi.org/10.1159/000510696

Hill, L., & Artiga, S. (2026, June 4). Elimination of federal diversity initiatives: Updates and current status. KFF. https://www.kff.org/racial-equity-and-health-policy/elimination-of-federal-diversity-initiatives-updates-and-current-status/

Hill, L., Artiga, S., Pillai, A., & Rao, A. (2025, March 21). Elimination of federal diversity initiatives: Implications for racial health equity. KFF. https://www.kff.org/racial-equity-and-health-policy/elimination-of-federal-diversity-initiatives-implications-for-racial-health-equity/

Hill, L., Rao, A., Artiga, S., & Ranji, U. (2025, December 3). Racial disparities in maternal and infant health: Current status and key issues. KFF. https://www.kff.org/racial-equity-and-health-policy/racial-disparities-in-maternal-and-infant-health-current-status-and-key-issues/

Johnson, A., Dobbs, P. D., Coleman, L., & Maness, S. (2023). Pregnancy-specific stress and racial discrimination among U.S. women. Maternal and Child Health Journal, 27(2), 328–334. https://doi.org/10.1007/s10995-022-03567-3

Jones, C. P. (2000). Levels of racism: A theoretic framework and a gardener’s tale. American Journal of Public Health, 90(8), 1212–1215. https://doi.org/10.2105/ajph.90.8.1212

KFF. (2023). How history has shaped racial and ethnic health disparities: A timeline of policies and events. KFF. https://www.kff.org/how-history-has-shaped-racial-and-ethnic-health-disparities-a-timeline-of-policies-and-events/

Krieger, N., Smith, K., Naishadham, D., Hartman, C., & Barbeau, E. M. (2005). Experiences of discrimination: Validity and reliability of a self-report measure for population health research on racism and health. Social Science & Medicine, 61(7), 1576–1596. https://doi.org/10.1016/j.socscimed.2005.03.006

Latendresse, G. (2009). The interaction between chronic stress and pregnancy: Preterm birth from a biobehavioral perspective. Journal of Midwifery & Women’s Health, 54(1), 8–17. https://doi.org/10.1016/j.jmwh.2008.08.001

LaVeist, T. A., Pérez-Stable, E. J., Richard, P., Anderson, A., Isaac, L. A., Santiago, R., Okoh, C., Breen, N., Farhat, T., Assenov, A., & Gaskin, D. J. (2023). The economic burden of racial, ethnic, and educational health inequities in the US. JAMA, 329(19), 1682–1692. https://doi.org/10.1001/jama.2023.5965

Lavner, J. A., Hart, A. R., Carter, S. E., & Beach, S. R. H. (2022). Longitudinal effects of racial discrimination on depressive symptoms among Black youth: Between- and within-person effects. Journal of the American Academy of Child & Adolescent Psychiatry, 61(1), 56–65. https://doi.org/10.1016/j.jaac.2021.04.020

Lawrence, W. R., Jones, G. S., Johnson, J. A., Ferrell, K. P., Johnson, J. N., Shiels, M. S., Diez Roux, A. V., & Forde, A. T. (2023). Discrimination experiences and all-cause and cardiovascular mortality: Multi-ethnic study of atherosclerosis. Circulation: Cardiovascular Quality and Outcomes, 16(4). https://doi.org/10.1161/circoutcomes.122.009697

Lewis, T. T., Cogburn, C. D., & Williams, D. R. (2015). Self-reported experiences of discrimination and health: Scientific advances, ongoing controversies, and emerging issues. Annual Review of Clinical Psychology, 11(1), 407–440. https://doi.org/10.1146/annurev-clinpsy-032814-112728

Liu, S. Y., & Kawachi, I. (2017). Discrimination and telomere length among older adults in the United States. Public Health Reports, 132(2), 220–230. https://doi.org/10.1177/0033354916689613

Mekawi, Y., Hyatt, C. S., Maples-Keller, J., Carter, S., Michopoulos, V., & Powers, A. (2021). Racial discrimination predicts mental health outcomes beyond the role of personality traits in a community sample of African Americans. Clinical Psychological Science, 9(2), 183–196. https://doi.org/10.1177/2167702620957318

Meyer, C. S., Schreiner, P. J., Lim, K., Battapady, H., & Launer, L. J. (2019). Depressive symptomatology, racial discrimination experience, and brain tissue volumes observed on magnetic resonance imaging. American Journal of Epidemiology, 188(4), 656–663. https://doi.org/10.1093/aje/kwy282

Miller, H. N., LaFave, S., Marineau, L., Stephens, J., & Thorpe, R. J. (2021). The impact of discrimination on allostatic load in adults: An integrative review of literature. Journal of Psychosomatic Research, 146(110434). https://doi.org/10.1016/j.jpsychores.2021.110434

Moody, D. L. B., Taylor, A. D., Leibel, D. K., Al-Najjar, E., Katzel, L. I., Davatzikos, C., Gullapalli, R. P., Seliger, S. L., Kouo, T., Erus, G., Rosenberger, W. F., Evans, M. K., Zonderman, A. B., & Waldstein, S. R. (2019). Lifetime discrimination burden, racial discrimination, and subclinical cerebrovascular disease among African Americans. Health Psychology, 38(1), 63. https://doi.org/10.1037/hea0000638

Ndugga, N., Hill, L., Rao, A., Pillai, A., & Artiga, S. (2025, December 16). Key data on health and health care by race and ethnicity. KFF. https://www.kff.org/racial-equity-and-health-policy/key-data-on-health-and-health-care-by-race-and-ethnicity/?entry=executive-summary-introduction

Oshri, A., Reck, A. J., Carter, S. E., Uddin, L. Q., Geier, C. F., Beach, S. R. H., Brody, G. H., Kogan, S. M., & Sweet, L. H. (2024). Racial discrimination and risk for internalizing and externalizing symptoms among Black youths. JAMA Network Open, 7(6), e2416491. https://doi.org/10.1001/jamanetworkopen.2024.16491

Pacheco, N. L., Noren Hooten, N., Wu, S. F., Mensah‐Bonsu, M., Zhang, Y., Chitrala, K. N., De, S., Mode, N. A., Ezike, N., Beatty Moody, D. L., Zonderman, A. B., & Evans, M. K. (2025). Genome‐wide transcriptome differences associated with perceived discrimination in an urban, community‐dwelling middle‐aged cohort. The FASEB Journal, 39(3). https://doi.org/10.1096/fj.202402000r

Pantesco, E. J., Leibel, D. K., Ashe, J. J., Waldstein, S. R., Katzel, L. I., Liu, H. B., Weng, N., Evans, M. K., Zonderman, A. B., & Beatty Moody, D. L. (2018). Multiple forms of discrimination, social status, and telomere length: Interactions within race. Psychoneuroendocrinology, 98, 119–126. https://doi.org/10.1016/j.psyneuen.2018.08.012

Paradies, Y., Ben, J., Denson, N., Elias, A., Priest, N., Pieterse, A., Gupta, A., Kelaher, M., & Gee, G. (2020). Racism as a determinant of health: A systematic review and meta-analysis. PLOS ONE, 10(9), 1–48. https://doi.org/10.1371/journal.pone.0138511

Robinson, M. N., & Thomas Tobin, C. S. (2021). Is John Henryism a health risk or resource?: Exploring the role of culturally relevant coping for physical and mental health among Black Americans. Journal of Health and Social Behavior, 62(2), 136–151. https://doi.org/10.1177/00221465211009142

Shammas, M. A. (2011). Telomeres, lifestyle, cancer, and aging. Current Opinion in Clinical Nutrition and Metabolic Care, 14(1), 28–34. https://doi.org/10.1097/mco.0b013e32834121b1

Spears, I. D., Gorelik, A. J., Norton, S. A., Boudreaux, M. J., Wolk, M. W., Siudzinski, J., Paul, S. E., Cox, M. A., Rogers, C. E., Oltmanns, T. F., Hill, P. L., & Bogdan, R. (2026). Cumulative lifespan stress, inflammation, and racial disparities in mortality between Black and White adults. JAMA Network Open, 9(1). https://doi.org/10.1001/jamanetworkopen.2025.54701

Thames, A. D., Irwin, M. R., Breen, E. C., & Cole, S. W. (2019). Experienced discrimination and racial differences in leukocyte gene expression. Psychoneuroendocrinology, 106, 277–283. https://doi.org/10.1016/j.psyneuen.2019.04.016

Torres, L., Geier, T. J., Tomas, C. W., Bird, C. M., Timmer‐Murillo, S., Larson, C. L., & deRoon ‐Cassini, T. A. (2024). Racial discrimination increases the risk for nonremitting posttraumatic stress disorder symptoms in traumatically injured Black individuals living in the United States. Journal of Traumatic Stress, 37(4). https://doi.org/10.1002/jts.23051

Tynes, B. M., Maxie-Moreman, A., Hoang, T.-M. H., Willis, H. A., & English, D. (2024). Online racial discrimination, suicidal ideation, and traumatic stress in a national sample of Black adolescents. JAMA Psychiatry, 81(3). https://doi.org/10.1001/jamapsychiatry.2023.4961

Wallace, M., Crear-Perry, J., Richardson, L., Tarver, M., & Theall, K. (2017). Separate and unequal: Structural racism and infant mortality in the US. Health & Place, 45, 140–144. https://doi.org/10.1016/j.healthplace.2017.03.012

Webb, E. K., Bird, C. M., deRoon-Cassini, T. A., Weis, C. N., Huggins, A. A., Fitzgerald, J. M., Miskovich, T., Bennett, K., Krukowski, J., Torres, L., & Larson, C. L. (2022). Racial discrimination and resting-state functional connectivity of salience network nodes in trauma-exposed Black adults in the United States. JAMA Network Open, 5(1), e2144759. https://doi.org/10.1001/jamanetworkopen.2021.44759

Williams, D. R., Lawrence, J. A., & Davis, B. A. (2019). Racism and health: evidence and needed research. Annual Review of Public Health, 40(1), 105–125. https://doi.org/10.1146/annurev-publhealth-040218-043750

Williams, D. R., Priest, N., & Anderson, N. B. (2016). Understanding associations among race, socioeconomic status, and health: Patterns and prospects. Health Psychology, 35(4), 407–411. https://doi.org/10.1037/hea0000242

Yip, T. (2015). The effects of ethnic/racial discrimination and sleep quality on depressive symptoms and self-esteem trajectories among diverse adolescents. Journal of Youth and Adolescence, 44(2), 419–430. https://doi.org/10.1007/s10964-014-0123-x

Yip, T., Cheon, Y. M., Wang, Y., Cham, H., Tryon, W., & El‐Sheikh, M. (2019). Racial disparities in sleep: Associations with discrimination among ethnic/racial minority adolescents. Child Development, 91(3), 914–931. https://doi.org/10.1111/cdev.13234

The Business of Health with Chip Kahn

AI: Show Me the Outcomes

June 30, 2026

Video

Audio

About this Episode


Episode 10, AI Series: Chip talks with Dr. Toyin Ajayi, co-founder and CEO of Cityblock Health, which delivers value-based care to more than 100,000 Medicaid and dual-eligible members across ten states, many of them people of color managing chronic conditions. Ajayi makes a pointed case: Roughly 60 percent of health care AI investment goes to billing, coding, and risk adjustment — making sure someone gets paid — while only a fraction goes to delivering care. If we continue to concentrate AI there, she warns, it will drive up cost without improving outcomes. She says there is a better way — AI built for care can lower costs by improving care for those hardest to reach. She and Chip discuss what that looks like and how Cityblock is using AI now to improve care and the patient experience for its members.

The Host


Headshot photo of Chip Kahn wearing a navy blue suit with a red tie, red pendant on lapel, and glasses.

Sr. Visiting Fellow

Charles N. Kahn III is a senior visiting fellow at KFF. He is also a visiting senior fellow at the American Enterprise Institute and a nonresident senior scholar at the University of Southern California’s Schaeffer Center for Health Policy & Economics. He serves as co-chair of the international Future of Health collaborative.

Guest


Co-founder and Chief Executive Officer, Cityblock Health

Dr. Toyin Ajayi is a Board-certified Family Medicine physician and CEO of Cityblock, a value-based healthcare provider for Medicaid and dually eligible beneficiaries. Prior to Cityblock, she served as Chief Medical Officer of Commonwealth Care Alliance, an integrated health plan and care delivery system for Medicare and Medicaid beneficiaries. Dr. Ajayi serves on the Board of Directors of Evolent Health and Foodsmart and is a co-founder of Coalition Partners. She’s an Aspen Institute Henry Crown Fellow and a member of the National Academy of Medicine. She’s been named to Inc.’s Female Founders 500 list, TIME100 Next, Modern Healthcare’s Top Women Leaders in Healthcare, and the STATUS List.

Dr. Ajayi received her undergraduate degree from Stanford University, an MPhil from the University of Cambridge, her medical degree, with Distinction in Clinical Practice, from King’s College London School of Medicine, and in 2024 was awarded an honorary Doctorate of Science from Georgetown University. Board certified in Family Medicine, Dr. Ajayi completed her residency training at Boston Medical Center and practiced as a hospitalist and primary care provider with a focus on patients with chronic, complex and end-of-life needs.


SERIES

This weekly podcast features insightful conversations between host Chip Kahn and his guests, who discuss the business of health care, connecting the dots between the health care business, policy, and patients.

The podcast’s first series on AI in health care illuminates how AI is changing health care, and features guests who are deploying this technology, managing its consequences, and designing policy around it.

News Release

Poll: People Without a Trusted Health Care Provider Are More Likely to Endorse Vaccine Myths, As Are Those Who Often Use Social Media or AI for Health Information

While More People Identify Vaccine Myths as “Definitely False” than “Definitely True,” At Least Half Are Uncertain About What to Believe

Published: Jun 30, 2026

People who don’t have a trusted health care provider are more likely than people with one to believe or lean toward believing several common myths about vaccines, a new KFF Tracking Poll on Health Information and Trust reveals. Similarly, people who use social media or artificial intelligence (AI) chatbots at least weekly for health information are more likely than those who don’t to endorse these false vaccine claims.

One example: Among adults who say they do not have a doctor or other health provider they trust to answer questions about their health, about 4 in 10 (39%) incorrectly believe that it is either “definitely” or “probably true” that MMR vaccines have been proven to cause autism in children, compared to a quarter (24%) among those who say they have a trusted provider.

Similarly, more than a third of people who report using social media (37%) or AI chatbots (35%) at least weekly for health information incorrectly say this myth is true, about twice the share among those who never use social media (16%) or AI (20%) for health information.

The poll finds a similar pattern for most of the other vaccine myths tested for people without a trusted doctor as well as for people who frequently use social media or AI for health information. The differences remain significant even when controlling for other factors such as age, race and ethnicity, education, partisanship, and insurance status.

Exposure to each of these false claims has been fairly steady in KFF polls over the past several years, though the share who report hearing the myth that mRNA vaccines can alter a person’s DNA dropped by 9 percentage points since April 2025 (from 45% to 36%). Exposure to the myth that measles vaccines are more dangerous than measles rose between 2024 and 2025, but has remained steady since then (29% now).

Across the four false vaccines claims, far more people say the claims are “definitely false” than say they are “definitely true,” but at least half of the public is less certain what to believe, falling into the malleable middle and saying each of these claims are either “probably true” or “probably false.”

While many parents who skip or delay recommended vaccines for their children express uncertainty over vaccine myths, they are also about twice as likely as parents who keep their children up to date on vaccines to believe or lean toward believing false claims about the measles and COVID-19 vaccines.

The pattern is true for each of the four false claims: that MMR vaccines cause autism in children (57%  among those who delay or skip vaccines v. 30% among those who stay up to date), that more people died from COVID-19 vaccines than the virus itself (55% v. 29%), that mRNA vaccines alter DNA (52% v. 23%), and that measles vaccines are more dangerous than measles (43% v. 18%). This relationship remains significant even when controlling for factors like age, education, and partisanship.

The poll also includes a new analysis that identifies patterns of belief across the four false claims and sorts them into a new belief typology. A small share (8%) are consistent or leaned myth believers (saying all four claims are either “probably” or “definitely true”) and just over half (55%) are consistent or leaned myth deniers (saying all four claims are either “probably” or “definitely false”). About 3 in 10 (31%) are in the mixed middle, providing a range of true and false answers and lacking certainty on at least half of the claims.

Designed and analyzed by public opinion researchers at KFF, this survey was conducted May 7-31, 2026, online and by telephone among a nationally representative sample of 2,480 U.S. adults in English and in Spanish. The margin of sampling error is plus or minus three percentage points for the full sample. For results based on other subgroups, the margin of sampling error may be higher.

Poll Finding

KFF Tracking Poll on Health Information and Trust: Update on Common Vaccine Myths

Published: Jun 30, 2026

Findings

Key Takeaways

  • With childhood vaccination rates in the U.S. continuing to decline as measles cases rise across the U.S., KFF’s latest Tracking Poll on Health Information and Trust shows that several commonly circulated vaccine myths remain pervasive among the public. Many adults say they have heard false claims about the measles and COVID-19 vaccines, including that the measles, mumps, and rubella (MMR) vaccines have been proven to cause autism in children (66%), that more people have died from the COVID-19 vaccines than the virus (46%), that mRNA vaccines can alter DNA (36%), or that measles vaccines are more dangerous than measles itself (29%).
  • While many have heard of these myths, smaller shares are convinced they are true. Fewer than one in ten adults express ardent belief in each myth, while larger shares (between 31% and 44%) say each are “definitely false” and at least half fall in the “malleable middle,” saying each of these claims is either “probably true” or “probably false.”
  • Adults who have a relationship with a trusted health care provider are less likely than those who don’t have such a relationship to believe or lean toward believing vaccine falsehoods. For instance, nearly half (46%) of adults who say they do not have a health care provider they trust to answer questions about their health say it is “probably” or “definitely true” that more people have died from COVID-19 vaccines than from the virus, which is nearly twice the share among those with a trusted provider (24%). While younger adults, Hispanic adults, and uninsured adults are more likely than their counterparts to say they don’t have a trusted provider, the connection between lacking a trusted provider and belief in vaccine myths holds even when controlling for factors like age, race and ethnicity, education, partisanship, and insurance coverage.
  • Those who use social media and artificial intelligence (AI) chatbots for health information are also more likely to endorse many of these vaccine myths. For example, adults who use social media for health information at least weekly are more than twice as likely as those who don’t use social media for health to say the myth linking MMR vaccines to autism is “probably” or “definitely true” (37% v. 16%). Use of artificial intelligence (AI) for health information is also correlated with views on some of these myths, with adults who regularly use AI for health information more likely than non-users to believe or lean toward believing myths about the MMR and mRNA vaccines. While younger adults, Black and Hispanic adults, and those without a college degree are all more likely to use to social media for health information, the connection between frequent use and belief in vaccine myths holds even when controlling for factors like age, race and ethnicity, education, and partisanship.
  • Parents’ views on vaccine myths are also correlated with their decisions about childhood vaccinations. Parents who report skipping or delaying recommended childhood vaccines are consistently at least 25 percentage points more likely than those who keep their children up-to-date to say vaccine myths are “definitely” or “probably true,” including the false claims that MMR vaccines cause autism in children (57% v. 30%), that more people died from COVID-19 vaccines than the virus itself (55% v. 29%), that mRNA vaccines alter DNA (52% v. 23%), and that measles vaccines are more dangerous than measles (43% v. 18%). This relationship remains significant even when controlling for factors like age, education, and partisanship.
  • When looking at patterns of belief across the four false vaccine claims, a new analysis shows that some adults are consistent or leaned myth believers (8% who say all four claims are either “probably” or “definitely true”), or myth deniers (55% who deny all four claims, saying they are either “probably” or “definitely false”). At the same time, about three in ten (31%) fall in a “mixed middle” group, providing a range of true and false answers across the four vaccine myths and lacking certainty on at least half of the false claims. This group may be an important focus for those looking to counter vaccine misinformation and dispel confusion. Black adults, Hispanic adults, Republicans, younger adults, and those without a college degree are all more likely than their counterparts to fall into this “mixed middle” group, as are individuals who go to social media or AI for health information. Notably, nearly half of parents who report skipping or delaying recommended vaccines for their children fall in the “mixed middle,” indicating that these parents’ decisions may be driven, at least in part, by uncertainty and confusion.

Exposure to Common Vaccine Myths

The latest KFF Tracking Poll on Health Information and Trust examines the pervasiveness of several commonly circulated vaccine myths. These false or unproven claims about vaccines have remained persistent in terms of exposure over the past several years, with little change to the share of the public have heard most of these myths.

The false claim that MMR vaccines have been proven to cause autism in children – a myth associated with a since retracted study from the 1990s – remains one of the most widely heard vaccine myths, with two-thirds of adults saying they have heard or read this. Nearly half (46%) of adults say they have heard the false claim that more people have died from the COVID-19 vaccines than the virus itself, and about one third of adults (36%) say they have heard the myth that mRNA vaccines can change your DNA (mRNA is a vaccine technology utilized by some COVID-19 vaccines and others under development). About three in ten adults (29%) say they have heard the false claim that measles vaccines are more dangerous than measles infections.

Exposure to each of these false claims has been fairly steady in KFF polls over the past several years, though the share who report hearing the myth that mRNA vaccines can alter a person’s DNA dropped by 9 percentage points since April 2025 (from 45% to 36%). Exposure to the myth that measles vaccines are more dangerous than measles rose between 2024 and 2025, but has remained steady since then.

Figure 1

Uncertainty Surrounding False Vaccine Claims

While many report having heard some false claims about vaccines, very few adults are ardent believers in these myths, with larger shares (but fewer than half) stating the myths are “definitely false.” At the same time, and consistent with past KFF polling, at least half of adults fall into the “malleable middle” across the myths, expressing some uncertainty and saying these vaccine myths are either “probably true” or “probably false.” Across these four vaccine falsehoods, most parents fall into the malleable middle, expressing some uncertainty for each claim.

Stacked bar chart showing the share of the public who believe four false vaccine claims are definitely true, probably true, probably false, or definitely false.

Over time, the share who fall in the “malleable middle” for these vaccine myths has been relatively stable, with at least half saying each is either “probably true” or “probably false.” At the same time, there have been some minor shifts in the share who view some of these myths as “definitely false” over the past few years, underscoring how the public’s willingness to endorse vaccine falsehoods is not completely static. Somewhat larger shares of adults now say it is “definitely false” that mRNA vaccines can change your DNA (31% now v. 24% in April 2025), and that measles vaccines are more dangerous than getting infected with measles (44% now v. 38% in March 2024). Conversely, the share of adults who think it is “definitely false” that more people have died from COVID-19 vaccines than from the virus has declined (39% now compared to 47% in June 2023) alongside a 5-percentage point jump in the share who say this myth is “probably true.” There have been no notable changes in views of the long-standing myth that MMR vaccines cause autism.

Stacked bar chart showing how belief in four false vaccine claims has changed over time, from June 2023 to June 2026.

Belief in Vaccine Myths is Tied to Lacking a Trusted Health Care Provider And Use of Social Media and AI For Health Information

Previous KFF polls have shown that health care providers are the most trusted source of health information among the public, and this latest poll shows that individuals who have a trusted provider are less likely than those without a trusted provider to endorse vaccine-related myths. For example, among adults who say they do not have a doctor or health care provider they trust to answer questions about their health (16% of all adults), nearly half (46%) say it is either “definitely” or “probably true” that more people have died from COVID-19 vaccines than from the COVID-19 virus, compared to a quarter (24%) among those who say they have a trusted health care provider.

Unsurprisingly, adults who say they do not have a trusted health care provider to answer their health questions are much more likely to be uninsured than those who have a provider they trust (36% v. 7%). At the same time, lacking a trusted provider could be related to low trust in providers and doctors more broadly and not necessarily related to health care access. Across demographics, adults under age 50, LGBT adults, and Hispanic adults are all more likely than their counterparts to say they don’t have a provider they trust to answer questions about their health. However, the connection between not having a trusted provider and belief in vaccine myths remains significant even when controlling for factors like age, race and ethnicity, education, partisanship, and insurance coverage.

Grouped bar chart showing the percentage of adults who believe four false vaccine claims are definitely or probably true, comparing adults with and without a trusted health care provider.

Frequent health information-seeking on social media and via artificial intelligence (AI) chatbots is also tied to a tendency to believe vaccine myths. Adults who say they use social media for health information and advice at least weekly (26% of all adults) are more likely than those who never use social media for health to say each false vaccine claim is “probably” or “definitely true.” Similarly, adults who report using AI tools or chatbots at least weekly for health advice (20% of all adults) are more likely than those who never use these chatbots to endorse myths about the measles vaccines and mRNA vaccines. For example, the share who say it is “probably” or “definitely true” that MMR vaccines have been proven to cause autism is higher among adults who seek health advice at least weekly from social media (37%) or AI (35%) compared to those who never use social media (16%) or AI (20%) for health advice.

The relationship between belief in vaccine myths and use of social media or AI for health information continues to be significant even when controlling for factors like age, race and ethnicity, education, and partisanship.

Bar chart showing the percentage of adults who believe four false vaccine claims are definitely or probably true, broken down by how often they use social media and AI tools for health information.

Parents who skip or delay recommended vaccines for their children are about twice as likely as parents who keep their children up to date on vaccines to believe or lean toward believing false claims about the measles and COVID-19 vaccines, underscoring how false health claims may shape parents’ decisions.

Overall, at least three in ten parents say it is “probably” or “definitely true” that MMR vaccines have been proven to cause autism in children (36%), that more people have died from COVID-19 vaccines than the virus (35%), or that mRNA vaccines can alter DNA (29%). About one in four (23%) parents believe or lean toward believing the myth that measles vaccines are more dangerous than measles.

The tendency to endorse these false vaccine claims, however, rises substantially among parents who report not keeping their children up to date on recommended vaccines. Six in ten (57%) parents who report having skipped or delayed recommended childhood vaccines (excluding seasonal vaccines for COVID-19 and flu), say it is either “definitely true” or “probably true” that the MMR vaccines have been proven to cause autism in children, while around half believe or lean toward believing that the COVID-19 vaccines killed more people than the virus (55%), or that mRNA vaccines alter DNA (52%). About four in ten (43%) parents who skipped or delayed childhood vaccines say it is true that the measles vaccines are more dangerous than measles itself. Each of these shares is at least 25 percentage points higher than among parents who report keeping their children up to date on recommended childhood vaccines, a relationship that remains significant even when controlling for factors like age, education, and partisanship. 

Bar chart showing the percentage of parents who believe four false vaccine claims are definitely or probably true, broken down by total parents and by whether they have skipped or delayed their children's vaccines or kept them up to date.

Digging Deeper on The Malleable Middle: Patterns of Belief Across Vaccine Myths

While KFF polling has routinely found that at least half the public fall in the “malleable middle” when it comes to a wide variety of false health claims, there are nuances within this group that can be examined by looking at patterns of belief across multiple myths rather than examining a single question.

This new typology identified five groups based off patterns of belief across the four false vaccine claims included in this survey:

  • Consistent myth believers (1% of the public) say all four vaccine myths are true, including at least three out of four as “definitely true.”
  • Leaned myth believers (6% of the public) say all four vaccine myths are true but are somewhat uncertain in their beliefs, saying at least two of the four myths are “probably true.”
  • The mixed middle (31% of the public) provide a range of true and false responses and at least half of the time provide a “probably” response (in either the true or false direction).
  • Leaned myth deniers (26% of the public) say all four vaccine myths are false but are somewhat uncertain, saying at least two of the four myths are “probably false.”
  • Consistent myth deniers (29% of the public) say all four vaccine myths are false, including at least three out of four as “definitely false.”

The “mixed middle” group, making up 31% of all adults, reflects a portion of the “malleable middle” that expresses the most uncertainty and does not routinely land on one side when it comes to commonly circulating vaccine falsehoods. The share who fall in the “mixed middle” differs by partisanship, education, race and ethnicity, and age. For example, four in ten Hispanic adults and about a third (35%) of Black adults are part of this group compared to fewer than three in ten white adults (28%). Republicans (44%) are more than twice as likely as Democrats (18%) to be part of this group, while independents (31%) fall in between the two. Those without a college degree (36%) are also 10 percentage points more likely than college graduates (23%) to fall into this mixed middle group. These findings suggest these groups who disproportionately fall in the “mixed middle” may be an important focus for those looking to counter vaccine misinformation and dispel confusion. 

Stacked bar chart showing the percentage of adults who fall into five belief categories — consistent myth believers, leaned myth believers, the mixed middle, leaned myth deniers, and consistent myth deniers — across four vaccine-related myths, broken down by total adults, total parents, age, race and ethnicity, party identification, and education.

Adults who are frequently using social media for health advice are also more likely to lack certainty across vaccine myths, providing a range of mixed answers and saying at least half of the four myths are either “probably true” or “probably false.” When looking at belief across different vaccine myths, adults who report using social media for health information on at least a weekly basis are twice as likely to fall in the “mixed middle” group as those who never use social media for health (41% v. 21%). Adults who use AI tools for health information at least occasionally are also somewhat more likely to fall into the “mixed middle” compared to those who never use AI for health, but the difference is smaller for AI than it is for social media use.

Stacked bar chart showing the percentage of adults who fall into five belief categories — consistent myth believers, leaned myth believers, the mixed middle, leaned myth deniers, and consistent myth deniers — across four vaccine-related myths, broken down by how often they use social media and AI tools for health information.

Nearly half (45%) of parentswho have skipped or delayed recommended vaccines for their children fall in this “mixed middle” group, underscoring the connection between confusion, uncertainty and parents’ decisions to forgo recommended vaccines for their children.

Stacked bar chart showing the percentage of parents who fall into five belief categories — consistent myth believers, leaned myth believers, the mixed middle, leaned myth deniers, and consistent myth deniers — across four vaccine-related myths, broken down by total parents and by whether they have skipped or delayed their children's vaccines or kept them up to date.

Methodology

This KFF Tracking Poll on Health Information and Trust was designed and analyzed by public opinion researchers at KFF. The survey was conducted May 7 – 31, 2026, online and by telephone among a nationally representative sample of 2,480 U.S. adults in English (2,407) and Spanish (73).

The sample includes 1,977 who were reached through an address-based sample (ABS) and completed the survey online (1,819) or over the phone (158). An additional 503 respondents were reached through a random digit dial telephone (RDD) sample of prepaid (pay-as-you-go) cell phone numbers. Among this prepaid cell phone component, 223 were interviewed by phone and 280 were invited to the web survey via short message service (SMS). Marketing Systems Groups (MSG) provided both the ABS and RDD samples. All fieldwork was managed by SSRS of Glen Mills, PA; sampling design and weighting was done in collaboration with KFF.

Both the ABS and RDD sample frames included disproportionate stratification aimed at reaching Hispanic and non-Hispanic Black respondents. The ABS was also stratified based on model-based prediction of household-members’ party identification (Republican, Democratic, or independent).

Respondents received a $15 incentive for their participation, with interviews completed by phone receiving a mailed check and web respondents receiving an electronic gift card incentive.

In order to ensure data quality, cases were removed if they failed two or more quality checks: (1) attention check questions in the online version of the questionnaire, (2) had over 30% item nonresponse, or (3) had a length less than one quarter of the mean length by mode. Likewise, cases that were reached through ABS who reported a living in a different state than the sampled address were removed for quality assurance. Based on this criterion, 39 cases were removed.

The combined ABS and cell phone samples were weighted to match the sample’s demographics to the national U.S. adult population using data from the Census Bureau’s 2025 Current Population Survey (CPS). The combined sample was weighted by gender by age, gender by education, age by education, race/ethnicity by education, education, race, census region, population density, frequency of internet usage, recalled 2024 vote by quintiles of the county-level 2024 vote share. The weights also take into account differences in the probability of selection for each sample type (ABS and prepaid cell phone). This includes adjustment for the sample design and geographic stratification of the samples, and within household probability of selection. The population density benchmark was from the 2026 Claritas Pop-Facts Premier. The internet frequency benchmarks was from the 2025 National Public Opinion Reference Survey (NPORS) data. The county-level 2024 vote share was from CNN-provided file of 2024 election results by county

The margin of sampling error including the design effect for the full sample is plus or minus 3 percentage points. Numbers of respondents and margins of sampling error for key subgroups are shown in the table below. For results based on other subgroups, the margin of sampling error may be higher. Sample sizes and margins of sampling error for other subgroups are available by request. Sampling error is only one of many potential sources of error and there may be other unmeasured error in this or any other public opinion poll. The following questions included in this survey were designed, analyzed, and paid for by KFF. The demographic questions included in this study were developed and funded jointly by CNN and KFF, with each organization having independent editorial control over its portion of the survey. KFF Public Opinion and Survey Research is a charter member of the Transparency Initiative of the American Association for Public Opinion Research.

GroupN (unweighted)M.O.S.E.
Total2,480± 3 percentage points
   
Race/Ethnicity  
White, non-Hispanic                                                                                       1,355± 3 percentage points
Black, non-Hispanic435± 6 percentage points
Hispanic420± 7 percentage points
   
Age  
18-29399± 7 percentage points
30-49888± 4 percentage points
50-64590± 5 percentage points
65+556± 6 percentage points
   
Party ID  
Democrats774± 5 percentage points
Independents876± 5 percentage points
Republicans607± 5 percentage points
   
Parents of children under 18682± 5 percentage points