There are several options under consideration in Congress to significantly reduce Medicaid spending to help pay for tax cuts, with the recently passed House budget resolution targeting cuts to Medicaid of up to $880 billion or more over a decade. Medicaid is the primary program providing comprehensive health and long-term care to one in five people living in the U.S and accounts for nearly $1 out of every $5 spent on health care. Medicaid is administered by states within broad federal rules and jointly funded by states and the federal government, meaning restrictions in federal Medicaid spending could leave states with tough choices about how to offset reductions through cuts to Medicaid, cuts to other programs, or tax increases.
This analysis examines the potential impacts on states, Medicaid enrollees, and providers of implementing a per capita cap on federal Medicaid spending, which is one proposal that has been discussed in Congress. The analysis assumes, based on proposals floated in Congress, that the plan would cap federal Medicaid spending growth per enrollee for each of the five major eligibility groups at medical inflation. Given the likelihood of multiple, simultaneous changes to Medicaid and the interactive nature of those changes, the analysis also illustrates the effects of a per capita cap on Medicaid if implemented jointly with the elimination of the 90% federal match rate for the Affordable Care Act (ACA) expansion, another significant policy change that has been discussed in Congress and which was examined by a previous KFF analysis. Other proposals to reduce federal Medicaid spending have also been reportedly raised, including work requirements, a reduced federal matching rate, limits on provider taxes to finance the state share of Medicaid spending, and repeal of certain Medicaid regulations issued by the Biden administration. Future KFF analyses will examine these proposals as well.
Key takeaways
- The estimated effects of a per capita cap depend highly on what assumptions are made about policy specifications, future growth in Medicaid spending, and states’ responses to federal cuts.
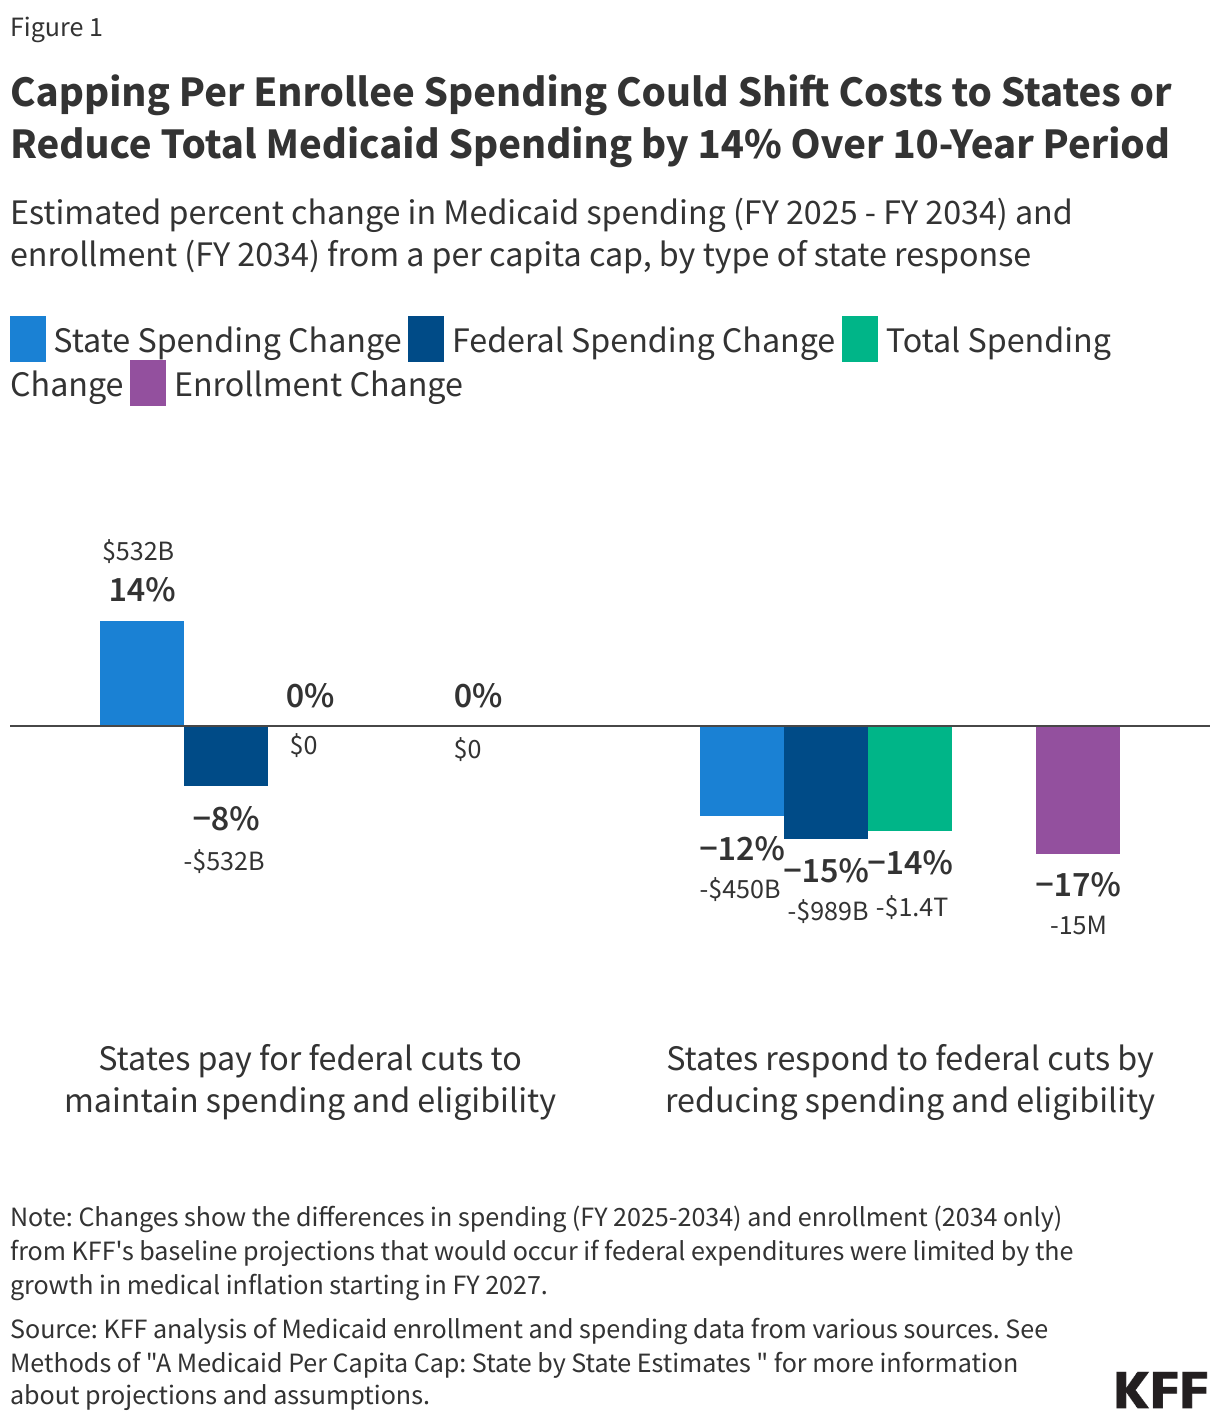
- Capping per enrollee spending could reduce federal spending by $532 billion to nearly $1 trillion dollars between FY 2025 and FY 2034. Depending on how states respond, the policy could shift costs to states by $532 billion and leave total Medicaid spending unchanged or total Medicaid spending could decline by 14% (or $1.4 trillion).
- If per capita caps were implemented jointly with the elimination of the enhanced ACA expansion match rate, federal Medicaid spending could decline by $1 trillion to $2.1 trillion dollars between FY 2025 and FY 2034. Depending on how states respond, this combination of policies could shift costs to states by $1 trillion and leave total Medicaid spending unchanged or total Medicaid spending could decline by a quarter (or $2.6 trillion).
- If states reduced Medicaid eligibility proportionally to the cuts in federal spending, 15 million enrollees could lose Medicaid coverage under a per capita cap by the final year of the analysis, with that figure doubling to 30 million when combined with elimination of the ACA expansion match rate.
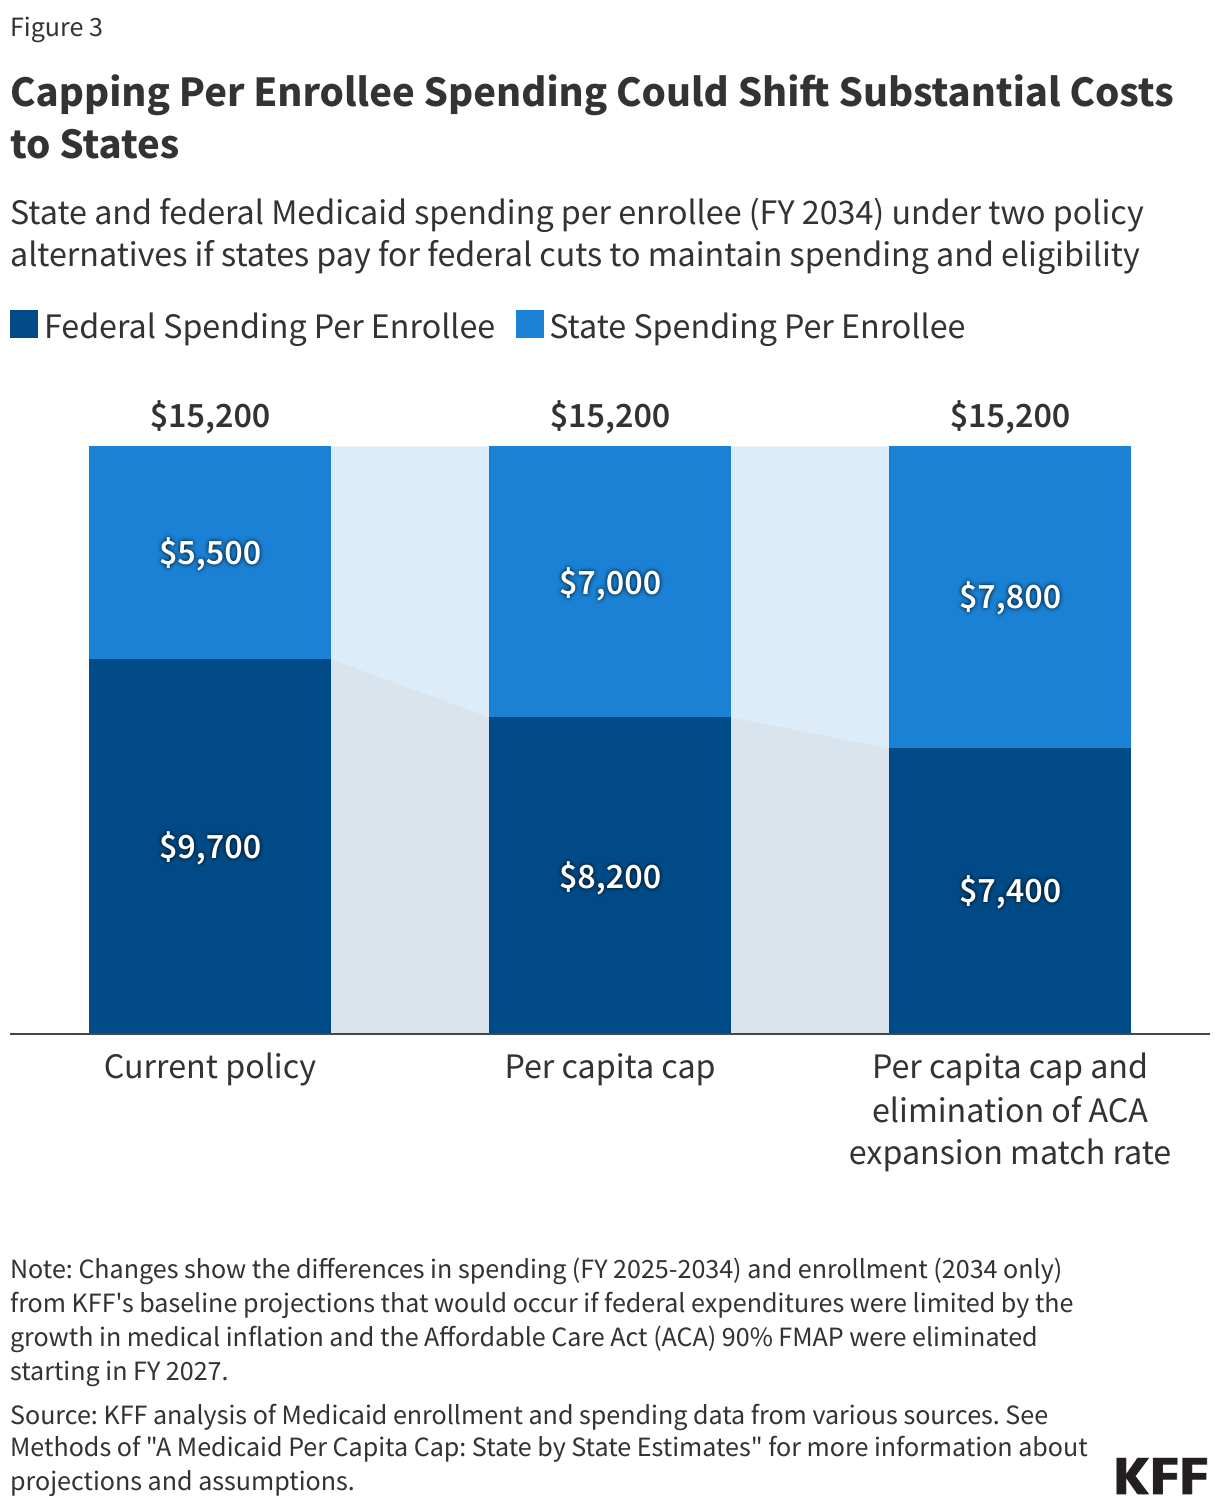
- States would face tough choices about Medicaid’s future under a per capita cap: maintaining current Medicaid benefit levels and enrollment would require states to pay $1,500 to $2,300 more per enrollee in the final year of the analysis.
- The effects of a per capita cap differ across eligibility groups because spending for different eligibility groups is expected to grow at different rates, with larger estimated effects among children and adults who are not eligible because they have a disability or are ages 65 and older.
- All states would be affected by a per capita cap, but the size of the effects vary due to differences in the mix of enrollees. Depending on state responses, state spending could increase up to 57% in some states if they chose to pay for the cuts. Enrollment could decrease by similar levels if states chose to restrict eligibility in response to the federal funding cuts.
Spending reductions under a per capita cap would compound over time as expected increases in Medicaid spending diverge from the caps. The effects would be smaller immediately following implementation, larger in FY 2034, the final year of this analysis, and continue to grow in the years after 2034. A per capita cap can provide lower and more predictable federal costs over time, but it would also fundamentally change the Medicaid federal-state partnership by eliminating the federal guaranteed match and transferring new financial risk to states. States would face significant challenges in efforts to pay for federal cuts and there would be pressure to reduce benefits and eligibility, with even larger effects if a per capita cap were paired with other Medicaid cuts. Beyond reduced Medicaid spending and enrollment, there could be increases in the number of people who are uninsured, fewer covered benefits for future Medicaid enrollees, and reduced revenues available for health plans and providers such as hospitals and nursing facilities.
What is the proposed policy change?
Medicaid spending is currently shared by states and the federal government with a guarantee to states for federal matching payments without a cap on federal expenditures. The percentage of costs paid by the federal government (known as the federal medical assistance percentage or “FMAP”) for most Medicaid enrollees is determined by a formula set in law designed to provide a higher federal match rate for states with lower per capita incomes. There are also higher match rates for certain services and populations like the ACA expansion group (90%). This leads to variation in the federal share of Medicaid spending across states. There is also considerable variation in per enrollee spending across states, due to state flexibility to determine eligibility levels, benefits, and provider payment, and across eligibility groups,reflecting differences in health care needs and utilization.
This analysis estimates the impact of implementing a per capita cap on the federal share of Medicaid spending. One proposal under consideration would “establish a per capita cap [on federal Medicaid expenditures] for each of the different enrollment populations set to grow at medical inflation.” While specifics on the implementation of this policy would be included in a legislative proposal, further details have yet to be released, and assumptions made here may differ from details included in proposed legislation. To estimate a per capita (i.e., per enrollee) cap policy, this analysis first establishes FY 2025 per enrollee spending as the base year estimate; then, starting in FY 2027, the analysis limits federal spending growth for the five major eligibility groups (children, adults, expansion adults, people with disabilities and aged 65+) to the consumer price index (CPI-U) plus 0.4 percentage points, which is KFF’s estimate of the difference between CPI-U and medical inflation (CPI-M) over the past 20 years (see Methods).
The analysis also estimates the combined impact of implementing a per capita cap and eliminating the ACA expansion federal match rate. The combined policy would include the same per capita caps on federal spending and also assumes that, starting in FY 2027, expenditures for people eligible through Medicaid expansion would be matched at each state’s traditional FY 2026 FMAP rate. This part of the analysis accounts for the interactive effects of these two policy changes; therefore, savings are lower than if each policy was modeled separately and the totals were added together (see Methods). There are a number of other Medicaid policy changes that have been suggested, and policy estimates would likely differ depending on the combination of policies and their interactive effects.
What is the potential impact on Medicaid spending?
This analysis does not make assumptions about specific state behavioral responses and instead examines how the impacts of the two policy alternatives vary based on two types of state responses to the cuts. The state responses are designed to illustrate the spectrum of potential policy change effects. However, in practice, each state is likely to respond to the policy change differently and spending impacts overall would likely fall within the range. While some states may choose to increase state spending to maintain current programs with substantially reduced federal funding, many would likely need to make programmatic cuts, making both the lower end and higher end estimates unlikely. The analysis does not explore people’s insurance coverage after losing Medicaid; some may enroll in another source of coverage, but many others would likely become uninsured. The estimates presented here are not directly comparable to the estimates of federal savings from the Congressional Budget Office (CBO) because CBO’s estimates account for people enrolling in other coverage and make assumptions about how states would respond in the aggregate. While the estimates assume that spending per enrollee by eligibility group would grow uniformly across states based on CBO’s national projections, it is likely that growth rates would vary by state, and that a cap would therefore have varying effects
Per Capita Cap
In analyzing the effects of a per capita cap on Medicaid spending, KFF considered the following two types of state responses.
- Pay for Federal Cuts: States maintain per enrollee spending and eligibility at current levels, picking up new costs due to the federal cap on per enrollee spending. Enrollment and total spending would remain constant while costs would shift from the federal government to the states. States would have to make offsetting cuts in programs other than Medicaid or raise revenues.
- Reduce Spending and Eligibility: States cap their share of per enrollee spending at medical inflation – e.g., by reducing payment rates to health care providers — and also reduce eligibility by the same percentage that federal spending is cut for each eligibility group to reflect the fact that the federal government is contributing less towards the cost. As a result, there would be decreases in enrollment and total, federal, and state spending.
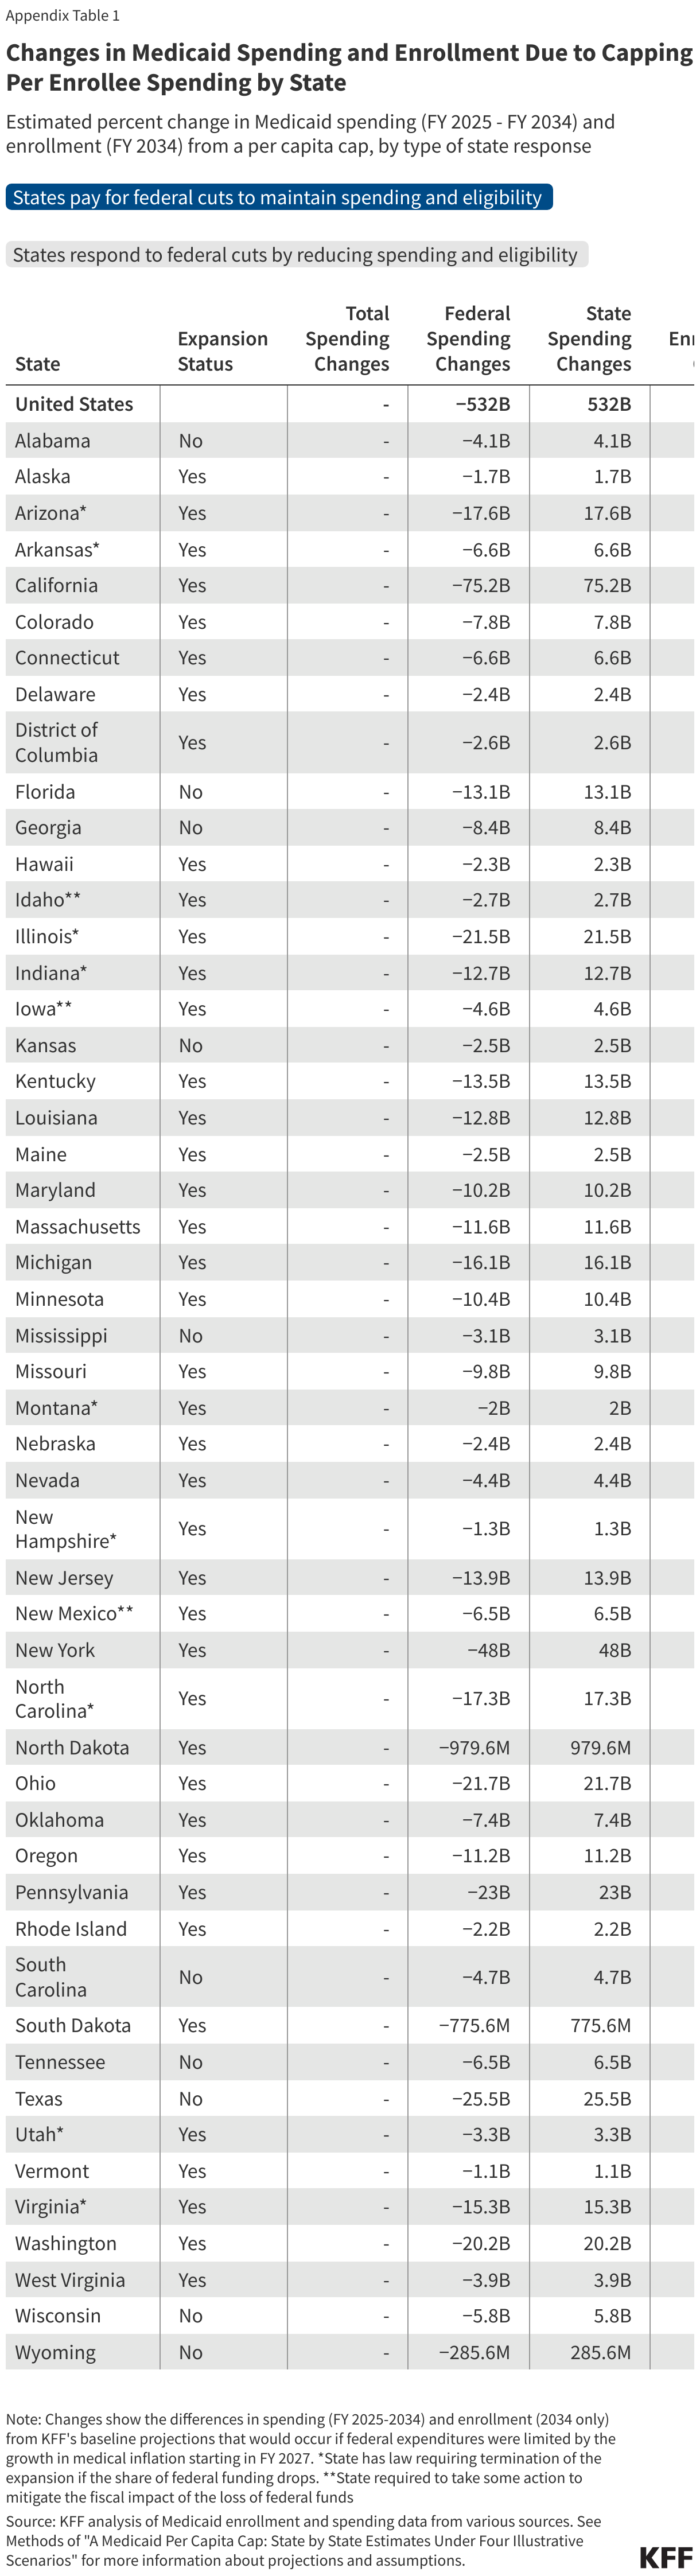
Capping per enrollee spending could shift costs to states or reduce total Medicaid spending by 14% ($1.4 trillion) over a 10-year period (Figure 1). If states offset the federal cuts, federal Medicaid spending could decrease by 8% or $532 billion over the 10-year period, and states would pay those costs, increasing the state share by 14% across all states. If instead, states cap their share of per enrollee spending and reduce Medicaid eligibility, federal Medicaid spending could decline by 15% or $989 billion, reflecting the fact that per enrollee spending is capped and enrollment goes down. State spending could decline by 12% or $450 billion. Combined, Medicaid spending could decrease by 14% or $1.4 trillion over the 10-year period. The analysis assumes states would reduce Medicaid eligibility proportionally to the cuts in federal spending, and the effects compound over time, meaning spending and enrollment effects are smaller in years just following implementation but grow over time. By the end of the 10-year period, enrollment could be 17% lower than current policy, meaning 15 million people could lose Medicaid coverage. Some who lose Medicaid may enroll in another source of coverage, but many others would become uninsured.
Per Capita Cap and Elimination of the ACA Expansion Match Rate
In analyzing the effects of a per capita cap on Medicaid spending if it were combined with the elimination of the ACA expansion match rate, KFF considered the following two types of state responses.
- Pay for Federal Cuts: States maintain per enrollee spending and eligibility at current levels, picking up new costs due to the federal cap on per enrollee spending and the loss of the higher match rate for expansion enrollees. Enrollment and total spending would remain constant while costs would shift from the federal government to the states.
- Reduce Spending and Eligibility: States cap their share of per enrollee spending at medical inflation, drop the ACA Medicaid expansion, and reduce eligibility by the same percentage that federal spending per enrollee is cut for each eligibility group, resulting in changes to enrollment and to total, federal, and state spending as well as per enrollee spending.
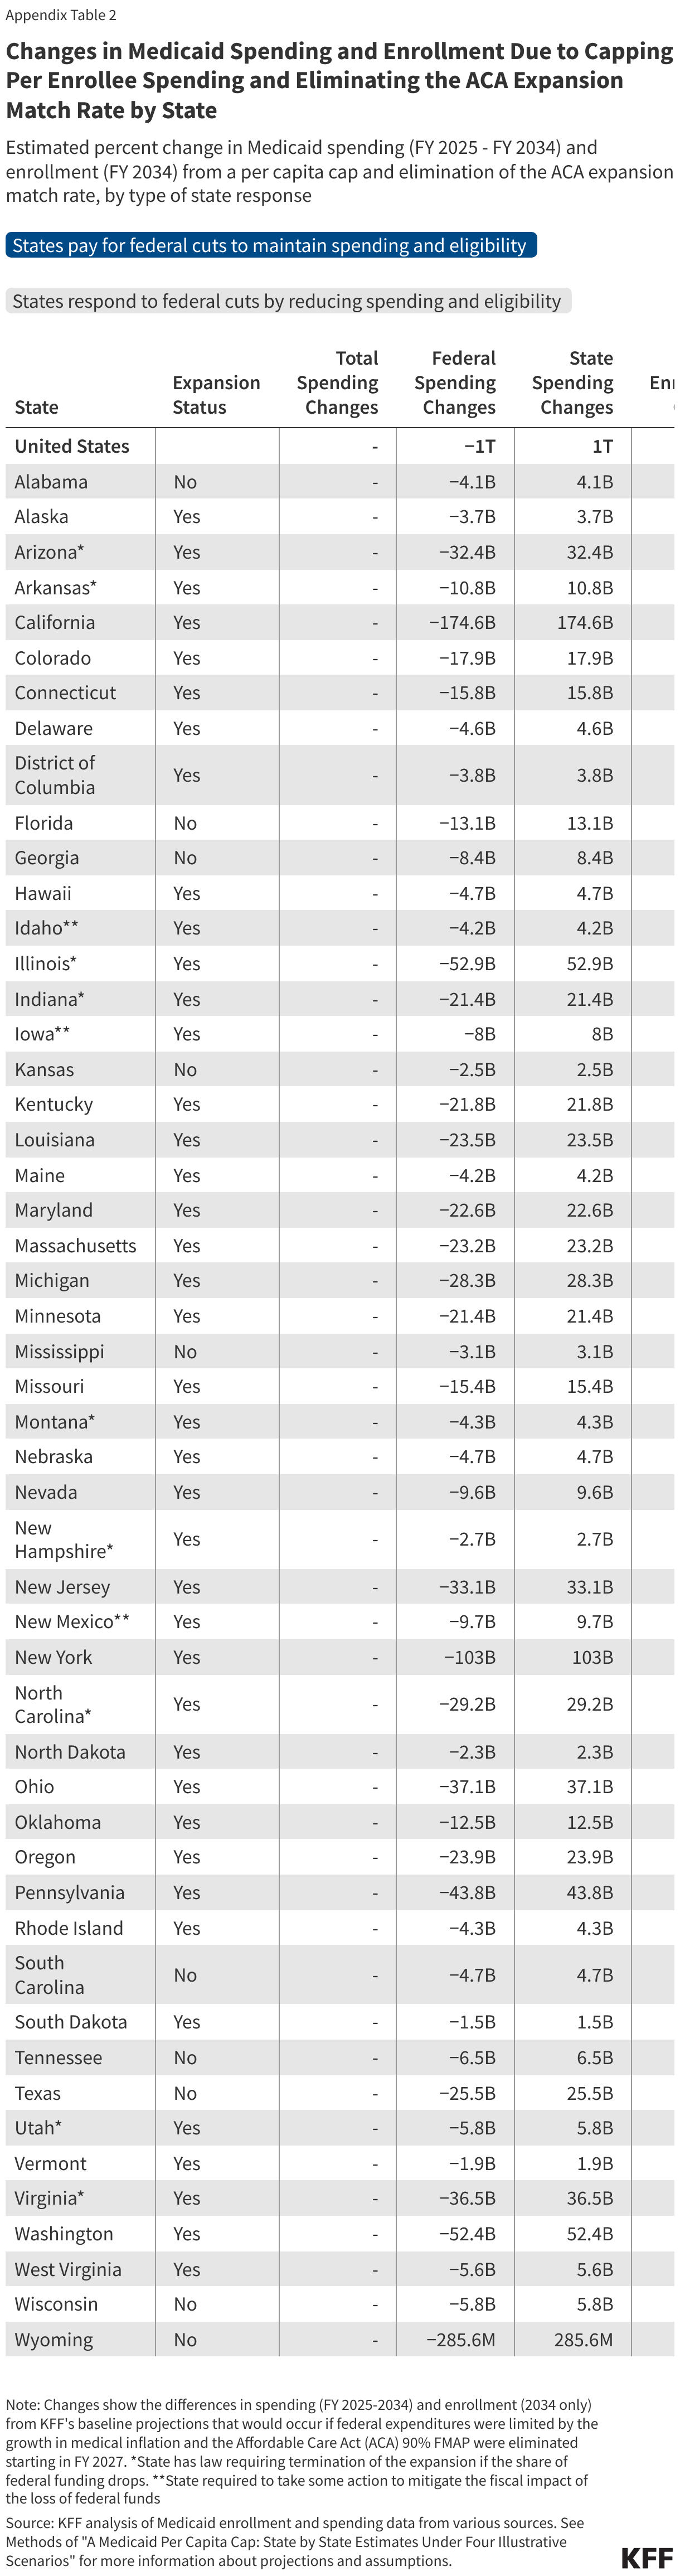
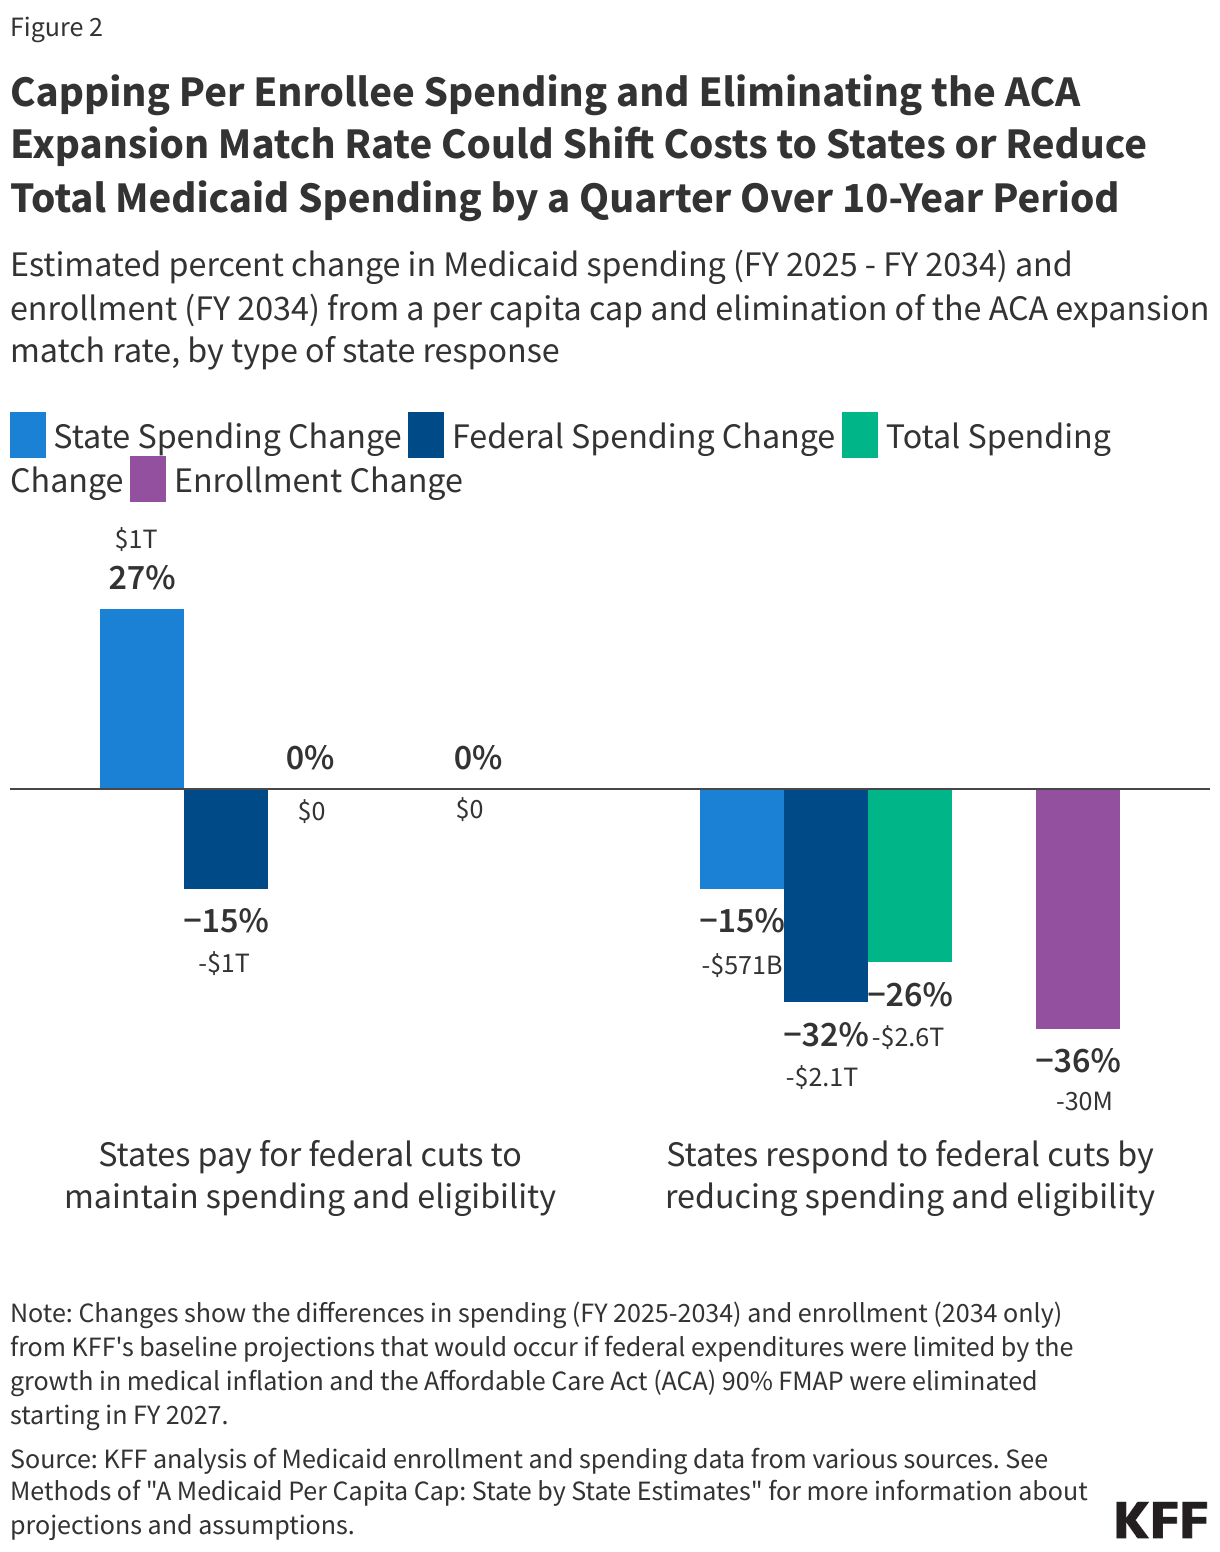
Capping per enrollee spending and eliminating the ACA expansion match rate could shift costs to states or reduce total Medicaid spending by a quarter ($2.6 trillion) over a 10-year period (Figure 2). If states pay for the cuts, federal Medicaid spending could decrease by 15% or $1 trillion over the 10-year period, and states would pay those costs, increasing the state share by 27% across all states. If instead, states cap their share of per enrollee spending and reduce Medicaid eligibility, federal Medicaid spending could decrease by 32% or $2.1 trillion, and state spending could decrease by 15% or $571 billion. Combined, Medicaid spending could decrease by 26% or $2.6 trillion over the 10-year period. Enrollment losses could increase each year proportionally with the increase in federal spending cuts, resulting in 30 million (or 36%) fewer people with Medicaid coverage by the end of the 10-year period.
Impacts on State Spending if States Pay for Federal Cuts to Medicaid
Under both policy alternatives, costs would shift significantly from the federal government to the states if states chose to maintain current benefits and eligibility, causing state Medicaid spending per enrollee to increase by $1,500 to $2,300 in FY 2034 (Figure 3). With federal Medicaid spending per enrollee capped, state spending per enrollee could increase from $5,500 under current policy to $7,000 with a per capita cap and $7,800 if the per capita cap were paired with the elimination of the ACA expansion match rate. By FY 2034, the federal share of Medicaid spending on average across states could fall from 64% to 54% with a per capita cap and 49% if the per capita cap were paired with elimination of the ACA expansion match rate.
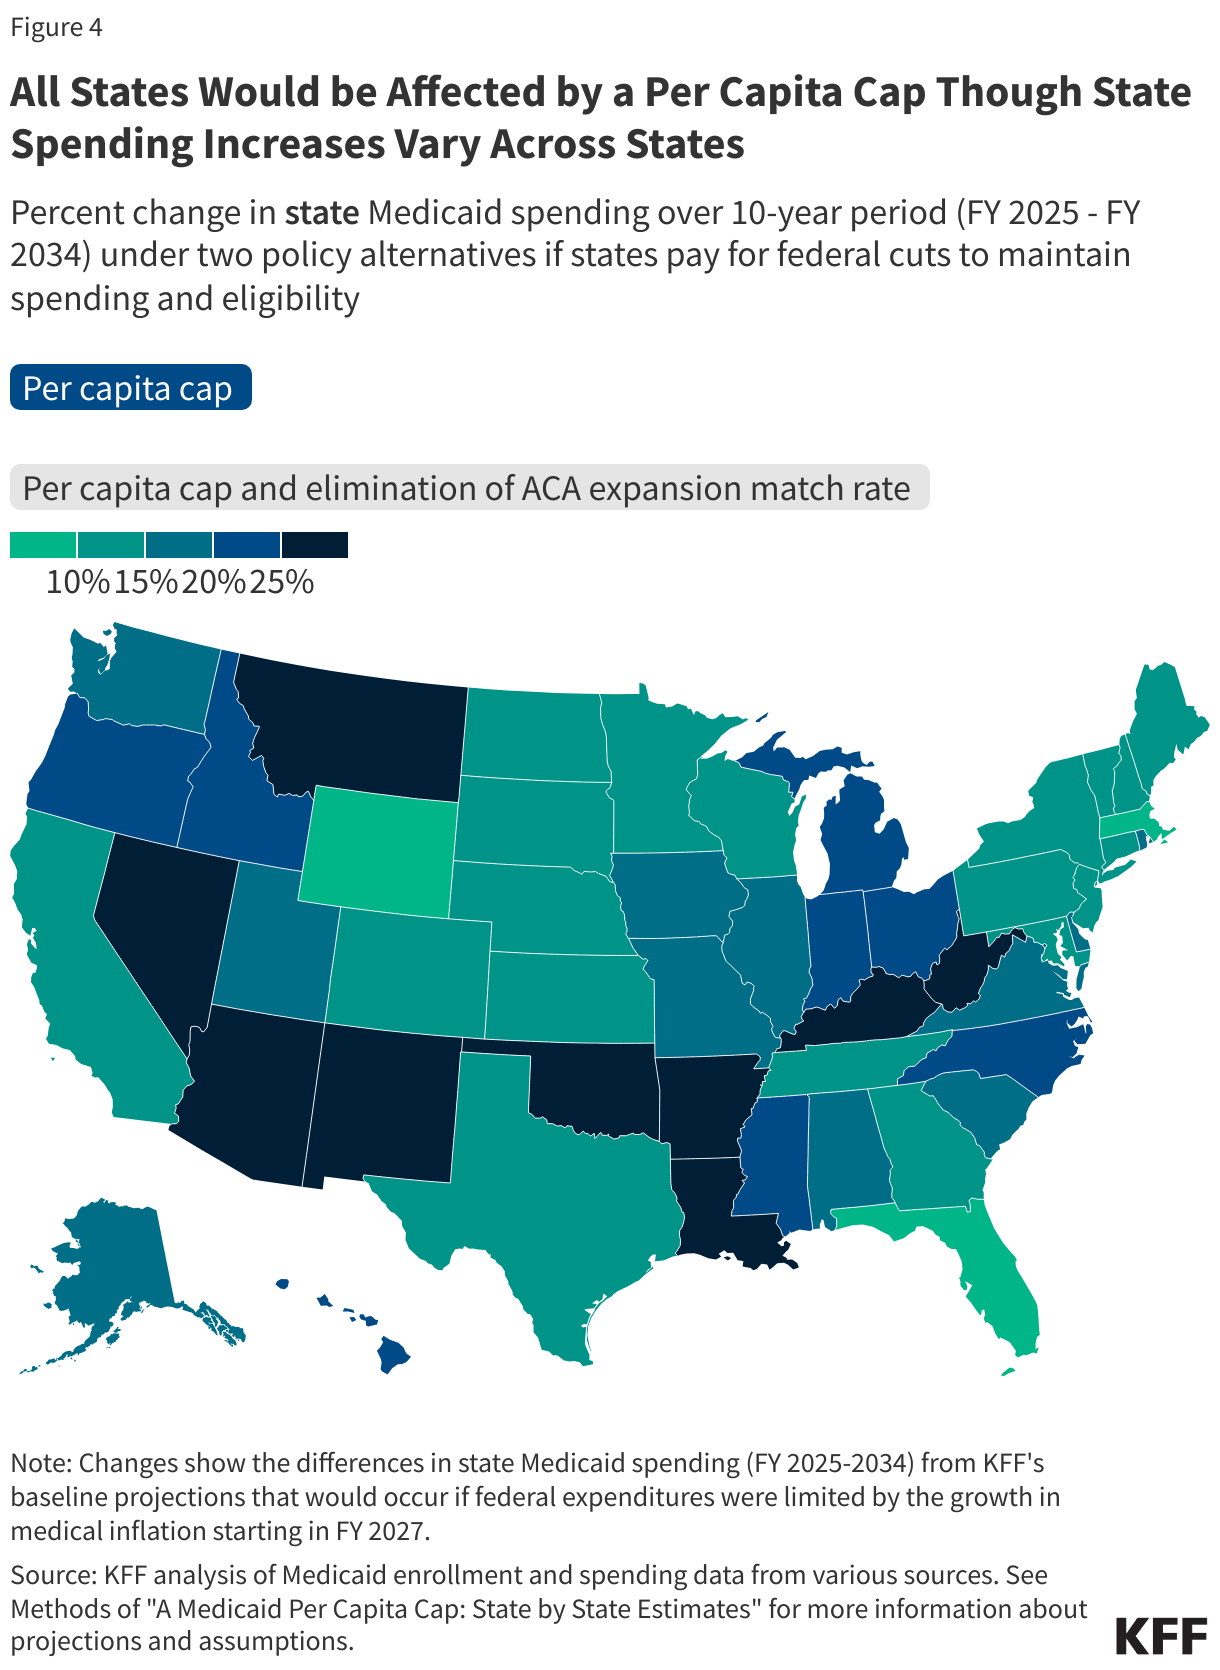
All states would be affected by a per capita cap, but the specific effects vary depending on the mix of enrollees in a state, with state spending increasing by as much as 57% in some states if paired with the elimination of the ACA expansion match rate (Figure 4). If states opted to pay for the federal Medicaid cuts, state spending on Medicaid could increase anywhere from 6% to 57% over 10 years. Expansion states could experience much larger state cost increases, ranging from 18% to 57% if the per capita cap were paired with the elimination of the ACA expansion match rate, whereas state cost increases for all non-expansion states could remain at or below 21%. While this analysis assumes that growth rates for each eligibility group are uniform across states under current policy, it’s likely that growth rates would vary by state in any given period based on policy choices and underlying factors related to their economies and health systems.
Impacts on Medicaid Spending and Enrollment if States Respond to Federal by Cutting Spending and Eligibility
The effects of per capita caps differ across eligibility groups because spending for different eligibility groups grows at different rates, with larger effects among children and adults who are not eligible because they have a disability or are ages 65 and older. The effects vary by eligibility group because spending estimates under current policy assume that per enrollee spending for each group grows at different rates (aligning with CBO per enrollee spending growth assumptions), but the per capita cap policy would limit the growth for all groups using the same inflation rate. Spending grows at different rates largely based on the percentage of spending that comes from use of long-term care for each eligibility group. Although Medicaid enrollees who use long-term care have much higher per enrollee costs, CBO expects those costs to grow more slowly in future years. By FY 2034, the decline in per enrollee spending under a per capita cap could be: 24% for expansion adults, 20% for other adults, 19% for children, 11% for people eligible because of a disability, and 6% for adults ages 65 and older.
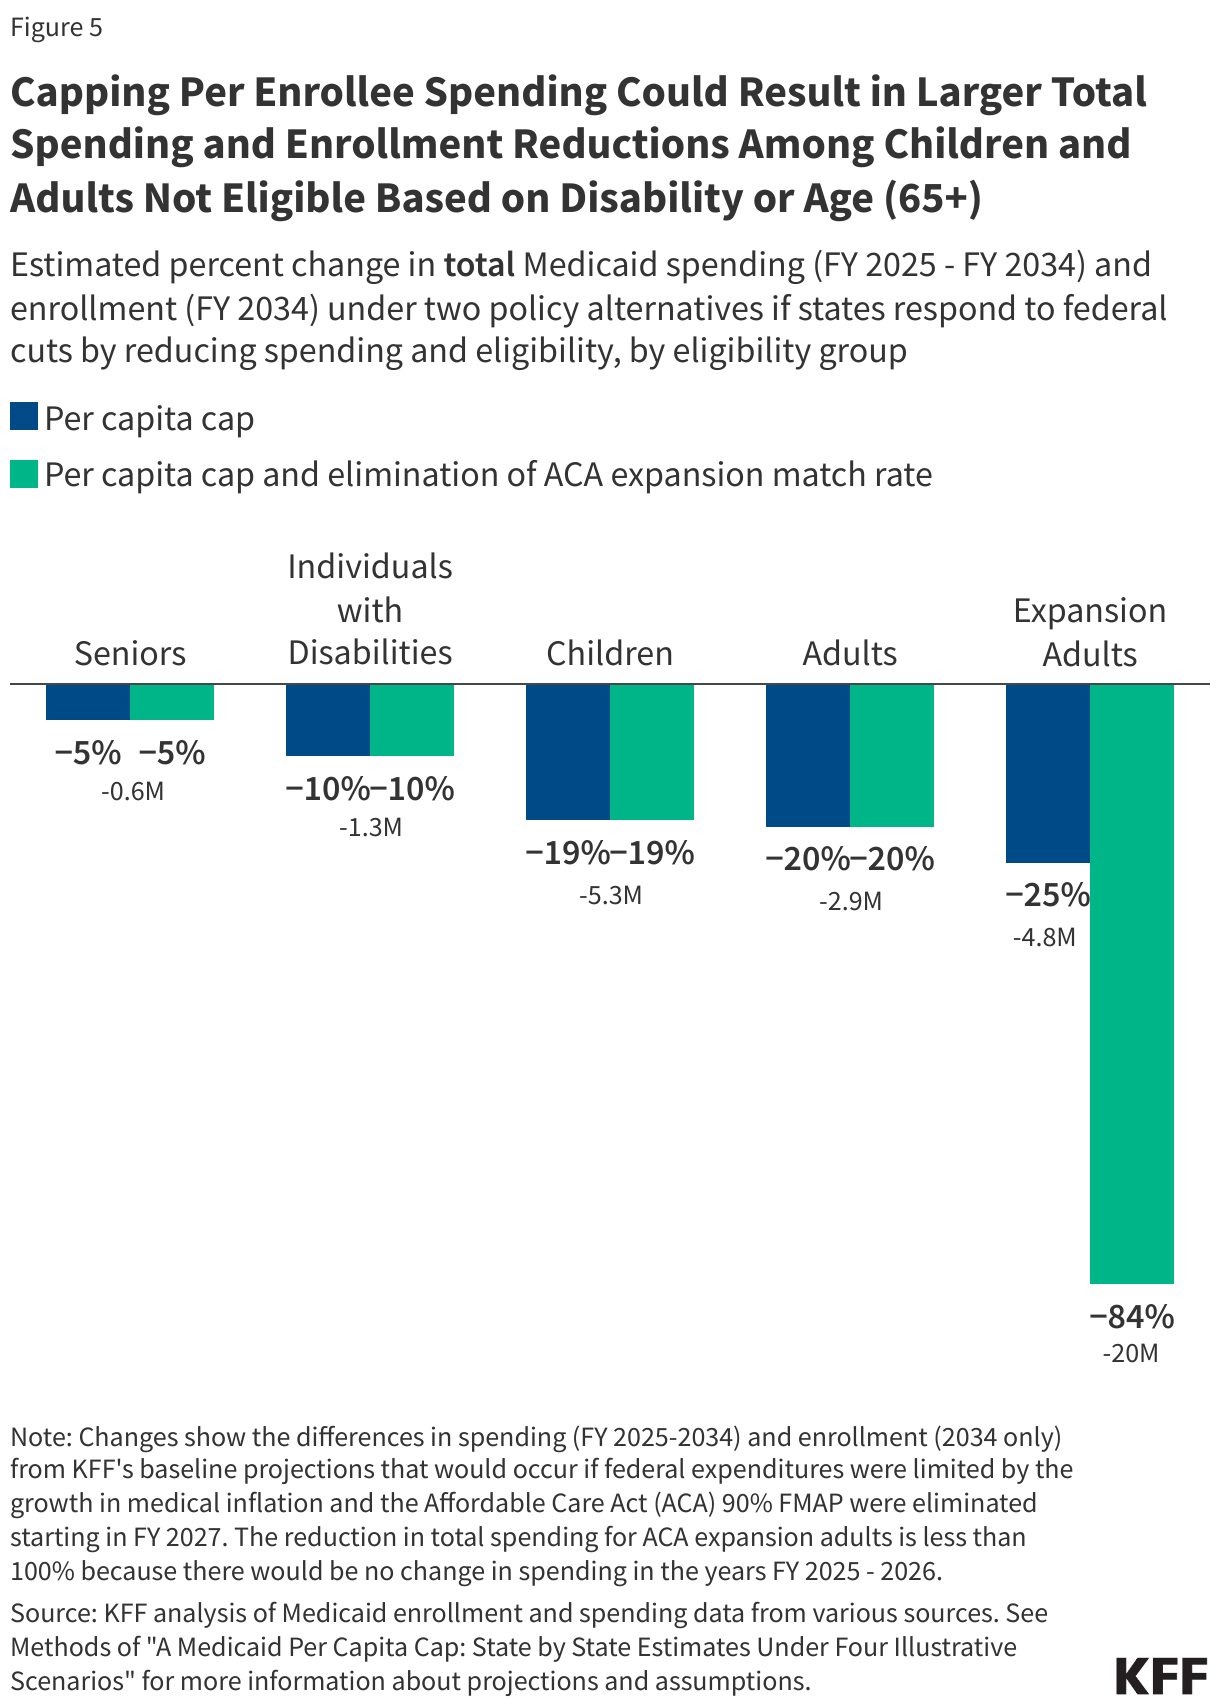
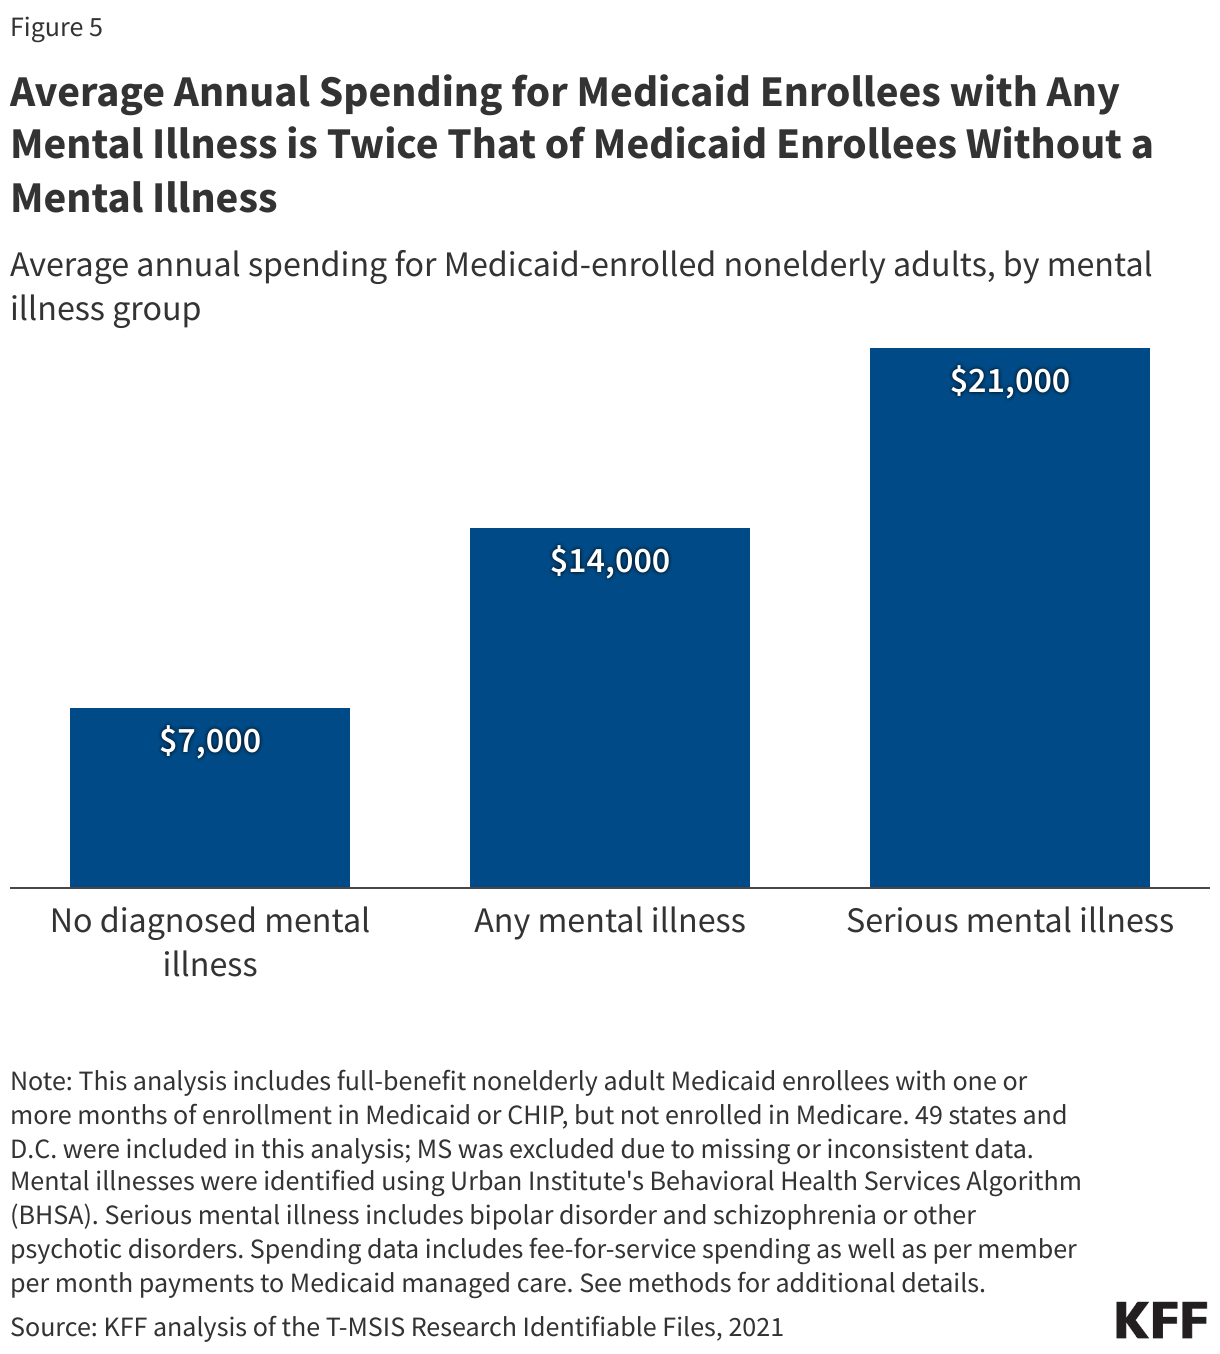
This analysis assumes that states would reduce eligibility in proportion with the cuts to federal spending, resulting in larger total spending and eligibility cuts among children and adults who are not eligible because they have a disability or are ages 65 and older (Figure 5). Under a per capita cap, total spending would drop to reflect the lower per person costs and the reductions in eligibility, which would be proportional to the cuts in federal spending. In FY 2034, an estimated 15 million fewer people could be covered by Medicaid including:
- 5.3 million children,
- 4.8 million adults eligible through the ACA expansion,
- 2.9 million parents and other adults under age 65,
- 1.3 million people with disabilities, and
- 0.6 million people ages 65 and older.
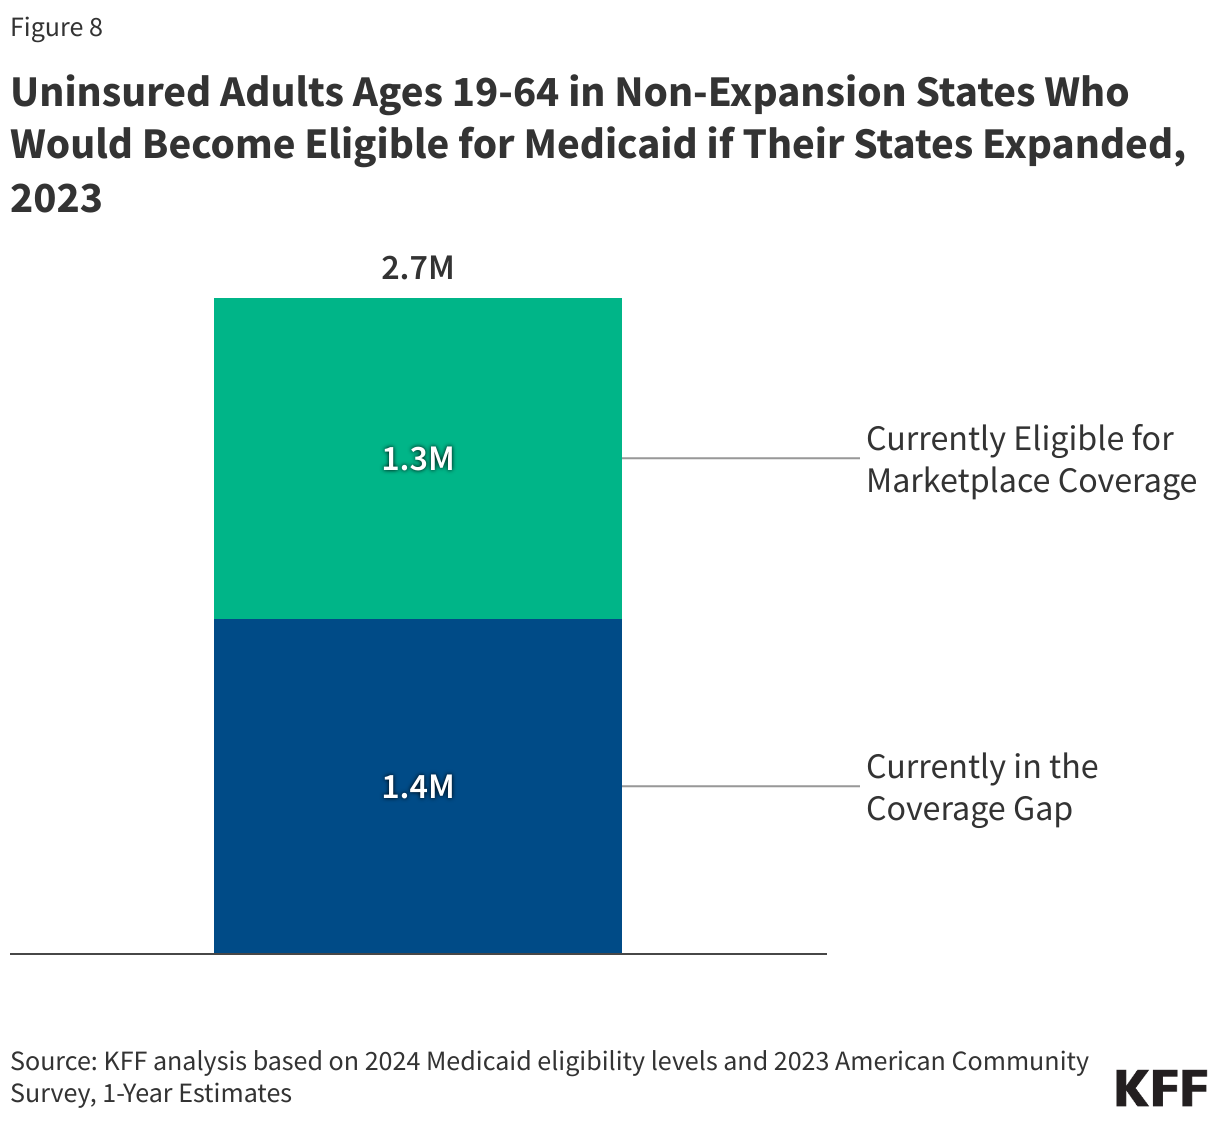
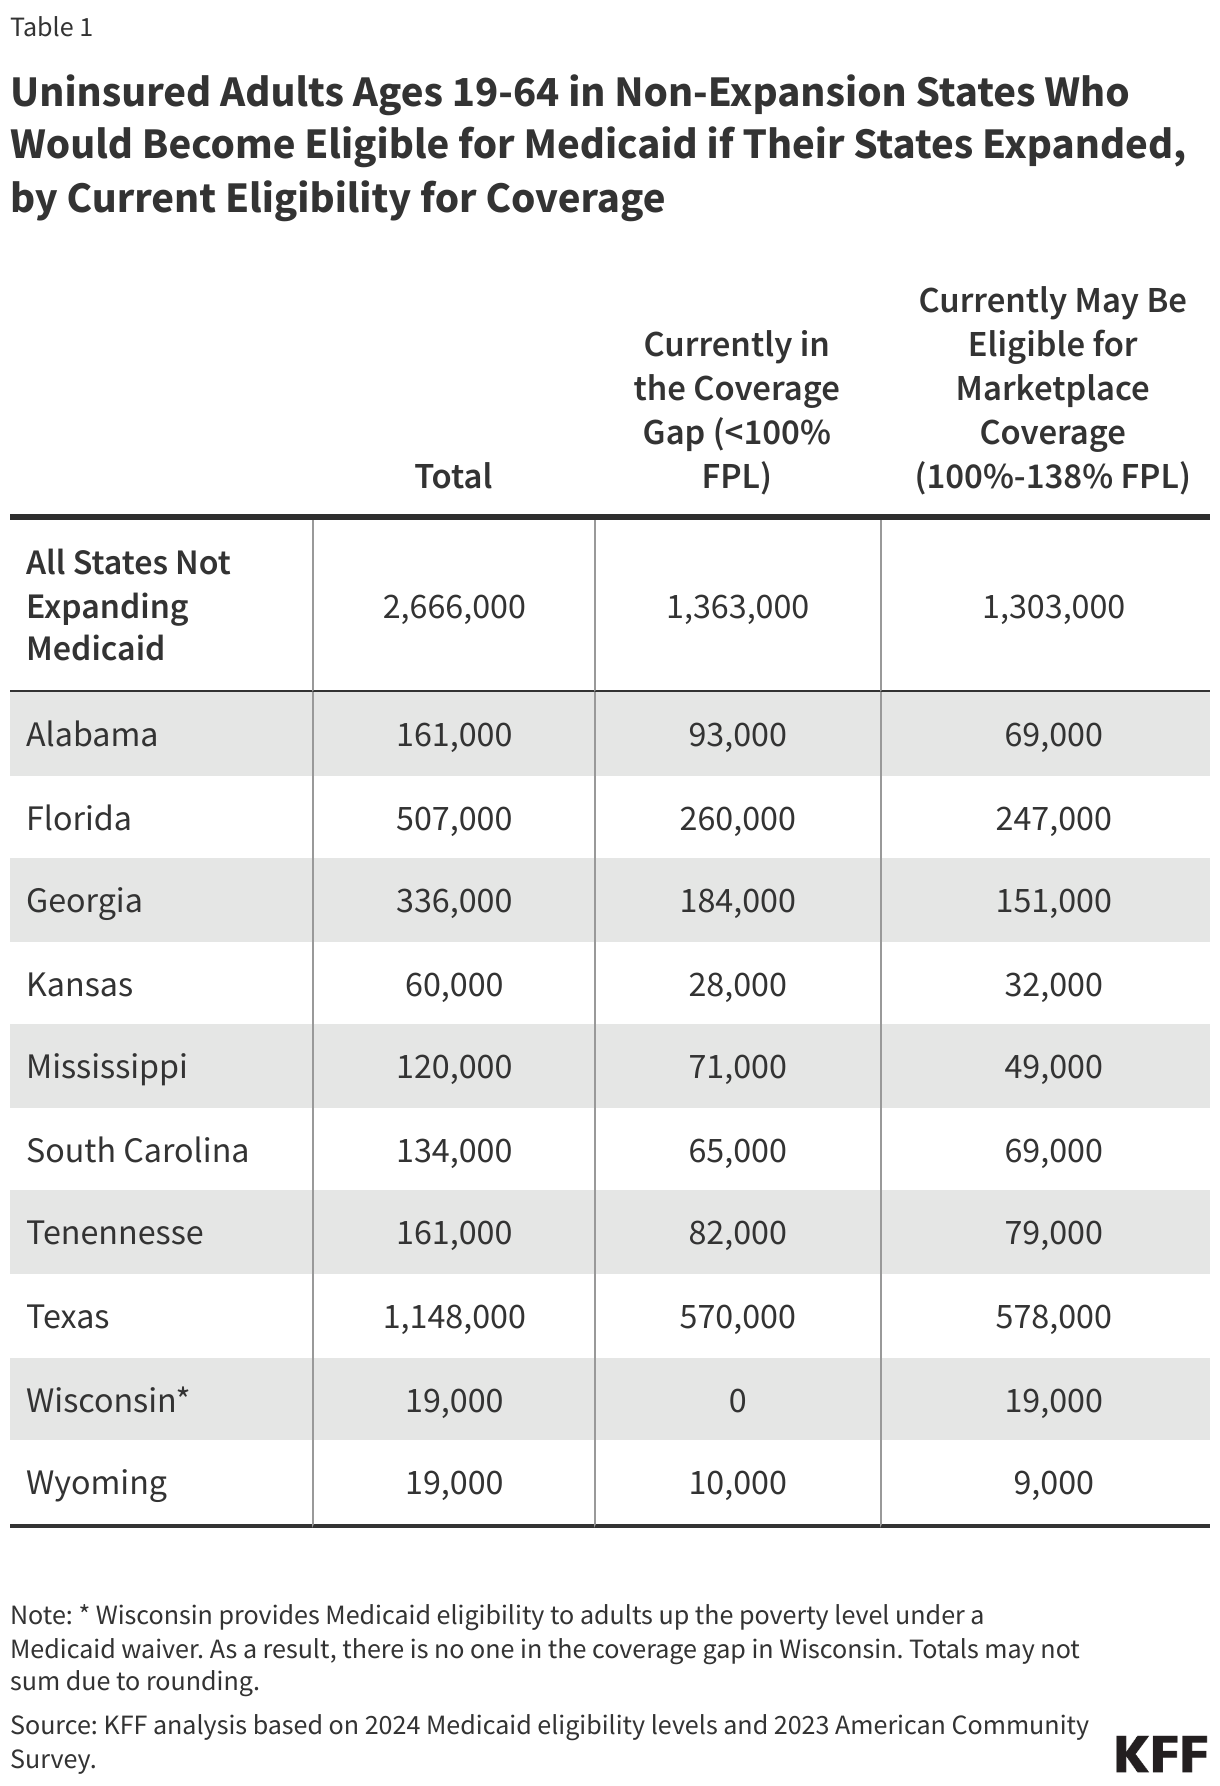
An additional 15 million expansion enrollees could lose Medicaid coverage (totaling about 20 million expansion enrollees by FY 2034) if the ACA expansion match rate is also eliminated. Some people losing Medicaid would be eligible for ACA marketplace coverage (those with incomes 100-138% of the poverty level) and others would be able to obtain employer-sponsored health insurance. But, others would become uninsured. Most people over age 65 and some who qualify for Medicaid based on a disability would generally be able to maintain Medicare coverage but could lose access to wrap-around services not covered by Medicare.
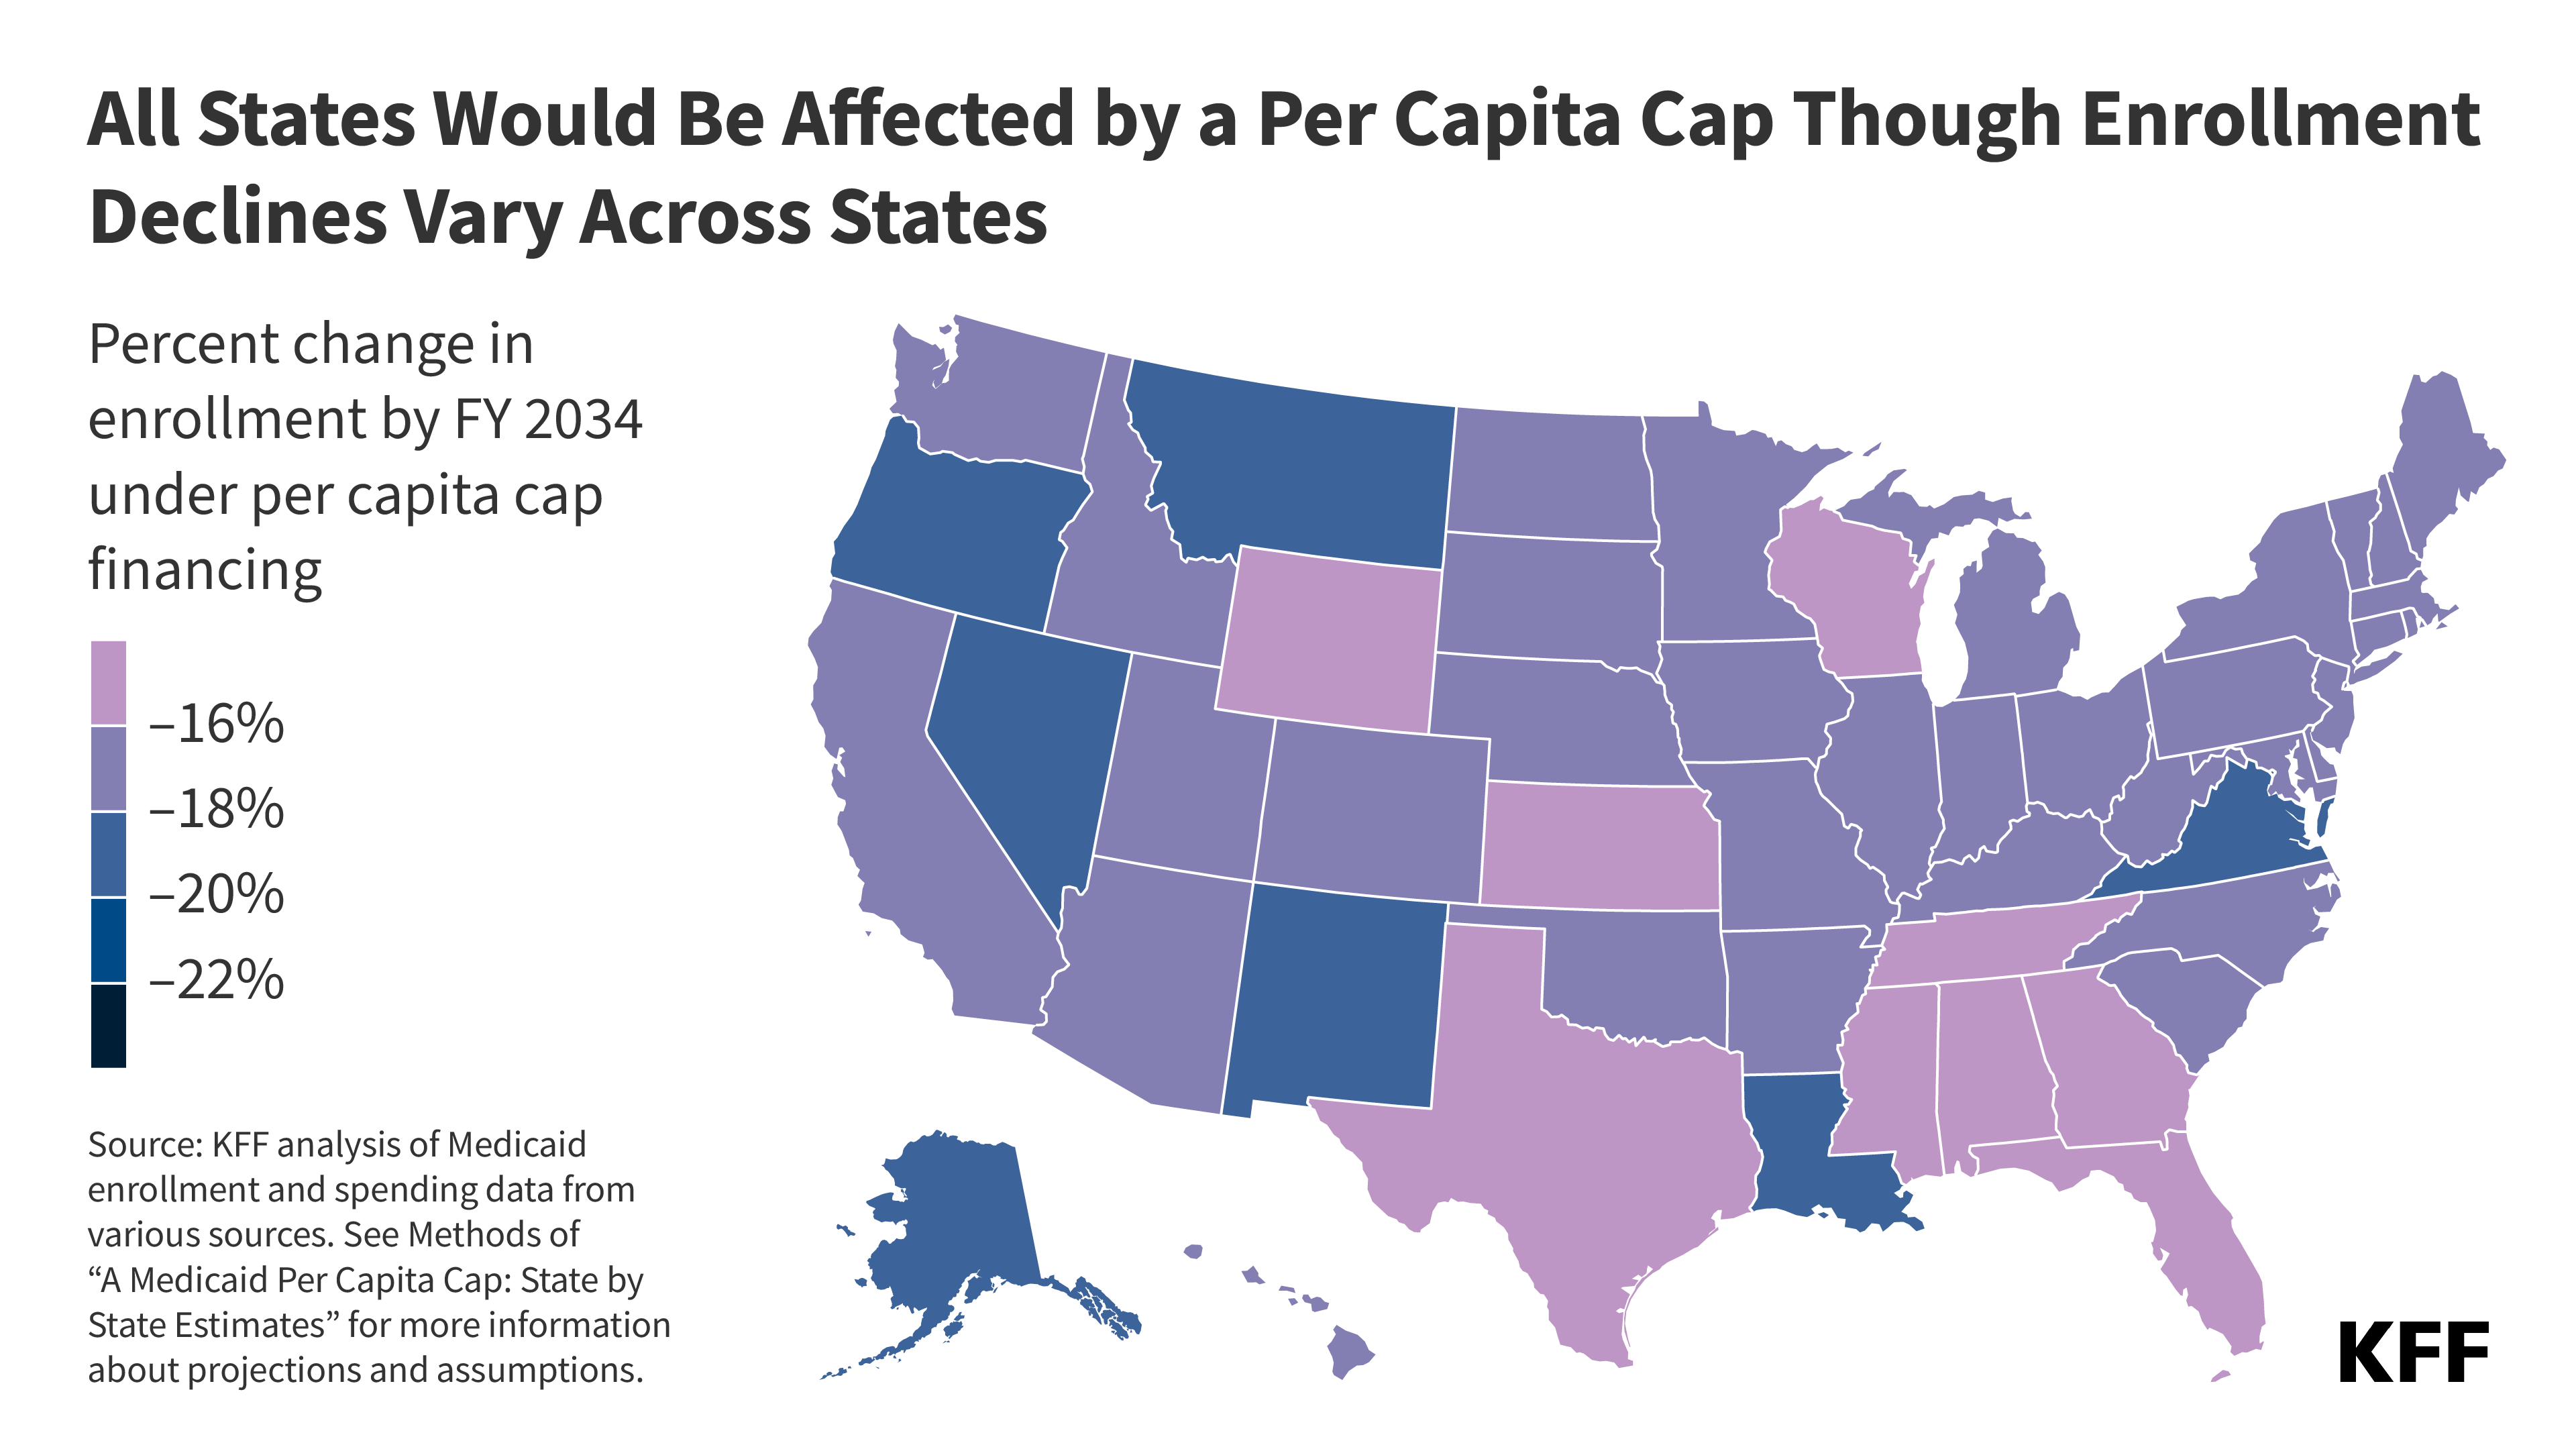
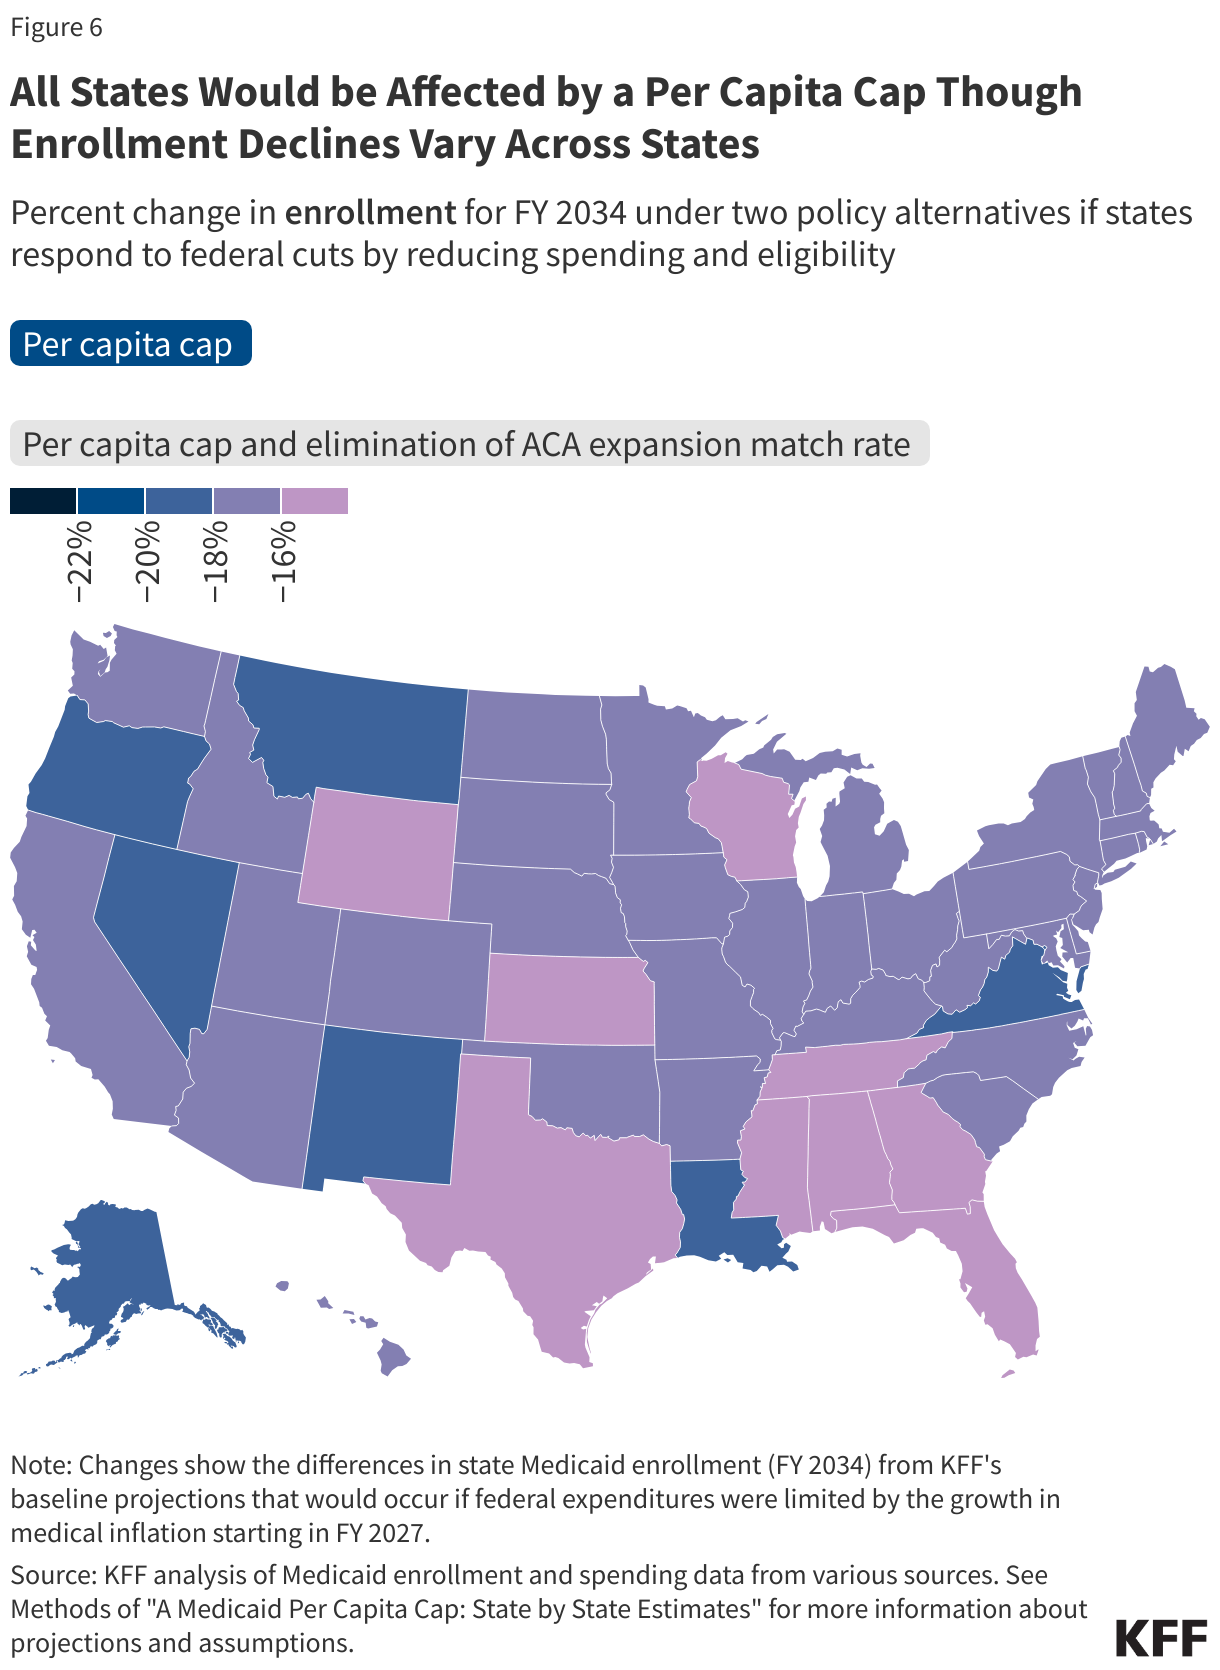
All states would be affected by a per capita cap, but the specific effects vary, with enrollment decreasing by as much as 57% in some states if paired with the elimination of the ACA expansion match rate in 2034 (Figure 6). If states respond to federal cuts by reducing eligibility, Medicaid enrollment could decrease anywhere from 12% to 57% in 2034. Expansion states could experience much larger enrollment declines if paired with the elimination of the ACA expansion match rate, ranging from 31% to 57%, whereas enrollment declines for all non-expansion states could remain at or below 17%.
What are other implications to consider?
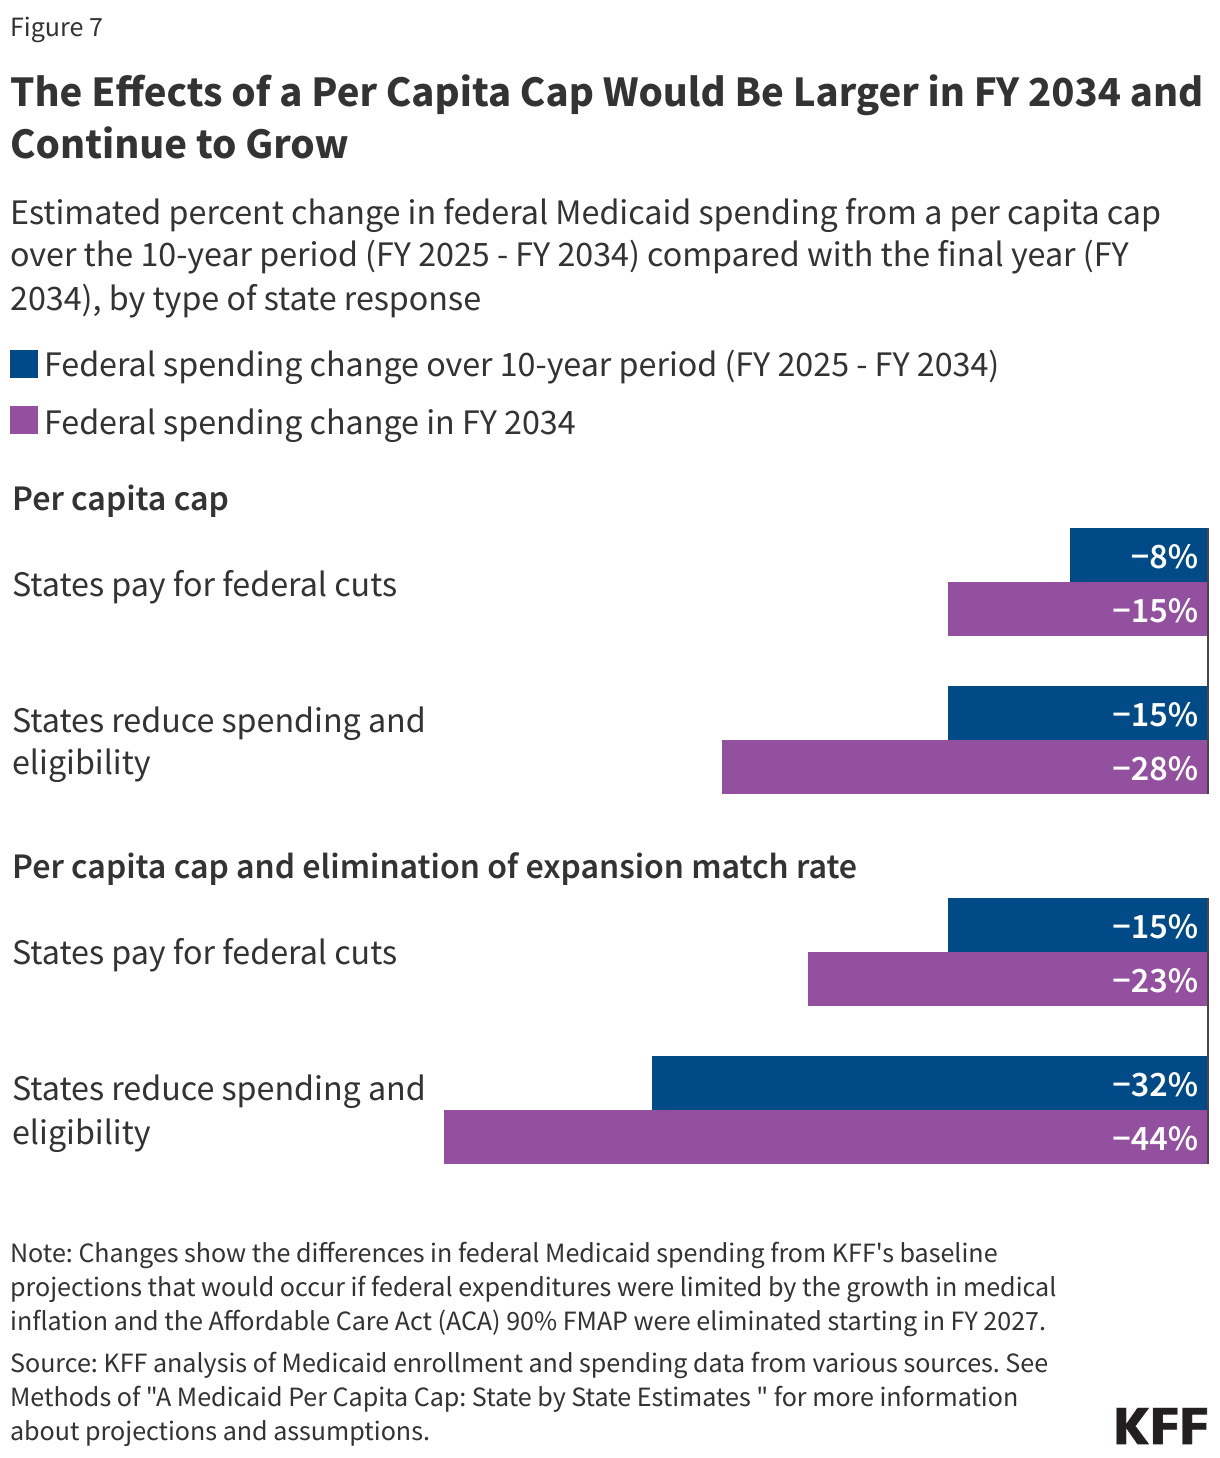
Medicaid per capita caps lock in historical spending patterns, and the effects would compound overtime so the full implications would not be visible until after FY 2034. Per capita caps are initially set to reflect historical spending patterns that vary by state and eligibility group. Spending per enrollee will grow at the same rate for all states and eligibility groups, meaning that the low-spending states today will continue to be low-spending states indefinitely, and the same is true for spending across the eligibility groups. Moreover, the caps are typically designed to constrain federal Medicaid spending growth to a rate slower than is expected under current law, which is how they achieve federal savings. As time passes, the effects compound, limiting states’ ability to meet changing needs and demands. Federal spending reductions in FY 2034, the final year of the analysis, are larger than reductions over the full 10-year period (Figure 7), and the effects on enrollment and spending in future years would continue to grow.
The effects of a per capita cap on Medicaid spending and enrollment are also highly sensitive to policy design, inflation rates, and how states respond to the cuts; and estimates are highly sensitive to assumptions about those factors. Decisions about how to calculate the per enrollee allotments for the base year and how to grow the allotments over time would determine the magnitude of costs shifted to states. The effects also depend on how much Medicaid costs grow over time and how they compare with changes in the inflator used to calculate the caps. States’ responses to the cuts would determine how much total spending and enrollment changed. If per capita caps are paired with other cuts to Medicaid, effects would be larger, and there would be more pressure on states to respond with programmatic cuts. Estimates of the effects of different per capita cap proposals may find a wide range of outcomes depending on what assumptions are made to complete the analysis.
A per capita cap would fundamentally change the Medicaid federal-state partnership by eliminating the federal guaranteed match and transferring new financial risk to states. Per capita caps allow federal spending to rise with enrollment; however, spending would not rise to account for: increasing costs due to the emergence of new technology such as cell and gene therapies, changes in population health status that increase per enrollee spending, or increased provider payment rates enacted to address workforce shortages. Medicaid is currently a partnership between the federal and state governments with both entities sharing the financial risk. Under a per capita cap scenario, federal spending would be lower and more predictable. The federal government would only bear risk associated with enrollment changes and the states would assume 100% of the risks associated with other factors that affect health care spending.
Under any per capita cap policy, states would face challenges and there would be pressure to reduce benefits and eligibility, but the effects would be larger if a per capita cap were paired with other Medicaid cuts. To maintain current policy, states would have to increase state tax revenues or decrease spending on non-Medicaid services such as education, which is the largest source of expenditures from state funds. Given the size of the federal funding cuts, states would face significant challenges in efforts to replace the loss of federal funds, which would be exacerbated if paired with other reductions in federal funding for areas beyond Medicaid. The loss of federal revenues would create significant pressure to eliminate the Medicaid expansion and restrain the growth in per enrollee spending for other enrollees. Medicaid spending per enrollee already grows at a slower rate compared with private insurance and Medicare, leaving fewer options for cutting per enrollee costs. States would all respond differently but could reduce spending by cutting optional benefits (which includes prescription drugs and nearly all home care, also known as home and community-based services or HCBS), reducing provider payment rates, or cutting eligibility for the specific eligibility groups with higher per person spending, such as those linked to the use of long-term care.
If states are unable to maintain Medicaid eligibility, benefits, and payment rates, there could be increases in the number of people who are uninsured, reduced access to care, and significant reductions in payment rates to providers. Reduced Medicaid eligibility would mean an increase in the number of uninsured people, with the most notable increases likely among people eligible for coverage through the ACA expansion, though people with disabilities may be particularly vulnerable on account of their more extensive health needs. Enrollees with incomes between 100% and 138% of poverty could be eligible for coverage through the ACA marketplaces, but ACA coverage could soon become more costly for enrollees if the enhanced subsidies expire at the end of 2025, and few low-income people have access to insurance through their employer. An increase in the number of uninsured people could reverse gains in financial security, access to care, and health outcomes as well as lead to loss of revenues and increased uncompensated care costs for providers. Providers could also face revenue losses from lower Medicaid payment rates or coverage of fewer services, which could exacerbate issues with access to care for Medicaid enrollees and within the health care system more broadly.
Appendix
Methods
Data: To project Medicaid enrollment, spending, and spending per enrollee by state and eligibility group, this analysis uses the Medicaid CMS-64 new adult group expenditure data collected through MBES for FY 2023 (downloaded in December 2024), Medicaid new adult group enrollment data collected through MBES for June 2024 (downloaded in December 2024), the 2019-2021 T-MSIS Research Identifiable Demographic-Eligibility and Claims Files, and the June 2024 Congressional Budget Office (CBO) baseline.
Overview of Approach:
- Develop baseline projections of Medicaid enrollment, spending, and spending per enrollee by state and eligibility group from FY 2025 through FY 2034 (a 10-year period). This model estimates Medicaid enrollment and spending under the status quo with no policy changes.
- Estimate Medicaid enrollment, spending, and spending per enrollee by state and eligibility group over the same 10-year period after accounting for the effects of proposed policy changes.
- Calculate differences in Medicaid enrollment, spending (including federal, state, and total spending), and spending per enrollee in the policy change scenario relative to the baseline projections.
- The estimates do not predict states’ responses to federal policy changes, but we examine differences in Medicaid enrollment, spending, and spending per enrollee under different scenarios to reflect the range of outcomes depending on state responses.
Definitions and Limitations:
- At the time of publishing, CBO had released their January 2025 baseline. However, this analysis uses CBO’s June 2024 baseline because it was the most recent baseline with spending projections by Medicaid eligibility group.
- The estimates assume that all states experience the same growth rates for Medicaid enrollment and spending; and that total spending grows at the same rate as federal spending.
- FMAP calculations do not account for the other services that are matched at a higher rate, which include family planning, services received through an Indian Health Services facility, expenditures for Medicare beneficiaries enrolled in the “Qualifying Individuals” program, and health home services that are matched at a 90% rate. For this reason, the model may underestimate the federal share of spending in some states.
- Estimates of total spending include all spending that is matched as medical assistance but exclude states’ administrative costs which are matched at a separate rate. Federal payments for administrative costs are less than 4% of total federal spending, according to the CBO June 2024 baseline.
- The analysis does not account for secondary effects or people’s behavioral responses.
- The analysis does not include policy effects for states that had not expanded Medicaid under the ACA as of February 2025 but would have done so in the absence of the policy change.
- We implement the elimination of the expansion FMAP in FY 2026 and the per capita cap in FY 2027; we assume they take effect immediately.
- To implement a per capita cap, this analysis uses CPI-U + 0.4% instead of CPI-M because projections of CPI-M are not available. Studies and data show that in any given year, either measure may be higher so it’s unclear whether savings would be larger or smaller using a different measure. We chose to add 0.4% to CPI-U because over the past 20 years, CPI-M was 0.4% higher than CPI-U.
We provide more details about the baseline model below.
1. Estimate initial Medicaid spending and enrollment by eligibility group using the most recent years’ data available (FY 2023 for spending data and FY 2024 for enrollment data).
-
- First, we pull the quarterly Medicaid CMS-64 new adult group expenditure data collected through MBES for FY 2023 and aggregate total spending by state for enrollees in the ACA expansion group and for all other Medicaid enrollees. Spending reflects an accrual basis of accounting.
- We exclude spending on DSH by calculating the share of spending on DSH from the FY 2023 CMS-64 Financial Management Report and reducing medical assistance among non-expansion enrollees by that share.
- Separately, we pull the Medicaid new adult group enrollment data collected through MBES for June 2024. This data includes enrollment by state and is broken into ACA expansion group enrollees and all other Medicaid enrollees. MBES enrollment includes individuals enrolled in limited benefit plans and only includes individuals whose coverage is funded through Medicaid (not CHIP).
- To obtain spending and enrollment estimates across the remaining eligibility groups (seniors, individuals with disabilities, children, and other adults), we apply the distribution of spending and enrollment across the groups and by state from T-MSIS to the FY 2023 spending data and June 2024 enrollment data. We use the average distribution from 2019 to 2021 to mitigate the impact of the continuous enrollment provision (data in states denoted as “unusable” for a given year by the DQ atlas were excluded from the averages).
2. Calculate initial spending per enrollee in FY 2024.
-
- We grow Medicaid spending in FY 2023 by CBO’s growth rates for federal benefit payments by eligibility group to get Medicaid spending in FY 2024. The June 2024 enrollment data is used as our FY 2024 enrollment.
- We divide Medicaid spending in FY 2024 by Medicaid enrollment in FY 2024 (for each state and eligibility group) to get Medicaid spending per enrollee in FY 2024.
3. Project total spending and spending per enrollee for fiscal years 2025 through 2034 using CBO growth rates and use those estimates to calculate future years’ enrollment.
-
- Starting with spending data for FY 2024, we apply the CBO growth rates to estimate Medicaid spending in FY 2025 through FY 2034.
- Starting with per enrollee spending in FY 2024, we apply the CBO growth rates for average federal spending on benefit payments per enrollee to estimate Medicaid spending in FY 2025 through FY 2034.
- We calculate enrollment growth in FY 2025 through FY 2034 by dividing estimated Medicaid spending by estimated spending per enrollee.
4. Split total Medicaid spending over the 10-year period into federal and state spending.
-
- We calculate federal and state spending by using a 90% match rate for the ACA expansion group and the traditional state FMAPs for the remaining eligibility groups. We use the FY 2025 FMAPs for FY 2025 and FY 2026 FMAPs for FY 2026 and beyond.
We provide more details about the policy change scenarios below.
1. Calculate spending and spending per enrollee under a per capita cap if states pay for federal cuts to maintain spending and eligibility by state.
-
- Assume expansion enrollment and total spending remain the same as the baseline model over the 10-year period.
- Establish the base year of per capita spending as the lessor of FY 2025 or FY 2027. We chose FY 2025 because most per capita cap proposals use spending from the period prior to enactment of the law to prevent states from inflating their base estimates of per capita spending in response to the law. We assume the per capita cap takes effect in FY 2027, so FY 2025 and FY 2026 per enrollee spending are the same as baseline and FY 2027 per enrollee spending is the same as the base year. We also assume that if states’ per enrollee spending for an eligibility group dropped between FY 2025 and FY 2027, the per capita cap would start at the lower baseline level to avoid giving states a higher match rate than they would have received under current policy.
- After FY 2027, growth in per enrollee spending is capped at estimated medical inflation levels. To estimate medical inflation, we use CPI-U (Consumer Price Index for All Urban Consumers) + 0.4%, which is the difference in CPI-U and CPI-M (CPI Medical Care) over the past two decades.
- Calculate new federal spending levels based on the capped per enrollee amounts by first multiplying enrollment and new per enrollee levels and then calculating the federal share using the FMAP.
- For the combined per capita cap and elimination of the ACA expansion match rate, we assume the elimination of the expansion FMAP takes effect in FY 2027, so FY 2025 and FY 2026 federal and state spending are the same as baseline. Starting in FY 2027, we apply the 2026 traditional state FMAPs to the expansion group spending instead of the 90% rate to split total spending into the federal share.
- State spending is calculated as the difference between baseline total spending (held constant) and new reduced federal spending levels.
2. Calculate spending and enrollment if states respond to federal cuts by reducing spending and eligibility by state.
-
- Per enrollee spending is capped and grown at CPI-U + 0.4% starting in FY 2027 (same as above).
- Enrollment for each eligibility group is reduced by the same percentage that federal spending has been cut each year. This increases each year, but reaches 24% for expansion adults, 20% for other adults, 19% for children, 11% for people eligible because of a disability, and 6% for adults ages 65 and older by FY 2034. The total federal spending reduction and resulting total enrollment reduction are not equivalent due to differences in the distribution of spending and enrollment across groups.
- For the combined per capita cap and elimination of the ACA expansion match rate, starting in FY 2027, expansion enrollment is reduced to zero, leading to zero total spending for expansion enrollees for FY 2027 – FY 2034.
- Calculate total spending for other eligibility groups by multiplying new enrollment by capped per enrollee levels.
- Split total Medicaid spending for other eligibility groups into federal and state spending using traditional state FMAPs.
3. Calculate differences in Medicaid enrollment, spending (including federal, state, and total spending), and spending per enrollee relative to the baseline projections.
 National Hospital Spending
 The Hospital Industry
 Rural Hospitals
 Use of Hospital Care
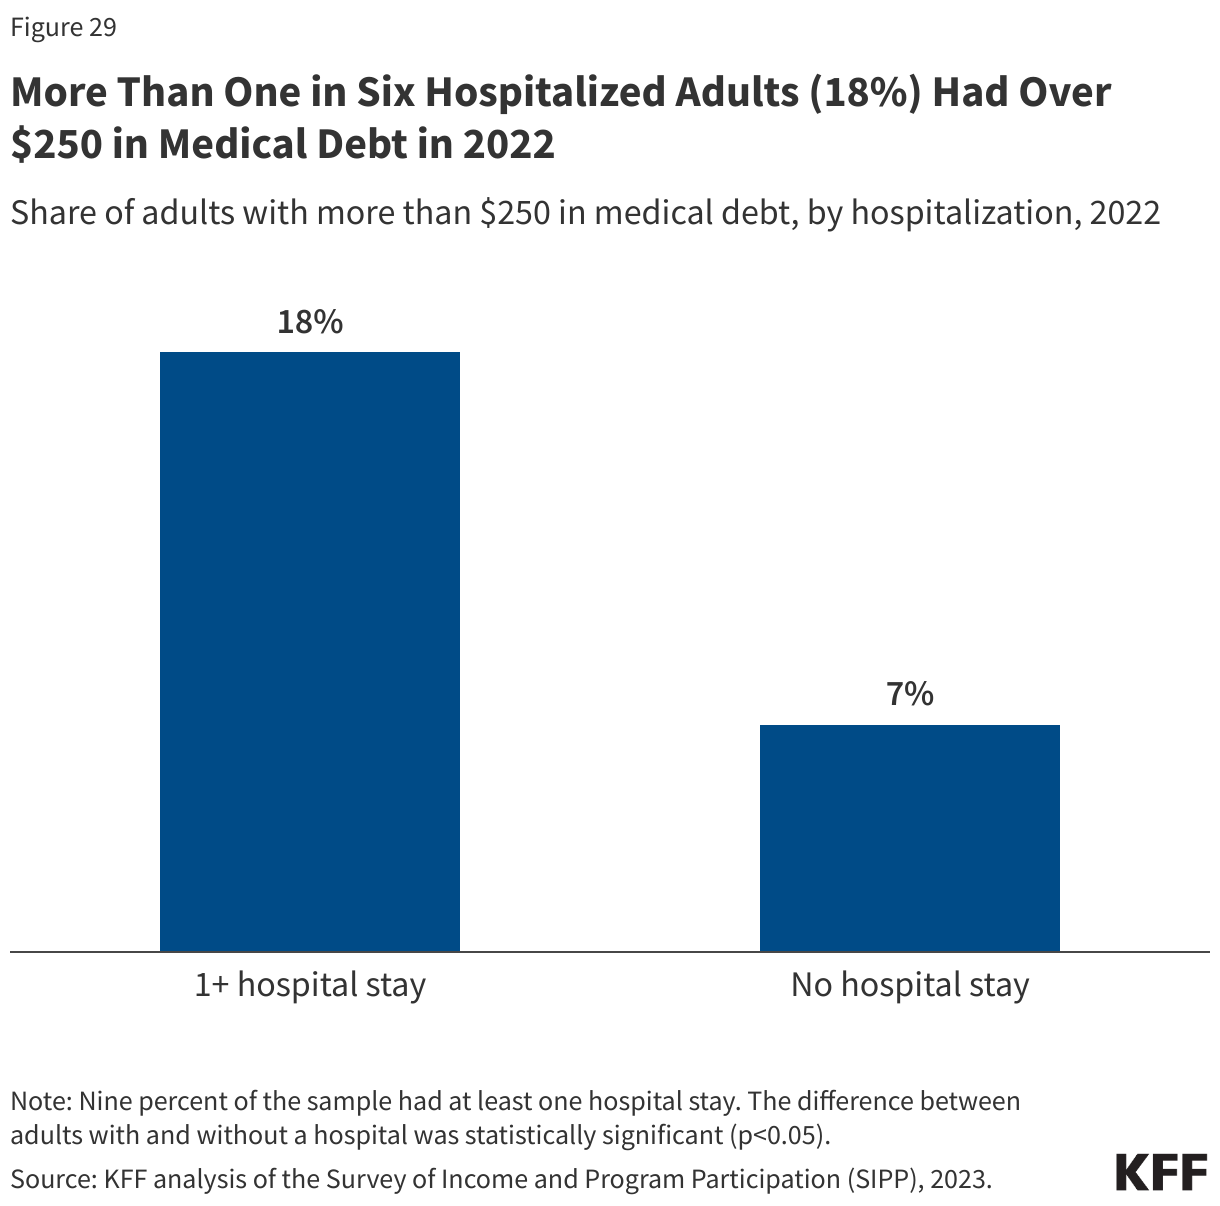
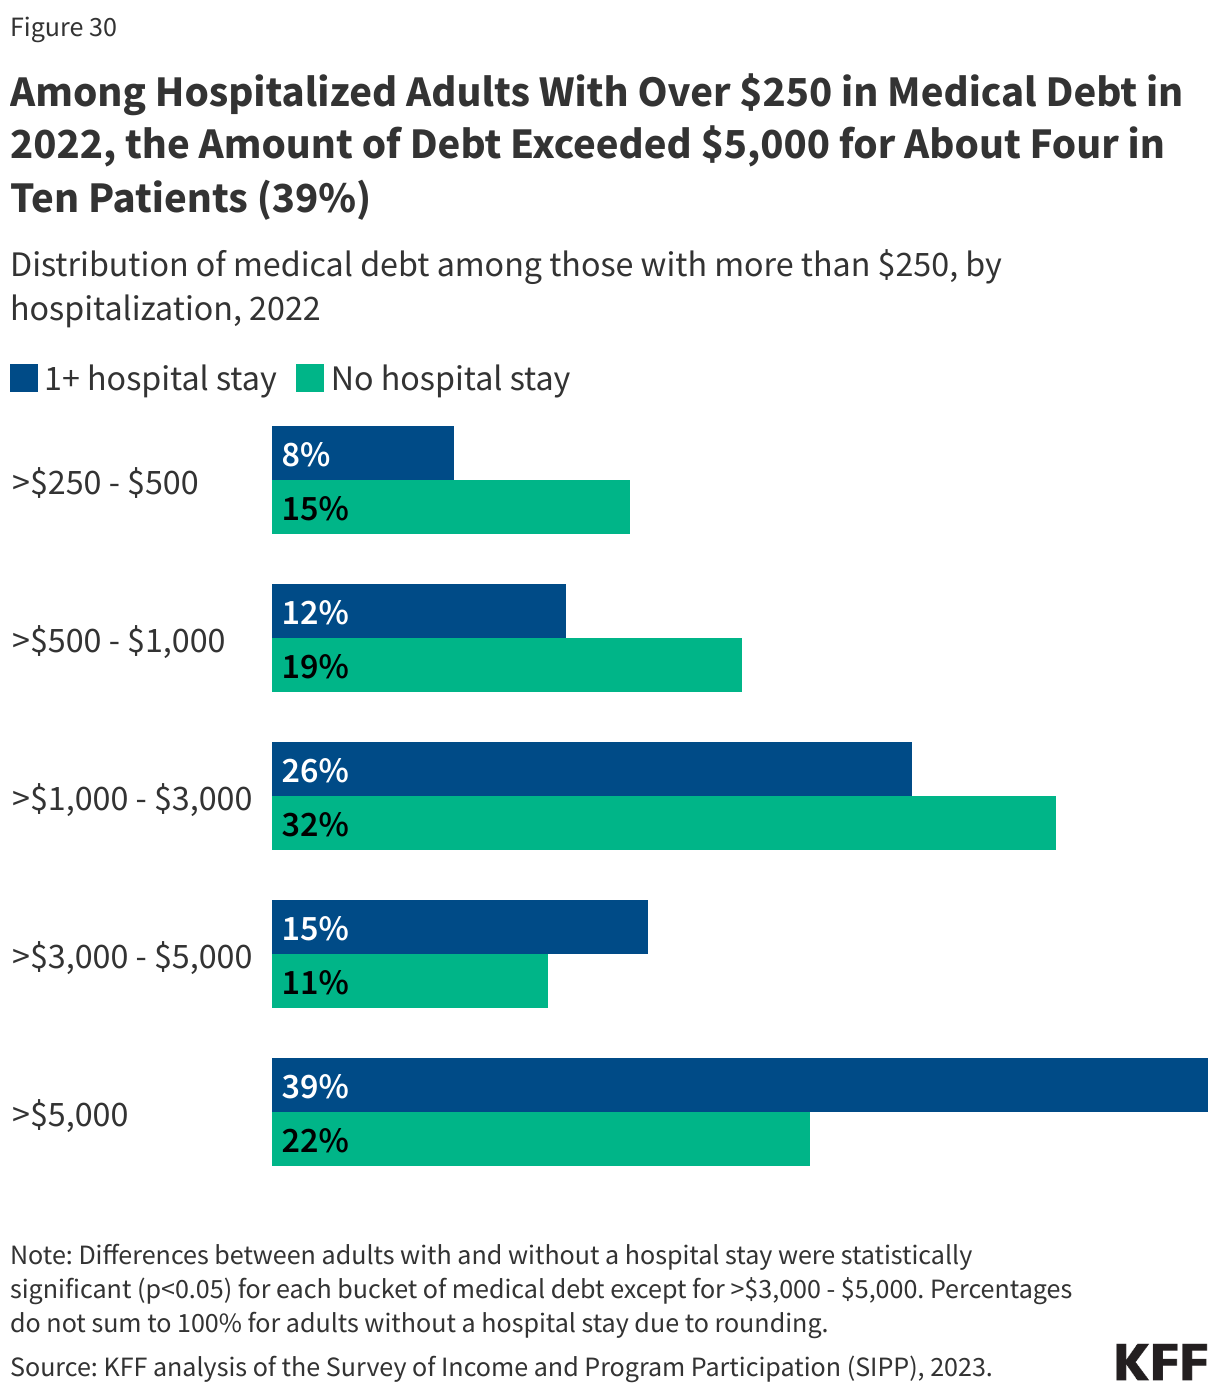
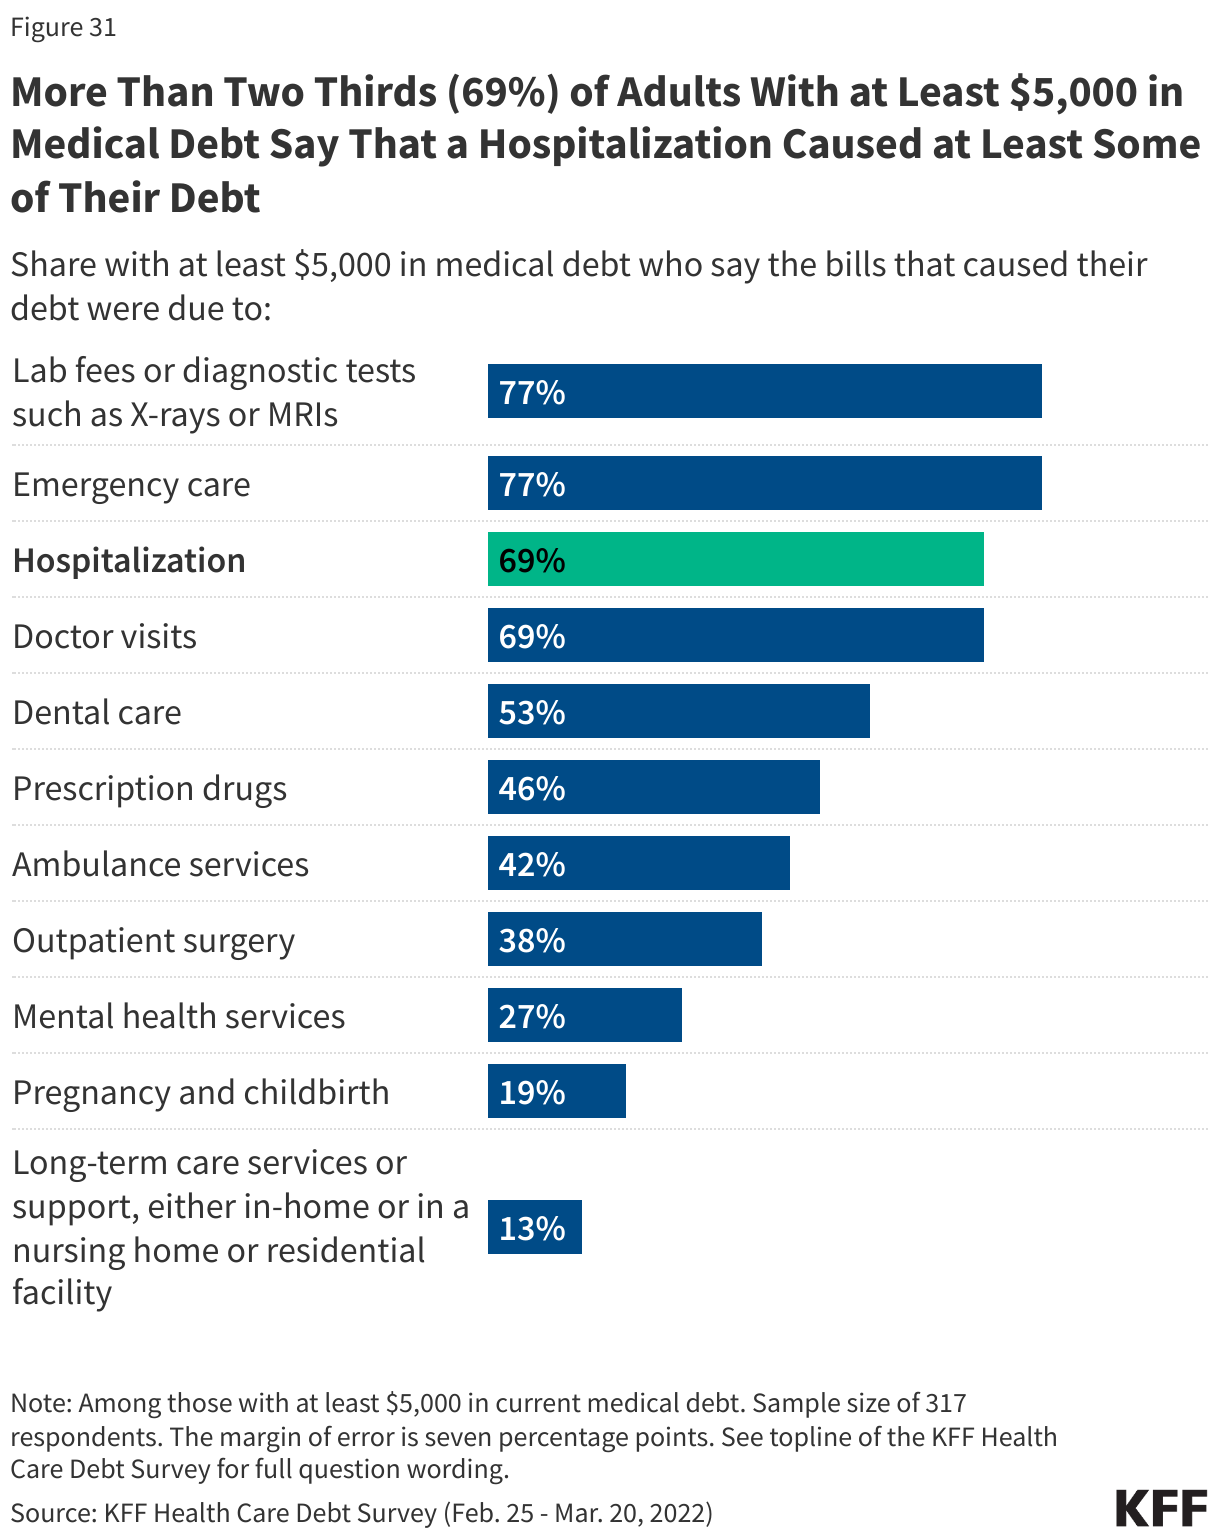
 Out-of-Pocket Spending and Medical Debt
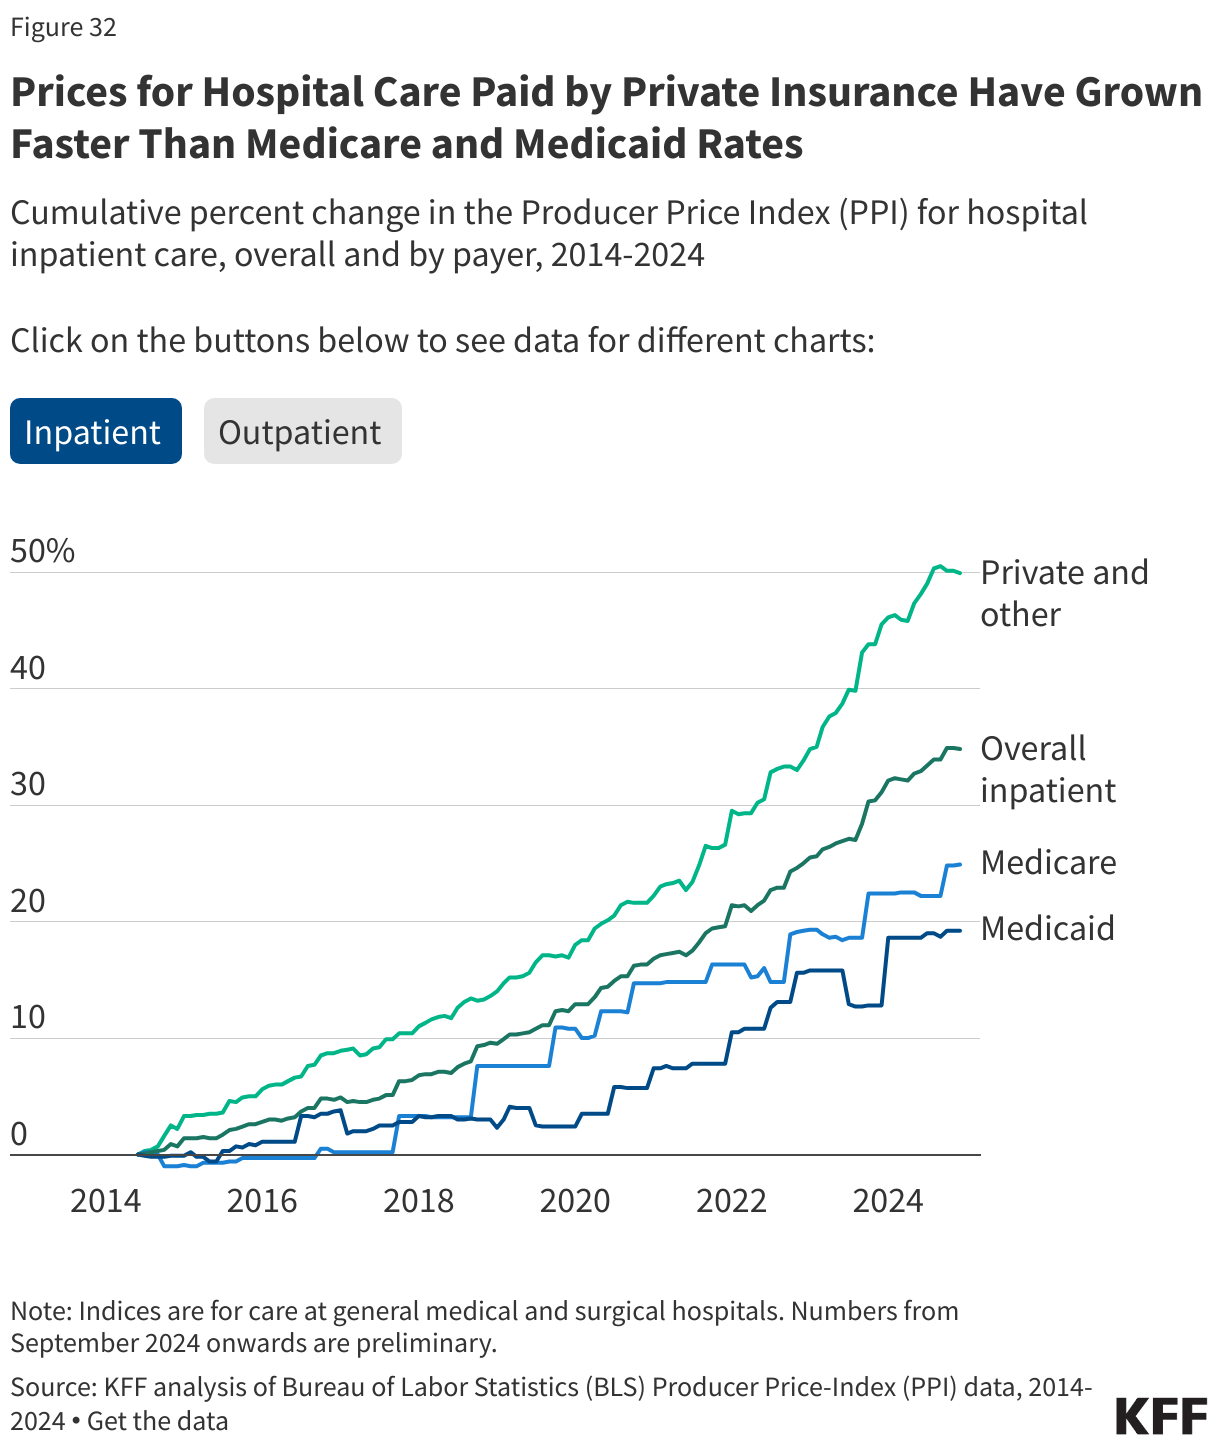
 Hospital Prices
 Hospital Finances
 Charity Care