KFF designs, conducts and analyzes original public opinion and survey research on Americans’ attitudes, knowledge, and experiences with the health care system to help amplify the public’s voice in major national debates.
The overarching focus for a public health system is to help with disease prevention, health promotion, and to close gaps in health disparities in groups of people. These groups can range from small communities to populations at the national and even global levels. Public health’s focus on health equity in groups of people can be contrasted with clinical medicine, which is mostly focused on preventing and treating illness in individuals.
Box 1: Selected Definitions of “Public Health”
“the science and art of preventing disease, prolonging life, and promoting health through the organized efforts and informed choices of society, organizations, public and private communities, and individuals.” – C-E A. Winslow (1920)
“the fulfillment of society’s interest in assuring conditions in which people can be healthy” – Institute of Medicine (1988)
“collective effort to identify and address the unacceptable realities that result in preventable and avoidable health outcomes, and it is the composite of efforts and activities carried out by people committed to these ends” – Turnock (2001)
“what we do together as a society to ensure the conditions in which everyone can be healthy.” – DeSalvo, et.al (2017)
A Brief History of Public Health in the U.S.
In the United States, public health evolved as a practice and a discipline over time with roots that extend back to the early history of the nation (the first governmental public health agency, the Marine Hospital Service, was formed in 1798). As scientific understanding about causes and effective interventions for diseases improved over time, public health practices evolved and expanded across the country. The 19th century saw a “great sanitary awakening” in the U.S., as illness came to be understood as an indicator of poor social and environmental conditions, and investments in hygiene and sanitation grew to combat disease in communities around the country, especially in large cities. After the U.S. Civil War, states began to set up boards of health to oversee growing investments and attention to public health activities in communities. The first state-level agency for public health was created in New York in 1866; Massachusetts established its first state board of health in 1869 and other states and jurisdictions followed. As the understanding of the germ theory of disease grew, state and local health departments created infectious disease laboratories in the 1890s. In the early to mid-20th century, state and local health departments grew in size and responsibilities and many of the public health interventions and focus areas that we see today were established and expanded.
In addition, a number of milestones occurred in the 20th century to grow the federal government’s role in public health, including new legislation such as the Food and Drug Act of 1906 (allowed federal oversight of manufacture, labeling and sale of foods) and the Sheppard-Towner Act of 1922 (authorized federal government funding of state-level public health efforts for the first time, in this case for maternal and child health programs). As part of the social welfare reforms undertaken via the “New Deal” in the 1930s and the “Great Society” in the 1960s, federal responsibilities, oversight, and funding for public health grew significantly. Many core federal departments and agencies we still have today were established during this period. From the late 1960s through today, U.S. public health efforts have experienced periods of decline and periods of growth often linked with broader social trends, changing perceptions about health threats, and economic and fiscal conditions in the country. During the first Trump Administration and continuing through the Biden Administration, the COVID-19 pandemic represented one of the greatest public health challenges of the last 100 years and led to an expansion of the government’s public health response. However, the expansion has proven temporary and during the second Trump Administration, public health efforts face resource cuts and an uncertain future.
Public health powers and responsibilities derive from the U.S. Constitution and are shared across federal, state, and local levels of government – each of which has unique roles in such efforts that can vary state by state and even community by community. While many of public health efforts are funded and implemented through public (i.e. governmental) programs, private actors are also involved in funding and delivering public health services in the U.S. Given the many actors involved and the variations across federal, state and local roles and approaches, public health in the U.S. has often been referred to as a “patchwork” system.
Key Public Health Frameworks, Services, Capabilities and Characteristics
Public health efforts are typically guided at the broadest level by strategies or frameworks outlining the services, capabilities and activities that help deliver on the mission to protect and promote communities’ health. A key framework for U.S. public health over the last few decades has been the 10 Essential Public Health Services (EPHS) framework, originally developed in 1994 by a federal workgroup (with input from outside experts), and updated in 2020. The EPHS highlights ten key public health service areas that include: monitoring population health status and community needs, investigating and addressing hazards and health problems, and using legal and regulatory actions to improve and protect the public’s health (see Table 1).
The “Foundational Public Health Services (FPHS)” framework is another key resource. This framework emerged from a 2013 convening of stakeholders who, in response to a recommendation from the Institute of Medicine, set out to define “a minimum package of public health capabilities and programs that no jurisdiction can be without.” The FPHS, which is now overseen by the Public Health Accreditation Board (PHAB), outlines eight “foundational capabilities” and five “foundational areas” that are central for delivering public health services to communities (see Table 2). These foundational areas include: communicable disease control, environmental public health, and maternal, child & family health, while foundational capabilities include assessment & surveillance, emergency preparedness & response, and communications.
The EPHS and FPHS frameworks overlap but are also seen as complementary, with the EPHS describing activities the public health system overall should undertake in communities, and the FPHS representing a minimum package of governmental public health activities that should be present everywhere.
Other strategies and frameworks have been formed and shaped through numerous governmental and non-governmental expert bodies and reports. Particularly influential have been recommendations and guidance from the National Academy of Medicine (previously the Institute of Medicine), which published a milestone report on the U.S. public health system in 1998 and key follow-up reports in 2002 and 2017.
In addition to these frameworks and capabilities, public health can be identified through certain defining characteristics, which include:
Being science-based. Effective public health policies and activities draw from the best available science and evidence and are adapted and updated as new information and scientific understanding improves.
Focusing on prevention. Ultimately, the goal of public health interventions is to prevent disease or otherwise improve health outcomes in groups of people. When public health works, the result is often the absence of disease, and/or longer, healthier lives in a community. This means the benefits derived from public health interventions – disease prevented – are often unseen and hard to quantify.
Addressing health inequities. Underlying the public health approach is a recognition that all people have an equal right to better health. However, in reality there are significant health disparities across different demographic groups and geographic areas. Therefore, public health interventions often emphasize addressing health needs in underserved, marginalized, disadvantaged, and otherwise vulnerable populations in support of health equity.
Social Determinants of Health
The health of a population can be greatly affected by non-medical factors, which would include things like educational access and quality, health care access and quality, neighborhood characteristics, social and community practices, and economic health and stability. These other, broader societal and community-wide factors are known as the “social determinants of health” (SDOH, see Figure 1). Unequal access to SDOH can feed health disparities. For example, communities that have less access to grocery stores with healthy foods face greater challenges with nutrition, which raises the risks of heart disease, diabetes, obesity and other conditions in these communities compared to others with health food options. During an epidemic or pandemic, the lack of sick leave policies and precarious economic circumstances can leave workers – especially low-wage workers – with little flexibility to take time off from work, raising their risk of infection and for continued community transmission. In general, racial and ethnic health and health care disparities can result in higher rates of illness and death for minority populations across a wide range of health conditions.
Many public health programs recognize the importance of social determinants of health, and sometimes work in partnership with other public and private efforts to help develop and implement complementary approaches aimed at improving health equity. The CDC recommends that public health departments consider how social determinants affect health in their communities, highlighting how a focus on implementing the 10 Essential Public Health Services can help address inequities that arise from these social conditions. Still, there are limits to how directly public health programs can address these issues given that they often involve broad social conditions such as employment, discrimination, housing, and education.
As indicated in the name, “public” health is primarily shaped and supported through the public sector, i.e., governments. In the U.S., public health powers and responsibilities are shared across federal, state, and local levels of government. Legal authorities for public health powers are derived from the U.S. Constitution and relevant federal, state, and local laws (see Box 2 for an overview of the legal basis for U.S. public health powers). A set of public health departments and agencies at each of these levels forms the organizational backbone of the U.S. public health system. However, many private sector actors such as non-governmental community-based organizations, academic institutions, private companies, philanthropies, and others also have roles in the public health system.
Box 2: Legal Basis for State and Federal Public Health Powers
The U.S. Constitution does not mention public health specifically, but certain powers granted to the federal government and to states in the Constitution have been interpreted as encompassing public health. For example, under the 10th Amendment’s “police powers” clause, states are granted primary responsibility for enacting and enforcing laws to promote the health, safety, and general welfare of people in their jurisdictions, which is understood to include public health. This means that in the U.S., state governments often have primary responsibility for enacting public health measures and deciding on public health policies. During public health emergencies, states also have primary authority to impose and rescind certain measures within their jurisdiction such as business restrictions and school closings.
The Constitution also grants some powers to the federal government. Under the Constitution’s “commerce clause,” the federal government has exclusive authority to regulate interstate and foreign commerce. For public health, this means the federal government has authority to impose quarantines or other health measures that concern the spread of diseases into the U.S. from foreign countries and/or across state lines. The federal government’s Constitutionally derived power to tax and spend for the general welfare provides it the ability to use federal resources in support of public health activities in states and localities nationwide.
Even so, the lines between where federal and state public health powers begin and end – and how these powers are balanced with other legal concerns – are not always perfectly clear and can shift over time. Sometimes, existing rules or practices are challenged in court or changed through new legislation. For example, the Supreme Court in its Jacobson v Massachusetts decision in 1905 established that states can enforce compulsory vaccination laws, setting a precedent that public health concerns can sometimes outweigh individual rights. This and subsequent rulings upholding this principle have been a legal cornerstone for state-level vaccination requirements, such as those for school-aged children. However, in recent years many state legislatures have passed laws intended to weaken vaccination requirements or eliminate them entirely. In addition, during the response to COVID-19, many government-imposed public health interventions such as mandatory masking, social distancing, and vaccination requirements were challenged through legal action.
Federal Government
Each of the three branches of the federal government (Executive, Legislative, and Judicial) has a role in shaping and implementing public health in the U.S.
The President (Executive Branch)
Federal responsibilities and oversight of public health are spread across numerous executive branch agencies and departments overseen by the President (also see “Congress and the Executive Branch and Health Policy). The President, White House, and executive branch agencies also have the authority to set certain aspects of national public health policy, such as determining under which circumstances and for what diseases that individuals entering the U.S. may be subject to quarantine, isolation, and/or other public health measures, invoking border and migration control measures for public health issues such as those allowed under Title 42, and instituting public health controls or other measures on interstate travel and commerce.
The key federal departments and agencies involved in oversight and implementation of public health in the U.S. include:
Department of Health and Human Services (HHS), which has 13 operating divisions and is overseen by a secretary, with multiple assistant secretaries responsible for specific offices and programs. For example, the Office of the Assistant Secretary of Health (OASH) oversees key HHS public health offices and regional offices, as well as the U.S. Public Health Service Commissioned Corps. Also within OASH is the Office of the Surgeon General, which has historically served as a center for expertise on many public health issues and has at times released influential reports, affecting U.S. public health policy and practice in areas such as tobacco, HIV/AIDS, and drunk driving. The following are the core public health-focused operating divisions within HHS:
Centers for Disease Control and Prevention (CDC) is considered the leading public health agency of the federal government. CDC is comprised of a central Office of the Director, and nine national centers covering different areas of U.S. public health, and a center for global health. CDC houses experts, laboratories, communication services, and other capabilities directed to improve the public’s health and respond to emergencies. One of CDC’s core functions is to support state and local public health efforts through funding and technical assistance. CDC’s budget includes an annually appropriated discretionary amount provided by Congress each year (CDC’s FY2024 enacted budget for its core public health programs was $9.25 billion), and also several programs whose budget is determined by specific Congressionally-mandated program authorizations, such as the Vaccines for Children program (in FY2024 the budget for these mandatory programs totaled $8.03 billion). During outbreaks and other health emergencies, Congress has often provided additional emergency supplemental funding to support CDC response activities. CDC is led by a director, historically appointed by the President without need for Senate confirmation. Due to a law passed by Congress in December 2022, the CDC director position is a Senate-confirmed position as of January 2025.
Food and Drug Administration (FDA) is responsible for protecting public health by ensuring the safety, efficacy, and security of human and veterinary drugs, biological products, and medical devices. FDA also works to maintain the safety of (some of) the U.S. food supply, cosmetics, and products that emit radiation. FDA review and authorization/approval is necessary for all prescription drugs and all vaccines intended for use in humans, along with many other medical products and health devices. The total program level budget at FDA (the amount of money the FDA can spend for its activities) is comprised of both Congressionally appropriated funds and user fees collected via regulatory review of many of the products under FDA’s purview. In FY2024, the FDA’s total program level budget was $7.2 billion, of which $3.3 billion (46%) came from user fees. FDA is led by a commissioner, a Senate-confirmed position.
Administration for Strategic Preparedness and Response (ASPR) is an operating division within HHS that leads medical and public health preparedness for, response to, and recovery from disasters and other public health emergencies. This includes activities to support development of medical countermeasures for health emergencies, a stockpile of emergency medical supplies and equipment for use during emergency responses, and support and technical assistance to state and local public health agencies to improve their response capacities. It is comprised of multiple centers, including the Center for Preparedness, the Center for Response, the Center for the Biomedical Advance Research and Development Authority (BARDA), and the Center for the Strategic National Stockpile. ASPR’s operating budget for FY2024 was $3.65 billion. ASPR is led by an Assistant Secretary for Preparedness and Response, a Senate-confirmed position.
Other HHS Operating Divisions: Other HHS agency programs also play a role in public health, including by helping to build capacity, respond to outbreaks and serve communities, even if they may be more directly focused on clinical care and services, including HRSA’s community health center program and Ryan White HIV/AIDS Program, and SAMSHA’s programs on substance abuse and mental health.
In addition, several other departments and agencies outside of HHS that play a role in promoting the nation’s public health. These include:
U.S. Department of Agriculture (USDA), which supports U.S. agriculture through assistance to farmers, and also oversees programs aimed at improving health, ending hunger, ensuring food safety, and other areas. USDA also protects public health through regulating aspects of the nation’s food supply, and also providing food services for children and low-income people across the country. USDA’s Food Safety and Inspection Service (FSIS) regulates processors of meat, poultry, and eggs, and helps respond to foodborne disease outbreaks. The department’s Food and Nutrition Service oversees programs to provide food and nutrition education in schools as well as the Supplemental Nutrition Assistance Program (SNAP), which provides food benefits to low-income families.
Department of Defense (DoD) oversees programs focused on the health and safety of active-duty military members and their families, and also supports a number of public health functions such as health surveillance and emergency response.
Department of Homeland Security (DHS) provides support to help state and local public health agencies improve preparedness and response to terrorism and other public health threats.
Occupational Safety and Health Administration (OSHA) in the U.S. Department of Labor works to promote safe and healthy working conditions nationwide through setting and enforcing standards, and implementing training, outreach, education, and other assistance programs for worker safety.
Department ofVeterans Affairs (VA) oversees programs focused on the health of military veterans and their families, including public health programs to help promote health and prevent disease in these populations.
This is not meant to be a comprehensive list; other federal agencies also have responsibilities and activities important for public health.
U.S. Congress (Legislative Branch)
Congress (the House of Representatives and the Senate) makes laws, conducts oversight of the Executive branch, and determines the level of federal spending; all roles that are relevant to the U.S. public health system. Much of the federal funding for public health is for discretionary programs rather than mandatory ones (see Funding below), so Congress must come to agreement and pass bills annually to determine how much money goes to these programs. Congress may pass additional, emergency funding to states and localities for public health efforts during national emergencies, such was done numerous times during COVID-19. Congress may also pass laws that change federal practices related to public health, such as a 2022 law that made the CDC director a Senate-confirmed position. Oversight responsibilities for public health in the legislative branch are divided across a number of different Congressional committees with jurisdiction over different aspects of public health policy, and oversight of different Executive branch agencies and departments working in public health.
Federal Courts (Judicial Branch)
U.S. federal courts, up to and including the Supreme Court, pass judgment on how or whether federal public health laws and policies can be carried out and settle disputes between the federal government, individuals, states, and private companies over how public health activities are regulated and implemented. The legal basis for many current public health practices, such as vaccination requirements, rests on federal court decisions and precedents (see Box 2). Federal courts have also weighed in on the legality of a number of federal public health policies enacted during the response to COVID-19, such the CDC masking requirement for public transportation issued in January 2021 that was challenged and ultimately overturned by a federal court in April 2022, and the COVID-19 vaccination mandate for federal workers implemented by the Biden Administration in September 2021 that was ultimately rescinded after legal challenges were raised in federal courts.
State, Local, and Territorial Governments
States are given primary responsibility for many public health powers under the U.S. Constitution (see Box 1). Each of the 50 states plus Washington D.C., five U.S. territories (American Samoa, Mariana Islands, Guam, Puerto Rico, and the Virgin Islands), and three associated states (Marshall Islands, Micronesia, and Palau) have public health departments that are responsible for implementing public health programs in their jurisdictions. Funding for public health programs at the state and local levels comes from a combination of federal, state, and other sources (see funding section below).
Across States, Public Health Governance Varies
How public health is governed differs across these states and territories. Some have a very centralized governance model, where most or all parts of the state are served by local units of the state health agency and primary decision-making powers reside with state representatives. Others have a more decentralized governance structure, where most or all parts of the state are served by local public health agencies that may be independent of the state health agency. Still others have a mixed or shared approach to public health governance between the state and local decisionmakers. A 2022 analysis by the Association of State and Territorial Health Organizations (ASTHO) found that of the 50 states and D.C., 16 are centralized, 27 decentralized, and 8 have a mixed or shared approach to governance (See Figure 2).
This variation in governance leads to very different processes across states for how public health policy is determined and implemented. While more decentralized public health governance can result in public health programs that are more tailored to the needs of specific areas, it can also make coordinated public health action more challenging, especially during outbreaks and pandemics, as occurred during COVID-19.
Common Public Health Activities at the State Level
According to a 2022 survey conducted by ASTHO, the activities most commonly implemented by state public health agencies in 2022 included:
communicable disease screening, prevention, and treatment, such as for HIV/AIDS and sexually transmitted diseases (all 51 state health agencies including D.C. provide these services);
public health surveillance such as tracking chronic and communicable diseases as well as injuries (all 51 state health agencies);
immunization support, including managing orders and distributing vaccines for children and maintaining a childhood immunization registry (all 51 state health agencies);
laboratory services such as foodborne illness testing and influenza virus typing (50 state health agencies, all except Kentucky).
Other very common public health activities across states include: chronic disease prevention, family planning, maternal and child health home visits, tobacco cessation and prevention programs, food safety, inspection and training programs, and cancer screenings.
Local and Tribal Health Agencies
Even as state governments have the primary mandate to oversee public health policies and programs, many public health programs within states and territories are implemented through local (such as regional, county, city, and tribal) health departments. According to the National Association of County and City Health Officials (NACCHO), over 3,300 local health agencies are responsible for implementing public health programs across the country. Depending on the governance model present in each state, these local public health departments may have more or less autonomy regarding public health in their jurisdictions. Some areas may have local boards of health authorized by state laws, which establish guidelines for the operation of public health programs in more local level jurisdictions. In addition, under U.S. law, the 574 federally recognized American Indian and Alaska Native tribes and villages have many powers of self-government, which include responsibilities for implementing public health programs. Given this varied approach across states and at the local level, the U.S. is often referred to as having a “patchwork” public health system.
Non-governmental/Community-Based Actors
Also important for public health are a wide variety of non-governmental, including community-based, actors. This includes the public health professional associations that often advocate for and represent public health practitioners, such as the aforementioned ASTHO and NACCHO, plus the Council of State and Territorial Epidemiologists (CSTE), the Association of Immunization Managers (AIM), the American Public Health Association (APHA), Trust for Americas Health (TFAH), community-based organizations, philanthropic organizations, and many others. Colleges and universities are also important: there are at least 66 schools of public health, 164 public health programs, and 29 baccalaureate public health programs at institutions of higher learning in the U.S., which support research, training, and education programs in this field. A host of private companies are important for U.S. public health functions, including pharmaceutical and medical device companies, laboratories, and many others.
Funding for public health comes primarily from government spending, which includes federal funding (both regular and supplemental appropriations) passed through to state and local governments via grants and cooperative agreements, as well as funding appropriated by state governments, and funds from city, county, district, and other local governmental sources. In addition, there may be non-governmental sources of funding for public health services, such as those from philanthropic and other private organizations. Over the last twenty years there have been periods of funding declines and growth for public health in the United States – sometimes referred to as a “boom-bust cycle” of support. For example, between 2010 and 2019, spending for state public health departments declined by 16% and spending for local public health departments declined by 18%, by some estimates. However, during the COVID-19 pandemic, public health budgets grew due to an influx of federal, state, and other response funding.
Estimating how much funding is directed to public health across the U.S. is challenging for a number of reasons. For one, there is variation across federal agencies & departments, states, and local governments on how “public health” spending is defined and how that data is collected, resulting in a lack of standardization and comparability. Second, public health programs may draw from and blend multiple sources of funding across federal, state, and local sources, making tracking and de-duplicating funding estimates challenging. Also, many public health departments, particularly at the state and local levels, have limited capacity and lack the resources and systems necessary to effectively track and report spending. Recognizing these challenges, there are sources we can look at that provide some idea about how much is spent on public health at the federal, state, and local levels:
National public health spending estimates. One commonly cited estimate for national-level public health spending is the Centers for Medicare and Medicaid Services (CMS) Office of the Actuary’s National Health Expenditure Accounts (NHEA) data, which includes an annual Public Health Activity Estimate (PHE) for federal, and state and local spending on public health (as well as an estimate for all health spending). Figure 3 shows the PHE for federal, state and local public health spending between 2013-2023, ranging from a low of $80 billion in 2013 to a high of over $240 billion in 2020. Until 2020, these data indicated that the bulk of public health funding in the U.S. came from state and local sources. This changed during COVID-19, due to a massive increase in federal public health funding in 2020-2022 through supplemental (emergency) appropriations; the latest available data (from 2023) indicate that 3.3% of all U.S. health spending was directed to public health ($160 billion out of $4.87 trillion in total health spending). Some researchers who have studied the PHE believe it to be an overestimate of actual spending on public health.
Individual departments and agencies. Some departments and agencies release data on how much funding they provide to public health programs nationally, which represent a sub-set of national public health spending amounts. For example, CDC provides annual spending data on all its grants, cooperative agreements, and emergency appropriations directed to state and local public health departments (CDC public health funding profiles). CDC reported that it provided over $15 billion in grants to health departments across the country in FY2023, which includes funding derived from CDC’s core discretionary funds as well as mandatory funds for programs such as Vaccines for Children. The top state recipients (per capita) of CDC funds included Washington, D.C., Alaska, Maryland, and Vermont (see Figure 4).
State-level public health funding estimates. State spending on public health budgets comes from a combination of federal, state, and other sources. According to the ASTHO, in FY2021 (the latest data available, which came during the COVID-19 pandemic response that featured significant federal supplemental appropriations), federal sources comprised the largest share of state health department budgets (53%), followed by state sources (36%) and other sources (11%, see Figure 5).
ASTHO also reports that the largest category of state public health expenditure in 2021 was COVID-19 response activities, followed by clinical care services, and women, infants, and children (WIC) programs (see Figure 6). ASTHO data from 2018 (the most recent pre-pandemic year with data available), show the largest categories of public health expenditure then were clinical services (30%) and Women, Infants and Children (WIC) programs (23%).
Public health spending at the local (city/county/tribal) level: NACCHO reports that in 2021, local health departments drew a majority of their budgets from federal sources (55%, which included pass-throughs (26%), direct funding (25%), and Medicaid/Medicare-related sources (4%)). A further 21% came from state sources, 14% from local sources, and the remaining 10% from other sources. In 2021, NACCHO reports the mean and median annual expenditure per capita on public health by local health departments were $78 and $49, respectively.
Funding gap estimates: One study suggests that foundational public health capacities require an overall investment of at least $32 per person per year from all levels of government but, as of 2019 (prior to the COVID-19 pandemic), investment in public health capabilities was approximately $19 per person, indicating at least a $13 gap in annual per-capita spending on public health. While funding increased significantly during the COVID-19 pandemic, much of that support is time-limited.
The public health workforce includes persons working for federal, state, and local health departments as well as those in the private sector working in community-based and voluntary organizations, hospitals and health care systems, and schools. Responsibilities for these workers can include providing health care services in public clinics, collecting and analyzing data; performing health inspections and safety monitoring at places of work, residence, and recreational facilities; developing, administering, and evaluating public health programs and policies; and providing public health education and communication services to communities, among others.
Over the last twenty years local public health departments have faced a general decline in workforce numbers in line with declines in public health budgets, with the notable exception of a rise in workforce funding due to additional federal funding (and more state and local funding) in response to the COVID-19 pandemic, although this support was time-limited. One study estimates between 2009 and 2019 the number of workers at local health departments dropped from 162,000 to 136,000, a 17% decline that translates into a loss of more than 1 worker per 10,000 residents served. Subsequently, additional funding from pandemic response led to growth in the public health workforce, even if temporarily: NACCHO estimates that in 2022 there were 182,000 public health workers at local health departments nationwide, the highest total in at least two decades. Looking specifically at the epidemiologist workforce, the Council of State and Territorial Epidemiologists (CSTE) estimates 5,706 epidemiologists worked at health departments of the 50 states and DC in 2024, which is a 38% increase over the 4,135 reported in 2021. These national numbers, however, mask an uneven distribution of the public health workforce, as rural health departments have low per-capita staffing numbers compared to large, primarily urban health departments.
Workforce retention has been an issue before, during, and after COVID-19, and is exacerbated now as pandemic-era funding expires. NACHHO and CSTE point to impending workforce losses and note that despite the recent growth in the workforce there is still a large gap between current staffing levels at health departments and what is needed to fully implement Foundational Public Health Services nationwide. In addition, the public health workforce faces stress, burnout, and relatively low pay, which contributes to turnover and retention issues.
Public Health Communication Challenges in an Era of Declining Trust
The Centers for Disease Control and Prevention (CDC) has defined health communication as “the study and use of communication strategies to inform and influence individual and community decisions that enhance health.” Public health communication encompasses a broad and long-standing field of research and practice, and in the U.S. communication it is recognized as one of the ten Essential Public Health Services and one of the eight Foundational Capabilities for Public Health.
There is a history of successful implementation of communications approaches to improve the public’s health. In the 20th century, for example, there were notable U.S. campaigns to raise awareness about the negative health effects of tobacco use, increase the use of seat belts, and improve nutrition and physical activity, all of which contributed to improved health across the country.
However, implementing effective public health communication strategies can be difficult, especially in the context of a public health emergency such as an outbreak or pandemic. There is a history of U.S. public health authorities facing communication challenges to combat infectious disease epidemics including HIV/AIDS and Ebola. More recently many of these same challenges, along with new ones, arose in the context of the COVID-19 pandemic response.
At present, some key challenges for public health communication in the U.S. include:
A “fractured” system of health communicators and sources of health information that includes governmental institutions at the global, federal, state, and local level along with private organizations and individuals, which together can produce an often overwhelming amount of information, not all of which is trustworthy;
An evolving set of communication channels for public health information that includes traditional mass media along with a rapidly changing landscape of socialmedia and other online communication networks;
Improving coordination on public health messaging among key messengers in public health;
Collaborating with information channels such as social media companies to understand and reduce the spread of misinformation;
Presenting and disseminating information from trusted sources through multiple channels;
Tailoring messages to intended audiences;
Engaging in two-way communication that encourages dialogue with members of the public and addresses questions and concerns, especially with those in the “malleable middle” who remain open to updating their opinions on health issues;
Proactively countering misinformation and disinformation;
Applying continual improvement strategies to learn from successes and failures in public health communication; and
Building trusted relationships with communities by engaging consistently over time, rather than only during crises.
Case Surveillance, Reportable and Notifiable Diseases
Disease surveillance, which has been defined as the “ongoing, systematic collection, analysis, and interpretation of health-related data,” is a core function of the public health system. This includes collecting case information for diseases of importance, reporting and analyzing that information and investigating it if there is a need. In the U.S., responsibilities for public health surveillance activities are shared among state and local, federal, and private actors, just like for many aspects of public health.
Initial reports on cases of disease may originate from providers such as medical practitioners, hospitals, or laboratories. When a practitioner diagnoses and/or receives a positive lab result for certain conditions, this information is typically reported to the appropriate local and/or state health department, as determined by state disease reporting laws. Such reporting to state and local health departments is mandatory for a specific set of diseases, which are known as reportable diseases. The specific list of reportable diseases – most of which are infectious diseases that can pose a threat to public health – can differ between states, depending upon each jurisdiction’s health priorities. Reports to state/local health departments will often include some personally identifiable data on the individual(s) diagnosed, to allow public health authorities to investigate and follow-up. This way, state and local health departments can provide necessary services to affected individuals, and also use reported information to locate the source of potential new outbreak or health threats and intervene to prevent further spread.
In turn, state and local health departments may also send de-identified data about confirmed cases of certain diseases and conditions that are tracked nationally to the CDC. This notification is voluntary — the federal government cannot require states to report diseases as that is a public health authority that rests at the state level. CDC does maintain a list of notifiable diseases that it requests state and local health departments provide through its National Notifiable Diseases Surveillance System (NNDSS). This list is updated every year using case definitions refined in collaboration between CDC and Council of State and Territorial Epidemiologists (CSTE). In 2023, for example, there were 123 reportable conditions on CDC’s notifiable diseases list.
Federal Declarations and Powers During Public Health Emergencies
The COVID-19 pandemic demonstrated how consequential public health emergencies can be. It presented the biggest challenge to the U.S. public health system and the largest public health response in a century, and it has had an effect on how public health is practiced across the country. In the event of a threat that is determined to represent a public health emergency, different components of the executive branch can make public health emergency declarations that unlock different flexibilities and resources for response purposes:
The President can declare a national emergency declaration pursuant to Section 201 of the National Emergencies Act, which will remain in effect until terminated by the President or through a joint resolution of Congress, or if the President does not issue a continuation notice annually. Such a notice was issued by President Trump for COVID-19 and was extended by President Biden. Declaring a national emergency allows the federal government to waive certain programmatic requirements related to Medicaid and Medicare, among other provisions.
The Secretary of HHS can declare a “public health emergency (PHE)” under Section 319 of the Public Health Service Act. A PHE lasts for 90 days and must be renewed to continue, and Congress must be notified of the declaration within 48 hours. Declaring a PHE allows the HHS Secretary the flexibility to take a number of different actions, such as: tap into emergency funds, rapidly approve grants and contracts, waive or modify requirements within health programs such as Medicare and Medicaid, adjust Medicare reimbursement policies for certain drugs, hire new temporary staff and reassign personnel, and other actions. Public health emergency declarations over the past decade have included those for COVID-19, opioids, hurricanes, wildfires, and an epidemic of Zika that began in 2016.
The Secretary of HHS can also make a separate emergency declaration pursuant to Section 564 of the Federal Food, Drug, and Cosmetic (FD&C) Act, which can justify the use of emergency use authorization (EUA) for medical countermeasures needed for emergency response, such as new vaccines, treatments, and/or diagnostics. The EUA mechanism facilitates the availability and use of medical countermeasures determined to be safe and effective, but have not yet been formally approved by FDA. An emergency declaration issued pursuant to Section 564 of the FD&C Act remains in effect until terminated by the HHS Secretary.
The HHS Secretary can also declare an emergency under the Public Readiness and Emergency Preparedness (PREP) Act (pursuant to Section 319F-3 of the Public Health Service Act), which allows the Secretary to provide liability immunity for companies and other actors for their activities and products developed and implemented to respond to a public health emergency. Such a declaration was made for COVID-19 by the Trump Administration and continued by the Biden Administration, which provided liability protections for vaccine manufacturers, etc.
Because most public health powers reside at the state level, the federal government has limited ability to issue nationwide mandates related to public health. However, during declared emergencies, the federal government does have expanded powers to do so, though the limits to these powers have been a point of contention during and after the COVID-19 emergency declaration. Examples include:
Mandates for federal workers or federal buildings/lands (mask mandate, vaccine mandate)
Airline and interstate travel-related mandates (e.g, mask mandates for interstate air, train, or bus travel, contact tracing/information tracking through airlines). A 1944 statute empowers the CDC “to make and enforce such regulations as in [its] judgment are necessary to prevent the introduction, transmission, or spread of communicable diseases from foreign countries into the States . . . or from one State . . . into any other . . . State.” However, this authority has been the subject of litigation and a federal judge issued a ruling in 2022 that ended the CDC’s mask mandate for public transport during COVID-19.
Mandates for immigrants and international visitors (such as quarantine and isolation for incoming air passengers)
Even during emergencies, the federal government does not have the power to mandate widespread business or school closures, or vaccine mandates affecting the country’s population as a whole. State governments (and sometimes local governments), however, do have those authorities, and the federal government can make recommendations for state and local authorities to follow.
Water Fluoridation
Fluoridating water has been a long-standing public health practice in most communities across the U.S. and has been supported and recommended by the federal government for decades. The CDC considers fluoridation to be one of the most important public health interventions ever implemented. However, there has been growing scrutiny of the practice, and debates in manyparts of the country about whether to continue fluoridation. Robert F. Kennedy Jr., the Secretary of Health and Human Services in the Trump Administration, has long been critical of water fluoridation and has said the Trump administration will recommend that fluoride be removed from public water. Even so, key professional associations, public health experts, and many policymakers continue to support fluoridation as an important tool for improving dental health.
While the federal government does have some role in determining water fluoridation policies nationally, it does not have legal authority to require state and local communities to fluoridate their water, nor to remove fluoridation in areas where it is already policy. Instead, these decisions – just like many public health policy decisions in the U.S. – are made at the state and local levels. There are some states that require water systems of a certain size within their state to provide fluoridated water, while others leave this decision to city, county, or other officials or leave the choice up to voters who decide via local referendums. At the same time, the federal government – specifically the Environmental Protection Agency (EPA) – does have the primary authority to set and regulate the maximum level of fluoridation in public water systems. In addition, the CDC provides recommendations about best practices for achieving public health benefits from fluoridation that communities may choose to adopt.
The public health system in the U.S. is a decentralized one, with most authorities and programs delegated to the state and local levels. This “patchwork” system can be a strength and a weakness. While it allows for tailoring public health to more local needs, it also makes more coordinated and uniform action more challenging, particularly in times of emergencies; in addition, public health services and capacity vary significantly across the country, meaning that not all communities have the same level of access and there are resulting inequities in community health status. In addition, while the COVID-19 pandemic brought more attention and funding to public health, it also brought more scrutiny and contributed to a more politicized environment concerning public health, setting up new challenges for its future, including for funding and policy.
The presidential transition from the Biden Administration to the Trump Administration has led to a very different approach to public health from the White House. Within a few weeks of taking office, the Trump White House began to implement aggressive cuts to funding, programs, and staff from federal public health programs at HHS, CDC, FDA, NIH and elsewhere. This includes moves to cut support for federal programs related to diversity, equity, and inclusion (DEI) and racial inequities, and those that address the health needs of LGBTQ+ people. Incoming HHS Secretary Kennedy has stated that “nothing is going to be off limits” when it comes to him making public health policy changes at HHS, and that he expects to prioritize the issues of chronic disease, and address conflicts of interest on existing advisory and other federal bodies, while potentially raising concerns about the safety of vaccines and de-prioritizing infectious diseases as a focus for the federal government, even as the country faces infectious disease threats such as measles and avian flu. Given this, the next few years could represent a turning point and challenging period for U.S. public health policy.
With the Trump administration instituting a foreign aid freeze, including a stop-work order, cancelling the vast majority of foreign aid grants and contracts, and moving to dismantle USAID, U.S. global health programs have been effectively shuttered. Even the limited waivers that have been granted for some services have not resulted in any significant funds flowing or services offered, according to multiple lawsuits and other reports.
This situation presents considerable risks to the health of millions of people in low- and middle-income countries, given the role the U.S. has played in this area. Indeed, the U.S. government has been the largest donor to global health for decades, carving out health one of its main sectors of international development, across multiple administrations and Congresses, through the provision of significant financial assistance, technical expertise, and personnel. However, this has also meant that the U.S. has disproportionately shouldered the burden for health programs, making health especially vulnerable to U.S. policy fluctuations and changes, and especially to the recent, abrupt halt in funding.
A recent analysis from the Center for Global Development identified countries most vulnerable to these cuts. This analysis examines the relative role of the U.S., compared to other donors (governments as well as multilateral institutions), in global health. We used disbursement data from the Organisation of Economic Development (OECD) Creditor Reporting System (CRS), averaged over a three-year period (2021-2023), to smooth out spending fluctuations (all totals and percent share present the per year average over the period). We focused on bilateral donor spending (e.g., the funding a donor gives directly to or on behalf of specific countries) vs. multilateral spending (e.g., the funding a donor gives to a multilateral institution that is then pooled with other donor contributions and provided to countries) because such funding is attributed to the multilateral institution as the donor in the CRS database. In addition, at this time, no U.S. government funding to the main multilateral funders of global health services has been halted. We looked at overall health spending as well as spending for HIV, tuberculosis (TB), and malaria. We removed COVID-19 funding given that it was emergency in nature and not enduring. Due to lack of available data, this analysis does not include domestic funding from recipient countries that are also used for health and in some case may be significant, although in general, GDP growth in low and middle income countries continues to lag due to the effects of COVID-19 and many face significant debt burdens that limit their ability to increase resources for health.
As this analysis shows, given that the U.S. has been the largest donor to global health, the gap left, should cuts and disruption continue, would be quite significant. This is especially true in the case of HIV for which the U.S. provides almost two-thirds of bilateral assistance. In addition, there are several countries that could be disproportionately affected by U.S. cuts, given that they are both very low-income and rely heavily on the U.S. for health assistance. Whether other donors, or countries themselves, would be able to make up such losses is unknown but seems unlikely given broader global economic trends.
Findings
The U.S. government was the single largest donor to health in low- and middle-income countries over the 2021-2023 period. The U.S. provided 30% of all health assistance, or $8.3 billion per year in bilateral support. The next largest donor was the Global Fund to Fight AIDS, Tuberculosis and Malaria (Global Fund), providing 19% or $5.2 billion each year over the period. The third largest donor was the World Bank’s International Development Association (IDA) (10% or $2.8 billion per year), followed by Gavi, the Global Alliance for Vaccines and Immunization (Gavi) at 6% ($1.7 billion per year) Germany (5% or $1.3 billion per year). All other donors each represented less than 5%. See Figure 1. It is important to note that government donors also fund multilateral entities focused on health and other areas, so these data underestimate the relative contributions of governments to health. The U.S., for example, is the Global Fund’s largest donor, providing approximately a third of its funding while the UK is Gavi’s largest donor providing about a quarter of its funding. Still, at this point, the Trump administration has not issued stop-work orders for the main multilateral entities that support health.
For HIV, the U.S. provided almost two-thirds of all donor support (63% or $5.2 billion per year) over the 2021-2023, making this area of health especially vulnerable to U.S. cuts. The next largest donor was the Global Fund (32% or $2.6 billion). The EU and UNAIDS provided 1%; while all other donors each provided less than 1%. Because the U.S. is the largest donor to the Global Fund, any reductions in its support would have an even greater and disproportionate impact on the HIV response. See Figure 2.
For malaria, the Global Fund was the single largest donor (65% or $1.6 billion) over the period. The U.S. was second largest at 28% or $673 million. The EU and IDA each provided 2% and all other donors were at 1% or less. As with HIV, reductions to Global Fund support by the U.S. would affect the global malaria response. See Figure 2.
Similarly, the Global Fund was the largest donor to TB efforts, providing 64% or $707 million per year over the period. The U.S. was the next largest, at 24% or $266 million, followed by the EU (4%) and Australia (2%). All other donors provided 1% or less. See Figure 2.
Some countries would be disproportionately affected by U.S. cuts in health aid, compared to others. Whereas the U.S. provided 30% of direct health assistance per year during the 2021-2023 period, it provided 50% or more of health assistance in 11 countries, including several low or lower-middle-income countries (Eswatini, Haiti, Kenya, Lesotho, and Zambia), one of which is currently conflict-affected (Haiti). Others are upper-middle-income (Botswana, Dominican Republic, Namibia, Jamaica, and South Africa) or high-income (Panama) and could likely more easily absorb U.S. cuts. See Figure 3.
Country reliance on U.S. support is even more concentrated for HIV. Eight countries receive 80% or more of their donor support for HIV from the U.S., compared to 63% across all recipients. For malaria, seven countries receive 50% or more of their funding from the U.S., and for TB the U.S. accounts for more than 50% of funding in nine countries. See Figure 4.
There are several options under consideration in Congress to significantly reduce Medicaid spending to help pay for tax cuts, with the recently passed House budget resolution targeting cuts to Medicaid of up to $880 billion or more over a decade. Large reductions in Medicaid spending are likely to have direct implications for the 83 million people covered by Medicaid, state budgets, and health care providers, including hospitals. Medicaid accounted for about one fifth (19%) of all spending on hospital care in 2023. Changes in hospital finances could affect patient care and may have broader economic implications, given that, for example, hospitals employ 6.7 million people and are the sixth largest employer in the country when comparing industry subsectors.
A number of policies to achieve large Medicaid savings have been discussed. Theseinclude imposing a per capita cap on federal Medicaid spending, reducing the federal government’s share of costs for the ACA Medicaid expansion group, imposing Medicaid work requirements, limiting states’ use of provider taxes to finance the state share of Medicaid spending, and placing restrictions on supplemental payments to providers and/or state-directed payments (which are payments managed care plans make to providers, including hospitals). Such policies could force states to make tough choices about raising state revenues to replace the lost federal dollars or making cuts to Medicaid by reducing the number of people covered; covering fewer benefits; or reducing payment rates for hospitals, physicians, nursing homes, and other health care providers.
Absorbing reductions in Medicaid spending could be challenging for hospitals, particularly for those that are financially vulnerable, such as hospitals that care for a relatively large share of Medicaid patients. Reducing reimbursement rates or cutting supplemental payments to hospitals would have a direct impact on hospital finances. Rolling back coverage would increase the number of uninsured patients, which could result in higher uncompensated care costs (and have implications for the health of Medicaid enrollees who lose coverage or have access to fewer benefits). Hospitals may respond to those financial pressures by operating more efficiently or by making various cuts—such as offering fewer services, laying off staff, or investing less in quality improvements—and lower payment rates could reduce the willingness of hospitals to see Medicaid patients. Cuts to Medicaid spending could also potentially accelerate the pace of hospital closures, including in rural areas. Given differences in state responses to potential federal Medicaid cuts, the impact would likely vary across states and hospitals.
1. Medicaid covered about one fifth of all hospital spending in 2023.
Medicaid accounted for 19% of all spending on hospital care in 2023, or $283 billion out of the $1.5 trillion spent on hospital care (Figure 1). The other major payers for hospital care are Medicare (25%) and private health insurance (37%). Medicaid also covered about one fifth of hospital discharges in 2023.
2. Hospital care accounted for about one third of total Medicaid spending in 2023.
Hospital care accounted for about one third (32%) of Medicaid spending in 2023, or $283 billion out of $872 billion in total Medicaid expenditures. For purposes of comparison, hospital care represented a larger share of Medicaid spending (32%) than physician and clinical services (14%) or retail prescription drugs (6%). Because hospital care accounts for a large share of Medicaid expenditures, it is likely that any substantial reduction in Medicaid spending would impact hospitals, and some proposed policy changes directly target supplemental or state directed payments to hospitals.
3. Medicaid covered about four in ten births nationally in 2023 and almost half of births in rural areas.
Medicaid covered 1.5 million births in 2023—representing 41% of all U.S. births—and financed nearly half (47%) of births in rural areas (Figure 3). Births are the most common reason for a hospital inpatient stay. Medicaid covered more than two in ten births in nearly every state, at least four in ten births in 25 states and DC, and more than half of births in four states: Louisiana, Mississippi, New Mexico, and Oklahoma. The share was the largest in Louisiana, where Medicaid covered nearly two in three (64% of) births. (See prior KFF work for more about women and Medicaid).
State Medicaid programs are required to cover pregnancy-related services without cost sharing for people with incomes up to 138% of the federal poverty level (FPL), including in states that have not adopted the ACA Medicaid expansion. For births covered by Medicaid, states must also provide pregnancy-related coverage for at least 60 days postpartum and cover infants for twelve months. Nearly all states have taken up the option to extend postpartum coverage through one year postpartum.
4. The ACA Medicaid expansion has helped improve hospital finances and is associated with lower charity care costs.
Expanding Medicaid under the ACA has had financial benefits for hospitals, according to several studies. These benefits include:
Improvements in payer mix (fewer uninsured patients, more Medicaid patients, or both),
Reductions in uncompensated care,
Increases in hospital revenues and operating margins, and
Fewer hospital closures.
The financial impact of Medicaid expansion for at least certain measures may be most evident among rural hospitals, small hospitals, and hospitals that see a higher proportion of low-income patients, based on some of the research.
Hospital charity care costs (one component of uncompensated care) were generally higher in 2023 in states that had not expanded Medicaid (Figure 4).Hospital charity care programs, also known as “financial assistance programs,” provide free or discounted services to eligible patients who are unable to afford their care and are one component of uncompensated care. Among the ten states with the highest charity care costs as a percentage of operating expenses in 2023, eight had not expanded Medicaid as of November of that year (one did so in December).
Texas, a non-expansion state, had both the highest uninsured rate (16%) and the highest average charity care costs as a percent of operating expenses (6.6%) in the country. Conversely, all thirteen states where average charity care costs as a percentage of operating expenses were less than 1.0% had expanded Medicaid. Wisconsin, which had the lowest uninsured rate and average charity care as a percentage of operating costs in 2023 among non-expansion states, has expanded Medicaid eligibility up to 100% of the federal poverty level under a Medicaid waiver and therefore does not have a coverage gap.
Although Medicaid expansion has helped improve hospitals’ finances, operating margins were lower than average in 2023 among hospitals with relatively high Medicaid shares, according to KFF analysis. This is true overall and in both rural and urban areas.
5. Medicaid financing for hospitals is complex.
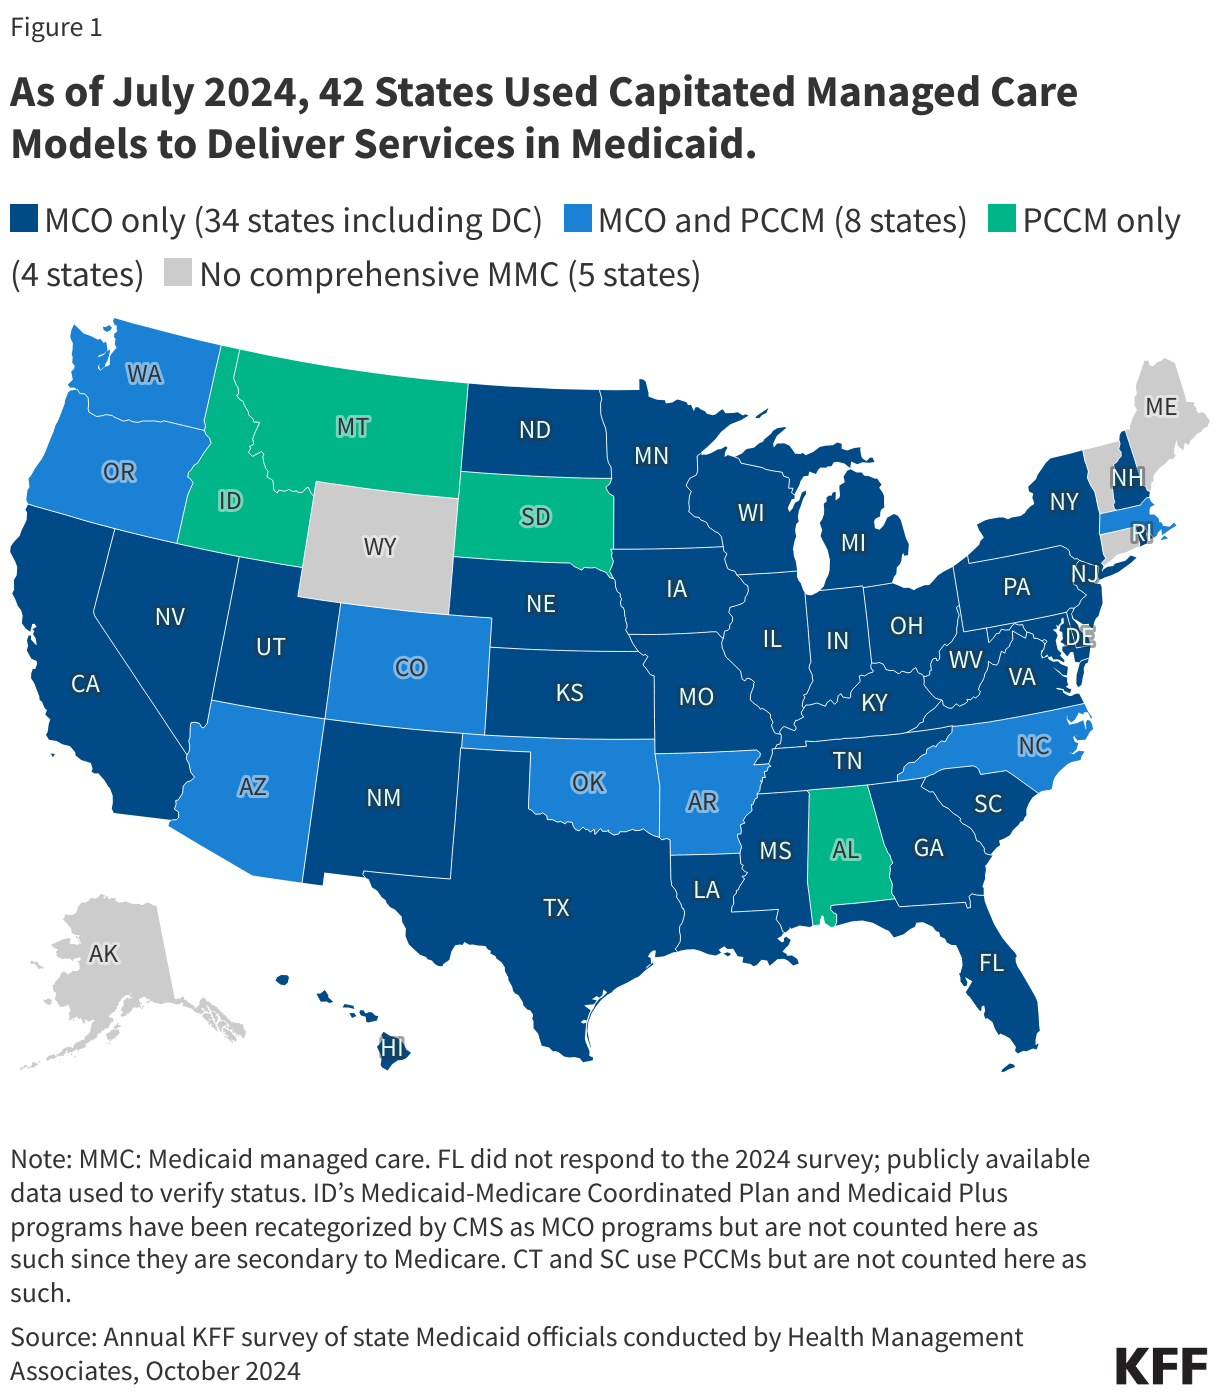
States deliver and pay for services in Medicaid through fee-for-service (FFS) or managed care (Box 1). Hospital FFS rates consist of base rates and supplemental payments. Base rates vary considerably across states and, on average, are below hospitals’ costs of providing services to Medicaid enrollees. States may rely on supplemental payments – such as payments to hospitals that serve a disproportionate share of low-income patients – to help cover hospitals’ costs. FFS supplemental hospital payments as a share of total FFS hospital payments vary widely across states. In eight states, FFS hospital supplemental payments make up more than 75% of total FFS hospital payments (Figure 5). States with capitated managed care arrangements are generally prohibited from contractually directing how managed care plans pay providers. Subject to CMS approval, however, states may implement certain “state directed payments” (SDPs). Many states that contract with managed care plans use SDPs to make uniform hospital rate increases that are like FFS supplemental payments (Box 1).
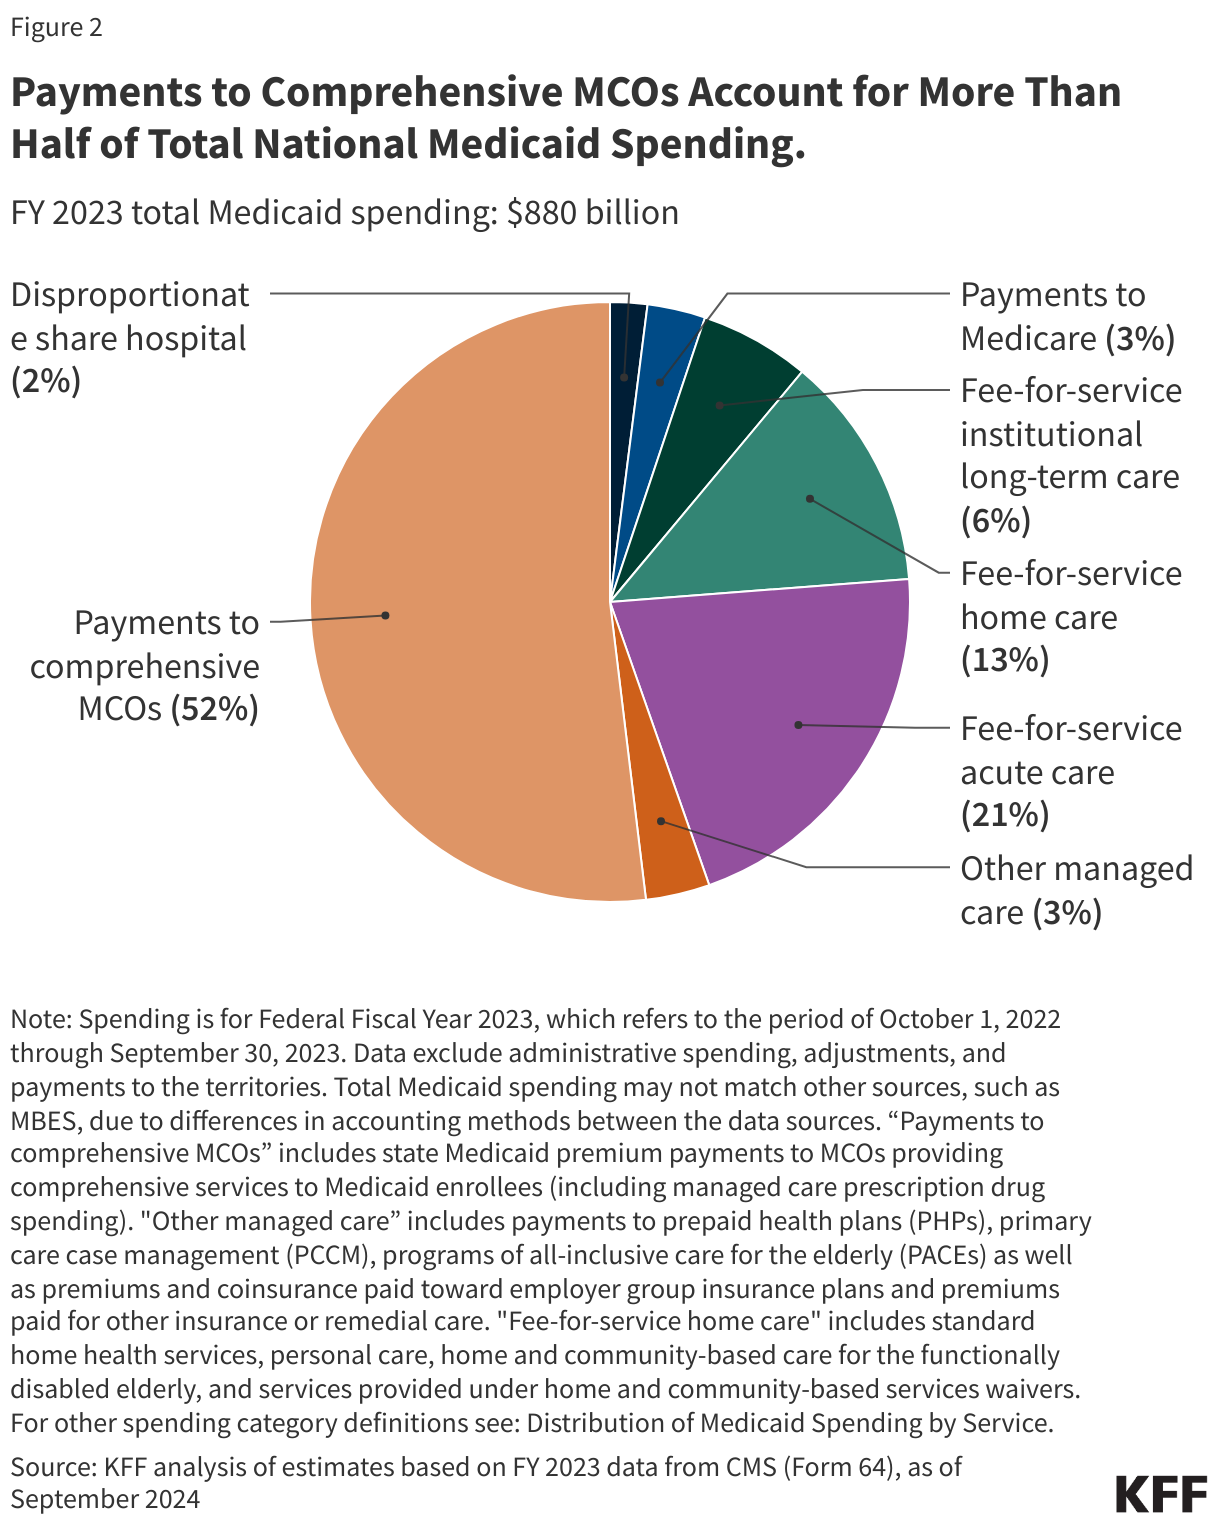
According to MACPAC, in FY 2022, 61% of Medicaid payments to hospitals were made through managed care delivery systems and 39% were made on a FFS basis. About half of FFS payments to hospitals were made through supplemental payments, while one third of managed care payments to hospitals were made through state directed payments. States are permitted to finance the non-federal share of Medicaid spending through multiple sources, including state general funds, health-care related taxes, and local government funds (Box 1). Most FFS hospital supplemental payments and state directed uniform rate increases are financed by provider taxes and funds from local governments. Efforts to restrict provider taxes or intergovernmental transfers could have bigger implications for states that rely more heavily on these financing mechanisms as well as states with larger shares of hospital funding for supplemental payments.
In an effort to increase access for Medicaid enrollees, Medicaid managed care rules finalized in 2024 permit states to pay hospitals and nursing facilities at the average commercial payment rate (ACR) when using directed payments, which is substantially higher than the Medicare payment ceiling used for Medicaid FFS supplemental payments. CBO Medicaid spending projections for 2025-2034 included a 4% (or $267 billion) increase from the February 2024 baseline to the June 2024 baseline, with half of the increase attributed to expected growth in directed payments in Medicaid managed care (driven in part by the rule change allowing states to pay at the ACR). Federal policy options under consideration include proposals to repeal the 2024 managed care rules (including the provision that formalized/codified states’ ability to pay certain providers up to the ACR) and proposals to limit the use of provider taxes.
Box 1: Medicaid Financing for Hospitals
Fee-for-service (FFS) Medicaid. States have substantial flexibility to establish provider reimbursement methodologies and amounts under FFS Medicaid. The two broad categories of FFS payment are (1) base rates and (2) supplemental payments, which are typically made in a lump sum for a fixed period of time. States use supplemental payments, including upper payment limit (UPL), disproportionate share hospital (DSH), or uncompensated care pool payments, to cover hospital costs that exceed the amounts covered by their FFS base rates. DSH payments can also be used to pay for unpaid costs of care for the uninsured. Because many types of supplemental payments are interchangeable, an increase in one type can lead to a decrease in another. Increases or decreases in base FFS payments may also result in supplemental payment changes. Reimbursement methodologies and levels may also vary by hospital type (e.g., community, critical access, and academic medical center hospitals).
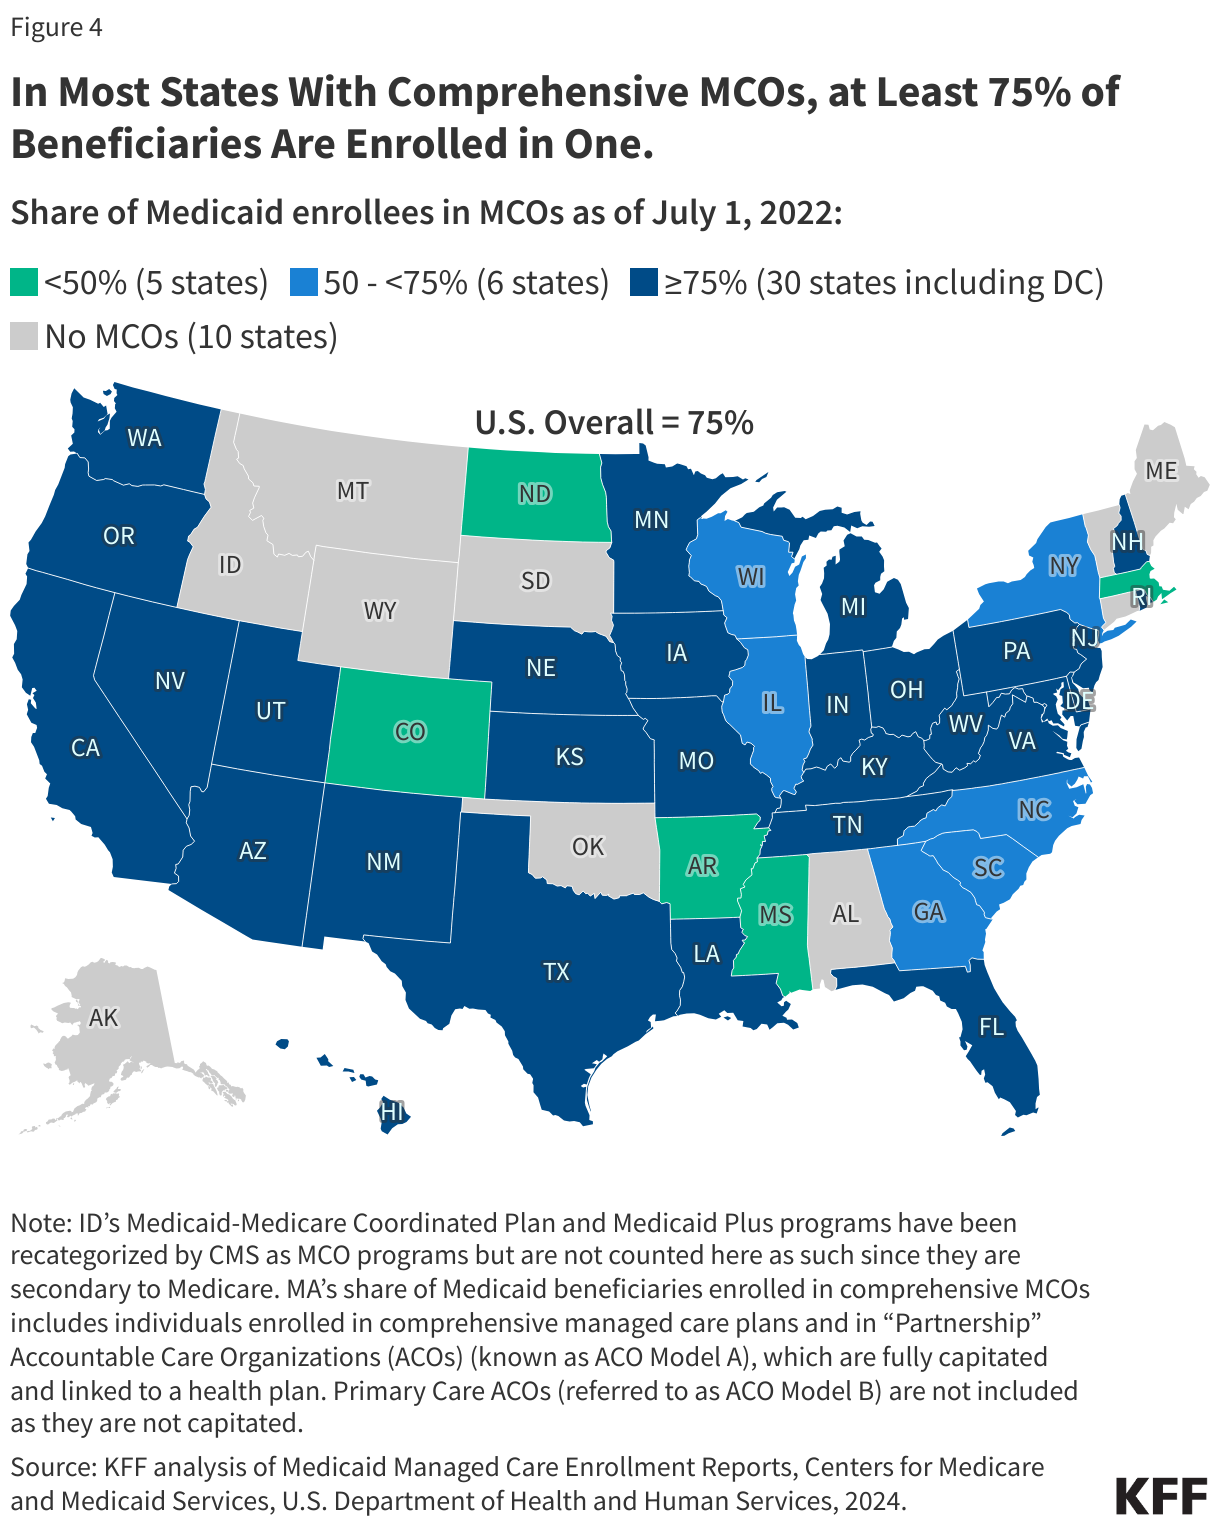
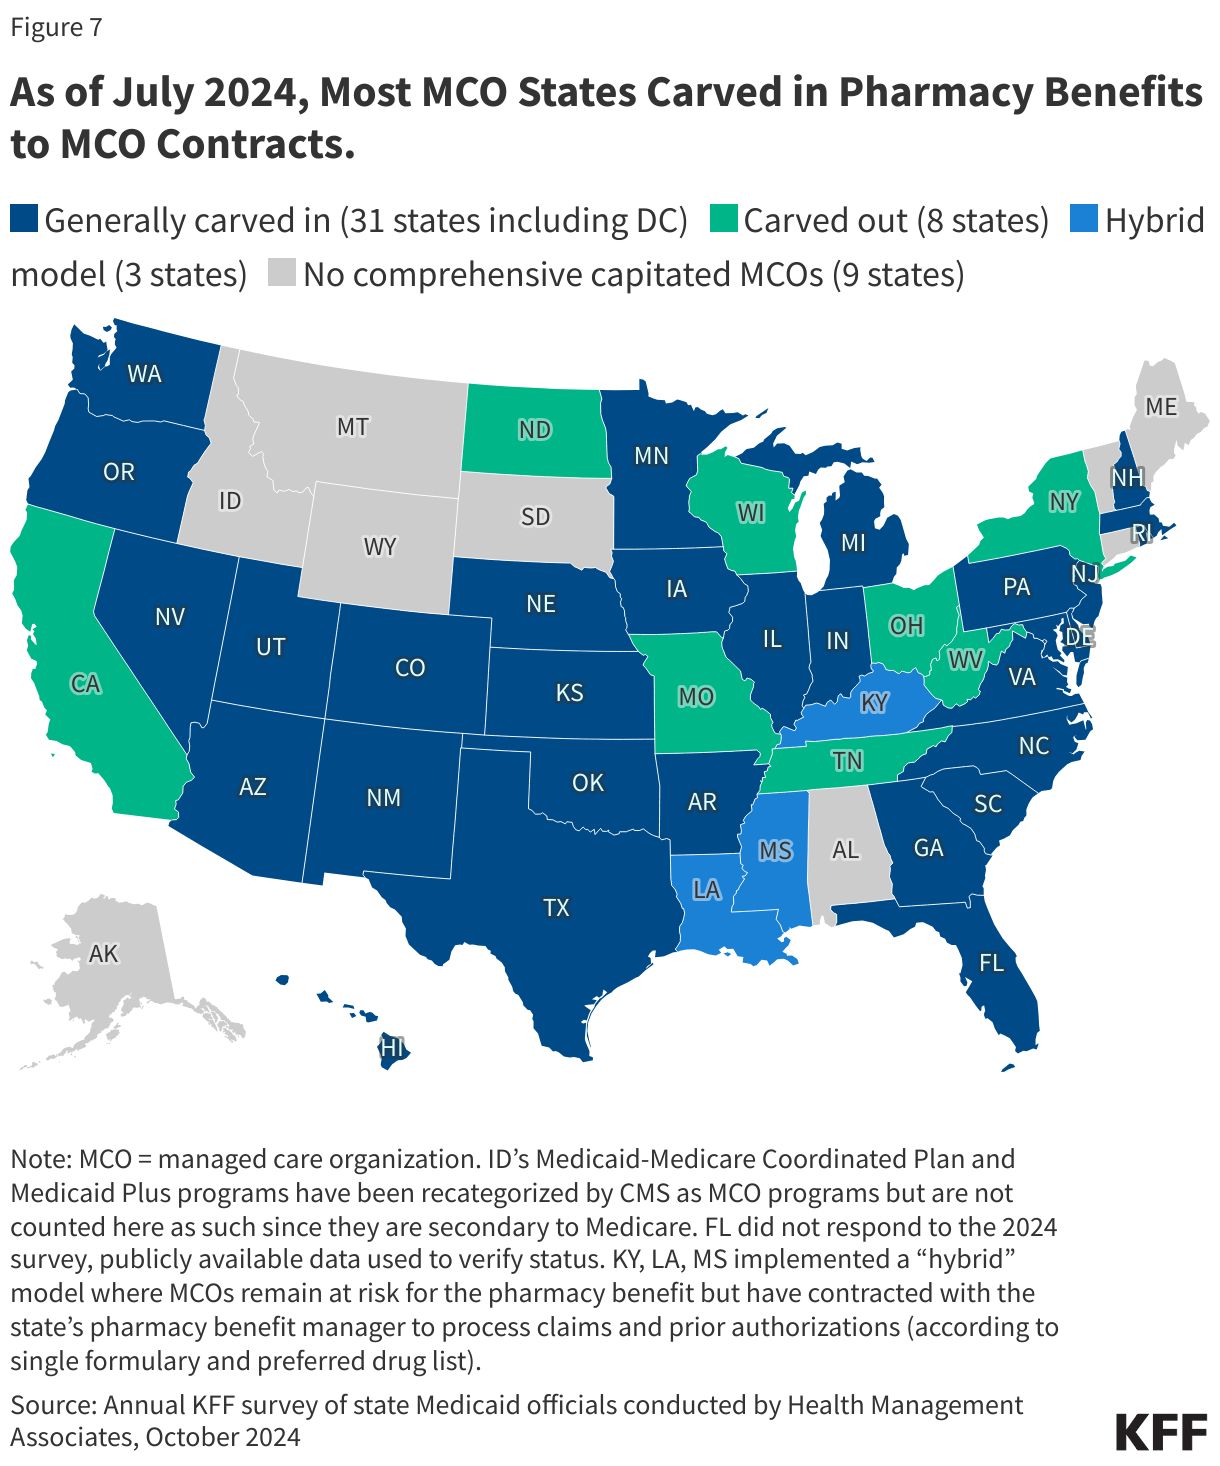
Medicaid managed care organizations (MCOs).Seventy-five percent of Medicaid beneficiaries were enrolled in Medicaid MCOs in 2022. States pay Medicaid managed care organizations a set per member per month (“capitation”) payment for the Medicaid services specified in their contracts. States are generally prohibited from contractually directing how a managed care plan pays its providers. Subject to CMS approval, states may implement “state directed payments” (SDPs) that require managed care plans to adopt minimum or maximum provider payment fee schedules, provide uniform dollar or percentage increases to network providers (above base payment rates), or implement value-based provider payment arrangements. Most states had an SDP for hospital services in place as of July 1, 2024 (37 of 41 responding states that contract with MCOs, excluding SDPs requiring a FFS payment floor) with most states reporting that hospital SDP payments as a percentage of total Medicaid hospital reimbursement were projected to increase in FY 2025. A few states reported plans to significantly increase hospital SDPs in FY 2025, including increases up to average commercial rates (which is the federal limit on SDPs).
Provider Taxes. States have flexibility in determining how to finance the non-federal share of state Medicaid payments. In addition to state general funds appropriated directly to the Medicaid program, most states also rely on funding from health care providers and local governments generated through provider taxes, user fees, intergovernmental transfers (IGTs), and certified public expenditures (CPEs). Over time, states have increased their reliance on provider taxes, with the growth in provider taxes frequently following economic downturns. Federal regulations require provider taxes to be broad-based (imposed on all non-governmental entities, items, and services within a class) and uniform (consistent in amount and scope across the entities, items, or services to which it applies) and that states must not hold taxpayers harmless (i.e., they must not directly or indirectly guarantee that the provider paying the tax will be repaid for all or a portion of the tax). However, there is a “safe harbor” exception that allows a state to use hold-harmless arrangements when the taxes it collects do not exceed 6 percent of a provider’s net revenues from treating patients. A provider tax will meet the hold harmless “safe harbor threshold” if it generates revenue that does not exceed 6% of net patient revenue.
This work was supported in part by Arnold Ventures. KFF maintains full editorial control over all of its policy analysis, polling, and journalism activities.
There have been several high-profile cases regarding exceptions to save the health or the life of pregnant patients in state abortion bans. Major cases that have reached the US Supreme Court (Moyle v. Idaho) and Texas Supreme Court (Zurawski v. Texas) have highlighted the significant challenges for physicians providing pregnancy-related care in states with abortion bans. According to a 2023 KFF survey, 61% of OBGYNs practicing in states where abortion is banned report being concerned about their legal risk when making decisions about patient care and the necessity of abortion care for their patients. Some of the concern about legal risks stems from the “reasonable medical judgment” legal standard used in most states for when an abortion qualifies for an exception. This legal standard does not defer to the treating physician’s judgment but rather allows a court to review circumstances after the abortion has been completed and rely on the testimony of other medical experts to determine whether the treating physician met the standard. Some anti-abortion advocates, legislators, and state attorneys general maintain, however, that it is physicians, not the abortion bans, that are responsible for denial and delays of care, and have implied that providers should face medical malpractice lawsuits for not properly following the exceptions. This brief examines the legal considerations for physicians providing abortion care, including criminal and professional penalties, as well as the potential for medical malpractice lawsuits for delayed care to patients due to bans and prosecution for violation of abortion bans across state lines.
What Criminal Penalties Do Physicians Face for Providing Abortions?
Eleven of the 12 states with abortion bans impose criminal penalties on clinicians who violate their respective bans. These penalties range in severity from a few months in prison to the possibility of a life sentence. All but two of these 11 states — Arkansas and South Dakota — impose minimum sentences for violation of their abortion bans. In Alabama, for example, violation of the total ban constitutes a Class A felony and carries a minimum prison sentence of ten years and a maximum sentence of 99 years. Class A felony is the most serious offense in Alabama, which places abortion in the same criminal category as murder and first-degree domestic violence. Other states place the violation of their abortion bans in the same category as crimes such as aggravated assault (Tennessee), involuntary manslaughter (Indiana), and stalking in violation of a protective order (Kentucky). West Virginia’s law does not include jail time for licensed physicians who violate the abortion ban, but it does include a 3–10-year sentence for other people who violate the law. However, other pre-Dobbs abortion restrictions in the state, such as minor consent requirements, carry criminal penalties for physicians.
In addition, penalties include fines, and in many states, violation of the abortion ban or conviction of a felony are grounds for medical license revocation. If a physician’s license is revoked, even after they have served their sentence, they may not return to practicing medicine. License revocation penalties jeopardize physicians’ livelihoods. In many states, license revocation in a different state is grounds for denying a new medical license or revoking an existing license. This means that if a physician loses their license as a result of providing an abortion in a state where abortion is banned, they may not be able to practice medicine in other parts of the country.
Many states where abortion rights are supported have passed laws to protect clinicians from losing their license, amending their licensing provisions such that if a physician’s license has been revoked in a different state solely due to the provision of abortion care that would have been lawful in the state, the physician may not be denied a license. However, in these circumstances, there is no certainty that a physician would be able to receive a license in another state. And even if physicians had the certainty, continuing to practice medicine would require moving to another state.
No clinician has yet been convicted and jailed for performing an abortion since the Dobbs ruling, but a physician in New York, where abortion is protected, has been charged with a felony crime for mailing medication abortion pills that were given to a minor in Louisiana (discussed below). However, there have been cases indicating that the threat of criminal prosecution has led physicians to delay health- or life-preserving care and prevented them from practicing medicine based on accepted standards of care. A UCSF study identified multiple cases of patients with pregnancy complications being denied abortion care that met clinical standards in states where abortion is banned. Cases included second trimester obstetric complications such as preterm labor, preterm pre-labor rupture of membranes (PPROM), hemorrhage, cervical dilation, and hypertension, as well as ectopic pregnancy, Abortion care was also denied in case of patients with underlying medical conditions that made continuing a pregnancy dangerous, who were experiencing miscarriages, or were carrying a pregnancy with a severe fetal anomaly.
Medical Malpractice
While physicians are faced with criminal and professional penalties if they provide abortion care for health reasons that are later second-guessed in court, if they do not provide this care or delay it, they could potentially be sued for medical malpractice for failing to provide timely and necessary care.
Post-Dobbs, there are no documented cases of medical malpractice lawsuits being filed by pregnant patients who were denied care or did not receive it in a timely manner. However, there have been growing calls from anti-abortion advocates to hold treating physicians liable for delays or denials of miscarriage management care or other care to pregnant people.
In response to calls for exceptions to abortion bans to be widened in scope or be further clarified, anti-abortion lawmakers and attorneys general have argued that it is not policies, but rather the physicians who are at fault in situations where care has been delayed or denied. For instance, in the case Zurawski v. Texas, where women facing dangerous pregnancy complications who had been denied emergency abortion care and two OB-GYNs asked Texas courts to clarify the scope of the medical emergency exceptions in the state’s abortion bans, attorneys for the state of Texas argued that it was not the state’s abortion bans that prevented plaintiffs from receiving timely care. Instead, he argued that physicians committed malpractice and are at fault and suggested that people should sue their physicians, not the state, when they are unable to receive timely abortion care in life-threatening medical emergencies.
Prosecution of Providers Across State Lines
In 2023, some states started passing “shield” laws. These laws aim to protect physicians from prosecution brought by states where abortion is banned as long as the physician is located within the state with the shield law and the care they provided is legal in that same state, regardless of patient location. From July 2023 through June 2024, the Society of Family Planning estimates that 1 in 10 abortions in the U.S. have been medication abortions for which the pills were mailed by providers practicing in states with shield laws.
In December 2024, in the first action testing a shield law, the Texas Attorney General filed a lawsuit against a New York doctor for mailing medication abortion pills into the state. The lawsuit alleges the physician violated Texas law by practicing medicine in the state of Texas without a Texas license and for violating the state’s abortion ban and prohibitions on telehealth for abortion care. On February 13, 2025, after the physician did not respond to the lawsuit or appear at court proceedings, a trial court issued a default judgment for the state, enjoining the physician from prescribing medication abortions to Texas residents and ordering her to pay $100,000 in civil fines. Additionally, in January 2025, a Louisiana grand jury indicted the same New York physician for violating Louisiana’s abortion ban and restrictions. The mother of the minor who received the medication abortion was also indicted. Shield laws in the state of New York seek to protect providers from this kind of litigation, so these cases will likely serve as a test case for shield laws and their ability to protect clinicians providing abortion care via telehealth to patients located in states that ban or restrict abortion. In the Louisiana case, however, the minor’s mother does not have a similar protection from the ban.
Challenges to Exceptions to Abortion Bans
In response to the abortion bans, physicians practicing in Idaho, South Carolina, Tennessee, and Texas have filed lawsuits challenging the vagueness, narrowness, and lack of deference to physician judgment of the medical exceptions in state abortion bans. Among other claims, these challenges contend the vagueness of the exceptions unduly places physicians’ livelihoods and liberty at stake. Additionally, a complaint filed by South Carolina providers argues the state ban’s exceptions violate their First Amendment rights to practice their faith, which includes beliefs that they should use their medical training to honor patients’ requests to end pregnancies that threaten to profoundly harm them or when a fetus is diagnosed with a fatal anomaly, beyond what the exceptions allow.
The Texas Supreme Court has issued rulings in both the challenges in the state – Zurawski v. Texas and Cox v. Texas – ruling in favor of the state and leaving the narrow exceptions untouched. A Tennessee court partly granted a preliminary injunction blocking the state from taking disciplinary action against physicians who provide abortion care to safeguard the health of the pregnant person (unlike Texas, Tennessee has a health exception to their abortion ban). However, because the court lacked authority over criminal laws, it did not block criminal enforcement of the law against physicians. Whether or not these lawsuits will ultimately expand the scope of the exceptions or the deference granted to physician judgment will depend on the rulings of each state’s respective supreme court.
Poll: Two Thirds Believe Dissolving USAID Will Lead to More Illness and Death Globally, While Nearly Half Say It Would Significantly Reduce the Budget Deficit and Fund Domestic Programs
Most of the Public Thinks Foreign Aid Accounts for a Much Larger Share of Federal Spending than It Does, and That Misperception Contributes to People’s Support for Budget Cuts
As the Trump administration works to dissolve the U.S. Agency for International Development (USAID), a new KFF poll finds that two-thirds (67%) of the public believe these actions will increase illness and death in low-income countries, and a similar majority (62%) believe it will result in more humanitarian crises around the world.At the same time, nearly half of the public believe the dissolution of USAID will significantly reduce the U.S. budget deficit (47%) and allow funds to be redirected to domestic programs (47%). Views on the impact of downsizing USAID divide sharply along partisan lines, with most Democrats and independents expecting more illness and death in low-income countries (91% and 69%, respectively), and most Republicans expecting positive impacts on domestic programs (72%) and the budget deficit (67%).The poll also finds that most of the public grossly overestimates how much the federal government spends on foreign aid. When informed that it is actually about 1% of the federal budget, far fewer people say the U.S. spends “too much” on foreign aid.
About one in ten (11%) adults correctly estimate that 1% or less of the federal budget goes to foreign aid, with others guessing higher amounts, including more than half (54%) who guess more than 10%. On average, U.S. adults guess that foreign aid accounts for 26% of the federal budget.When initially asked about the level of U.S. foreign aid prior to President Trump taking office, most say the country was spending “too much” (58%). After being informed that foreign aid accounts for about 1% of the federal budget, the share of the public who says that the U.S. spends too much on foreign aid drops more than 20 percentage points to one-third (34%). This shift is similar across partisans. After hearing that only about 1% percent of the federal budget is spent on foreign aid, the share saying the U.S. spends too much drops to 50% among Republicans, 39% among independents, and 15% among Democrats.
The Public is More Supportive of Global Health Spending than Foreign Aid Overall
The poll also finds that half (50%) of the public believe the U.S. should play “the leading role” or “a major role” in efforts to improve health for people in developing countries. About a third (36%) say the U.S. should play a minor role in global health, while fewer (14%) say it should not play any role.Republicans’ views on the role that the U.S. should play in global health have shifted since President Trump’s first term. In the most recent poll, one-third (32%) of Republicans say the U.S. should play at least a major role in improving the health of people in developing countries, down from about half in KFF polls in 2016 and 2018. At the same time, the share of Republicans who say the U.S. should take “no role” in global health has risen from 9% in 2016 to one in four (24%) now.
When asked about U.S. spending on global health, the public is more supportive than they are of spending on foreign aid generally. Nearly six in ten say that prior to President Trump taking office, the U.S. was spending either too little (19%) or about the right amount (37%) to improve health for people in developing countries, while about four in ten (43%) say the U.S. was spending “too much.”Seven in ten adults say spending money on improving health in developing countries helps protect the health of Americans by preventing the spread of infectious diseases, including about nine in ten Democrats (86%) and two-thirds of independents (67%). Republicans are split, with half saying this spending helps Americans in this way (49%) and half saying it does not have much of an impact (51%).
Designed and analyzed by public opinion researchers at KFF. The survey was conducted Feb. 18-25, 2025, online and by telephone among a nationally representative sample of 1,322 U.S. adults in English and in Spanish. The margin of sampling error is plus or minus 3 percentage points for the full sample. For results based on other subgroups, the margin of sampling error may be higher.
As the Trump administration takes steps to dissolve the U.S. Agency for International Development (USAID) and freeze most foreign aid, including global health funding, the latest KFF Health Tracking Poll finds that a majority of the public expect this will lead to increased humanitarian and health crises globally while somewhat fewer expect the move to alleviate domestic fiscal issues. At least six in ten adults say that getting rid of USAID is likely to lead to more illness and death in low-income countries (67%) or more humanitarian crises around the world (62%). On the other hand, smaller shares – but still close to half – say getting rid of USAID will likely allow funds to be redirected to domestic programs (47%) or significantly reduce the U.S. budget deficit (47%). Partisans are strongly divided on the impacts of cutting USAID, with Democrats more likely to anticipate negative health and humanitarian consequences globally and Republicans more likely to expect positive fiscal outcomes at home.
The Trump administration plans to eliminate nearly all of USAID’s foreign aid awards, and though most adults say the U.S. was spending too much on foreign aid before Trump took office, the vast majority of the public do not want aid to be eliminated entirely. Just over one in ten (13%) say that, prior to Trump taking office in January, the U.S. was spending too much on foreign aid, and it should be eliminated entirely. Even among Republicans, the group most likely to say the U.S. was spending too much in this area before President Trump took office this year, scaling back on global health spending is more popular than ending all spending by a two-to-one ratio.
Overall, there is broad support for the U.S. playing a role in improving the health for people in developing countries, though the share of Republicans saying the U.S. should play a major role in this area has declined since 2016. Half of the public says the U.S. should take a leading or major role in improving health for people in developing countries, while about one-third (36%) say the U.S. should take a “minor role.” Just over half the public says that before Trump took office this year, the U.S. was spending too little (19%) or about the right amount (37%) on these efforts. Partisans divide on the role the U.S. should play and how much the country should spend, with most Republicans saying the U.S. should play a minor or no role and that it spends too much on health in developing countries, while majorities of Democrats want the U.S. to play a leading or major role and say the U.S. spends too little or the right amount. Few across partisans say the U.S. should not play a role at all in improving the health of people in developing countries.
In addition, the public continues to recognize a benefit of spending money on global health, including preventing rising infectious diseases from spreading to the U.S. A large majority of adults say that spending money on improving health in developing countries helps protect the health of Americans by preventing the spread of infectious diseases, including about nine in ten Democrats (86%) and two-thirds of independents (67%). Republicans are split, with half saying this spending helps Americans in this way (49%), down from 68% in 2016.
The public’s views on foreign aid may be shaped by misconceptions about its cost. Most U.S. adults overestimate the share of the federal budget that goes towards foreign aid, and attitudes towards spending shift once people know more information. Nearly nine in ten (86%) adults overestimate the share of the federal budget spent on foreign aid, saying on average that the U.S. spends about a quarter (26%) of its budget on foreign aid. And, after hearing that foreign aid accounts for about one percent of the federal budget, the share of the public who say that the U.S. spends too much on foreign aid drops more than twenty percentage points from six in ten (58%) to one-third (34%). This pattern is consistent across partisans.
Most U.S. Adults Say Downsizing USAID Will Lead to Health and Humanitarian Crises; About Half Say It Will Alleviate the Federal Deficit
Since the start of his second term, President Trump and his administration have taken steps to dissolve the U.S. Agency for International Development, or USAID, and freeze most foreign aid, including global health funding. So far, the administration has removed the USAID website, let go of most of the agency’s staff, and hundreds of the agency’s awards and contracts have been canceled. There have been several legal challenges to the Trump administration’s actions, and as of this poll finding, cases are continuing to make their way through the courts. These executive actions have far-reaching implications for the U.S.’s involvement in global health.
News of the Trump administration’s action on USAID seems to be reaching people across the political spectrum as majorities across partisans, including about seven in ten Harris voters (71%) and Trump voters (68%), say they have heard “a lot” or “some” about the administration’s plans.
Most of the public thinks the downsizing of USAID will lead to increased risks to global health, while about half say these cuts will improve national budget issues. Two-thirds of the public overall say that getting rid of USAID will likely lead to more illness and death in low-income countries (67%), including about one-third (32%) who say this is “very likely” and about one-third (35%) who say this is “somewhat likely.” A similar majority says dismantling USAID will likely result in more humanitarian crises around the world (62%), with three in ten saying this is very likely (29%) and one-third (34%) saying it is “somewhat likely.” Much smaller shares – about one in ten (11%) – say either of these outcomes is “not at all likely.”
The public is split on whether they expect the dismantling of USAID to pose a safety issue at home. About half of adults say that eliminating USAID will make the U.S. less safe (52%), including about one in five (22%) who say this is “very likely” and three in ten (29%) who say it is “somewhat likely.” Half of the public says eliminating USAID is “not very likely” (28%) or “not at all likely” (19%) to make the U.S. less safe.
The public is also split on their assessment of the likelihood of some positive consequences of reducing USAID. About half of adults say it is at least somewhat likely that getting rid of USAID will allow funds to be redirected to domestic programs (47%) or significantly reduce the U.S. budget deficit (47%). Smaller shares say either of these outcomes is “very likely” (15% and 12%, respectively). Because foreign aid spending, much of which is provided through USAID, makes up such a small percentage of the overall federal budget, its reduction will not significantly reduce the deficit.
The public is split along party lines in their views on the consequences of dismantling USAID. Large majorities of Democrats say it would lead to health and humanitarian crises and make the U.S. less safe, while at least two-thirds of Republicans say cutting USAID is likely to result in positive effects on domestic fiscal issues. About nine in ten Democrats say ending the agency would likely lead to more illness and death in low-income countries (91%), while about four in ten (42%) Republicans agree. Similarly, about nine in ten Democrats say it will likely lead to more humanitarian crises worldwide (87%). About four in ten (37%) Republicans say the same. Two-thirds of independents say these negative global health consequences are likely.
Larger shares of Democrats also see safety risks, with nearly eight in ten Democrats saying getting rid of USAID will make the U.S. less safe (78%). Half of independents (51%) and one in four Republicans (24%) agree.
Republicans are more aligned with the Trump administration’s rationale for cutting USAID. Two-thirds (67%) say it is likely that this move will significantly reduce the U.S. federal budget deficit, compared to about three in ten (28%) Democrats and about half (46%) of independents. Similarly, seven in ten (72%) Republicans say it is likely ending USAID will allow for funds to be redirected to domestic programs, while smaller shares of independents (45%) and Democrats (27%) agree.
Most of the Public Say the U.S. Spends Too Much on Foreign Aid, But Views Change After Hearing Actual Amount Spent
The Trump administration’s move to cut foreign aid and dismantle USAID is part of the administration’s plan to cut federal spending overall. However, about one percent of the federal budget goes to foreign aid. The public largely overestimates the share of the budget that goes to foreign aid, with about one in ten (11%) adults correctly estimating the share to be about one percent or less. This pattern is consistent with previous KFF polls.
About nine in ten (86%) incorrectly say foreign aid accounts for at least two percent of the federal budget, including more than half (54%) who believe it makes up more than 10 percent. On average, the public says spending on foreign aid makes up roughly one quarter (26%) of the federal budget. Across partisans, the public overestimates the share of the federal budget allocated for foreign aid. However, Republicans are most likely to overestimate foreign aid spending. On average, Republicans say foreign aid accounts for about 31% of the federal budget, while Democrats and independents estimate it to be around one quarter (23% and 24% respectively).
Amid news of the major cuts to foreign aid by the Trump administration, the poll also asked what the public thought about federal spending abroad prior to President Trump taking office. About six in ten U.S. adults say that prior to President Trump taking office this year, the U.S. was spending “too much” on foreign aid (58%), while about one in ten (11%) say the U.S. spent “too little”, and about three in ten (29%) say the U.S. was spending “about the right amount.”
However, after hearing the factual statement that only about one percent of the federal budget is spent on foreign aid, the share who say the U.S. is spending “too much” decreased more than twenty percentage points, down to about one-third (34%) of the public who now say the federal government is spending “too much” on foreign aid. In the same vein, the share of the public who now say the U.S. spends “too little” increased by 17 percentage points to about three in ten (28%).
This shift is similar across partisans. After learning that approximately one percent of the federal budget is spent on foreign aid, the share saying the U.S. spends “too much” declines by 31 percentage points among Republicans, 26 percentage points among independents, and 14 percentage points among Democrats.
Despite court orders to release frozen aid funding, the Trump administration continues to withhold nearly all foreign aid and has just eliminated more than 90% of USAID’s contracts and grants for foreign assistance. Ending all foreign aid spending is not a popular position among the U.S. public, with just about one in ten adults (13%) saying the U.S. should do so. Instead, while many say the U.S. is spending too much, most want to see the U.S. scale back rather than end all spending. In fact, the public prefers scaling back spending over ending all spending by a more than three-to-one ratio (43% compared to 13%).
Across partisans, “scaling back spending” on foreign aid is more favorable than “ending all spending.” Half (53%) of Republicans say the U.S. was spending too much on foreign aid and that it should be scaled back, compared to fewer (28%) who say it should be ended completely. Half of independents prefer scaling back spending, while just one in ten (11%) say all spending on foreign aid should end. While Democrats are much more likely to say that the U.S. spends the right amount on foreign aid, among the 29% who say that the U.S. was spending too much, very few (2%) say this funding should cease.
The Public’s Views on the Role of the U.S. in Global Health
President Trump’s “America First” Agenda emphasizes domestic interests, removing the U.S. from the global arena, including when it comes to global health. In addition to the dismantling of USAID, one of Trump’s first executive orders was to withdraw the U.S. from the World Health Organization (WHO) and to reevaluate and realign U.S. foreign aid, which has led to freezing all foreign aid funding and most programs, limiting the U.S.’s influence and spending on preventing infectious diseases globally. Among the public, there is broad support for the U.S. playing a role in improving health for people in developing countries. Half of the public says that the U.S. should take “the leading role” or “a major role, but not the leading role” in improving health for people in developing countries. About one-third (36%) say the U.S. should take a minor role, while fewer (14%) say the U.S. should not play a role in this area. While Democrats are more likely to want the U.S. to take a leading or major role (69%) in improving the health for people in developing countries, about half of Republicans and key segments of President Trump’s base, including those aligned with the Make America Great Again (MAGA) movement, favor the U.S. taking a “minor role” in global health. Few across political affiliation say the U.S. should have “no role at all.”
Republicans’ views on the U.S.’s role in global health have shifted since President Trump’s first term. KFF polls from 2016 and 2018 show that about half of Republicans at the time supported the U.S. taking at least a major role in improving global health. In the most recent poll, the share of Republicans who support this role for the U.S. has fallen to about one-third (32%). Additionally, the share of Republicans who say the U.S. should take “no role” in improving the health of people in developing countries has risen from 9% in 2016 to about one in four (24%) currently. At the same time, KFF polling does not find a similar shift among Democrats or independents. About seven in ten Democrats and half of independents have consistently said the U.S. should play a “major” or “leading role” in improving global health.
The U.S. global health funding budget is just $12 billion, or less than 0.1% of the overall federal budget. While the process for funding global health is complex, USAID implements most U.S. global health bilateral assistance. When asked about U.S. spending on global health, the public is more supportive than of foreign aid generally. About six in ten say, prior to President Trump taking office, the U.S. was spending too little (19%) or about the right amount (37%) on efforts to improve health for people in developing countries, while about four in ten (43%) say the U.S. was spending “too much.”
Eliminating all spending on efforts to improve the health of people in foreign countries is unpopular among the public. Few adults (11%) saying the Trump administration should end all spending, while about three in ten (31%) say this funding should be scaled back but not eliminated. Even among Republicans, the group most likely to say the U.S. was spending too much in this area before President Trump took office this year, two in ten (22%) say the Trump administration should eliminate all funding for global health.
Two-thirds of adults (67%) say that spending money on improving health in developing countries helps protect the health of Americans by preventing the spread of infectious diseases, including about nine in ten Democrats (86%) and two-thirds of independents (67%). Republicans are split, with half saying this spending helps Americans in this way (49%) and half saying it does not have much of an impact (51%). Previous KFF polling shows that most U.S. adults say the most important reason the U.S. should spend money on global health is because “it is the right thing to do,” but that many people also believe such spending helps protect Americans from infectious diseases.
Attitudes on the benefits of global health spending among Republicans have shifted. A KFF poll from April 2016 showed large majorities of adults across partisans saying that spending money on improving health in developing countries helps protect the health of Americans by preventing the spread of diseases, including nearly seven in ten Republicans (68%). While the share of Democrats recognizing this benefit has increased slightly since 2016, the share of Republicans saying the same has decreased by 17 percentage points.
Methodology
This KFF Health Tracking Poll was designed and analyzed by public opinion researchers at KFF. The survey was conducted February 18-25, 2025, online and by telephone among a nationally representative sample of 1,322 U.S. adults in English (1,254) and in Spanish (68). The sample includes 1,014 adults (n=53 in Spanish) reached through the SSRS Opinion Panel either online (n=992) or over the phone (n=22). The SSRS Opinion Panel is a nationally representative probability-based panel where panel members are recruited randomly in one of two ways: (a) Through invitations mailed to respondents randomly sampled from an Address-Based Sample (ABS) provided by Marketing Systems Groups (MSG) through the U.S. Postal Service’s Computerized Delivery Sequence (CDS); (b) from a dual-frame random digit dial (RDD) sample provided by MSG. For the online panel component, invitations were sent to panel members by email followed by up to three reminder emails.
Another 308 (n=15 in Spanish) adults were reached through random digit dial telephone sample of prepaid cell phone numbers obtained through MSG. Phone numbers used for the prepaid cell phone component were randomly generated from a cell phone sampling frame with disproportionate stratification aimed at reaching Hispanic and non-Hispanic Black respondents. Stratification was based on incidence of the race/ethnicity groups within each frame. Among this prepaid cell phone component, 140 were interviewed by phone and 168 were invited to the web survey via short message service (SMS).
Respondents in the prepaid cell phone sample who were interviewed by phone received a $15 incentive via a check received by mail. Respondents in the prepaid cell phone sample reached via SMS received a $10 electronic gift card incentive. SSRS Opinion Panel respondents received a $5 electronic gift card incentive (some harder-to-reach groups received a $10 electronic gift card). In order to ensure data quality, cases were removed if they failed two or more quality checks: (1) attention check questions in the online version of the questionnaire, (2) had over 30% item non-response, or (3) had a length less than one quarter of the mean length by mode. Based on this criterion, no cases were removed.
The combined cell phone and panel samples were weighted to match the sample’s demographics to the national U.S. adult population using data from the Census Bureau’s 2024 Current Population Survey (CPS), September 2023 Volunteering and Civic Life Supplement data from the CPS, and the 2024 KFF Benchmarking Survey with ABS and prepaid cell phone samples. The demographic variables included in weighting for the general population sample are sex, age, education, race/ethnicity, region, civic engagement, frequency of internet use, political party identification by race/ethnicity, and education. The weights account for differences in the probability of selection for each sample type (prepaid cell phone and panel). This includes adjustment for the sample design and geographic stratification of the cell phone sample, within household probability of selection, and the design of the panel-recruitment procedure.
The margin of sampling error including the design effect for the full sample is plus or minus 3 percentage points. Numbers of respondents and margins of sampling error for key subgroups are shown in the table below. For results based on other subgroups, the margin of sampling error may be higher. Sample sizes and margins of sampling error for other subgroups are available on request. Sampling error is only one of many potential sources of error and there may be other unmeasured error in this or any other public opinion poll. KFF public opinion and survey research is a charter member of the Transparency Initiative of the American Association for Public Opinion Research.
Enhanced subsidies for Affordable Care Act (ACA) Marketplace plans are set to expire at the end of 2025, unless they are renewed by Congress. Since 2021, these enhanced subsidies have lowered monthly premium payments for the vast majority of Marketplace enrollees, across incomes. For example, instead of a lower-income person paying 2% of their income on their premium, they pay nothing. Higher income people currently pay no more than 8.5% of their income on their premium, whereas they were originally ineligible for financial assistance.
While virtually all subsidized ACA enrollees can expect to see their premium payments rise substantially without extension of these subsidies, most will still be eligible for some financial assistance (with the original ACA subsidies). However, those who earn more than four times the federal poverty level ($62,600 for an individual or $128,600 for a family of four with 2026 coverage) would lose eligibility for subsidies altogether and would therefore have to pay full price for their health plans. Based on 2025 premiums, for example, a 60-year-old couple earning $85,000 annually (416% of the federal poverty level in the contiguous 48 states), would see their monthly premium payment increase by $1,507 per month (an increase in payments of over $18,000 for the year), on average.
Relative to other Americans, subsidy-eligible individual market enrollees with incomes over four times poverty (who would lose subsidy eligibility if enhanced tax credits expire) are disproportionately:
Early and pre-retirees: About half (51%) of enrollees with incomes over four times poverty who would lose subsidy eligibility are between the ages of 50 and 64, compared to 23% of the non-elderly U.S. population.
Self-employed: Among non-elderly adults (ages 19 to 64) with incomes over four times poverty who would lose ACA subsidy eligibility, 38% are self-employed, compared to 7% of non-elderly adults (19-64) nationally. Small business owners often rely on the ACA Marketplaces because they do not have employer-sponsored insurance.
Living in rural areas: 15% of people with individual market insurance who would lose subsidy eligibility live outside metropolitan areas, compared to 9% of Americans with incomes over four times poverty. (12% of all Americans live in rural area; this is not statistically different from the share of people who would lose subsidy eligibility living in rural areas.)
Relatively few Marketplace enrollees have incomes above four times poverty. According to administrative data, in 2024, 7% of Marketplace enrollees reported an income over four times poverty, with 3% having an income between four and five times poverty and another 4% with incomes over five times poverty (another 4% did not have a known income and may have also exceeded four times the poverty level, but most likely are not receiving an advanced premium tax credit). However, before the enhanced subsidies were introduced – and particularly in 2017 when there were large premium increases and debates about repealing the ACA – this group of people with incomes over four times poverty were the focus of a great deal of media attention because they were fully exposed to the underlying premiums. For those who were priced out of coverage before the enhanced subsidies, they often faced a choice of being uninsured, or – if they were healthy enough to qualify – buying a short-term (non-ACA-compliant) plan off of the Marketplace.
Note: The data above is based on KFF analysis of the 2024 Current Population Survey Annual Social and Economic Supplement. The analysis includes people under age 65 who buy individual market insurance, are subsidy eligible, and would receive a subsidy based on household income. Household offer units were imputed as described previously; enrollees were considered not subsidy eligible if a member of the unit reported being offered employer-sponsored insurance.
The U.S. health insurance system has become a “complex labyrinth” for consumers to understand and navigate. Whether public or private coverage, the information needed and the hoops the average health care consumer must go through to use their health coverage effectively is itself a public policy concern, exacerbating continued access and affordability challenges. The KFF 2023 Survey of Consumer Experiences with Health Insurance found that half of insured adults have some difficulty understanding at least some aspects of their insurance. This is the first of two Issue Briefs exploring specific survey findings about gaps in understanding health coverage, highlighting problems and federal consumer protections in place today designed to bridge the gap.
This brief discusses how consumers understand what their insurance covers, what to do when coverage for care is denied, and what protections exist to ensure that information is available and coverage determinations are fair, accurate, and timely. The second brief will discuss survey findings of consumer understanding of the cost of their coverage, existing consumer protections designed to assist with understanding how much they will have to pay for a covered service, and balanced billing and other federal consumer health insurance protections.
The Labyrinth
What does a consumer need to know in order to use their health coverage effectively? The U.S. insurance system of managed care networks, utilization review, and changing coverage options can result in a complicated maze for a patient to navigate on their own. Federal and state policymakers have developed a series of incremental reforms to address understanding and transparency for consumers, but these can differ considerably based on the type of coverage, the plan the consumer chooses (if they have a choice), and sometimes, the state where they live. For private coverage in particular, the current regulatory framework is a complicated system of overlapping state and federal standards, sometimes leaving consumers to sort through a barrage of questions in order to get the care they thought was covered by their insurance.
KFF Consumer Survey Findings
The KFF 2023 Survey of Consumer Experiences with Health Insurance (“Consumer Survey”) included a nationally representative sample of 3,605 U.S. adults ages 18 and older with health insurance. The survey asked consumers about their experiences with their health insurance, including questions regarding how well enrollees understood what was covered, insurance problems that arose when enrollees tried to use their insurance, and where they sought help when they experienced insurance problems.
Understanding What is Covered
According to the 2023 KFF Consumer Survey, more than one-third (36%) of all insured adults said it was somewhat or very difficult for them to understand what their insurance will and will not cover. These shares vary by insurance type, with larger shares of those with Affordable Care Act (ACA) Marketplace plans (46%) and employer-sponsored plans (40%) reporting greater difficulty than those with Medicaid (28%) or Medicare (24%) (Figure 1). There were also differences in understanding certain aspects of insurance by demographic characteristics. Hispanic (36%) and White (36%) insured adults were more likely than insured Black adults (26%) to say it is somewhat or very difficult to understand what their insurance will and will not cover. Among insured adults, Hispanic adults (37%) were more likely than their Black (24%) and White (29%) counterparts to say it is at least somewhat difficult to understand their Explanation of Benefits (EOB). (An EOB is a written statement from a health insurance plan explaining what costs it will cover for medical care an enrollee has received and what the enrollee must pay, though it is not a bill). While the precise explanation for these demographic differences is not clear from the survey data, these trends are similar to those found in otherresearch that noted health insurance literacy challenges across consumers generally, but found racial and ethnic disparities. Additionally, about three in ten insured adults ages 18-29 (30%) and 30-49 (28%) found it somewhat or very difficult to understand how to find information about which doctors, hospitals, and other providers are covered in their plan’s network, compared to 13% of insured adults ages 65 and older. (For the full list of consumer items asked about in this question, see the survey toplines.)
Educational attainment does not necessarily explain lack of understanding. The KFF Consumer Survey found that a slightly higher share of college graduates (58%) had difficulty understanding some aspect of their health insurance coverage than those without a college degree (46%). College graduates (43%) were more likely to report that it was somewhat or very difficult to understand what their health insurance will or will not cover compared to those without a college degree (31%). It is not entirely clear why education does not seem to increase understanding of insurance, though one possible explanation is that those with higher educational attainment are more likely to have private insurance (employer-sponsored insurance or Marketplace), with variable and changing insurance designs that may be more difficult to understand generally.
Areas where consumers note trouble with understanding insurance are often consistent with the top problems that consumers face with insurance. About six in ten (58%) insured adults reported experiencing a problem with their health insurance in the past year. This share is even higher (78%) among high utilizers of health care – those who had more than ten visits with a health care provider in the past year. While having a problem with health insurance does not necessarily indicate that a consumer had trouble understanding their insurance, determining what services are covered and what providers are in-network are items that cut across both topics. Several survey respondents reported problems related to using insurance that involved services or providers not covered by their plan. For example, 18% of insured adults indicated that their health insurance did not pay for a service that they thought was covered. Those with employer-sponsored (21%) and Marketplace (20%) coverage were more likely to report having this problem than those with Medicaid (12%) or Medicare (10%) (Figure 2). A somewhat larger share of insured Black (17%) and Hispanic (16%) adults reported that a doctor or hospital they needed was not covered by their insurance in the past 12 months compared to White adults (12%). Marketplace (20%) and Medicaid (19%) enrollees were more likely to encounter this problem than those with Medicare (9%) or employer-sponsored insurance (ESI) (13%). One in five (20%) insured adults ages 30-64 reported their health insurance denied or delayed a prior approval request in the past 12 months, relative to 11% of those ages 18-29 (11%) and 9% of those age 65 and older. (For the full list of consumer problems asked about in this question, see the survey toplines.)
Knowing Where To Go For Help
What actions, if any, consumers take when they encounter a problem with their health insurance might be instructive in addressing barriers to understanding coverage or best practices to assist consumers in navigating coverage questions.
Among the nearly six in ten insured adults who reported experiencing problems with their health insurance in the past 12 months, more than half (53%) said they contacted their health insurance company to resolve the problem(s) (Figure 3). A similar share (49%) said that they referred to their health insurance website or documents. Fewer said they asked a Navigator or broker for help (11%) or contacted their state Consumer Assistance Program or Ombudsman (3%).
Nearly three in five (57%) of all insured adults reported contacting their insurance at least once in the past 12 months, either by phone, online, in-person, or in writing(Figure 4). Forty-two percent of insured adults did not contact their insurance company at all. Among those who did reach out to their insurance at least once, half (50%) inquired whether a health care expense (such as a prescription, procedure, treatment, or visit with a health care provider) was covered by their health insurance, making it the most common reason for contacting their insurance. Receiving a medical bill (42%) was another reason insured adults contacted their insurance, followed closely by finding out what steps needed to be taken for their insurance to cover a prescription, procedure, or medical visit (39%). Fewer (31%) contacted their insurance at least once in the past year to find out how much a medical procedure would cost out-of-pocket.
Most insured adults are unaware that they have the legal right to appeal to a government agency or independent medical expert if their health insurance refuses to cover needed medical services(Figure 5). Those with public insurance are more likely than those with private insurance to be aware of this right. Just one-third (34%) of those with ESI or Marketplace coverage know they have this right, compared to 58% of Medicare beneficiaries and 45% of those with Medicaid. Further, just one in ten (10%) insured adults who experienced a problem with their health insurance in the past year filed a complaint with their health insurance company (data not shown). This share is similar across all four coverage types.
Three-quarters (76%) of adults with insurance reported not knowing what government agency they would call for help if they wanted to. Adults with ESI (83%) or Marketplace (81%) coverage were more likely to report that they did not know which government agency to contact compared to Medicare (61%) and Medicaid (70%) enrollees. Among insured adults with ESI or Marketplace coverage who reported that they did know which government agency they would contact, 15% of those with ESI and 6% of those with Marketplace coverage reported that they would reach out to their state insurance department/commission(er), the lead agency that is responsible for regulating non-group health coverage and insured group coverage. No one reported that they would contact the Department of Labor (DOL), the government agency that regulates health plans sponsored by private employers, including self-insured employer health plans.
Federal Consumer Protections Seek to Address Barriers to Understanding Coverage
Many federal reforms have focused on providing consumers with better information about their plan, standardizing and simplifying information, and making sure notice is provided of key design features and reforms. While public programs such as Medicare and Medicaid also provide consumer protections, this section focuses primarily on federal protections for those with private health insurance coverage (individual and employer-sponsored).
Understanding What is Covered
The ability to access accurate and easy-to-understand written information has long been a core consumer protection. Below is the landscape of written materials a consumer can access to get information to understand their coverage. Figure 6 is a snapshot of some key consumer protections for those with private insurance.
Coverage documents and summaries: All forms of coverage, whether Medicare, Medicaid, or private insurance available through an employer or a health insurance Marketplace, are required as a form of consumer protection to provide information about benefits and coverage, with varying content requirements, formats, and frequency of updates. Although there are fewer required standardized information formats across private coverage than in public programs such as Medicare, the ACA ushered in a standardized template across most private insurance through the Summary of Benefits and Coverage (SBC), with information on key coverage items and exclusions, cost-sharing, and rules for accessing care. All ACA-compliant plans in the individual and group insurance market and all employer-sponsored plans must provide consumers with an SBC.
More detailed coverage documents can extend to one hundred written pages or more; however, electronic formats and machine-readable files may make it easier to access information for those with the technology and ability to research this information. Examples in the private insurance market include state-regulated insurance documents (including Marketplace plans) sometimes called Certificates of Coverage, or plan documents and Summary Plan Descriptions that set out benefits for those in employer group health plans covered by ERISA.
Provider directories and formularies: Provider directories and formularies allow consumers to see what providers and medications are covered by their insurance. While these items might be easy to access online, severalresearchstudies have found that provider directories are often inaccurate. Federal consumer protections across public and private coverage include various features designed to ensure that plans maintain more accurate and up-to-date information. In some cases, these protections also require plans to meet minimum network adequacy standards and test that accuracy through “secret shopper” compliance programs.
Private coverage protections include the No Surprises Act (NSA) requirements, which apply to all private insurance (including employer coverage) and set standards for both plans and in-network providers to ensure accurate provider directory information. Consumers must be reimbursed for cost sharing in excess of in-network amounts when they rely on inaccurate directory information indicating that a provider was in-network. Plans must also continue to cover care from certain providers for a limited period of time after they leave an insurance network.
There is little research on prescription drug formulary accuracy and how consumers determine what medications are covered, but some public programs have model formulary templates to make it easier for consumers to review. There are no federal standards for private employer plans for formulary format, accuracy, and usability.
Consumer notice of rights, disclaimers, and marketing restrictions: Nearly every new consumer protection includes a requirement on an employer or insurance plan and/or provider to notify patients that the protection exists. For example, the NSA requires providers and facilities, as well as plans, to provide patients with information about the NSA’s balanced billing protections. Other federal reforms are meant to alert consumers about aspects of their coverage that might easily be misunderstood with a clear warning or disclaimer. For instance, federal rules for short-term limited duration coverage require a prominent statement that this coverage is “NOT COMPREHENSIVE COVERAGE.” This federally required warning on plan materials, as well as one for fixed indemnity plans, has been the subject of recent litigation questioning the need for and validity of these disclaimers. Another federal agency, the Federal Trade Commission, enforces protections against unfair or deceptive marketing or advertising to consumers that, for example, misrepresents certain limited coverage arrangements as comprehensive health insurance. Several recent investigations have been in collaboration with the federal health insurance agency Centers for Medicare and Medicaid Services (CMS).
Information about coverage determinations and appeals: Even if a consumer has located written information that an item, service, or provider visit is covered by their insurance, they could still face a denial of coverage (e.g., because the plan does not deem the care “medically necessary”), which can create frustrating hurdles for consumers. Medicare and Medicaid have longstanding processes for claims review and appeals. Private coverage also includes certain protections including:
Processes for reviewing claims: All private insurers and employer plans must ensure a “full and fair” review of enrollee claims. In addition, the ACA includes a “transparency in coverage” provision that requires all non-grandfathered private health plans to provide information and statistics about plan practices to the public and to federal and state agencies, including data on claims payment policies and procedures and the number of claims denied.
Prior authorization: The longstanding practice of health plans requiring patients to obtain approval for a health care service or medication before the care is provided has received renewed scrutiny in recent years. New federal protections issued in 2024 and effective in 2027 streamline the process and require aggregate reporting of the number of claims denials for federal Marketplace plans as well as Medicare Advantage and Medicaid managed care organizations.
Information about why a claim was denied: Health insurers and employer plans must clearly disclose to consumers the reason(s) their claim was denied, provide information on their right to appeal the decision, and include the name of any Consumer Assistance Program (CAP) in their state. Consumers can also request more specific information from their plan about the decision (e.g., policy provisions related to the denied claim, names of experts consulted for decision).
Internal appeal to the plan: If a consumer disagrees with a denied claim from their health plan, they can file an internal appeal with their plan. Plans are required to inform consumers of their appeal decision within 30 days for a service not yet received, within 60 days for a service that was already administered, and within 72 hours in urgent medical cases (sometimes less depending on the situation).
External independent review: Consumers whose claims denial is upheld at internal appeal may have the right to an external review by an entity independent of the plan for certain types of claims.
Language assistance and information in alternative formats: Requirements to provide some form of language assistance and auxiliary aids to help with understanding coverage exist across most forms of coverage. Private employer plans have long been required to offer assistance in a non-English language where the plan covers a specific percentage of participants in the plan who are “only literate” in the same non-English language. The ACA requires that the SBC and certain claims and appeal notices be provided in a “culturally and linguistically appropriate manner” by individual and group insurers and self-insured employer plans. This could include items such as oral language services and a notice in a certain non-English language provided to enrollees upon request if they live in a county where 10% or more of the population is literate only in the same non-English language.
Separate language access standards apply to recipients of federal financial assistance, programs that HHS administers, and entities established under the ACA, such as health insurance Marketplaces. As a result, most private insurers participating in public and private insurance programs (including some who also provide insurance or administrative services to employer-sponsored coverage) must comply.
Effective communication for individuals with disabilities is also required under the ACA. Current regulations likely extend to information about health insurance coverage through the use of “auxiliary aids” for individuals with disabilities, such as sign language interpreters onsite or by video. Electronic information technology used to provide information about health coverage to enrollees must also be accessible for individuals with disabilities unless doing so creates an undue burden or fundamentally alters the program. Similar access standards for persons with disabilities might also apply to those who sponsor coverage and are also subject to the Americans with Disabilities Act or the Rehabilitation Act.
Direct Assistance
Some consumers may seek one-on-one communication to understand technical details in an insurance coverage document, to get more information about plan or provider policies and procedures, or to navigate the claims appeal process. The 2023 KFF Consumer Survey indicates that more insured adults reach out to their insurance company when encountering a problem than look to written plan material for resolution. Ensuring that consumers have access to effective and impartial one-on-one help has been the subject of federal consumer protection requirements. Figure 7 is a snapshot of key channels for direct consumer assistance.
Customer service options: Private insurers generally make certain customer services available to enrollees. Customer service provided by health plans is commonly offered via call centers, electronic messaging platforms, and increasingly, virtual chatbots. States may have specific customer service requirements for insurers selling state-regulated plans, such as call center wait time standards or staffing a minimum number of customer service representatives.
Health insurance marketplaces are required to provide consumer tools. Healthcare.gov operates a toll-free call center 24 hours a day, 7 days a week, for consumers with questions related to the federal health insurance Marketplace. The ACA also requires all state-based marketplaces to provide a live call center during their hours of operation. Call center representatives must assist consumers with inquiries related to qualified health plans, enrollment, cost-sharing reductions, and advanced premium tax credits (APTCs). Beyond relying just on insurers to provide this information, Congress also created the Navigator grant program to give enrollees access to an additional source of information from organizations other than health insurers to help navigate Marketplace coverage.
For those with private employer-sponsored coverage, there is no specific requirement under federal law to provide direct assistance to help covered employees and their families. Human resources staff sometimes perform this role if a consumer is unable to get answers from customer service personnel available from their insurer or third-party administrator. Some firms contract with third-party vendors to provide patient navigation or “concierge” services that help enrollees navigate plan services and advocate for enrollees as patients, among other services. According to the KFF Employer Health Benefits Survey, in 2024, 29% of firms with 200 or more employees that offered health benefits contracted with a vendor to provide “concierge” services to their enrollees. Separately, the DOL’s Employee Benefits Security Administration (EBSA) operates a toll-free phone number and an online message platform for consumers with questions or concerns related to federal legal requirements, obtaining health plan documents, and assistance getting claims paid.
Funding to state and other entities providing direct assistance: Before the ACA, some states had already established their own Consumer Assistance Programs (CAPs) or health insurance ombudsman programs to help all consumers explore coverage options or assist in resolving problems with their health insurance. Federal CAP grants as part of the ACA allowed for the improvement of existing programs and the creation of new CAPs in other states. In addition to assisting with consumer education and enrollment, the ACA listed one of the duties of CAPs as “assisting with the filing of complaints and appeals… of group health plans…and providing information about the external appeal process.” However, CAPs still operating today have not been supported by federal grant funding since 2012, effectively eliminating the only federally-funded assistance program available to consumers with employer coverage. Several have ceased operations due to lack of funding.
As referenced above, in addition to CAPs, Navigators were established under the ACA as a program to provide direct assistance to consumers in both HealthCare.gov states and in states that operate their own marketplace. Navigators offer support by conducting public education and outreach, helping consumers apply for financial assistance, assisting with enrollment and post-enrollment issues, and providing fair and impartial information about health plan options. Navigators cannot be insurers, nor can they receive any direct or indirect payment from an insurer. These programs in HealthCare.gov states are funded by federal grants, the amounts of which have fluctuated over the years depending on which political party is in power. In February 2025, the Trump administration announced it would cut funding for the Navigator program from its current $100 million to $10 million for 2026.
Standards for health insurance agents and brokers: Agents and (web)brokers play a large role in selling coverage in the individual and group insurance markets and can assist consumers in understanding their health insurance options and costs. While most agents and brokers are certified and regulated at the state level, federal requirements for those agents and brokers involved with Marketplace plans are meant to protect consumers from fraudulent activity and misleading information from agents and brokers, and to make sure consumers are aware of how they are paid and the possibility of conflicts of interest in steering consumers to certain products that financially benefit the agent/broker/web broker. Federal law also requires agents, brokers, and other service providers that work with private employer plans to disclose to employers how they are paid.
Looking forward
KFF 2023 Consumer Survey findings about how consumers understand and navigate the health insurance system reveal frustrating hurdles to determine what items and services and what providers are covered by their insurance. It presents the question of whether we have a system that is impossible for a consumer to navigate alone, leaving consumers vulnerable to exploitation and confusion as they are caught in the middle of health plan and provider interests and arbitrary boundaries of authority between state and federal agencies. Coming out of an election widely viewed to have turned on concerns about the economy, including health care costs, and following public outrage against insurers following the killing of the United Healthcare CEO at the end of 2024, expect that health care consumer issues will not go away, but perhaps will shift focus to include:
Use of digital technology such as artificial intelligence (AI) to assist consumers: Though imperfect and with some pitfalls, digital technology, including AI, can help consumers navigate the complexities of health insurance. These tools are increasingly being promoted to both companies and individuals and in 2024, nearly two-thirds (64%) of adults say they have used or interacted with AI. AI tools can be appealing to consumers looking for answers to health insurance-related questions without the need to make a phone call, wait on hold, or read through plan documents, and are often available 24/7. From guiding consumers through the insurance claims process, including filing appeals, to helping determine whether a plan that applies coinsurance or copayments for their prescription drugs will meet their needs, and identifying in-network doctors near a patient’s home, these tools have the potential to transform the ways in which people seek health information.
However, AI has also been in the spotlight following investigations and litigation in recent years related to health plans’ use of these tools in making coverage determinations, such as for prior authorization requests and in the claims review process. Much of the existing research and criticisms related to the use of AI in health care more broadly, such as clinical decision-making and claims processing, feature overarching concerns related to their accuracy, reliability, confidentiality, and accessibility that could also apply to consumers using AI and other digital technology to navigate their health insurance.
Patient input in coverage practices: Broader and different mechanisms to gather information about consumer experiences in real time could assist in determining the most pressing concerns for patients and engage more consumers in policy discussions about what structural changes and protections are most needed and impactful for them. One of the largest health insurers recently announced changes aimed at improving the patient experience in using their coverage, expanding consumer support, and improving transparency. Employers are making changes to better oversee and understand their benefit programs and provide consumer input and navigation services as plan sponsors face real scrutiny for the first time under longstanding federal fiduciary requirements.
For the federal government, while deregulation across health care, as well as federal agency upheaval, is likely to be the focus in the coming years, the Trump administration will be tasked with implementing key provisions of the No Surprises Act, which he signed into law, that requires upfront information about what services cost and more accurate provider directories. The Trump administration has already issued an Executive Order for agencies to “rapidly implement” price transparency regulations.
Promoting other forms of coverage: A reaction to the health insurance labyrinth has some promoting mechanisms to move away from traditional insurance to direct payment alternatives such as direct primary care arrangements and account-based arrangements where consumers use dollars available in a health savings account or other type of account to purchase care. The pros and cons of these arrangements will be up for debate, as well as whether consumers—especially those with lower incomes and/or chronic illnesses—are well served by the financial and coverage limitations that may be part of these arrangements, including existing problems with the price transparency data available to them and the rising cost of care due to provider consolidation. Patients might be faced with a different set of understanding challenges under these arrangements.
Understanding how health coverage works, what services are covered and by whom, and what rights consumers have is one piece of the health insurance labyrinth. The second brief in this series on consumer understanding will focus on the cost-related aspects and challenges of health insurance and health care.
This work was supported in part by a grant from the Robert Wood Johnson Foundation. The views and analysis contained here do not necessarily reflect the views of the Foundation. KFF maintains full editorial control over all of its policy analysis, polling, and journalism.
This is Irving Washington and Hagere Yilma. We direct KFF’s Health Information and Trust Initiative and on behalf of all our colleagues at KFF, we’re pleased to bring you this edition of our bi-weekly Monitor.
This volume discusses the spread of race-based vaccine myths amid measles outbreaks, along with shifts in health communication from fact-checking to fostering open dialogue. It also explains common misconceptions about heart attack treatment and prevention, a new scientific journal that questions established science, and gaps in research standards for AI chatbots used in healthcare.
As a measles outbreak in Texas worsens and other cases are reported in the country, misinformation about vaccines continues to spread, influencing public perception and fueling hesitancy. One recurring narrative falsely claims that Black children should follow a different vaccine schedule than children of other races because of alleged differences in immune systems. Some research has shown that people of African descent may demonstrate, on average, a stronger immune response to the rubella vaccine. However, the study’s authors state that the data does not support that there is a need for different vaccine schedules based on race. The claim spread in news and social media after it was brought up during Robert F. Kennedy Jr.’s Senate confirmation hearings, with social media posts both debunking and supporting this narrative.
One of the most popular social media posts on the topic came from Senator Angela Alsobrooks, who shared a video clip on X of her asking Kennedy about these claims during the confirmation hearing and expressing her concern about the dangers of this narrative. The post received approximately 164,000 likes and 30,000 reposts, and 15,000 comments as of February 19. While many commenters shared Alsobrooks’ concern, some perpetuated the misconception that biological differences in vaccine safety are supported by evidence. In some instances, commenters cited cases in which race-based medicine is used in other domains as justification for biological differences in medication effectiveness. But scientists have emphasized that race is a social construct, not a biological category, and using it as a proxy for genetics has led to harmful medical practices.
Despite decades of credible research showing that vaccines are not associated with autism, narratives linking vaccines to autism in Black children have also gained traction, sometimes citing a retracted study of 2004 CDC data. The study, which claimed that Black boys who received the MMR vaccine on schedule were diagnosed with autism at higher rates than other children who did not receive the vaccine on time, was retracted due to flawed methods and the lead author’s undisclosed ties to the anti-vaccine group, Children’s Health Defense. Other claims that vaccines cause autism cite a debunked study, commonly referred to as the “Mawson Study”, which is not about race-related risk but reports an alleged connection between vaccines and autism. However, the study was not published in a peer-reviewed journal, was funded by an anti-vaccine group, and authored by researchers with a history of publishing vaccine-related research that was later retracted. This belief, alongside other unfounded concerns about vaccine safety, may be fueling the decline in childhood vaccination rates, which has led to outbreaks of vaccine-preventable diseases like measles.
Polling Insights:
KFF’s January 2025 Tracking Poll on Health Information and Trust found that majorities of parents say they keep their children up to date on vaccinations (82%), support public schools requiring vaccines for students (76%), and believe the benefits of childhood MMR vaccines outweigh the risks (72%). While majorities of parents across partisanship express each of these views, the shares answering in the pro-vaccine direction are notably larger among parents who identify as Democrats or lean that way, compared to their Republican and Republican-leaning counterparts.
The Field of Health Communication Explores Moving Beyond Fact-Checking to Foster Dialogue
Blue Images / Getty Images
Some health communication professionals are shifting their approach to promoting accurate health beliefs, moving beyond reactive fact-checking to open conversations that help people weigh benefits and risks more accurately. One emerging strategy, known as bypassing, focuses on presenting relevant facts rather than directly debunking misinformation. For example, instead of stating that “aluminum in vaccines causes bone problems” is false, bypassing highlights that “the aluminum in vaccines enhances their effectiveness in preventing disease.” Research suggests this approach may be more effective at changing personal attitudes, though its impact on policy views is less clear. Fostering open conversations may also allow health professionals to share nuances of scientific information in an accessible manner. For topics like vaccines, simply emphasizing their safety and effectiveness may not be enough as it fails to address public concerns and skepticism. Members of the Council for Quality Health Communication argue that the phrase “safe and effective” should be replaced with a more nuanced, empathetic approach that explains vaccine benefits in relatable terms, acknowledges uncertainties, and engages with people in ways that resonate with their real-world experiences and values.
New Public Health Journal Co-Founded by Nominee for NIH Director Questions Widely Accepted Science
Mordolff / Getty Images
A new scientific journal, the Journal of the Academy of Public Health, has drawn attention for its potential bias and questioning of scientific consensus. The journal has ties to the news site RealClearPolitics and was co-founded by Dr. Jay Bhattacharya, President Trump’s nominee for NIH director. Another Trump nominee, Dr. Marty Makary, nominee for FDA commissioner serves on the editorial board, although both Makary and Bhattacharya are currently listed as “on leave” from the journal. Its first edition included articles that questioned COVID-19 vaccine trials, suggested a link between DTaP vaccines and childhood asthma, and argued school mask mandates were ineffective. Co-founder Dr. Martin Kulldorff, known for opposing COVID-19 lockdowns and child vaccination, also published a paper claiming that established journals suppress dissenting viewpoints and fail to address public health biases. While the journal’s critiques may appeal to those questioning the prevailing public health consensus, some question its objectivity. The journal is open-access and peer reviewed, but it operates on a membership model where only invited members of the Academy of Public Health can submit articles, which may raise additional questions about how this exclusivity may impact credibility. However, the journal’s divergence from scientific consensus may increase its credibility among Republicans who are less likely than Democrats to list scientific research studies among their top trusted sources for public health information, according to the Rollins-Gallup Public Health Priorities Survey.
False Beliefs About Heart Attack Treatment and Prevention Persist as Heart Disease Remains Leading Cause of Death
Peter Dazeley / Getty Images
Heart disease is the leading cause of death in the U.S. and ongoing research continues to examine new factors like COVID-19 that influence cardiovascular risk. However, misinformation about heart attack treatment and prevention persists. One misconception that has re-emerged is that coughing during a heart attack, sometimes called ‘cough CPR,’ can help maintain blood flow to the heart. Health experts have debunked this, explaining that CPR is used for cardiac arrest, not heart attacks, and that by the time CPR is necessary, a person is typically unable to cough. Additionally, coughing cannot restart a heart that has stopped beating. The confusion likely stems from the use of coughing as a temporary measure during certain arrhythmias in monitored medical settings, leading to the misconception that it can improve heart function during a heart attack and potentially delaying care.
Outdated guidelines may also contribute to misconceptions about heart attack prevention. Daily aspirin use was once widely recommended for healthy adults to reduce heart attack and stroke risk, however, guidelines from the American College of Cardiology and the American Heart Association (AHA) issued in 2019 only recommend aspirin as an option among adults ages 40-70 who have elevated risk of cardiovascular disease. The guidelines also advise against routine aspirin use for healthy adults over 70 due to the risk of gastrointestinal bleeding. Despite this, a survey by the Annenberg Public Policy Center found that this misconception persists, particularly among older adults. The survey found that 18% of people without a personal or family history of heart attack or stroke reported regularly taking low-dose aspirin, and nearly 43% believed its benefits outweigh the risks. Those ages 60 and over were especially likely to take aspirin daily for prevention and to believe in its benefits, despite updated guidance.
AI & Emerging Technology
Gaps in Research Standards for AI Chatbots in Healthcare
Laurence Dutton / Getty Images
As artificial intelligence (AI) continues to shape healthcare, large language models (LLMs) are increasingly consulted for medical advice. However, concerns persist regarding their accuracy, transparency, and safety. A systematic review of 137 studies evaluated the reporting quality of research assessing LLMs’ ability to offer health guidance. Findings revealed that nearly all studies examined closed-source models without disclosing sufficient details about the LLM version or parameters. Most studies relied on subjective measures to assess chatbot performance, and fewer than a third considered ethical, regulatory, or patient safety implications. The variability in study design and reporting highlights a gap in standardized assessment frameworks which may be useful for conducting reliable evaluations of LLMs used in healthcare.
About The Health Information and Trust Initiative: the Health Information and Trust Initiative is a KFF program aimed at tracking health misinformation in the U.S., analyzing its impact on the American people, and mobilizing media to address the problem. Our goal is to be of service to everyone working on health misinformation, strengthen efforts to counter misinformation, and build trust.
The Monitor is a report from KFF’s Health Information and Trust initiative that focuses on recent developments in health information. It’s free and published twice a month.
Support for the Health Information and Trust initiative is provided by the Robert Wood Johnson Foundation (RWJF). The views expressed do not necessarily reflect the views of RWJF and KFF maintains full editorial control over all of its policy analysis, polling, and journalism activities. The Public Good Projects (PGP) provides media monitoring data KFF uses in producing the Monitor.
Managed care is the dominant delivery system for people enrolled in Medicaid. The latest national Medicaid managed care enrollment data (from 2022) show 75% of Medicaid beneficiaries were enrolled in comprehensive managed care organizations (MCOs). While managed care is the dominant Medicaid delivery system, states decide which populations and services to include in managed care arrangements, which leads to considerable variation across states. Additionally, while state requirements for Medicaid managed care plans can be tracked, plans have flexibility in certain areas, including in setting provider payment rates, and plans may choose to offer additional benefits beyond those required by the state.
Early in 2025, there are many factors at play that could have implications for Medicaid managed care plans and the people they serve. At the state level, states and plans have faced considerable rate setting uncertainty after millions of people were disenrolled during the unwinding of the pandemic-era Medicaid continuous enrollment provision. Some firms report that current capitation rates do not align with higher member risk and utilization patterns. Many states have sought federal approval to adjust rates to address these changes amid shifts and uncertainty in state fiscal conditions. At the federal level, talks in Congress about cutting federal Medicaid spending could have implications for coverage as well as plans and providers. Finally, major Medicaid regulations designed to promote quality of care and advance access to care for Medicaid enrollees finalized under the Biden administration could be repealed by Congress or delayed or rewritten by the Trump administration. In this context, this brief describes 10 themes related to the use of comprehensive, risk-based managed care in the Medicaid program.
1. Today, capitated managed care is the dominant way in which states deliver services to Medicaid enrollees.
States design and administer their own Medicaid programs within federal rules. States determine how they will deliver and pay for care for Medicaid beneficiaries. Nearly all states have some form of managed care in place – comprehensive risk-based managed care and/or primary care case management (PCCM) programs.1,2 As of July 2024, 42 states (including DC) contract with comprehensive, risk-based managed care plans to provide care to at least some of their Medicaid beneficiaries (Figure 1). Oklahoma is the latest state to be included in this count, having implemented capitated, comprehensive Medicaid managed care (for most children and adults) on April 1, 2024. Medicaid MCOs provide comprehensive acute care (i.e., most physician and hospital services) and, in some cases, long-term care to Medicaid beneficiaries and are paid a set per member per month payment for these services. For more than three decades, states have increased their reliance on managed care delivery systems with the aim of improving access to certain services, enhancing care coordination and management, and making future costs more predictable. While the shift to MCOs has increased budget predictability for states, the evidence about the impact of managed care on access to care and costs is both limited and mixed.3,4,5
2. In FY 2023, payments to comprehensive risk-based MCOs accounted for over half of Medicaid spending.
In FY 2023, state and federal spending on Medicaid services totaled over $880 billion. Payments made to MCOs accounted for about 52% of total Medicaid spending (Figure 2), unchanged from the previous fiscal year. The share of Medicaid spending on MCOs varies by state, but over three-quarters of MCO states directed at least 40% of total Medicaid dollars to payments to MCOs (Figure 3). State-to-state variation reflects many factors, including the proportion of the state Medicaid population enrolled in MCOs, the health profile of the Medicaid population, whether high-risk/high-cost beneficiaries (e.g., people with disabilities, dual eligible beneficiaries) are included in or excluded from MCO enrollment, and whether long-term care services are included in MCO contracts. As states expand Medicaid managed care to include higher-need, higher-cost beneficiaries, expensive long-term care, and adults newly eligible for Medicaid under the ACA, the share of Medicaid dollars going to MCOs could continue to increase.
3. Three-quarters (75%) of all Medicaid beneficiaries received their care through comprehensive risk-based MCOs.
As of July 2022, nearly 72 million Medicaid enrollees received their care through risk-based MCOs. Thirty MCO states covered at least 75% of Medicaid beneficiaries in MCOs (Figure 4).
Although 2022 data are the most current national data available, enrollment in Medicaid overall grew substantially during the COVID public health emergency when states paused disenrollments, resulting in growth in MCO enrollment as well. At the start of the “unwinding” period, in April 2023, Medicaid enrollment (overall) peaked at 94.5 million, an increase of 23 million or 32% from before the pandemic. Despite millions of disenrollments during the unwinding, nationally, nearly 8 million more people were enrolled in Medicaid/CHIP in October 2024 than in February 2020 (pre-pandemic).
4. Children and adults are groups most likely to be enrolled in MCOs; however, states are increasingly including enrollees with complex needs in MCOs.
As of July 2022, 36 MCO states reported covering 75% or more of all children through MCOs (Figure 5). Of the 39 states that had implemented the ACA Medicaid expansion as of July 2022, 32 states were using MCOs to cover newly eligible adults and most covered more than 75% of beneficiaries in this group through MCOs. Thirty-five MCO states reported covering 75% or more of low-income adults in pre-ACA expansion groups (e.g., parents, pregnant women) through MCOs. Fewer MCO states reported covering 75% or more adults ages 65+ and people eligible through disability. Although this group is still less likely to be enrolled in MCOs than children and adults, over time, states have been moving to include adults ages 65+ and people eligible through disability in MCOs.
5. Five publicly traded firms account for half of MCO enrollment.
States contracted with a total of 282 Medicaid MCOs as of July 2022. MCOs represent a mix of private for-profit, private non-profit, and government plans. As of July 2022, a total of 16 firms operated Medicaid MCOs in two or more states (called “parent” firms), and these firms accounted for over 63% of enrollment in 2022 (Figure 6). Of the 16 parent firms, six are publicly traded, for-profit firms while the remaining ten are non-profit companies. Five firms – Centene, UnitedHealth Group, Elevance (formerly Anthem), Molina, and Aetna/CVS – account for 50% of all Medicaid MCO enrollment (Figure 6). All five are publicly traded companies ranked in the Fortune 500, and four are ranked in the top 100.
6. States make decisions about which services to carve in and out of MCO contracts.
Although MCOs provide comprehensive services to beneficiaries, states may carve specific services out of MCO contracts to fee-for-service systems or limited benefit plans. Services frequently carved out include behavioral health, pharmacy, dental, and long-term care services. However, there has been significant movement across states to carve these services into MCO contracts. While the vast majority of states that contract with MCOs report that the pharmacy benefit is carved into managed care (31 of 42), eight states report that pharmacy benefits are carved out of MCO contracts as of July 2024 (Figure 7). An additional three states (Kentucky, Louisiana, and Mississippi) now contract with a single PBM for the managed care population instead of implementing a traditional carve-out of pharmacy from managed care. (Under this “hybrid” model, MCOs remain at risk for the pharmacy benefit but must contract with the state’s pharmacy benefit manager to process pharmacy claims and pharmacy prior authorizations according to a single formulary and preferred drug list.)
7. Each year, states develop MCO capitation rates that must be actuarially sound and may include risk mitigation strategies.
States pay Medicaid managed care organizations a set per member per month payment for the Medicaid services specified in their contracts. While plans set rates in the commercial and Medicare Advantage markets, Medicaid managed care rates are developed by states and their actuaries and reviewed and approved by CMS. Under federal law, payments to Medicaid MCOs must be actuarially sound.Actuarial soundness means that “the capitation rates are projected to provide for all reasonable, appropriate, and attainable costs that are required under the terms of the contract and for the operation of the managed care plan for the time period and the population covered under the terms of the contract.” Unlike fee-for-service (FFS), capitation provides upfront fixed payments to plans for expected utilization of covered services, administrative costs, and profit. Plan rates are usually set for a 12-month rating period. States may use a variety of mechanisms to adjust plan risk, incentivize plan performance, and ensure payments are not too high or too low, including risk sharing arrangements, risk and acuity adjustments, medical loss ratios (MLRs, which reflect the proportion of total capitation payments received by an MCO spent on clinical services and quality improvement), or incentive and withhold arrangements.
To limit the amount that plans can spend on administration and keep as profit, states are required to develop capitation rates for Medicaid to achieve an MLR of at least 85% in the rate year; 6 however, there is no federal requirement for Medicaid plans to pay remittances to the state if they fail to meet the MLR standard.7 As of July 2024, 34 MCO states reported they always require remittance payments when an MCO does not meet state minimum MLR requirements, while two states indicated they sometimes require MCOs to pay remittances (Figure 8).
8. In 2024, CMS finalized rules to strengthen access standards, but the future of the rules is uncertain.
The Biden administration finalized major Medicaid regulations designed to promote quality of care and advance access to care for Medicaid enrollees. The 2024 Managed Care rule addresses Medicaid managed care access, financing, and quality, including strengthening standards for timely access to care (e.g., through the establishment of national maximum wait time standards for certain “routine” appointments) and states’ monitoring and enforcement efforts. These rules are complex and are set to be implemented over several years. However, Congress may seek to overturn these rules, or the Trump administration could delay implementation or issue new regulations that would undo them. During the first Trump administration, CMS took action to change Medicaid managed care rules, including relaxing rules around network adequacy and beneficiary protections.
States are generally prohibited from contractually directing how a managed care plan pays its providers.8 Subject to CMS approval, however, states may implement certain “state directed payments” (SDPs) that require managed care plans to adopt minimum or maximum provider payment fee schedules, provide uniform dollar or percentage increases to providers (above base payment rates), or implement value-based provider (VBP) payment arrangements.9 In creating state directed payments (in 2016), CMS aimed to help states ensure access to adequate provider networks and to increase use of VBP arrangements. Many states that contract with MCOs use SDPs to make uniform rate increases that are like FFS supplemental payments. State directed payments must meet federal requirements (e.g., must be tied to utilization and delivery of services, be distributed equally to specified providers, and not be conditioned on participation in intergovernmental transfer (IGT) agreements).10 The managed care rules finalized in 2024 permit states to pay hospitals and nursing facilities at the average commercial payment rate (ACR) when using directed payments (higher than the Medicare payment ceiling used for other Medicaid FFS supplemental payments). The 2024 rules also tightened SDP requirements to improve oversight, evaluation, and transparency (e.g., states will be required to report provider level directed payment data) and to ensure state directed payments are tied to actual utilization. Recent reports indicate state directed payments have been a major driver of Medicaid expenditure growth in recent years, and CBO Medicaid projections for 2025-2034 attribute further increases in SDPs (partially tied to the changes in rule) as a factor increasing spending.
In 2024, CMS also finalized a rule focused on improving the prior authorization process including reducing approval wait times and improving transparency. A 2023 KFF survey of consumer experiences with health insurance found that about one in five Medicaid enrollees say they’ve had issues with prior authorization—higher than for most other types of insurance. A July 2023 OIG report found that Medicaid MCOs had an overall prior authorization denial rate of 12.5%–more than 2 times higher than the Medicare Advantage rate (Figure 9), raising concerns about prior authorization and access in Medicaid managed care. OIG recommendations (to CMS) include strengthening state monitoring of denials. Recent MACPAC analysis of denials and appeals in Medicaid managed care resulted in the inclusion of seven recommendations in the March 2024 Report to Congress focused on improving the appeals process and enhancing monitoring and oversight of MCOs.
9. States link financial incentives to quality measures and use contract requirements to advance priorities, including addressing social determinants of health.
States incorporate quality metrics into the ongoing monitoring of their programs, including linking financial incentives like performance bonuses or penalties, capitation withholds, or value-based state directed payments to quality measures. Over three quarters of MCO states reported using at least one financial incentive to promote quality of care as of July 2021 (Figure 10). Financial incentive performance areas most frequently targeted by MCO states include behavioral health, chronic disease management, and perinatal/birth outcomes. Despite activity in this area, detailed performance information at the plan-level frequently has not been made publicly available by state Medicaid agencies, limiting transparency and the ability of Medicaid beneficiaries (and other stakeholders) to assess how plans are performing on key indicators related to access, quality, etc.
In FY 2024, most MCO states reported leveraging Medicaid MCO contracts to promote at least one specified strategy to address social determinants of health (Figure 11). States can also leverage managed care contracts to help reduce health disparities.
10. CMS has taken steps to improve managed care program monitoring and transparency.
The 2016 Medicaid managed care final rule created new managed care reporting requirements for states. CMS, under the Biden administration, developed standard reporting templates (Table 1) and a variety of toolkits and released a series of informational bulletins (2021, 2022, 2023, 2024) to help states improve their monitoring and oversight of managed care programs. Transparency has the potential to promote accountability. To improve transparency, CMS began publicly posting the Managed Care Program Annual Report (MCPAR) and the MLR Summary Reports on Medicaid.gov in 2024. Managed care rules finalized in 2024 include provisions aimed at further strengthening managed care transparency and monitoring, though the fate of these rules remains uncertain.
Posting data relating to the performance of individual MCOs may allow for comparison within and across states. However, limitations and challenges may exist including posting lags and incomplete data (e.g., GAO found 6 states had not submitted required MCPARs for 2022, OIG found MLR reports prepared by plans were missing required data). (States are required to post the MCPAR and Network Adequacy and Access Assurances Report on their websites but some states may not yet be in compliance with these requirements.) It is unclear whether the Trump administration will continue efforts to strengthen managed care oversight and transparency.
PCCM is a managed fee-for-service (FFS) based system in which beneficiaries are enrolled with a primary care provider who is paid a small monthly fee to provide case management services in addition to primary care. ↩︎
While MCOs are the predominant form of Medicaid managed care, millions of other beneficiaries receive at least some Medicaid services, such as behavioral health or dental care, through limited-benefit risk-based plans, known as prepaid inpatient health plans (PIHPs) and prepaid ambulatory health plans (PAHPs). ↩︎
Sparer M. 2012. Medicaid managed care: costs, access, and quality of care. Res. Synth. Rep. 23, Robert Wood Johnson Found., Princeton, NJ ↩︎
Daniel Franco Montoya, Puneet Kaur Chehal, and E. Kathleen Adams, “Medicaid Managed Care’s Effects on Costs, Access, and Quality: An Update,” Annual Review of Public Health 41:1 (2020):537-549 ↩︎

 Josh Michaud
  Jennifer Kates
  Stephanie Oum
  Anna Rouw
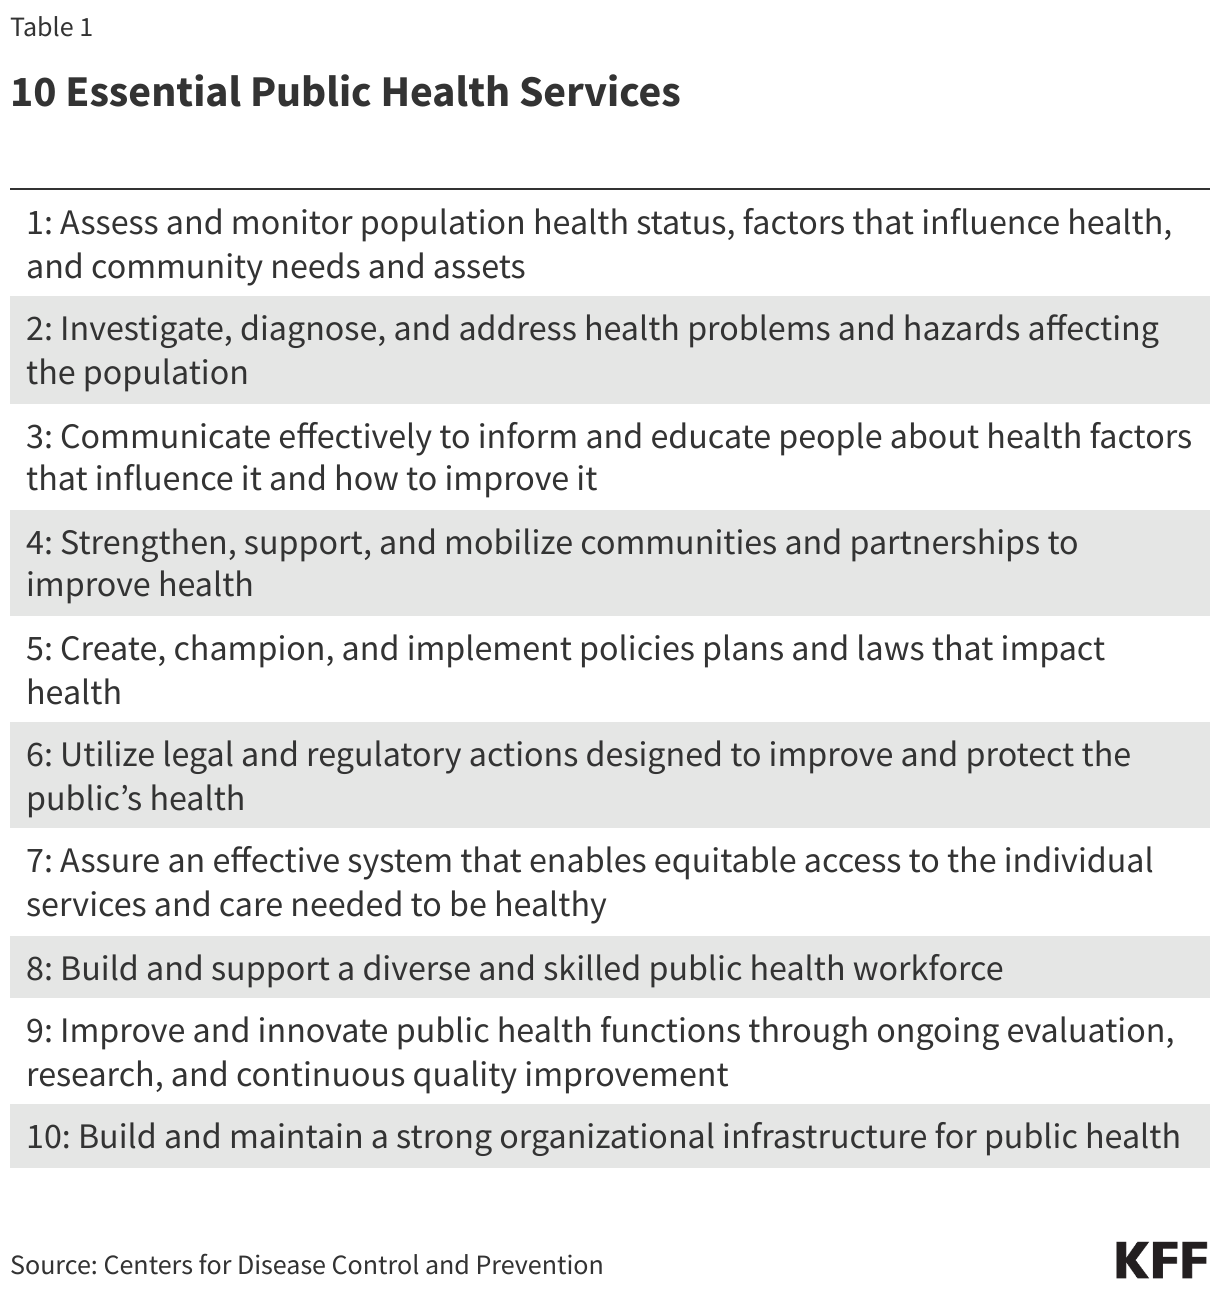
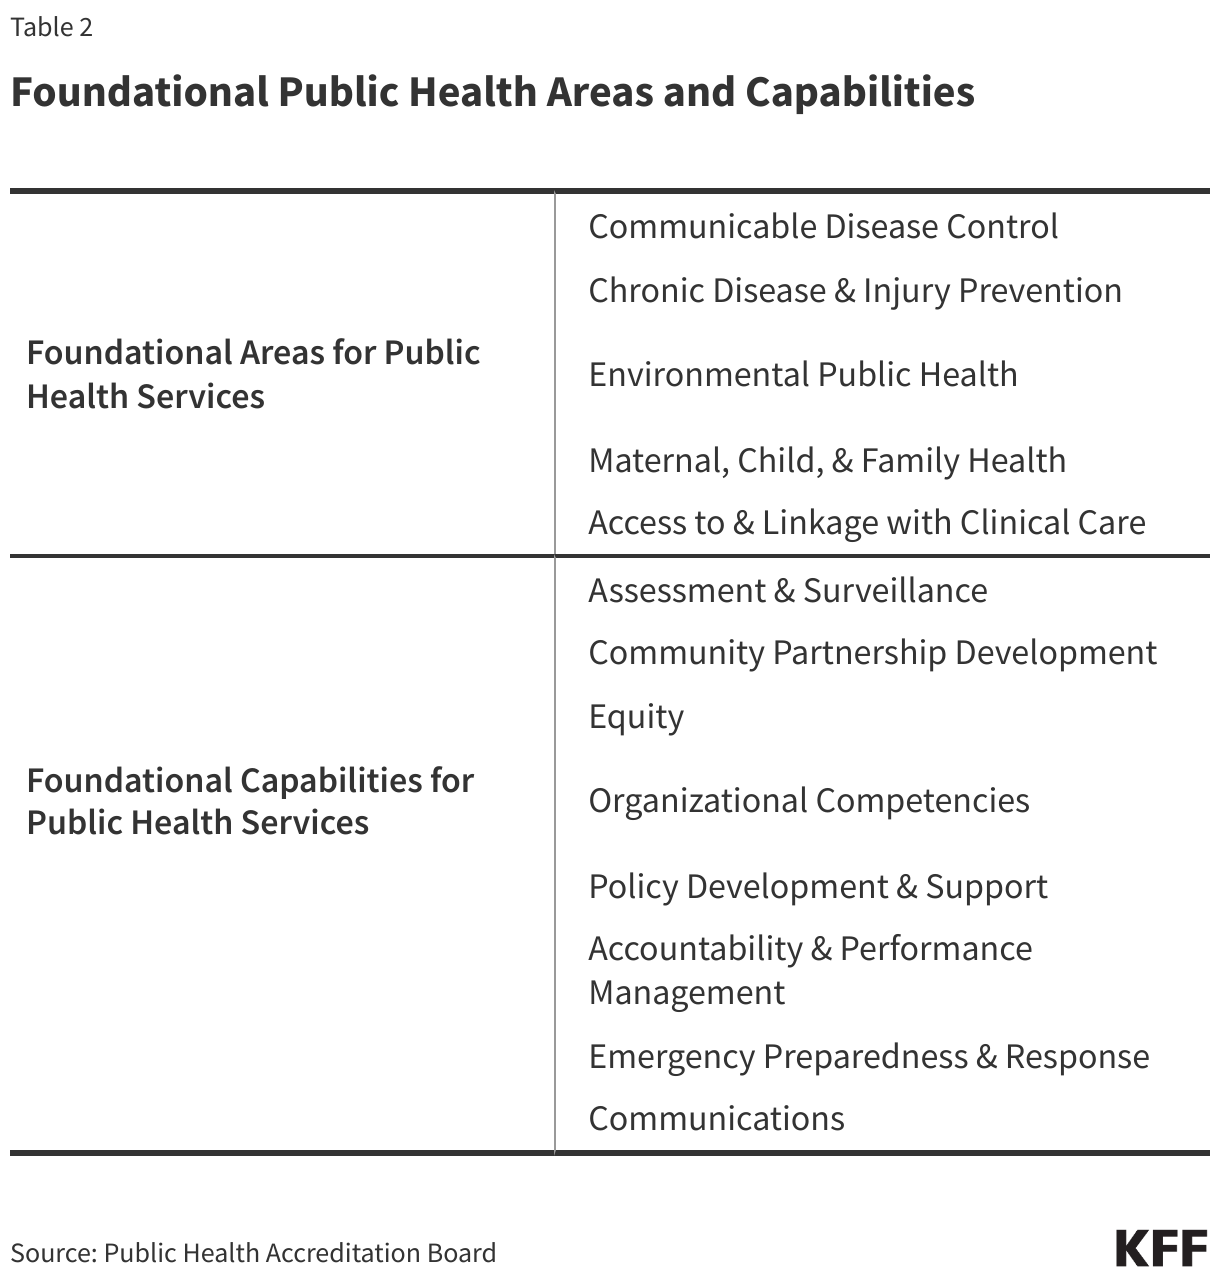

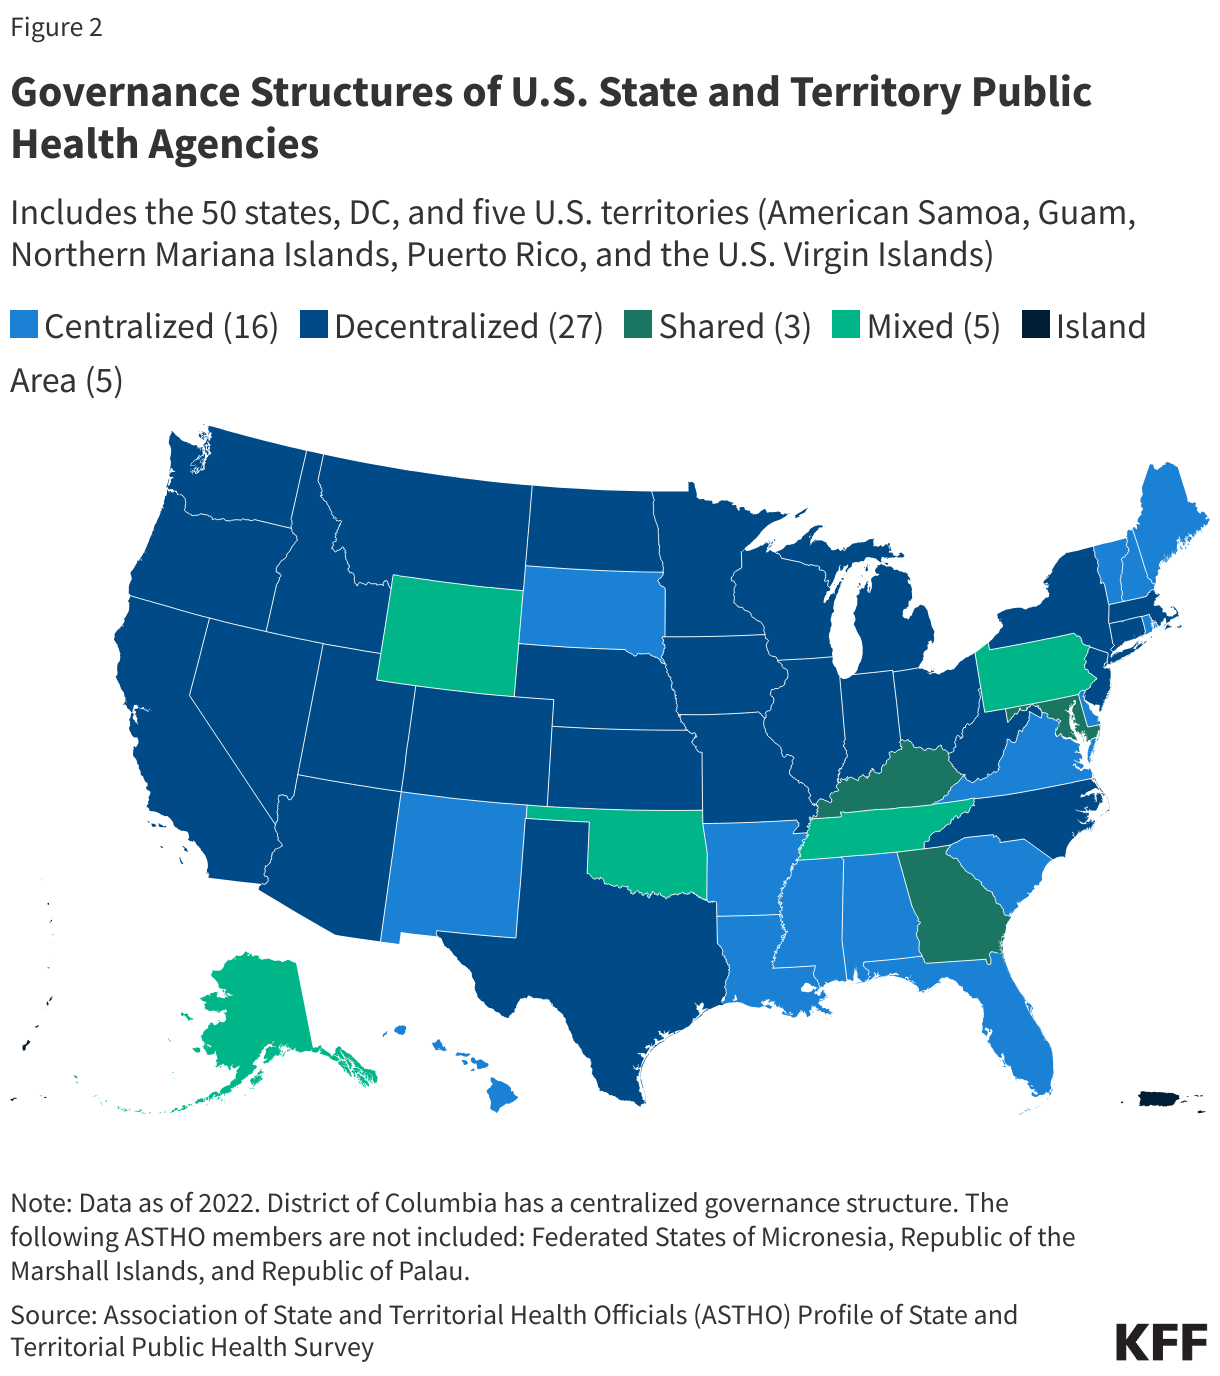
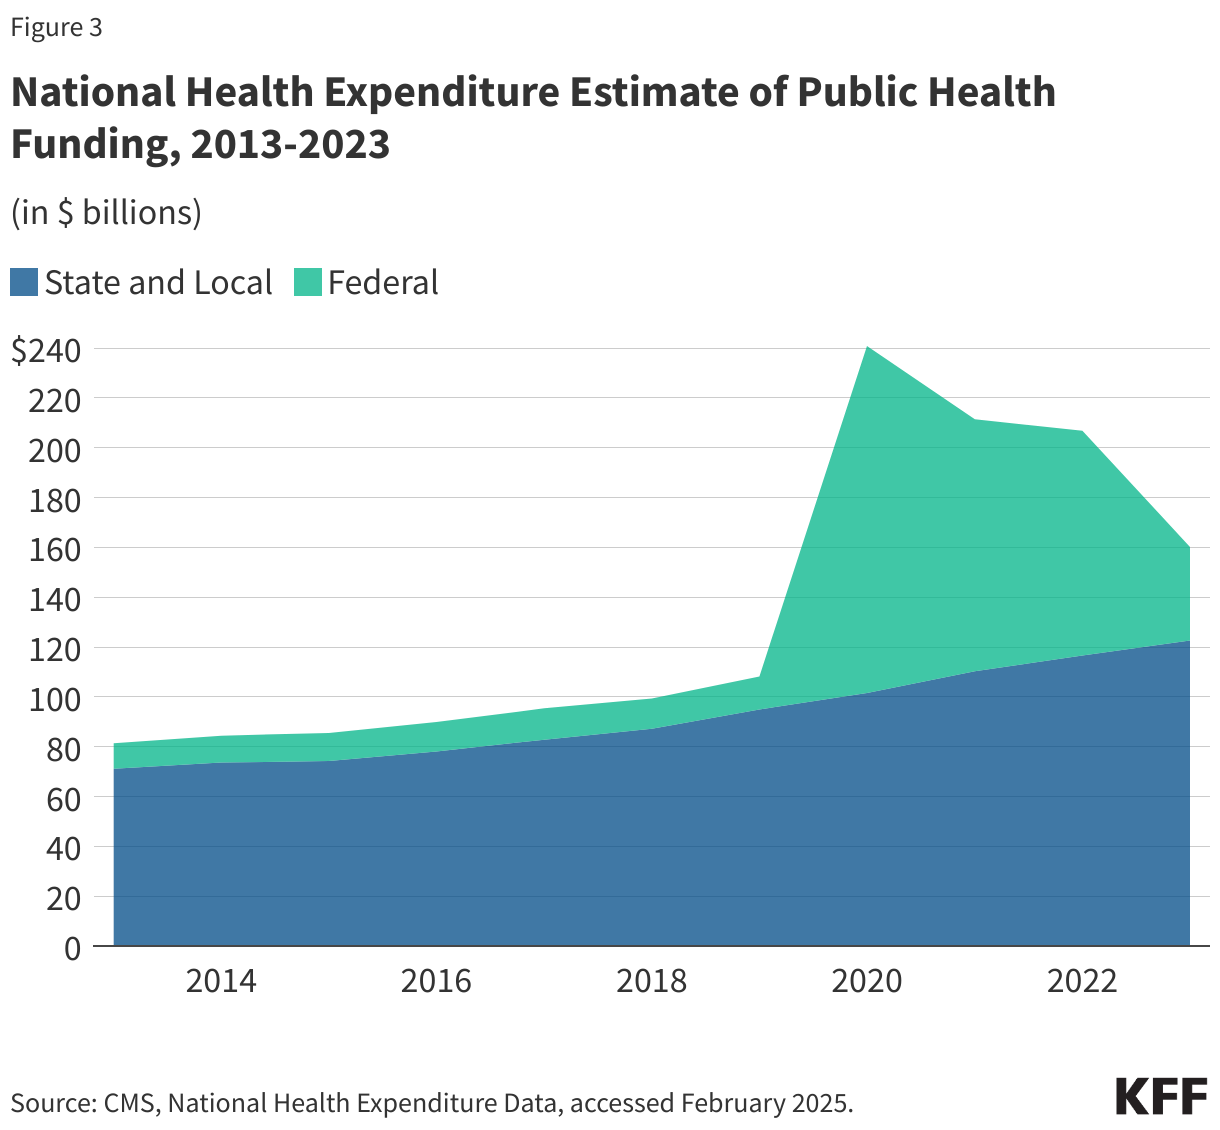
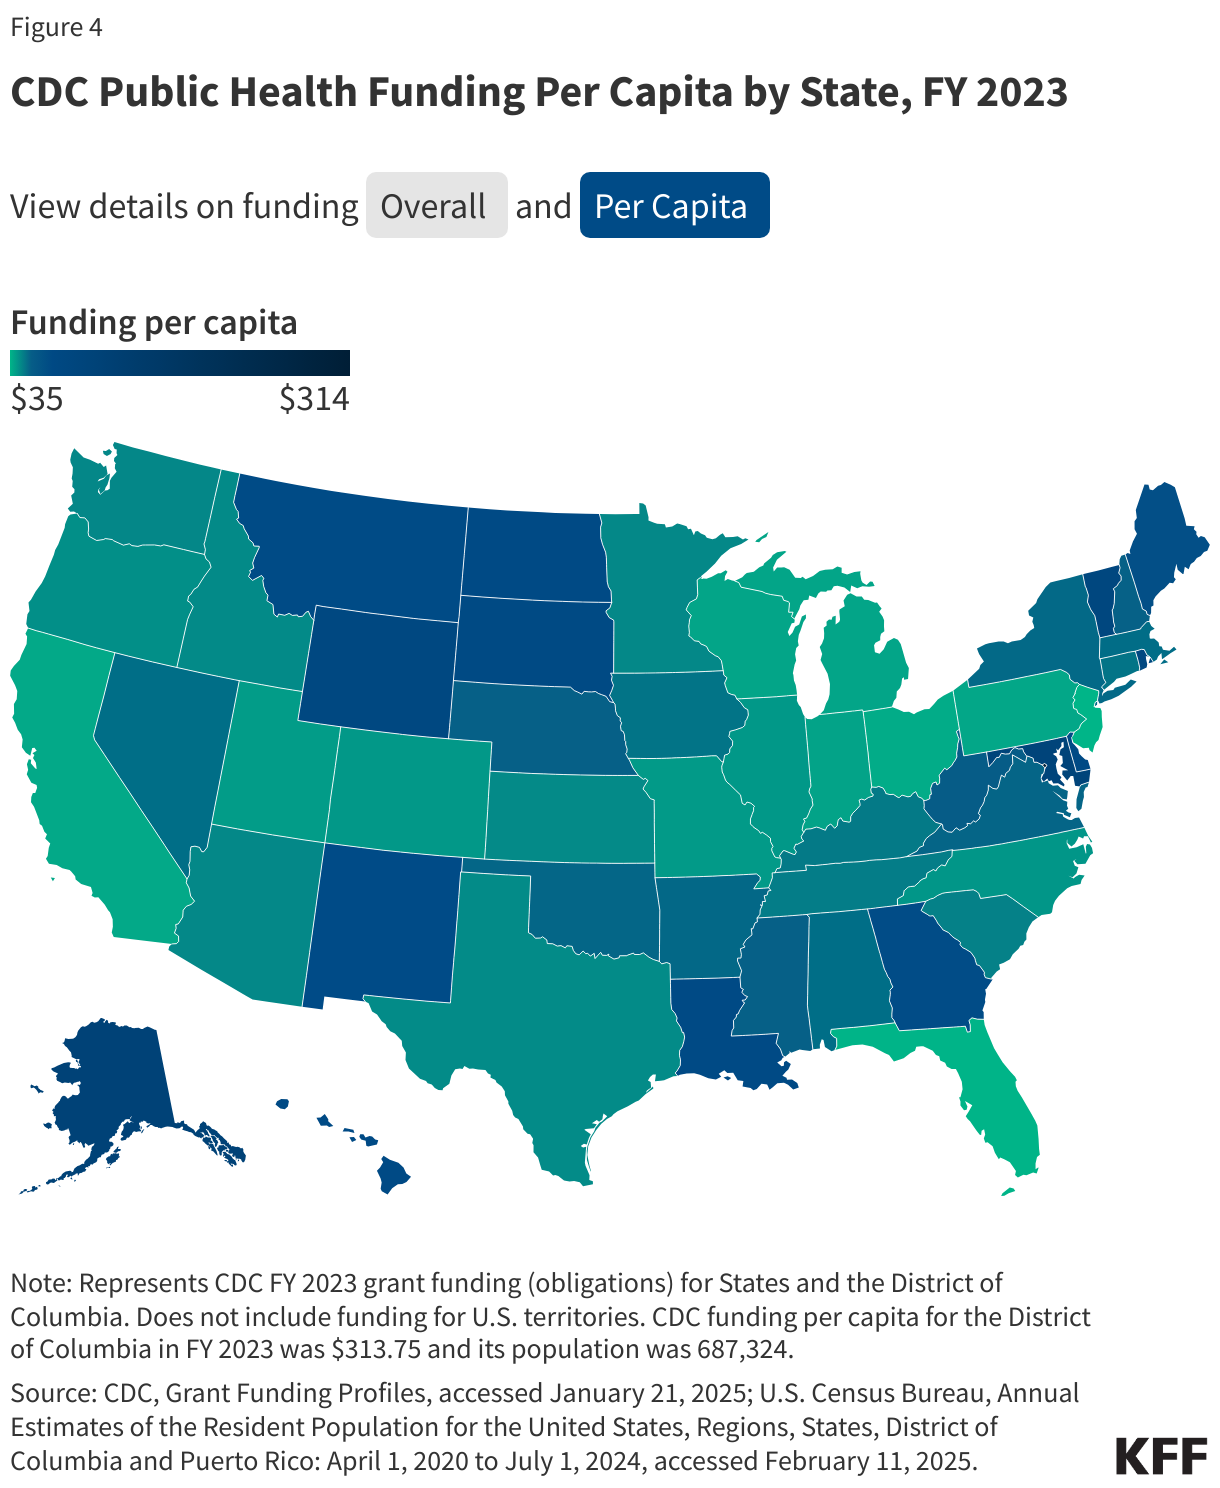
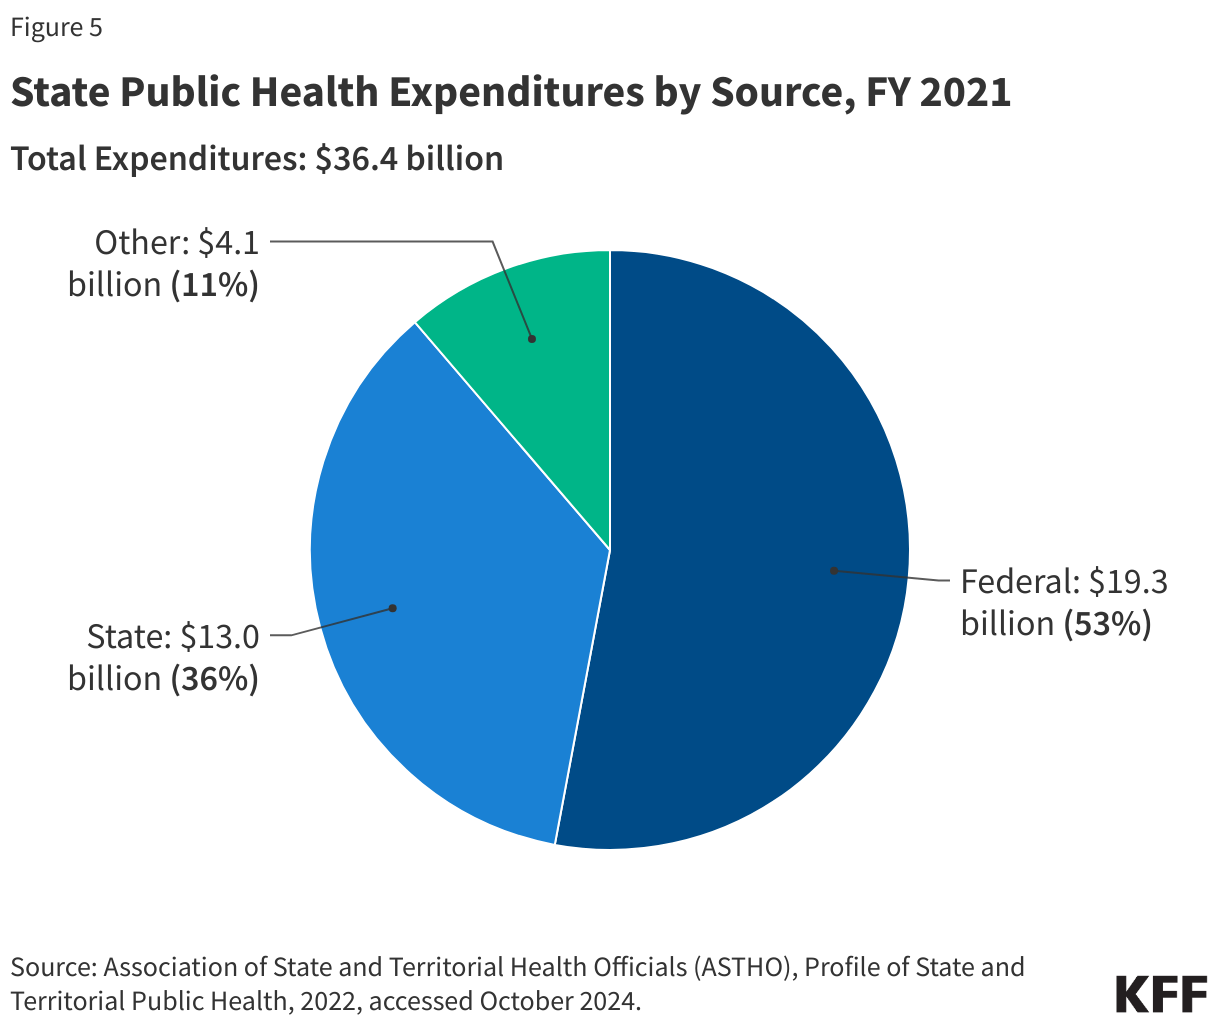
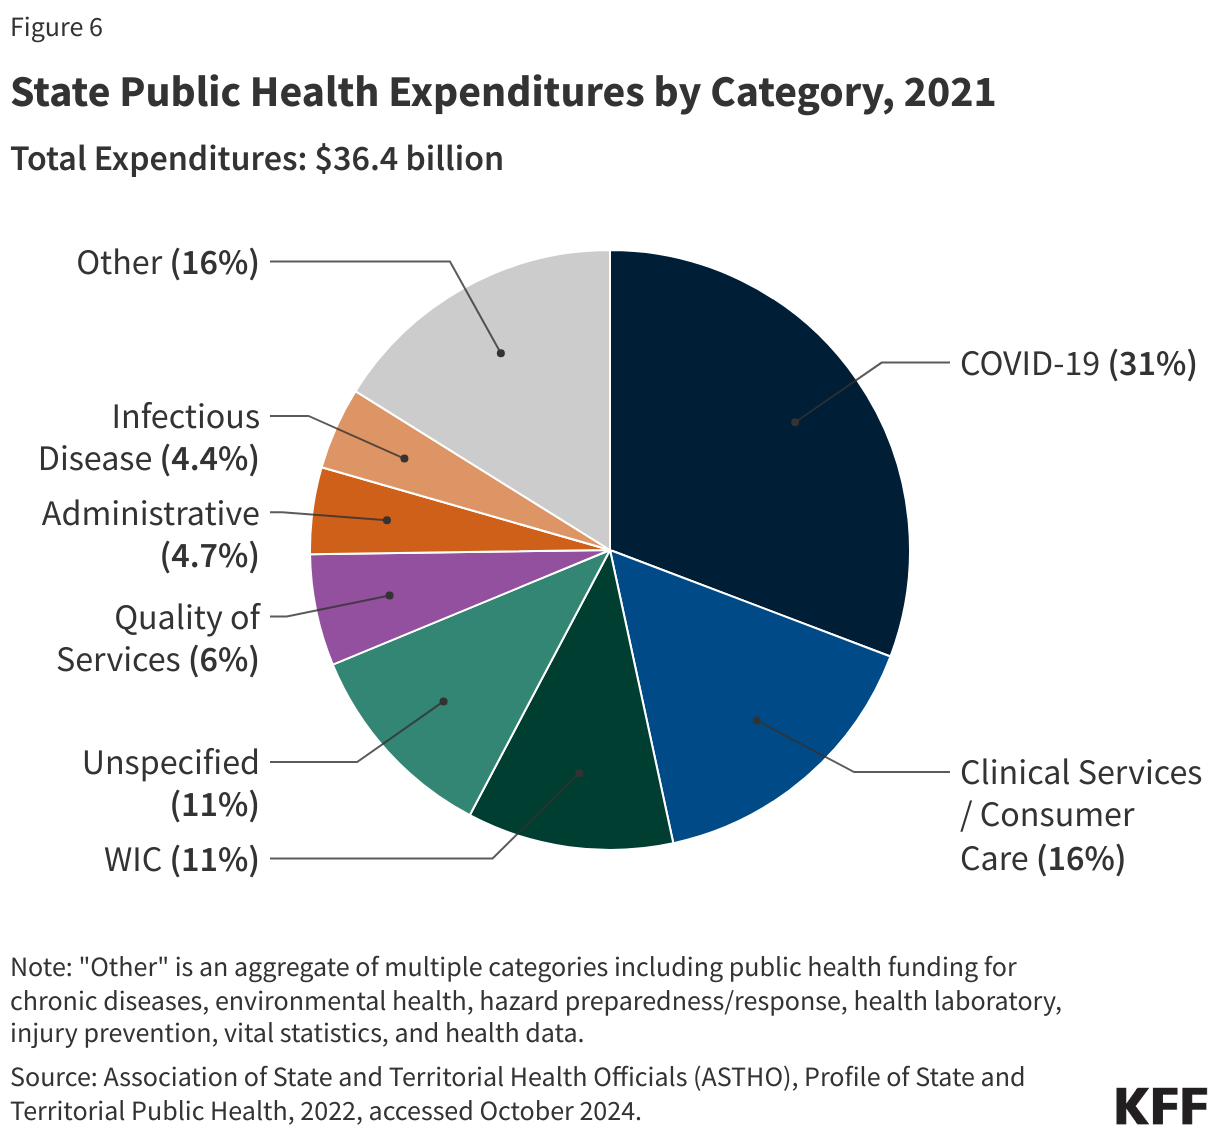
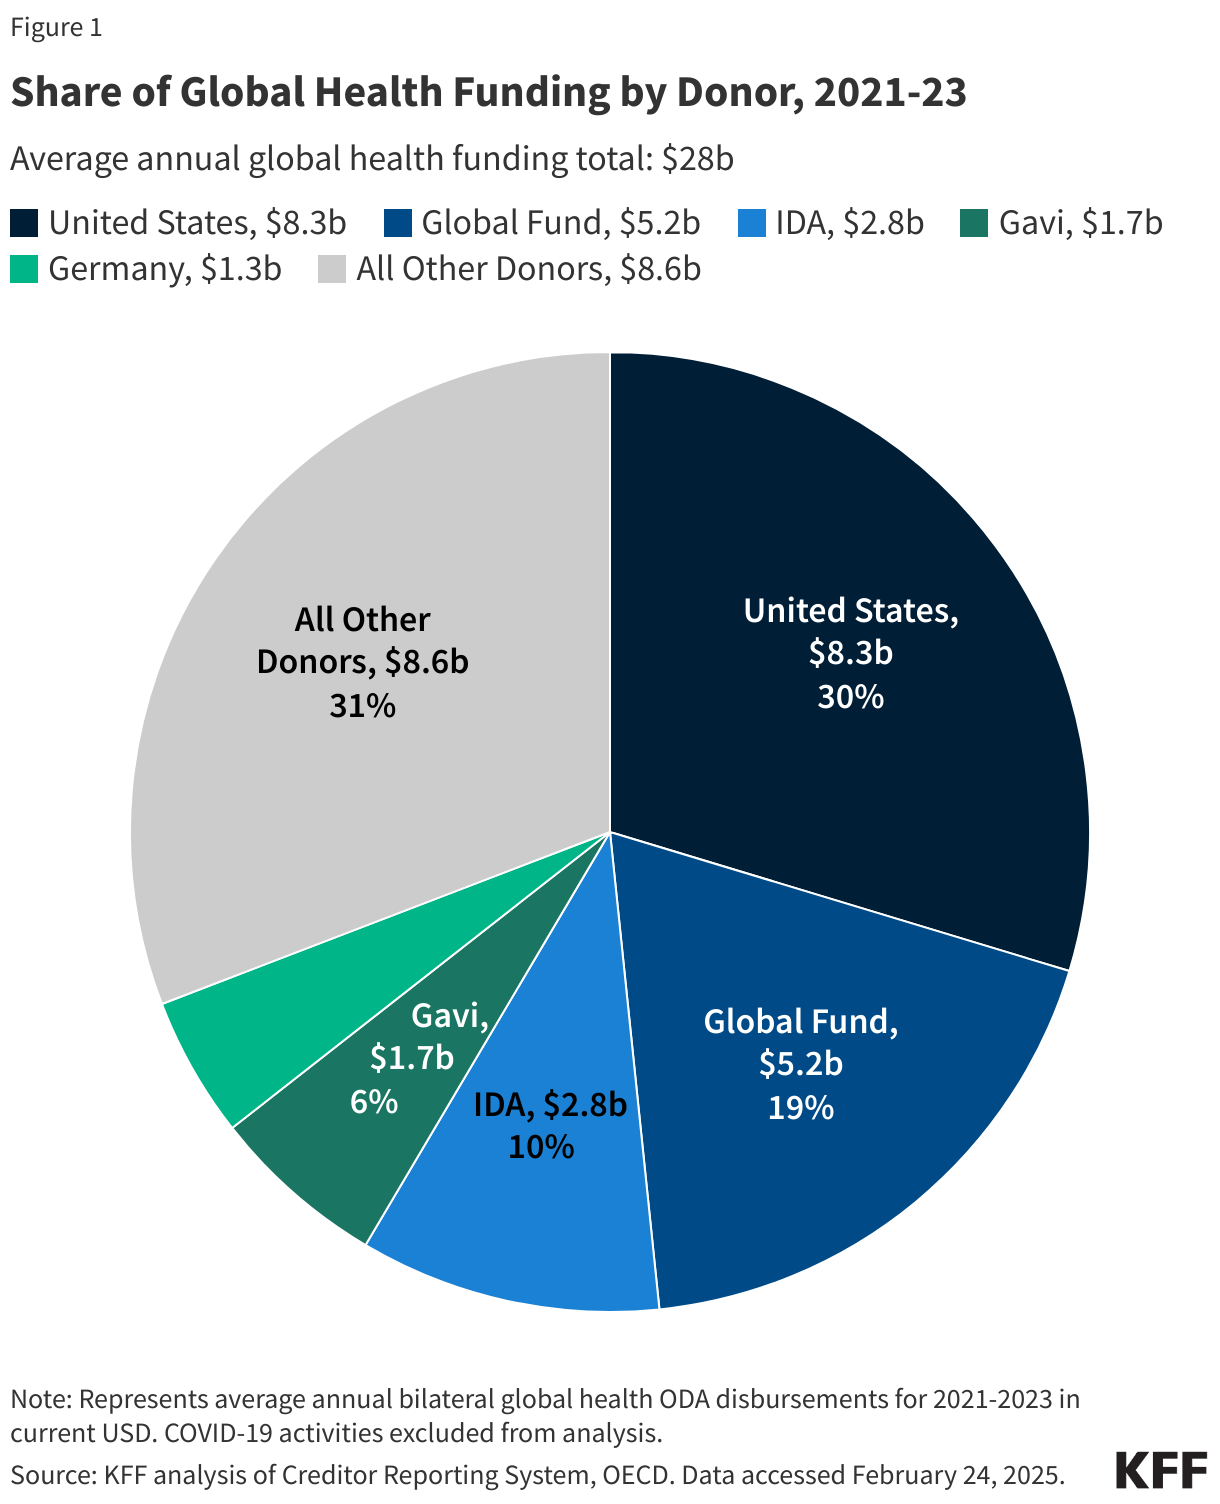
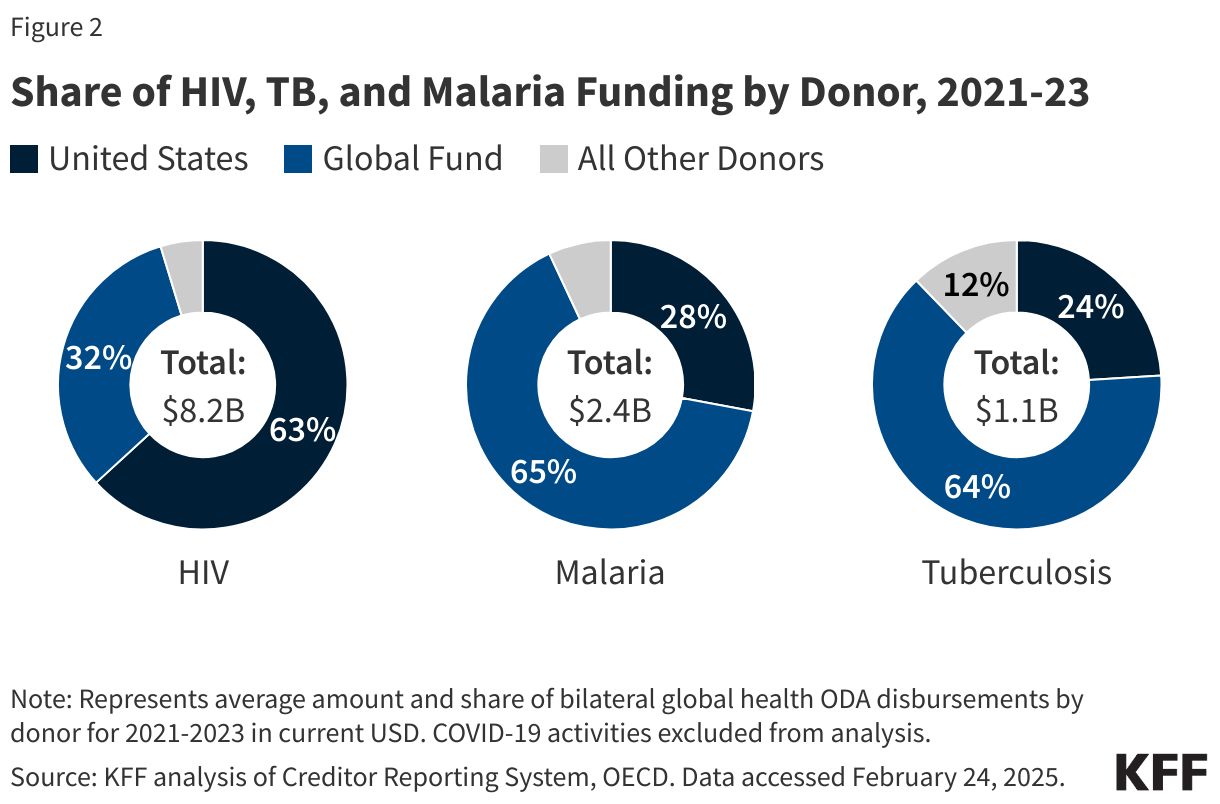
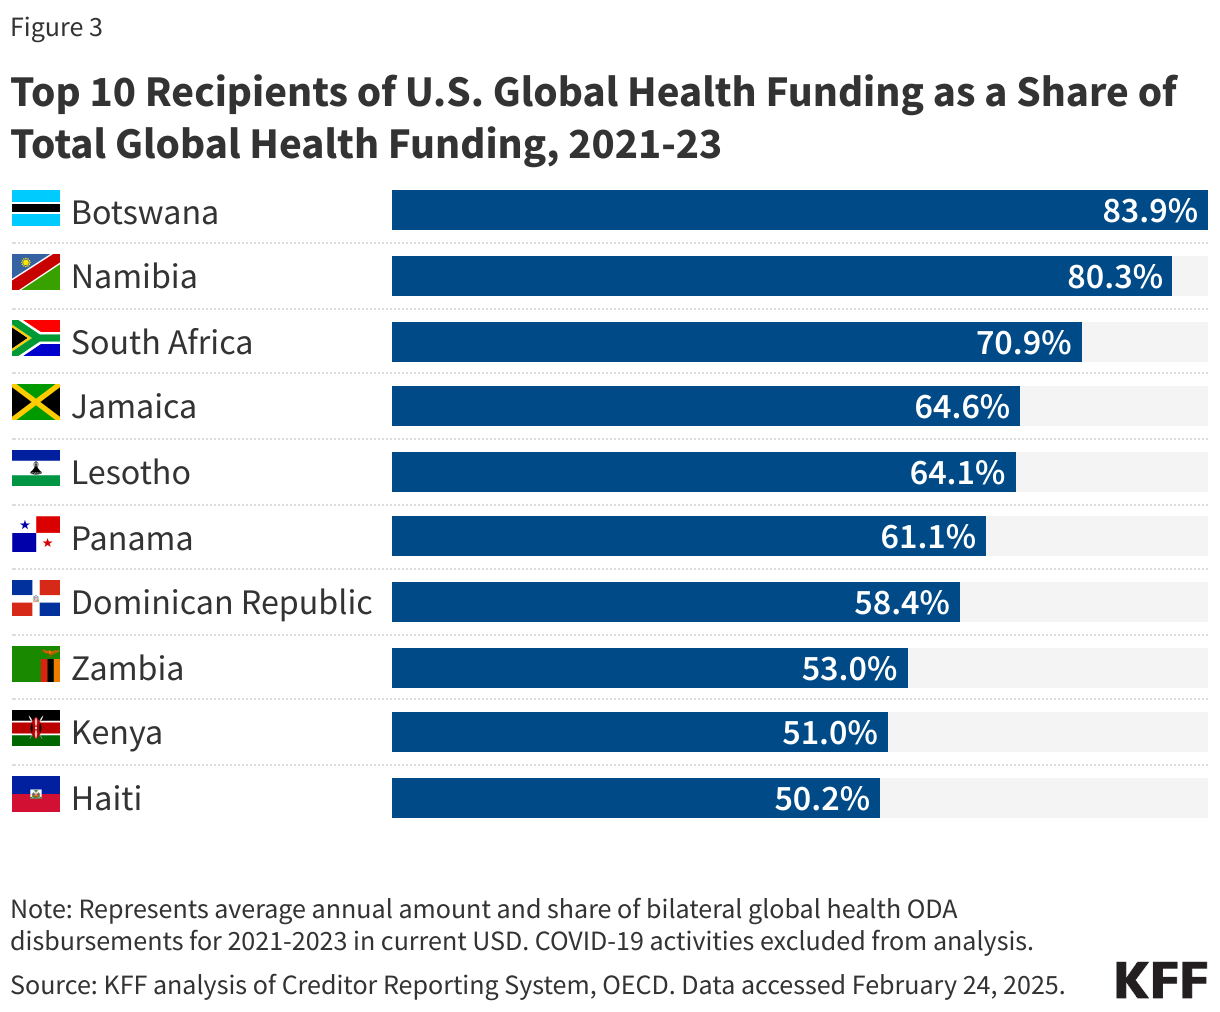
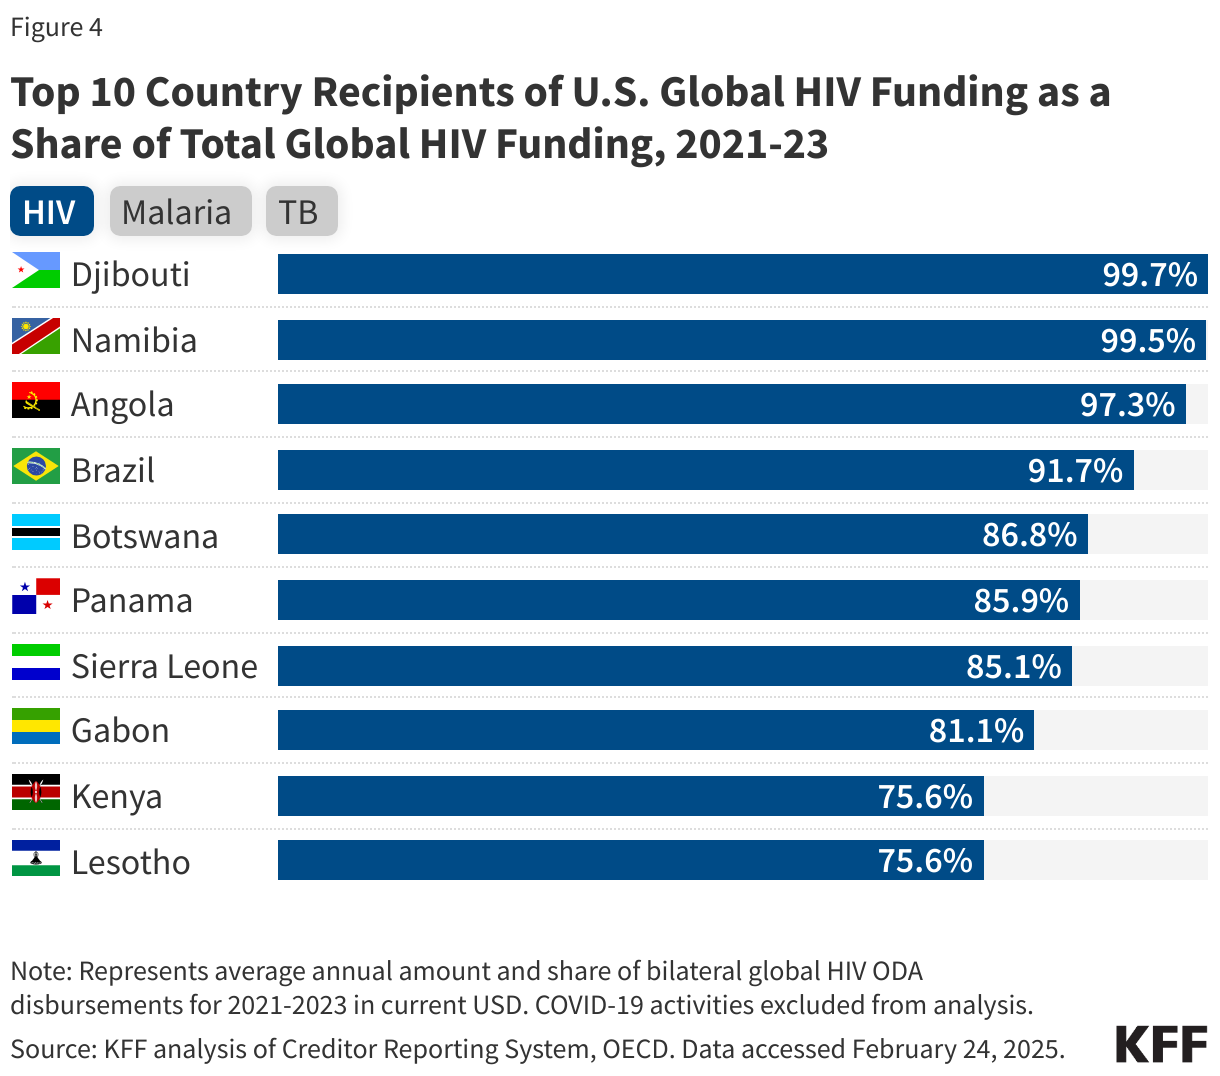
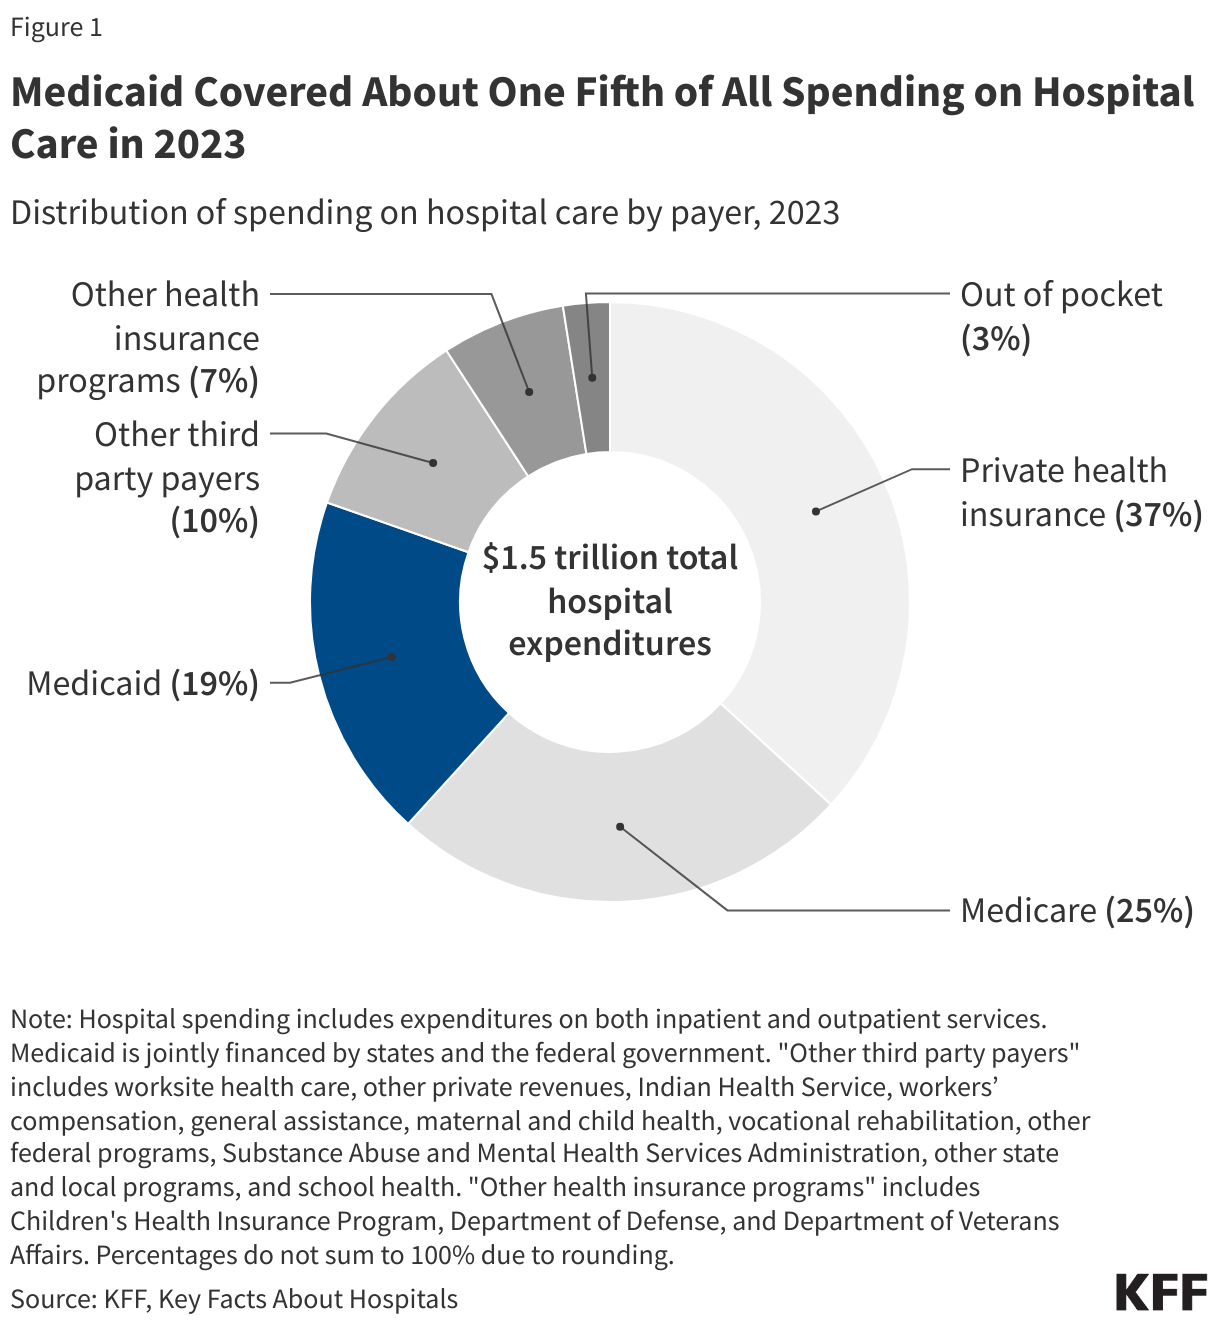
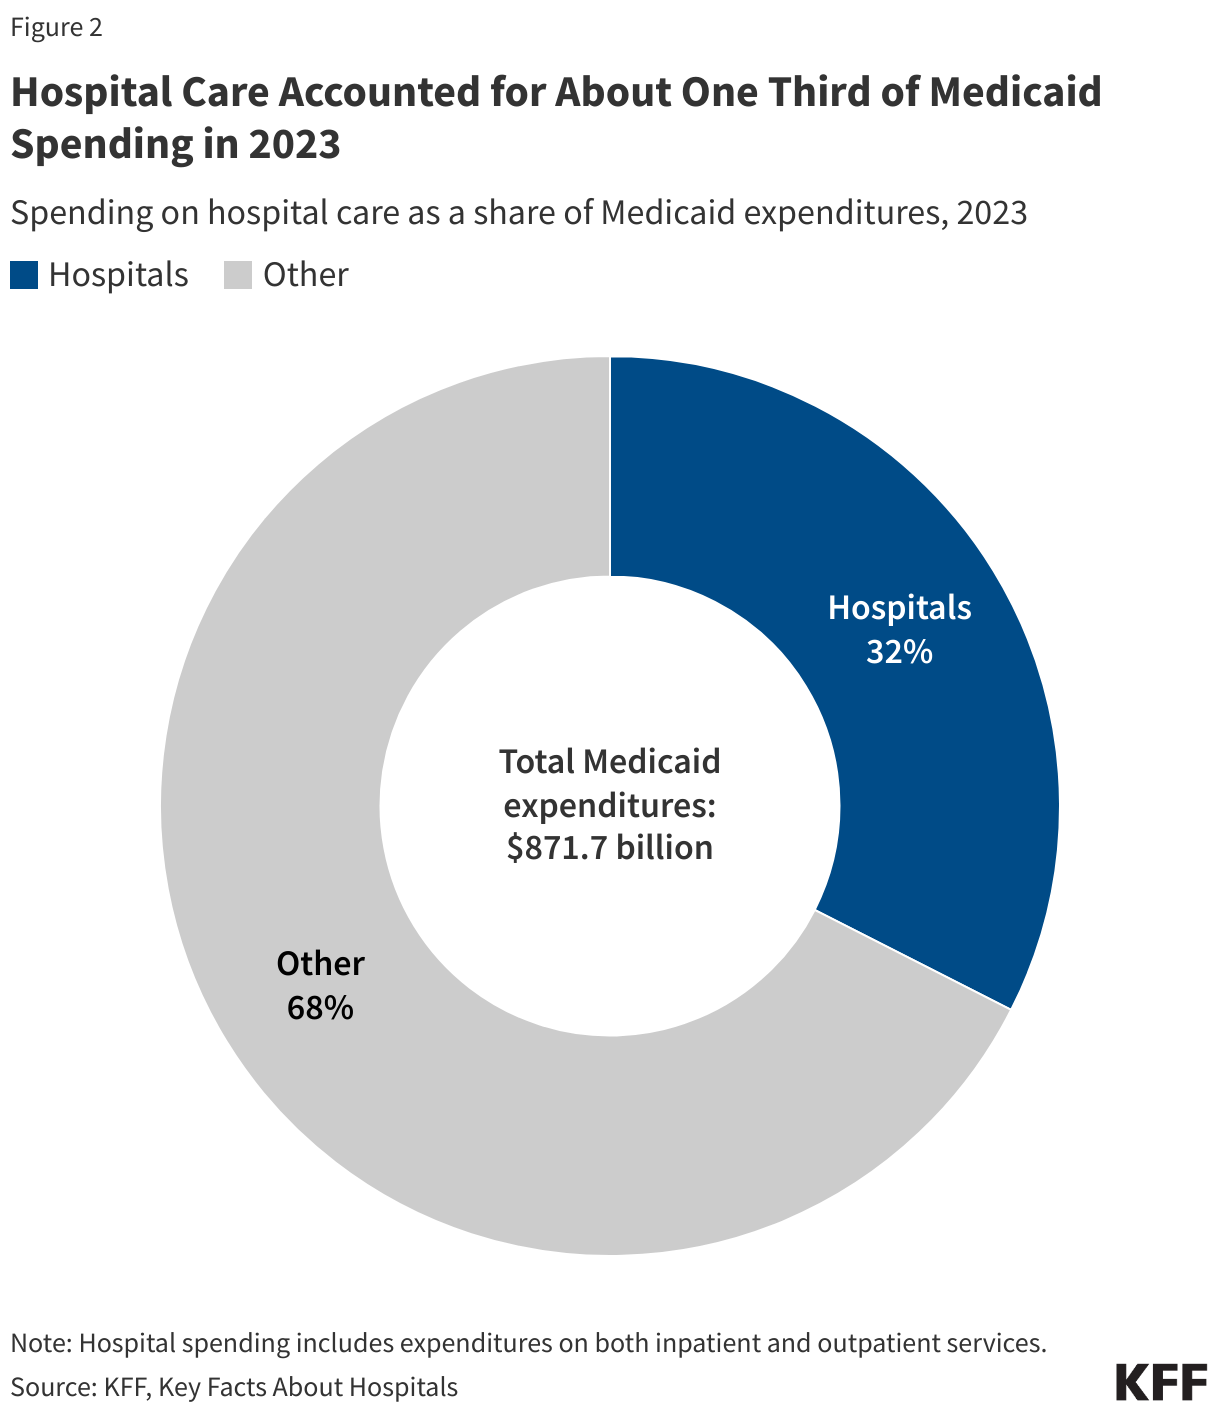
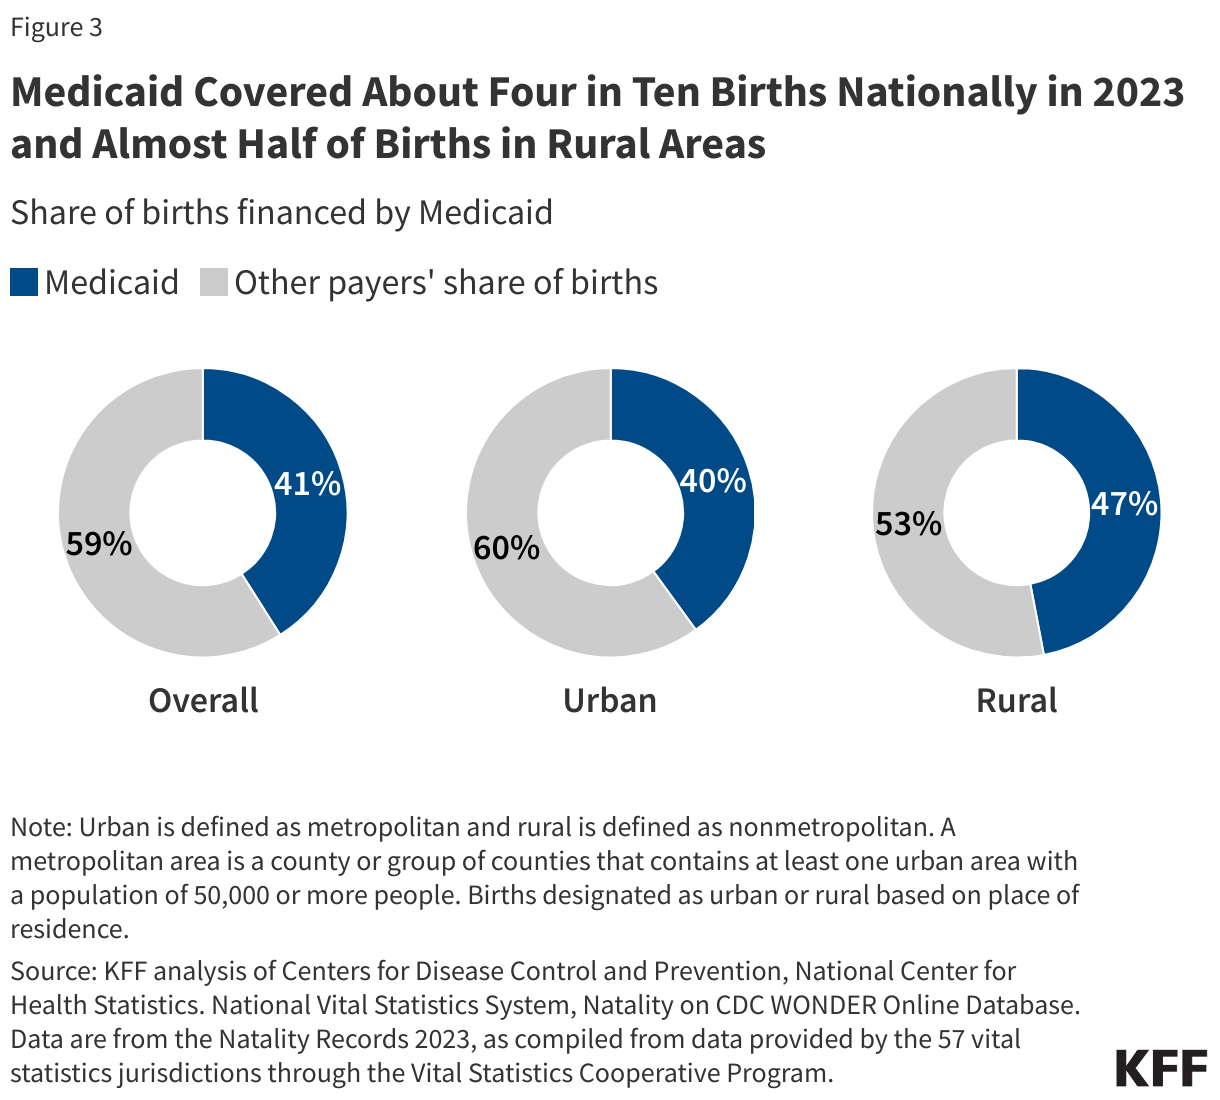
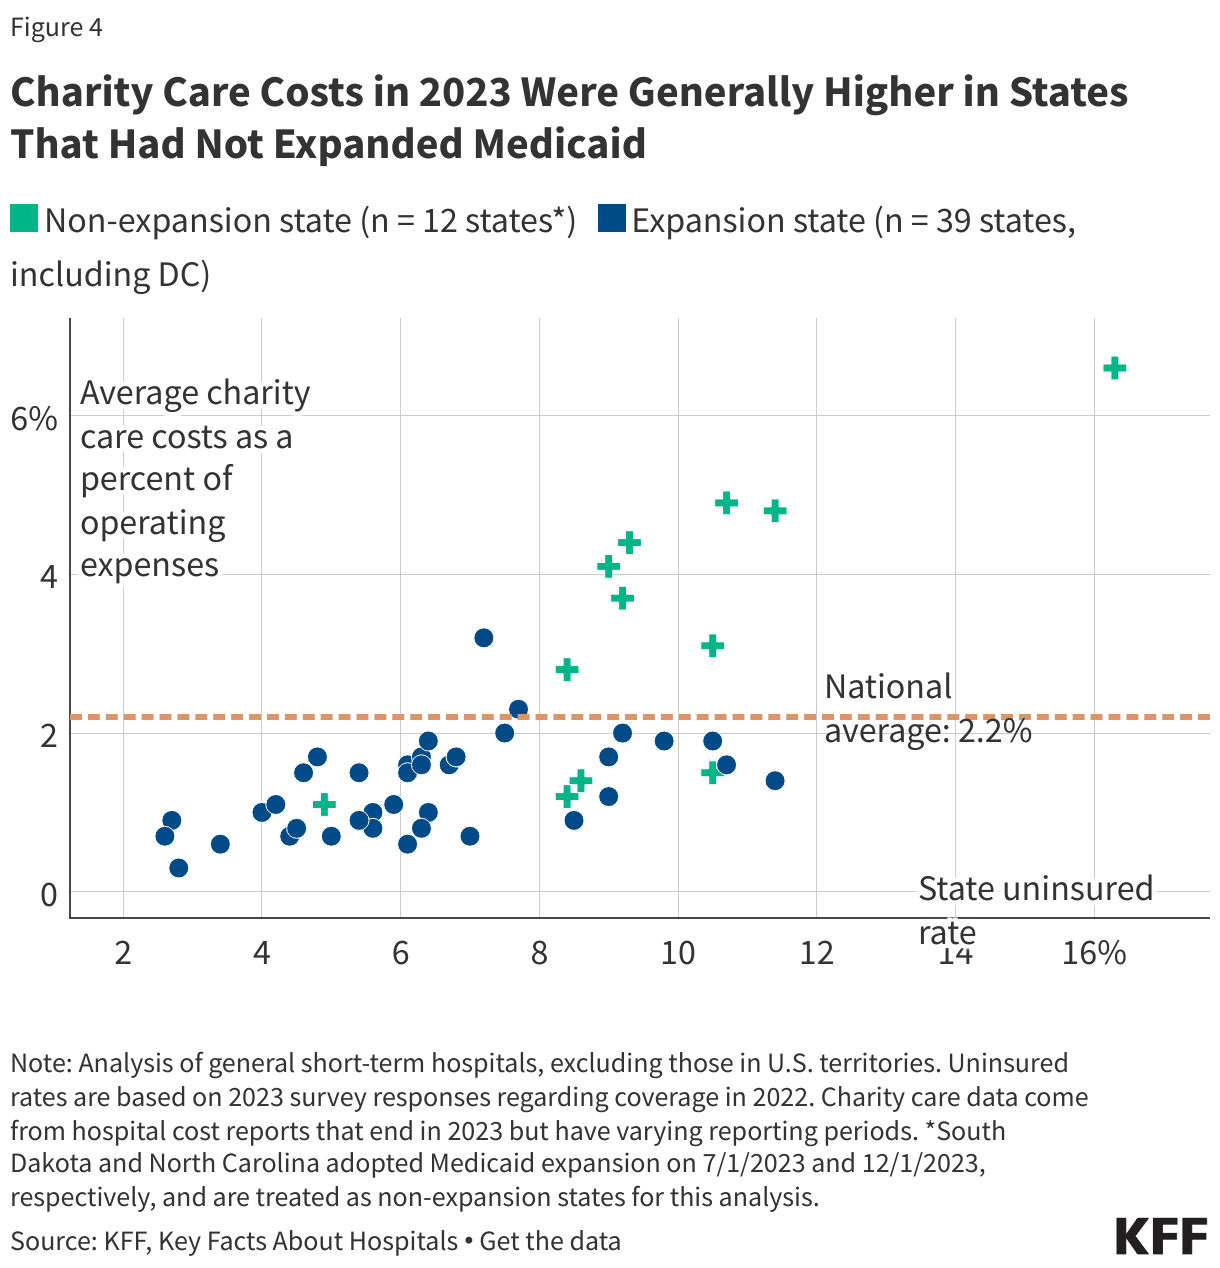
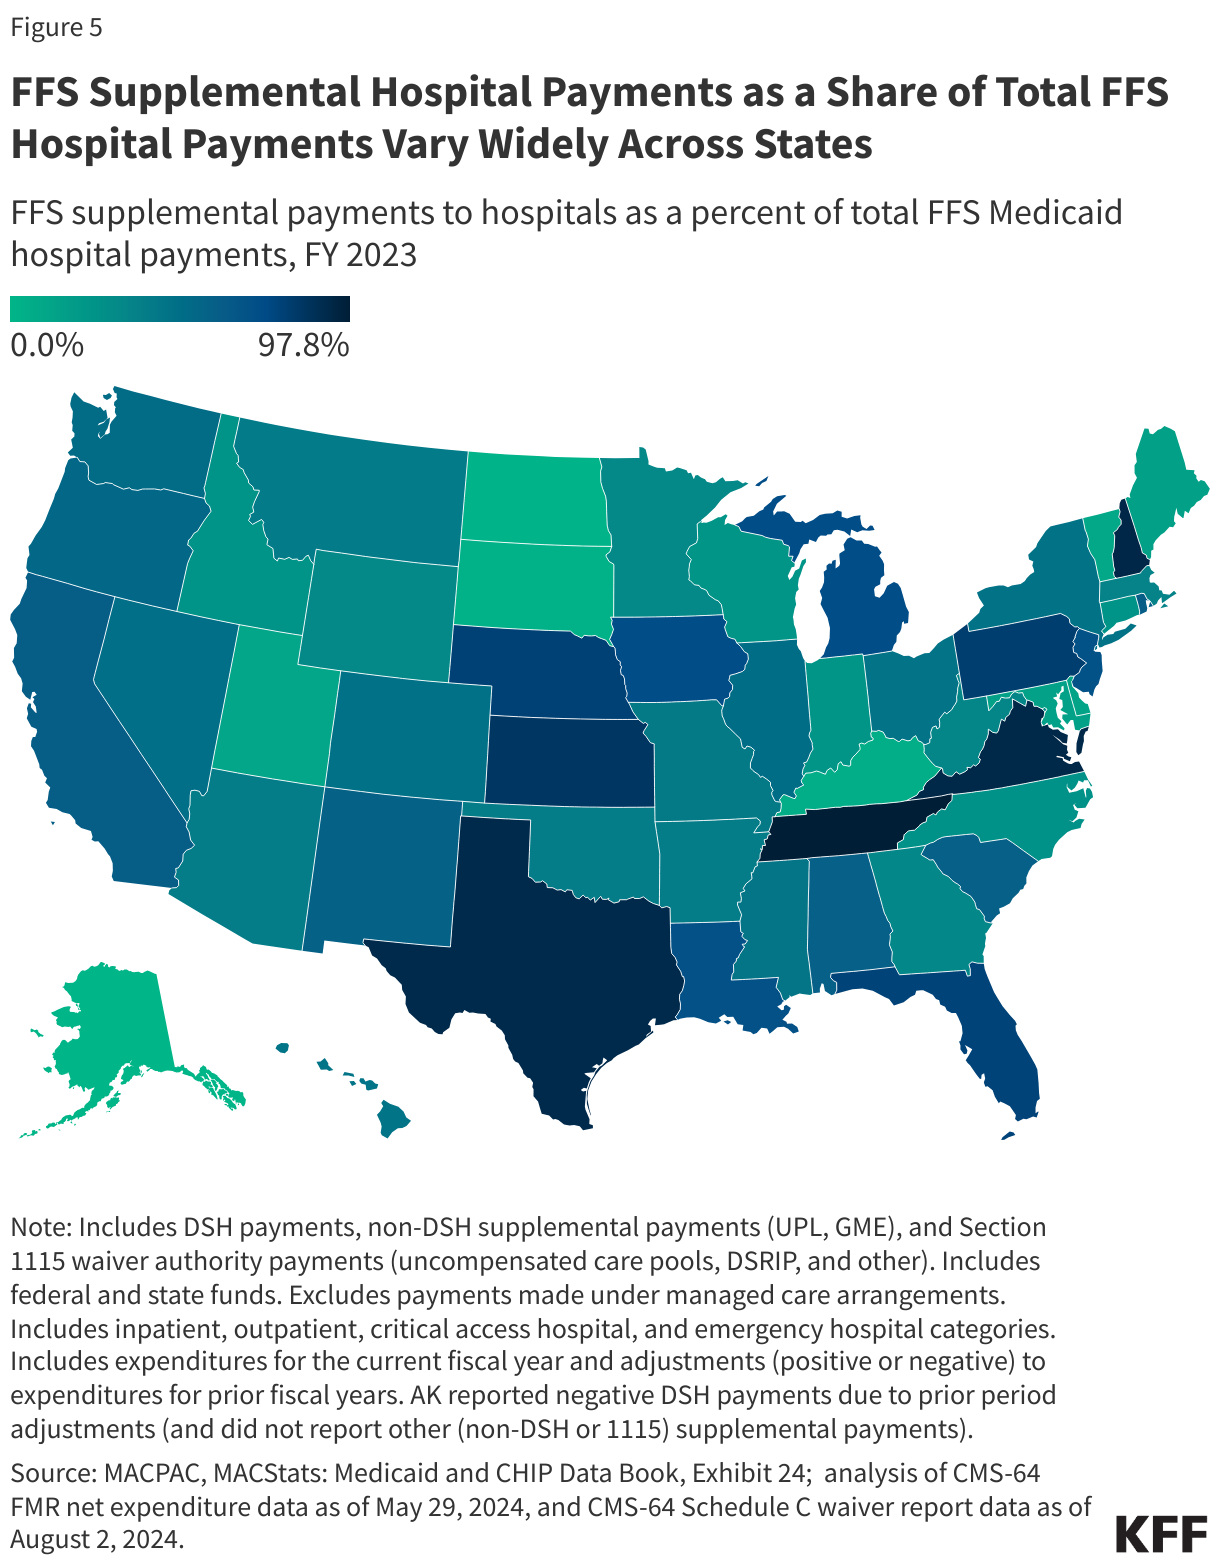
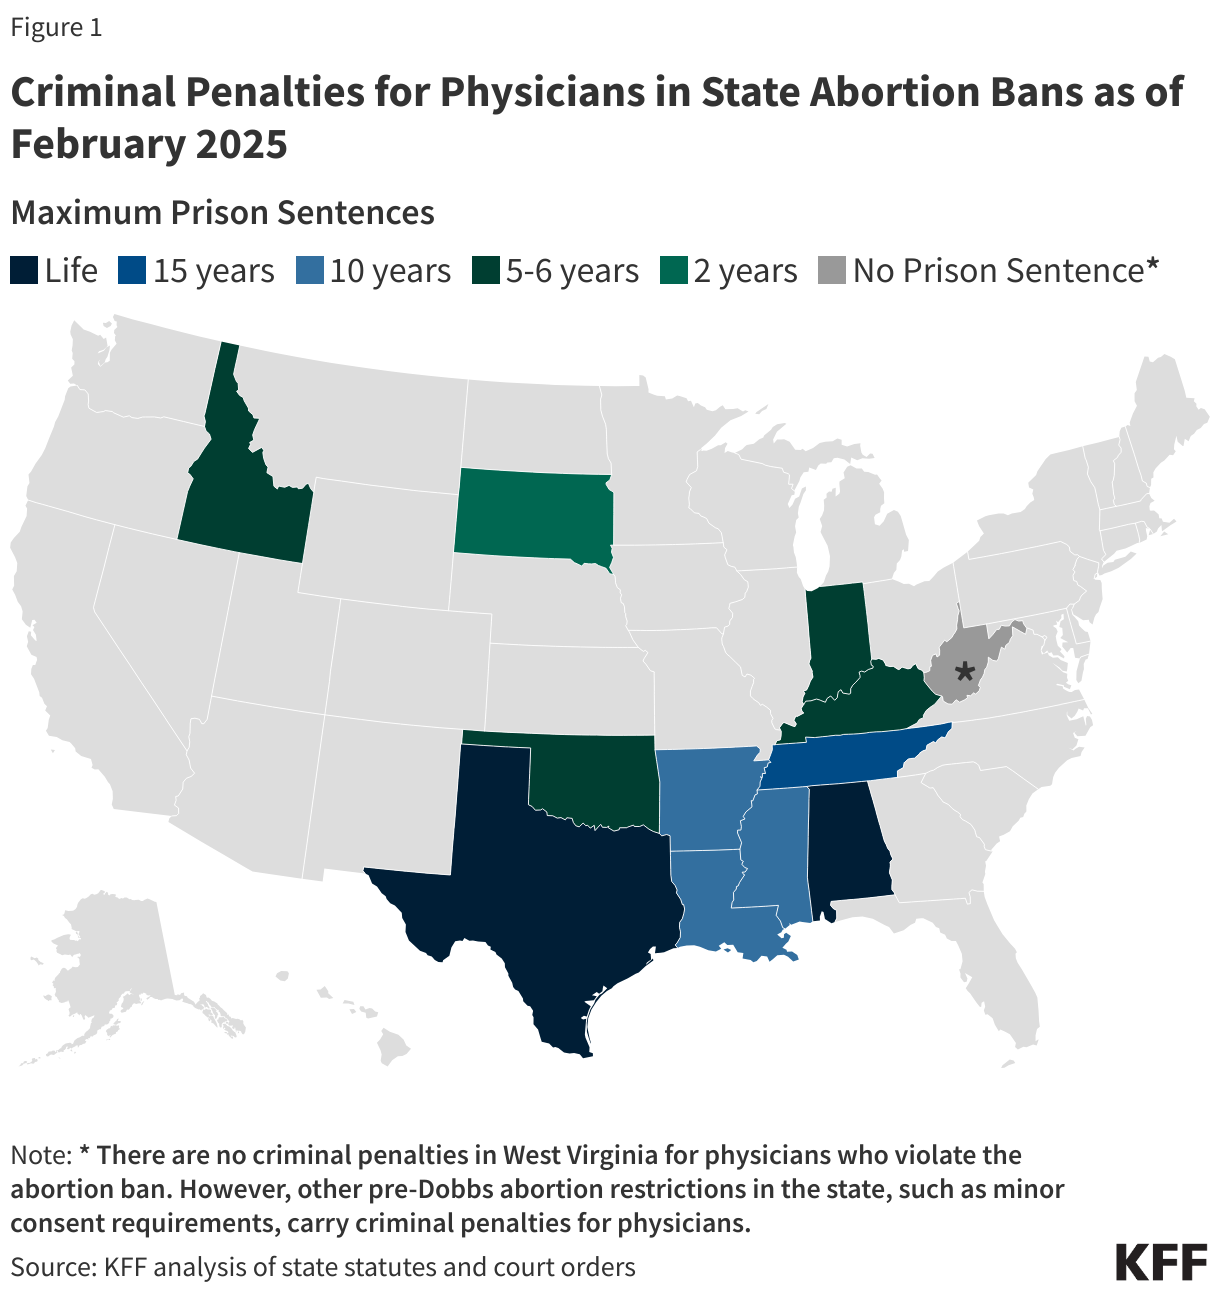
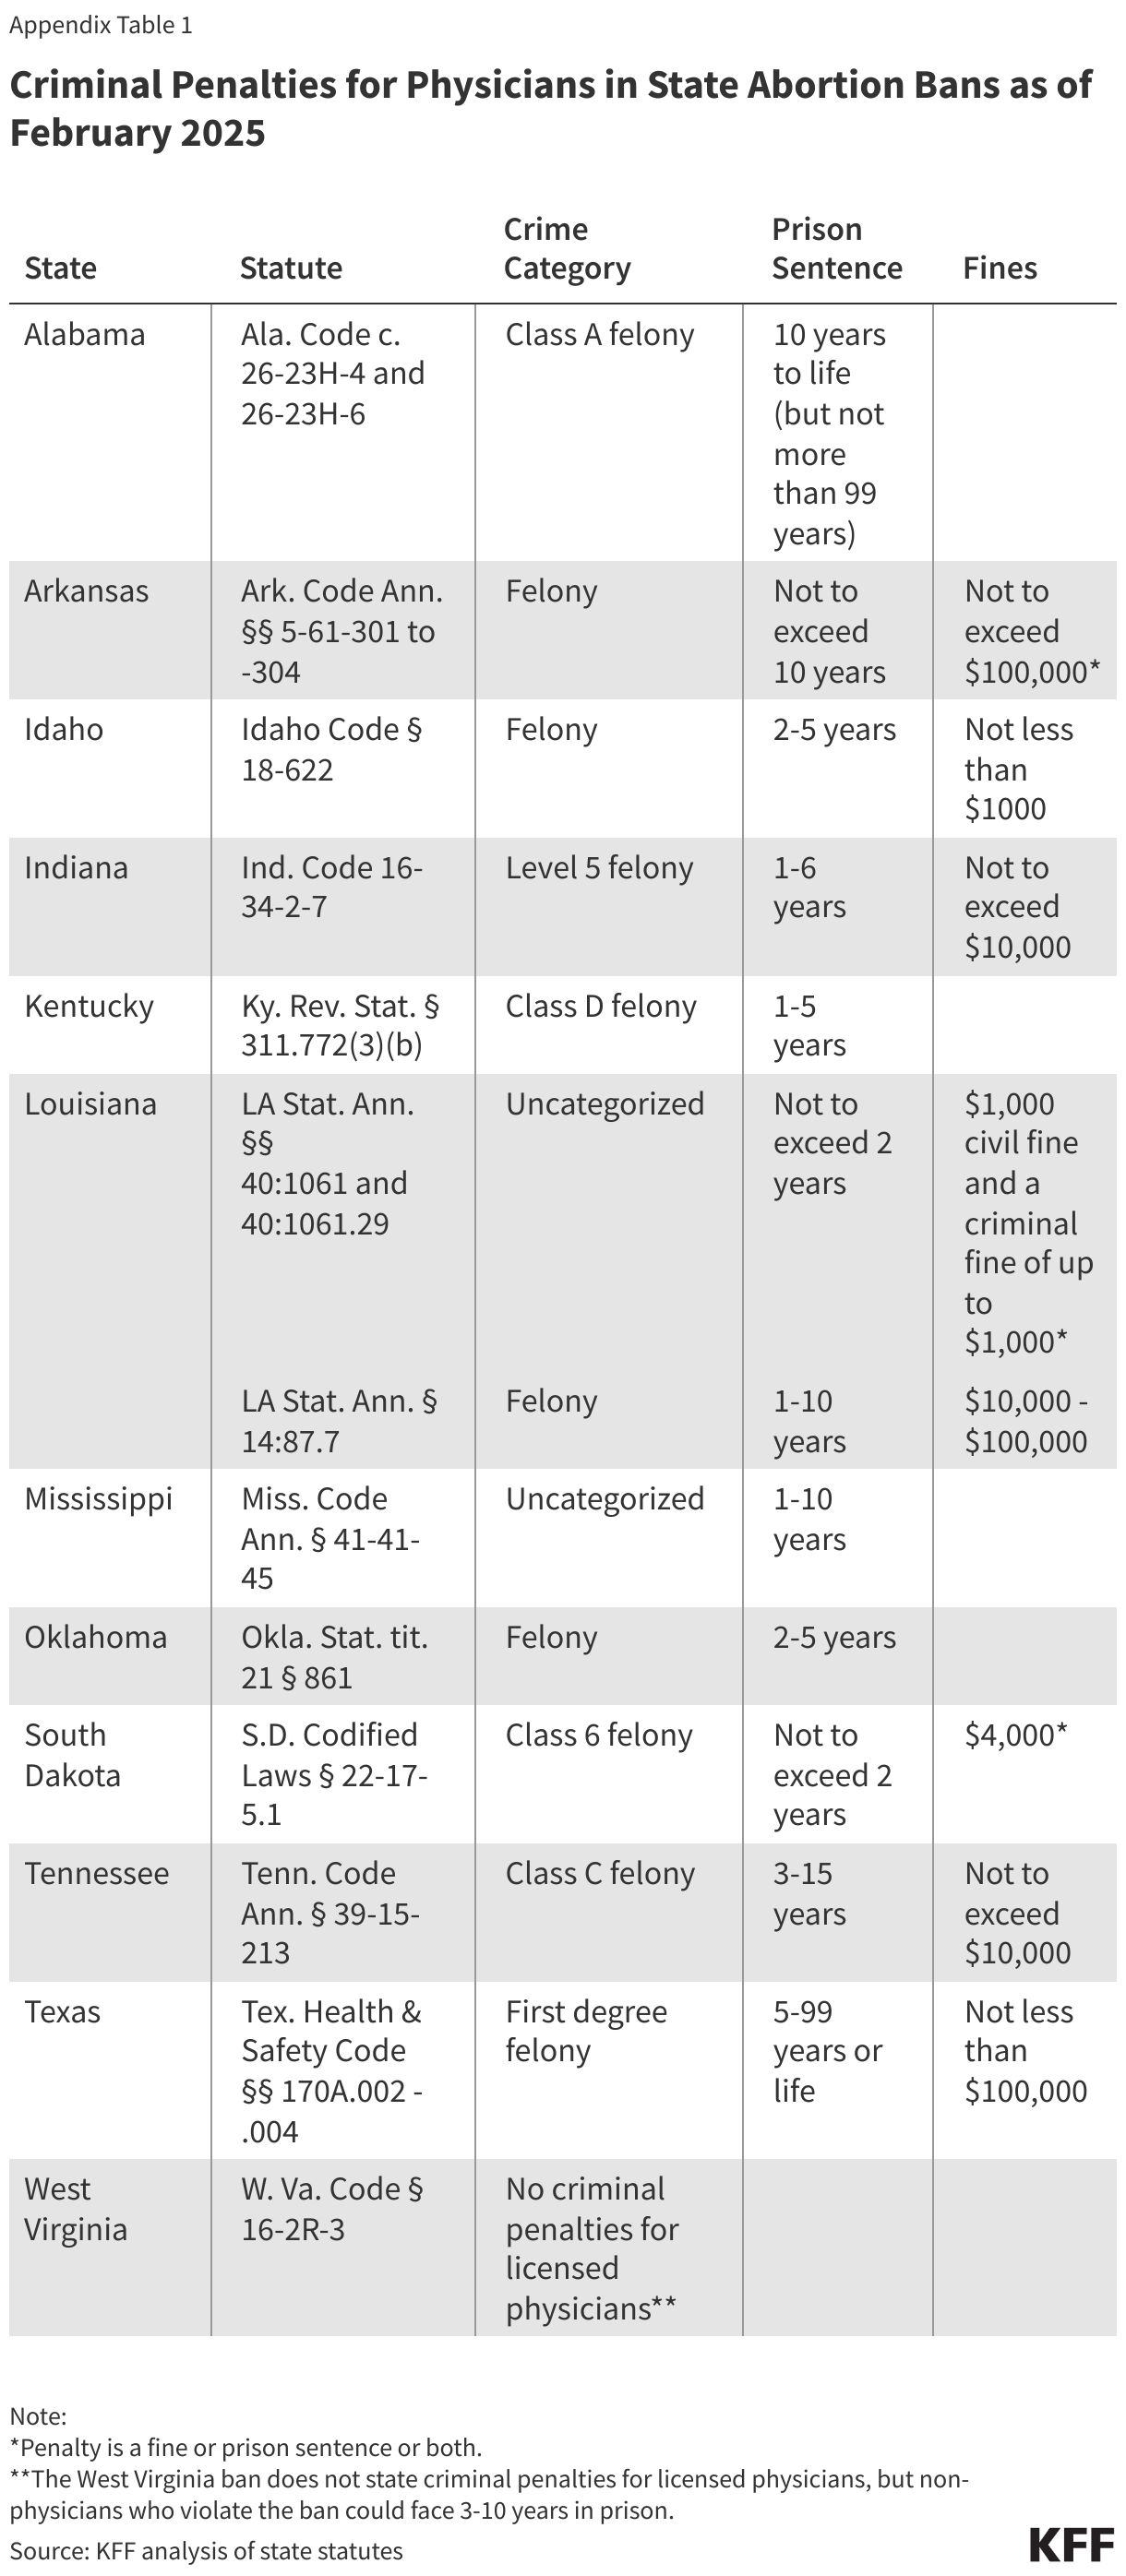

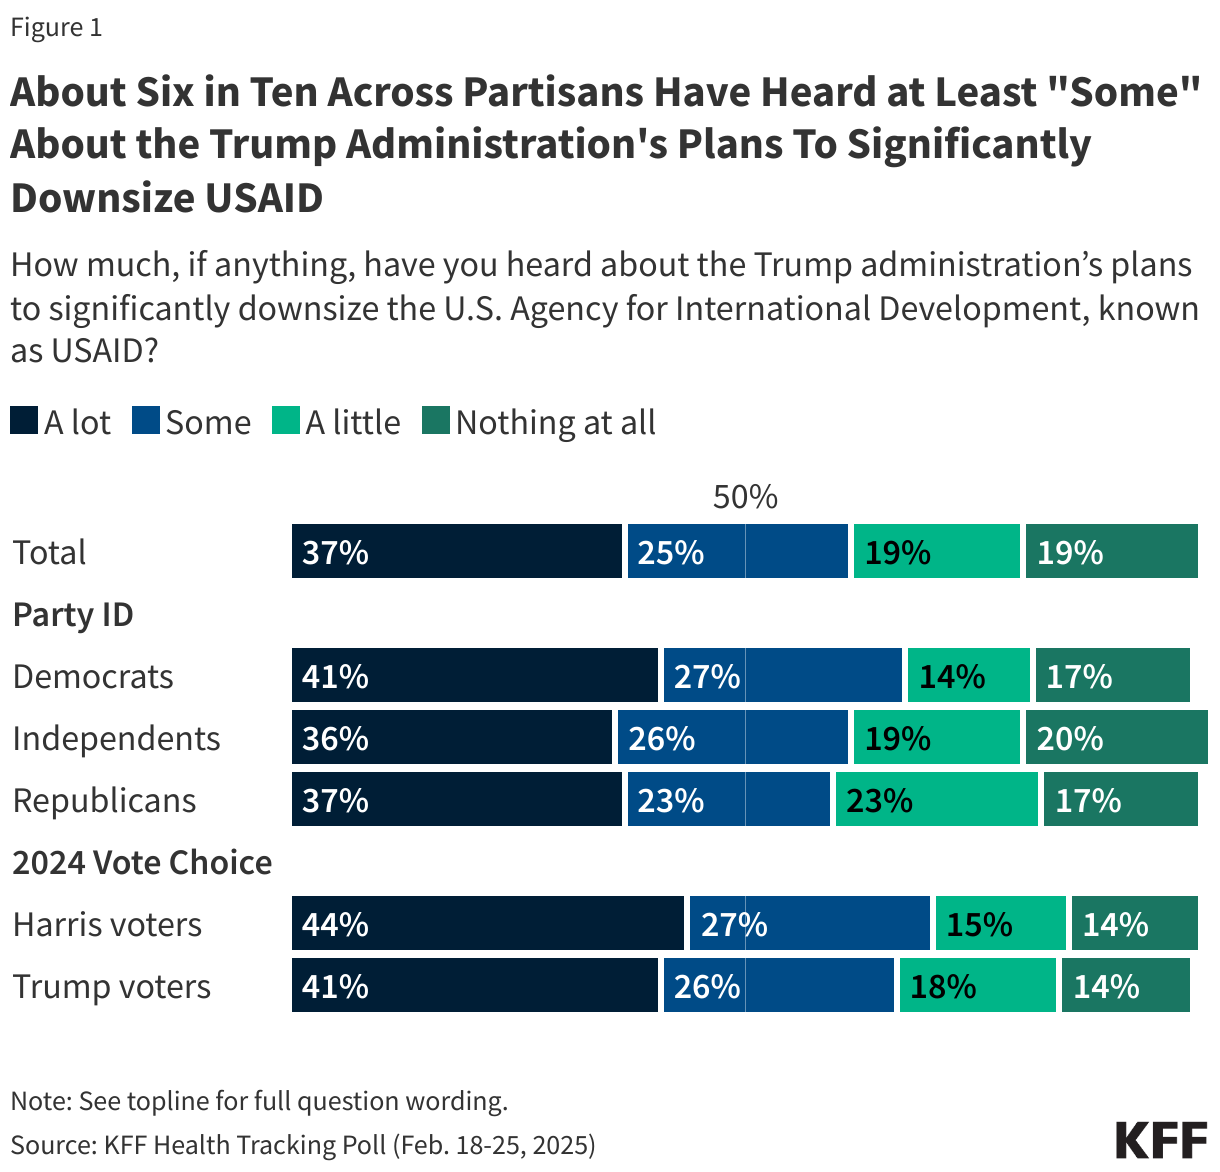
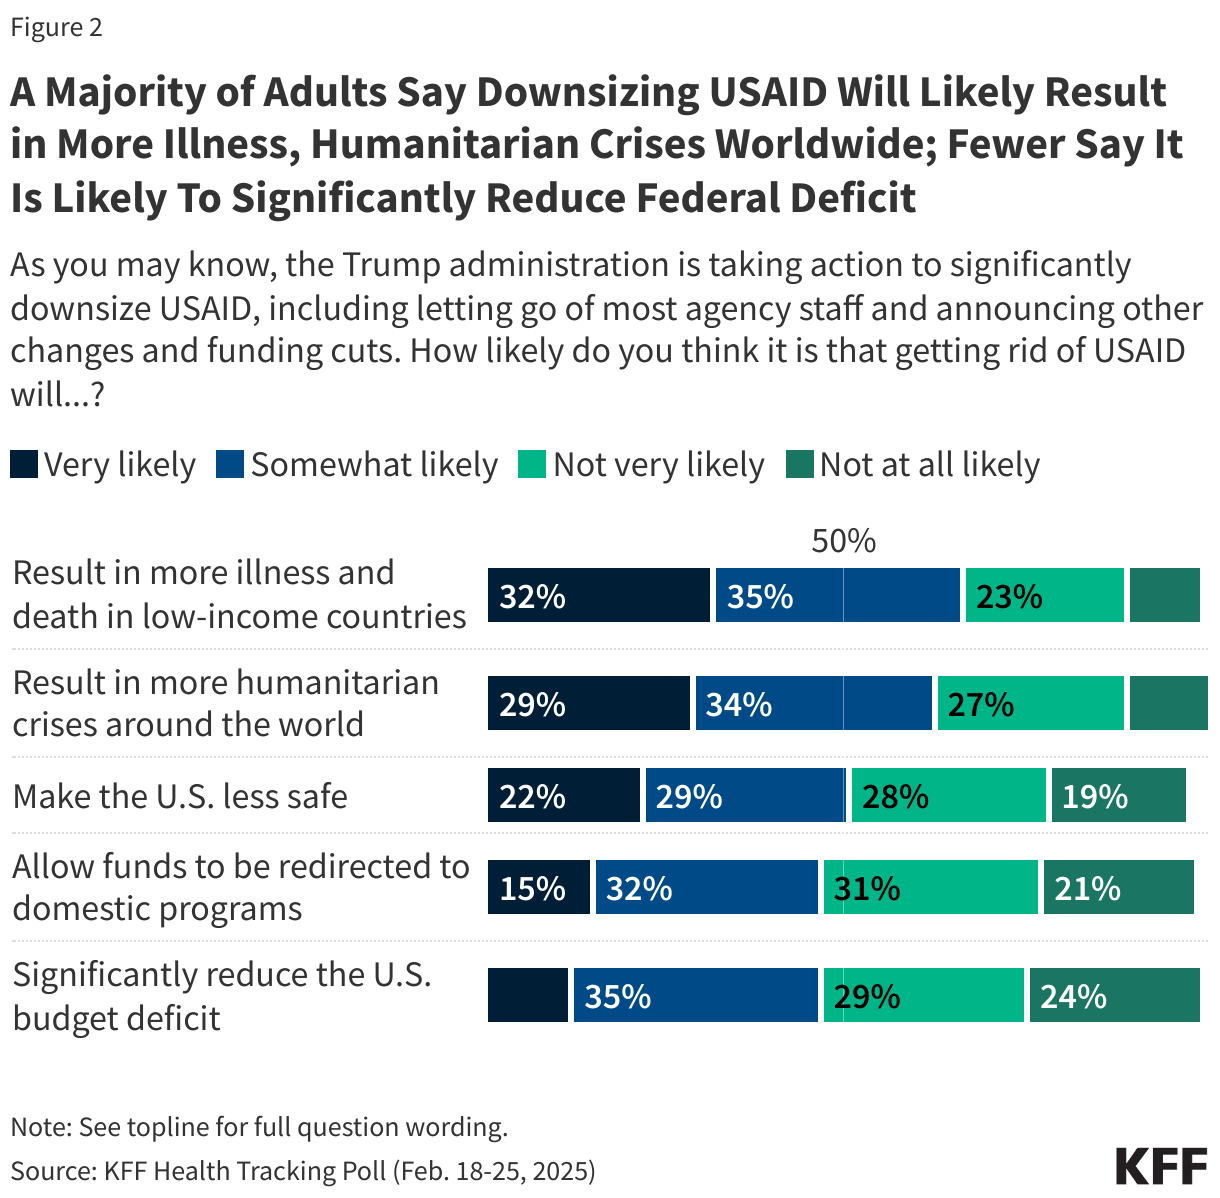
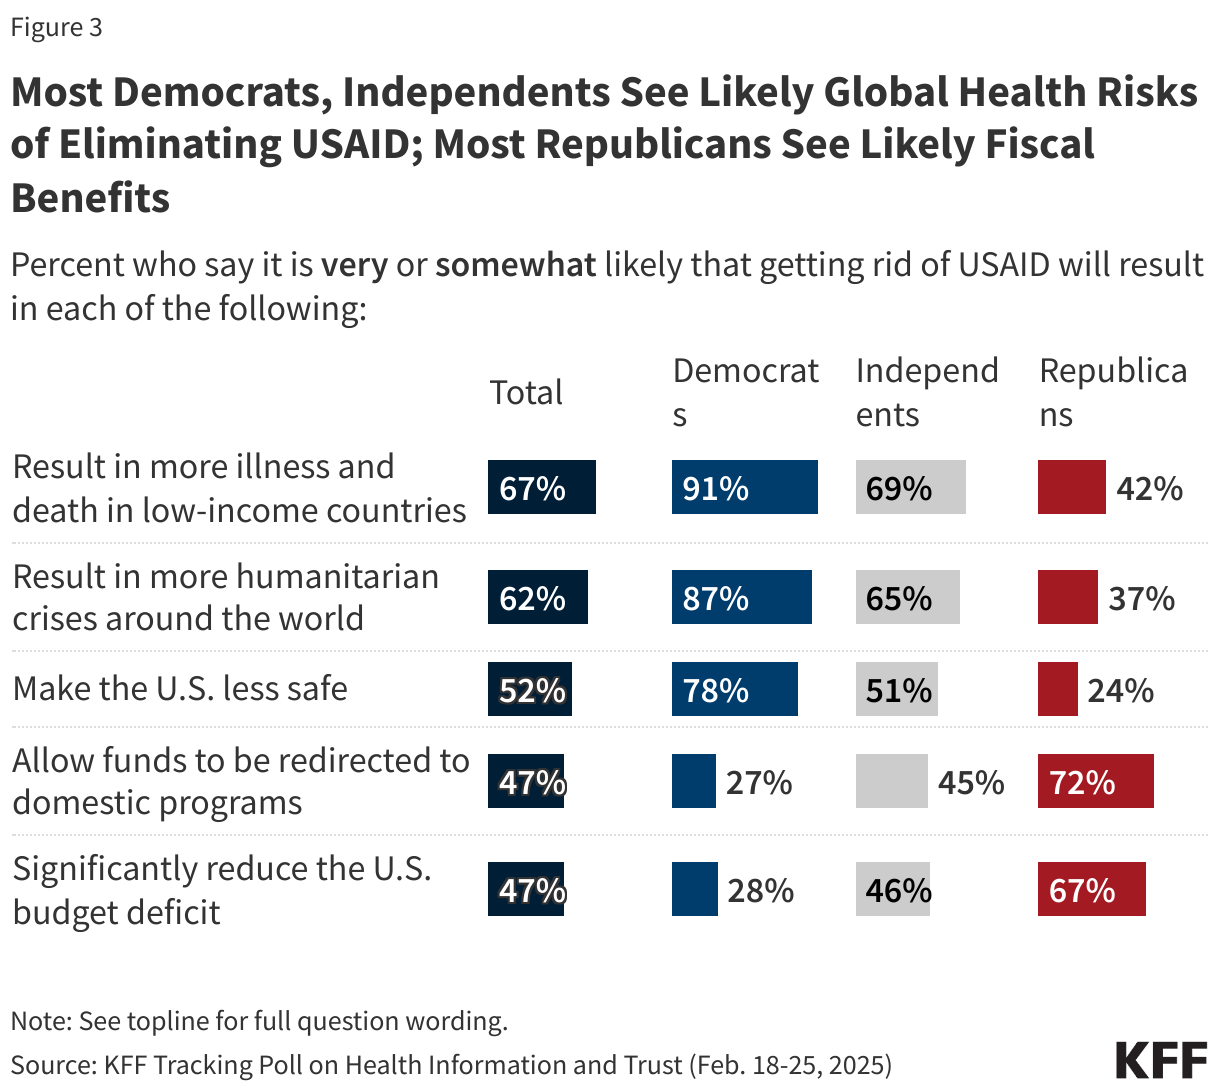
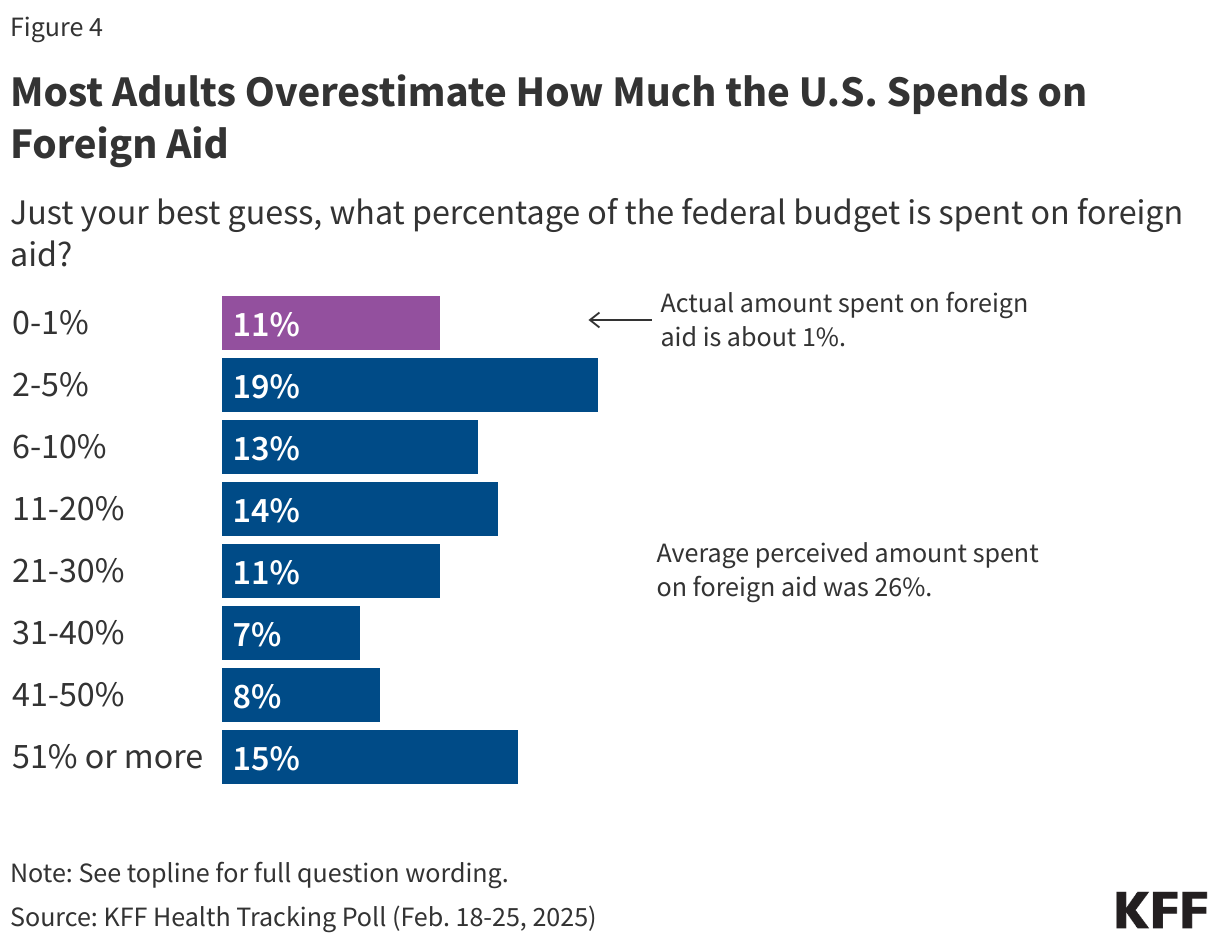
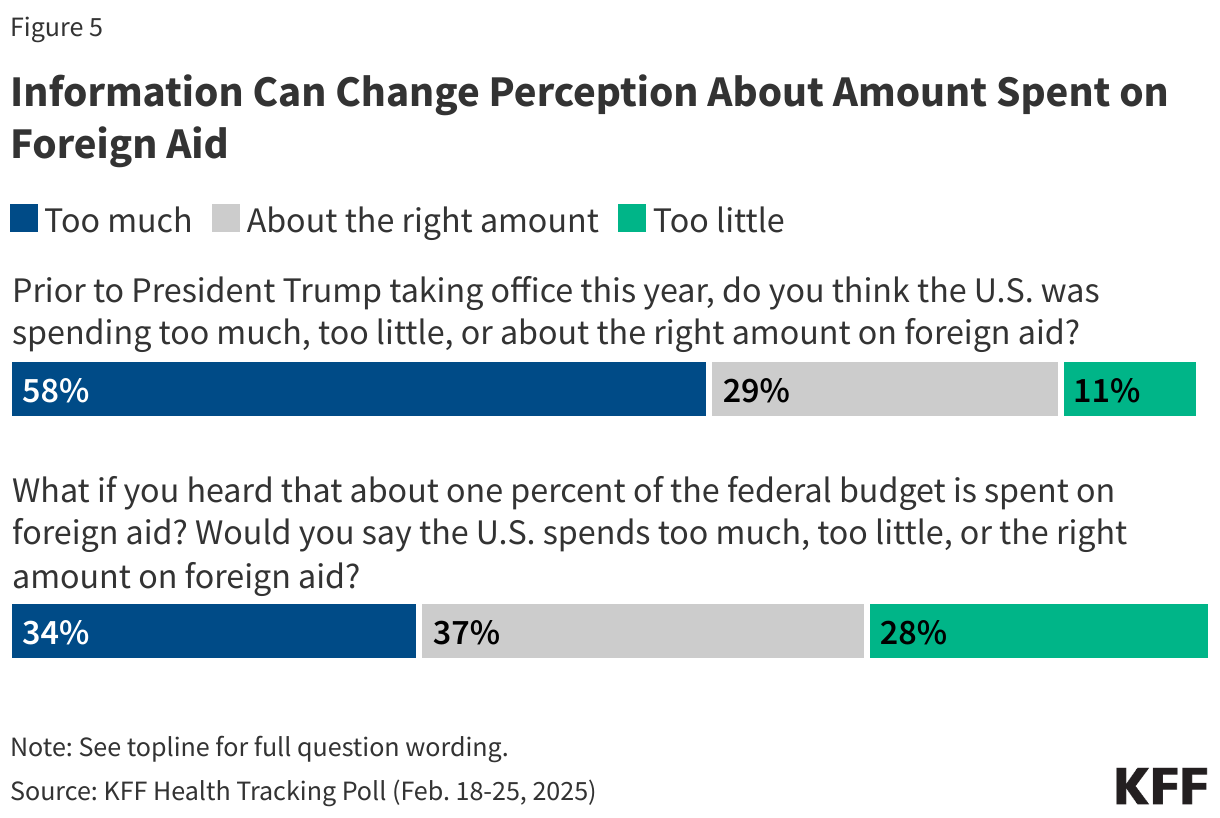
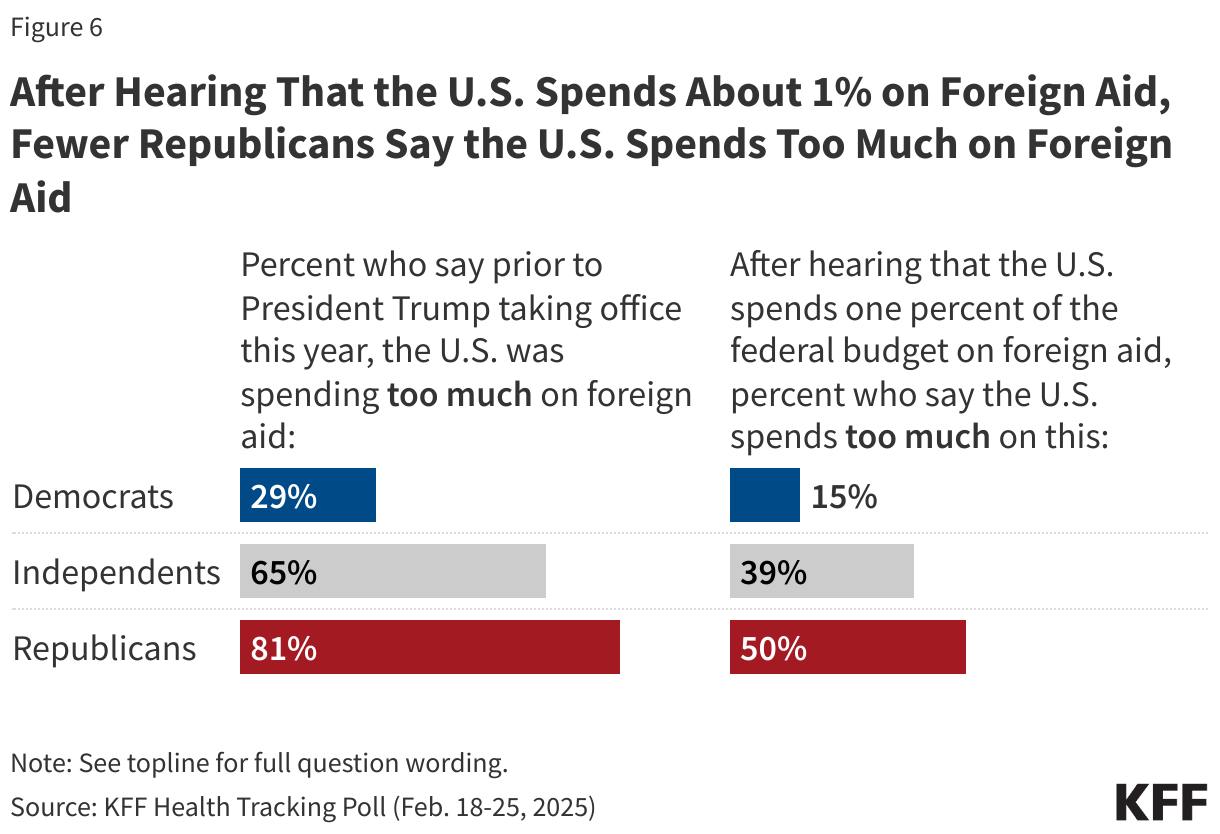
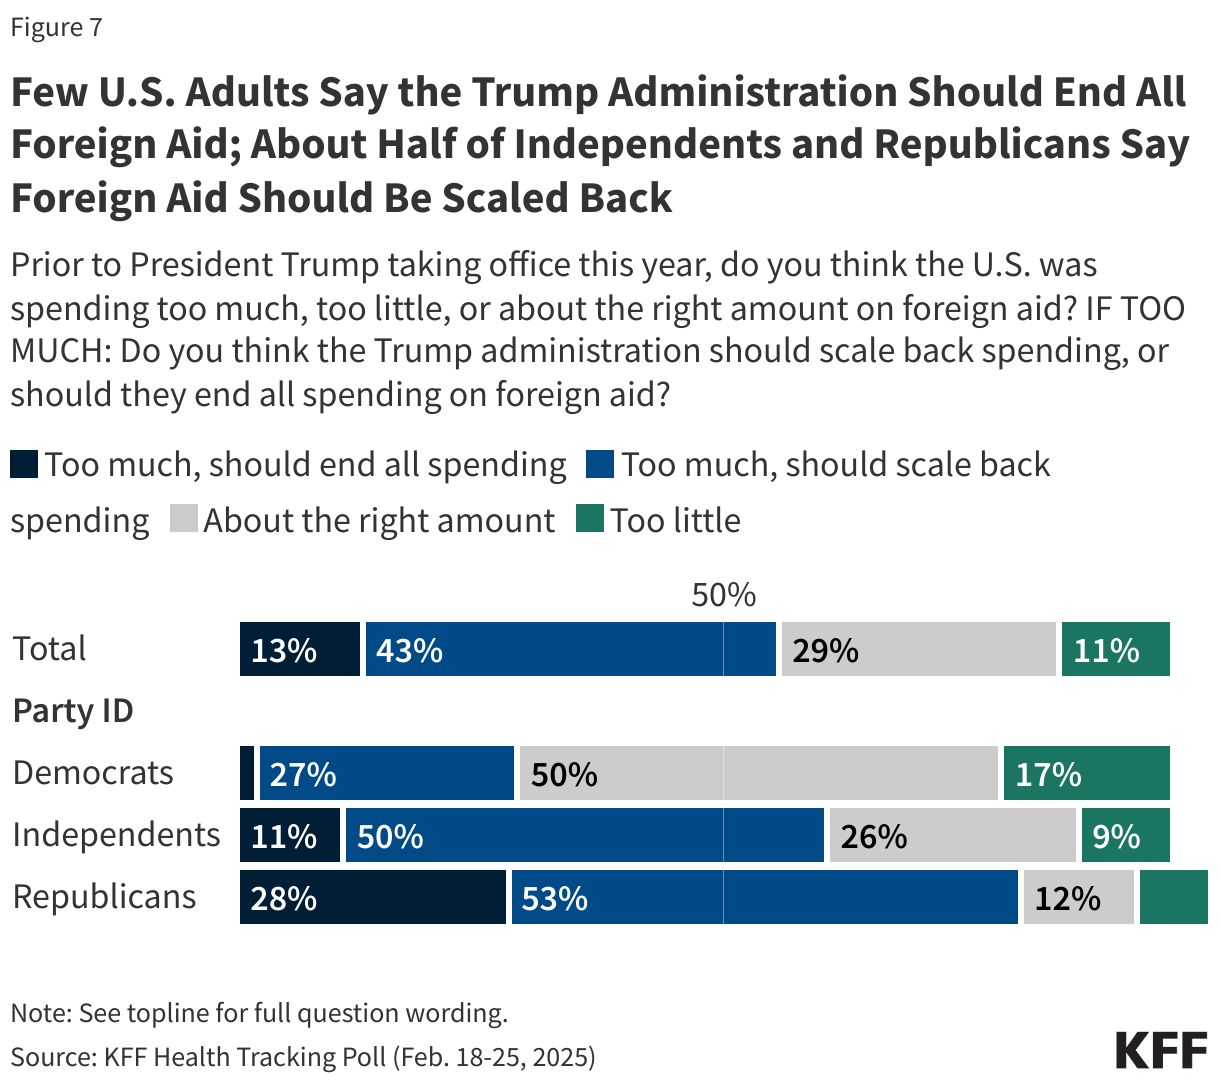
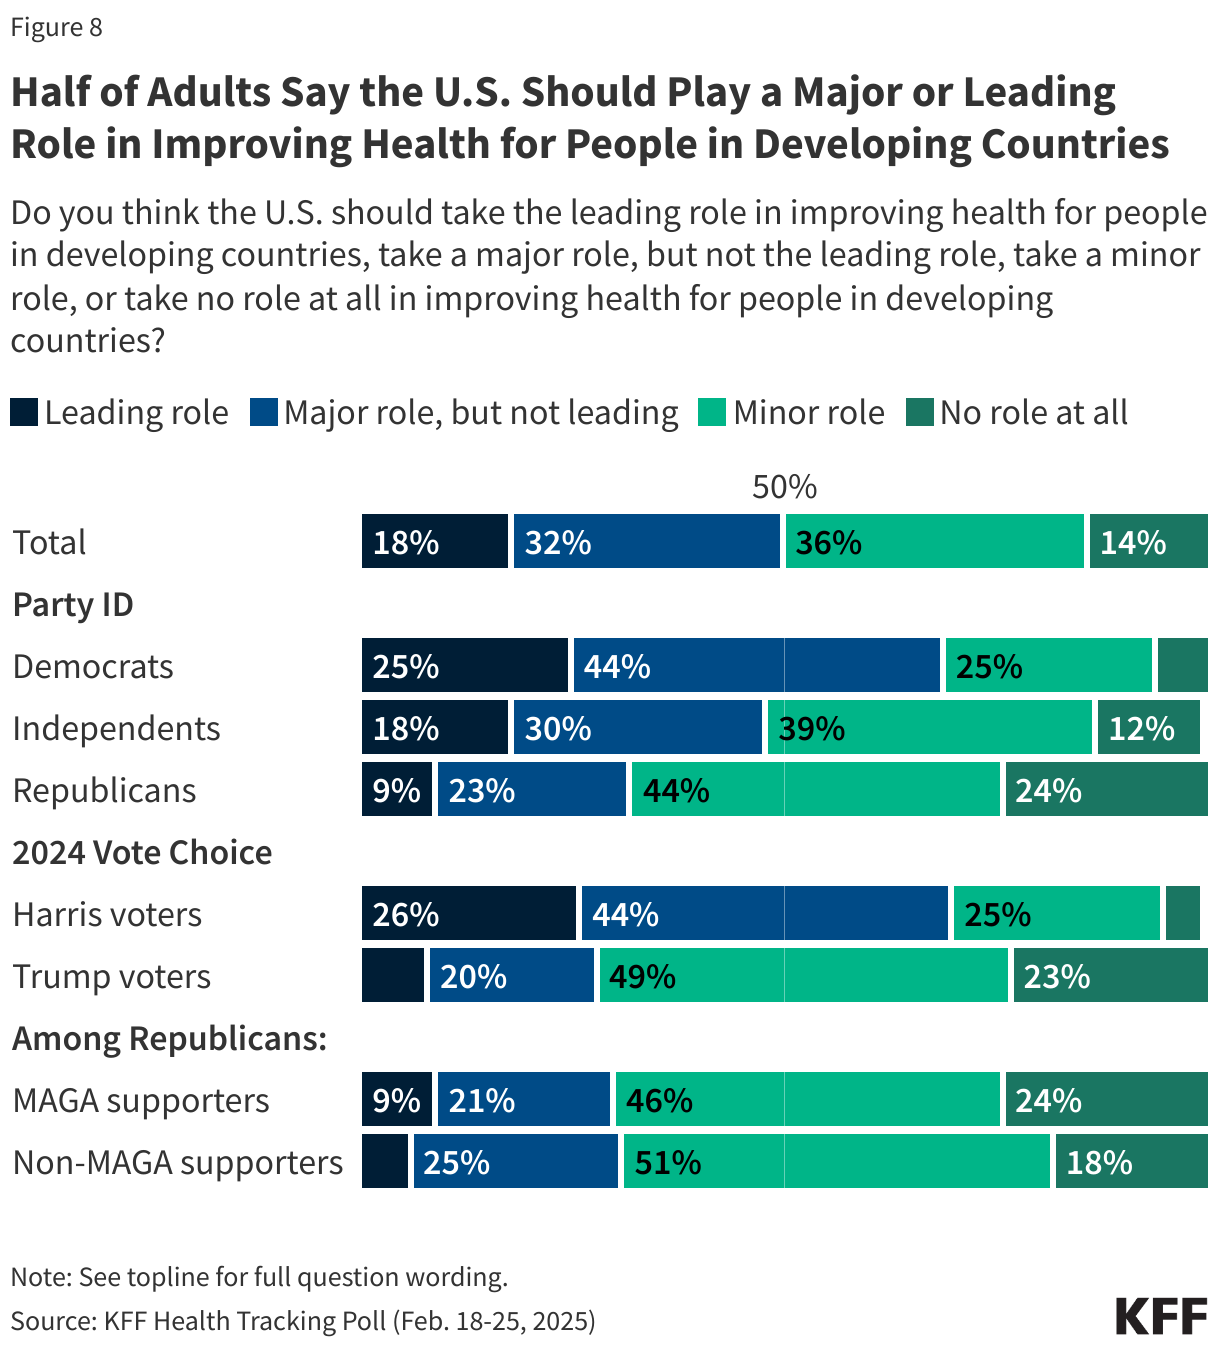
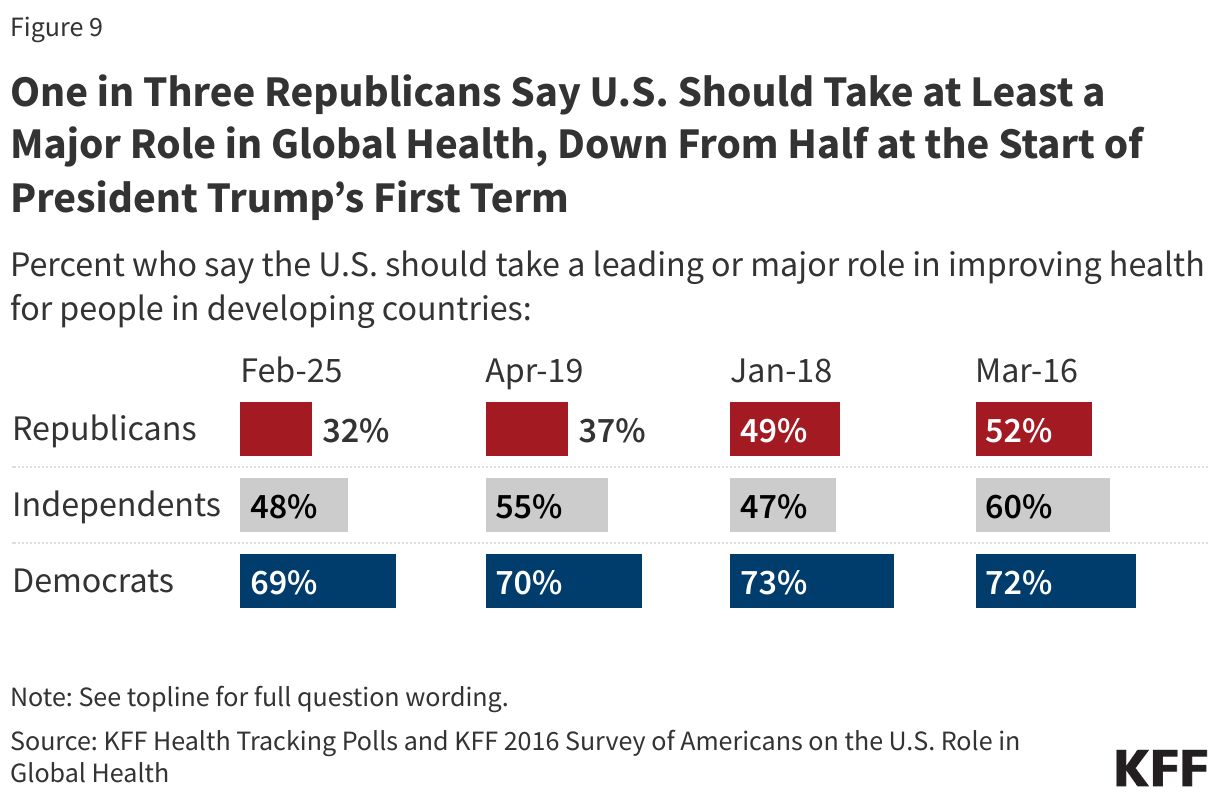
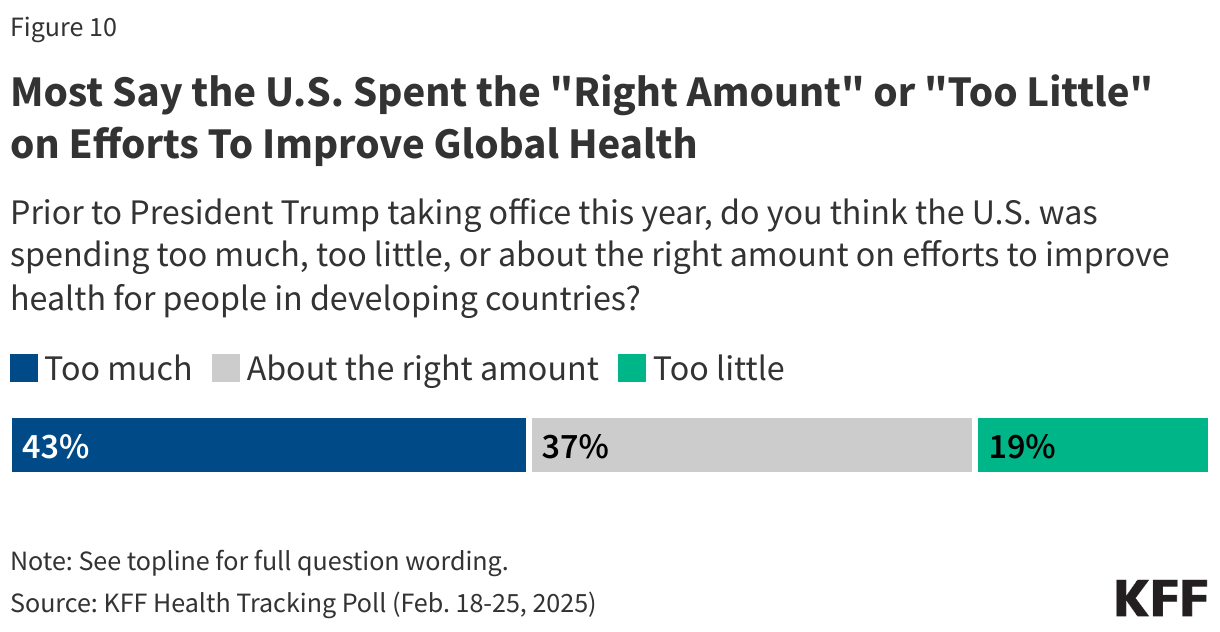
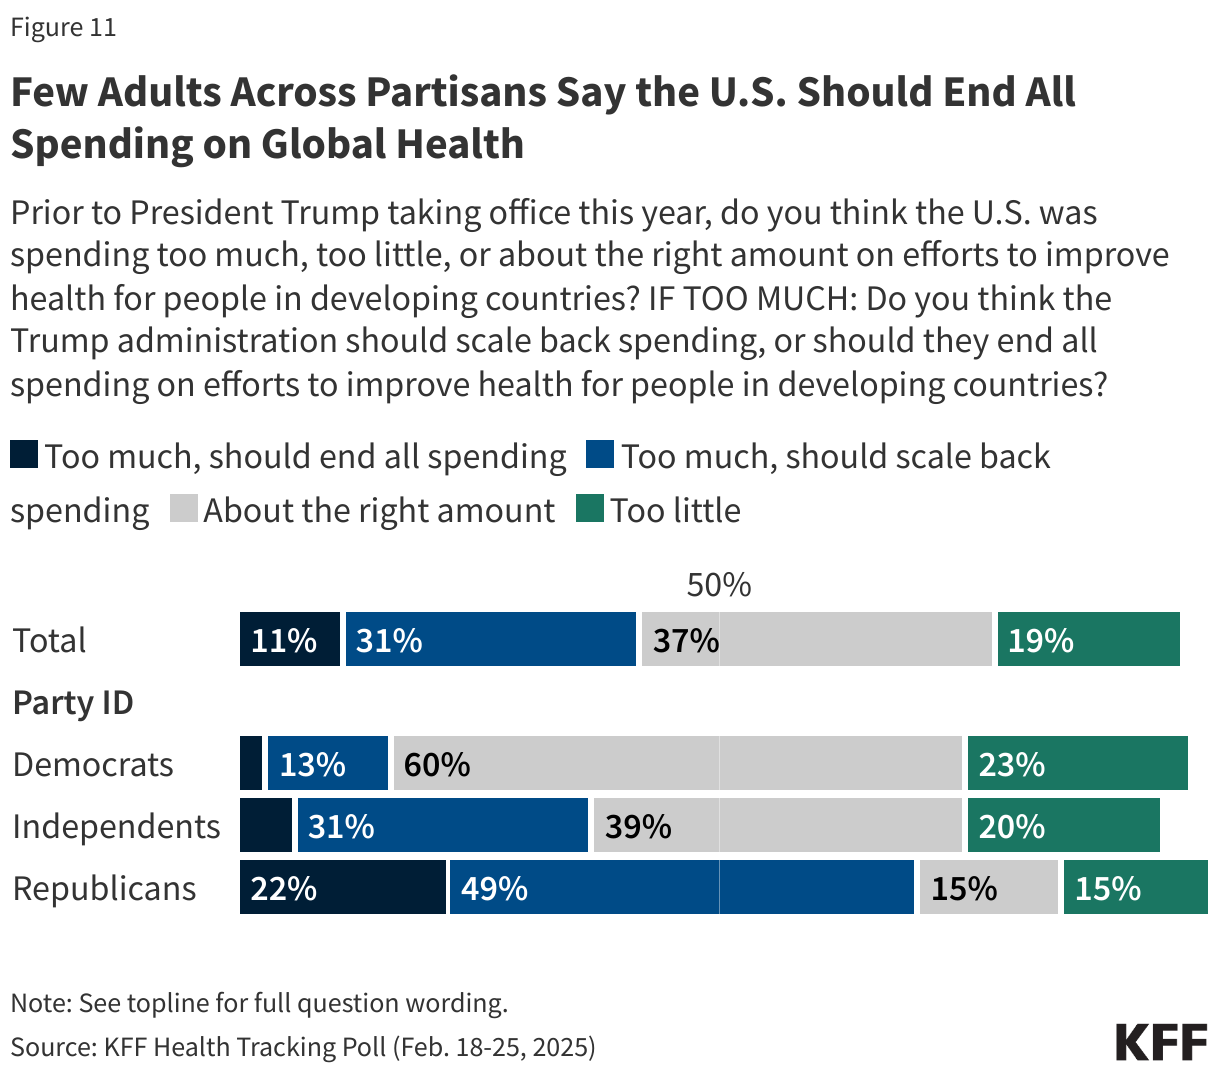
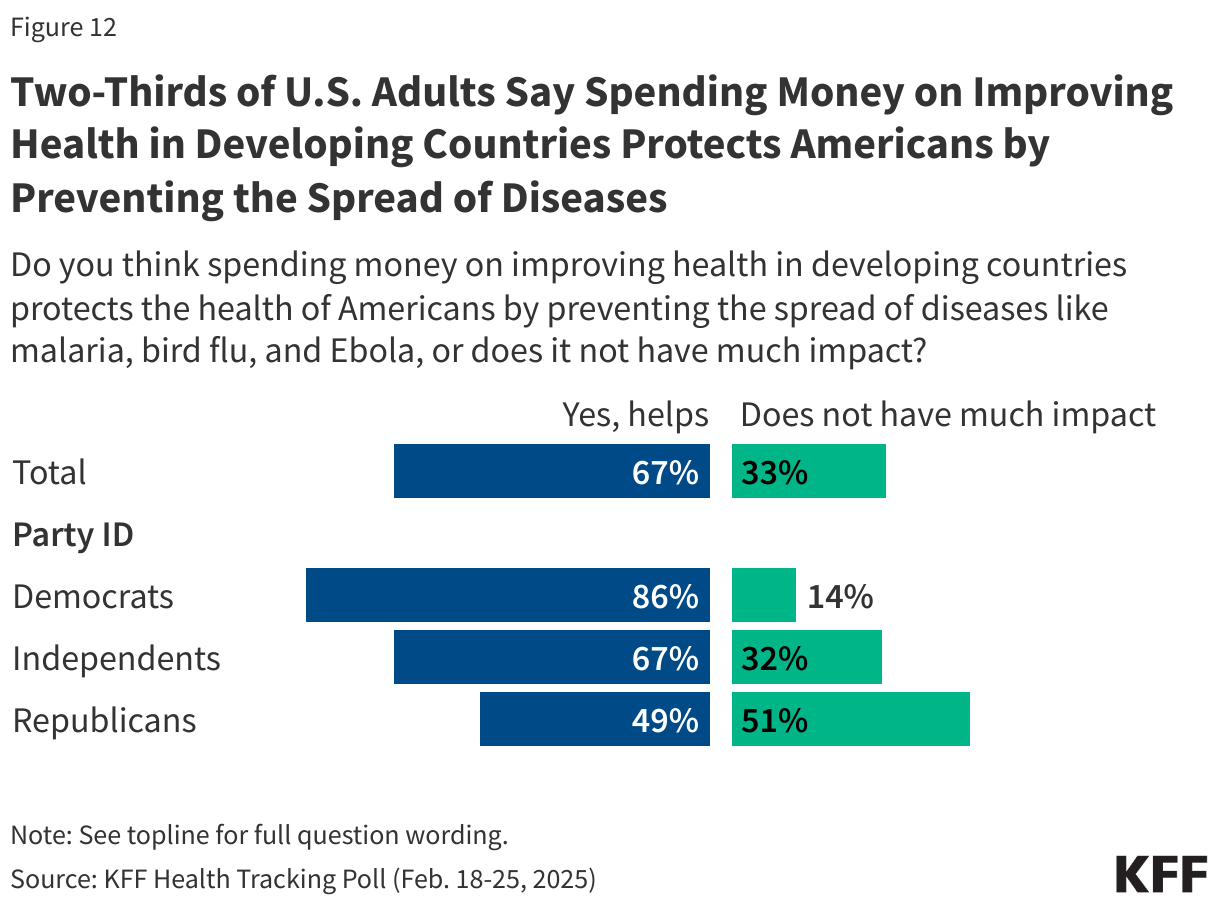
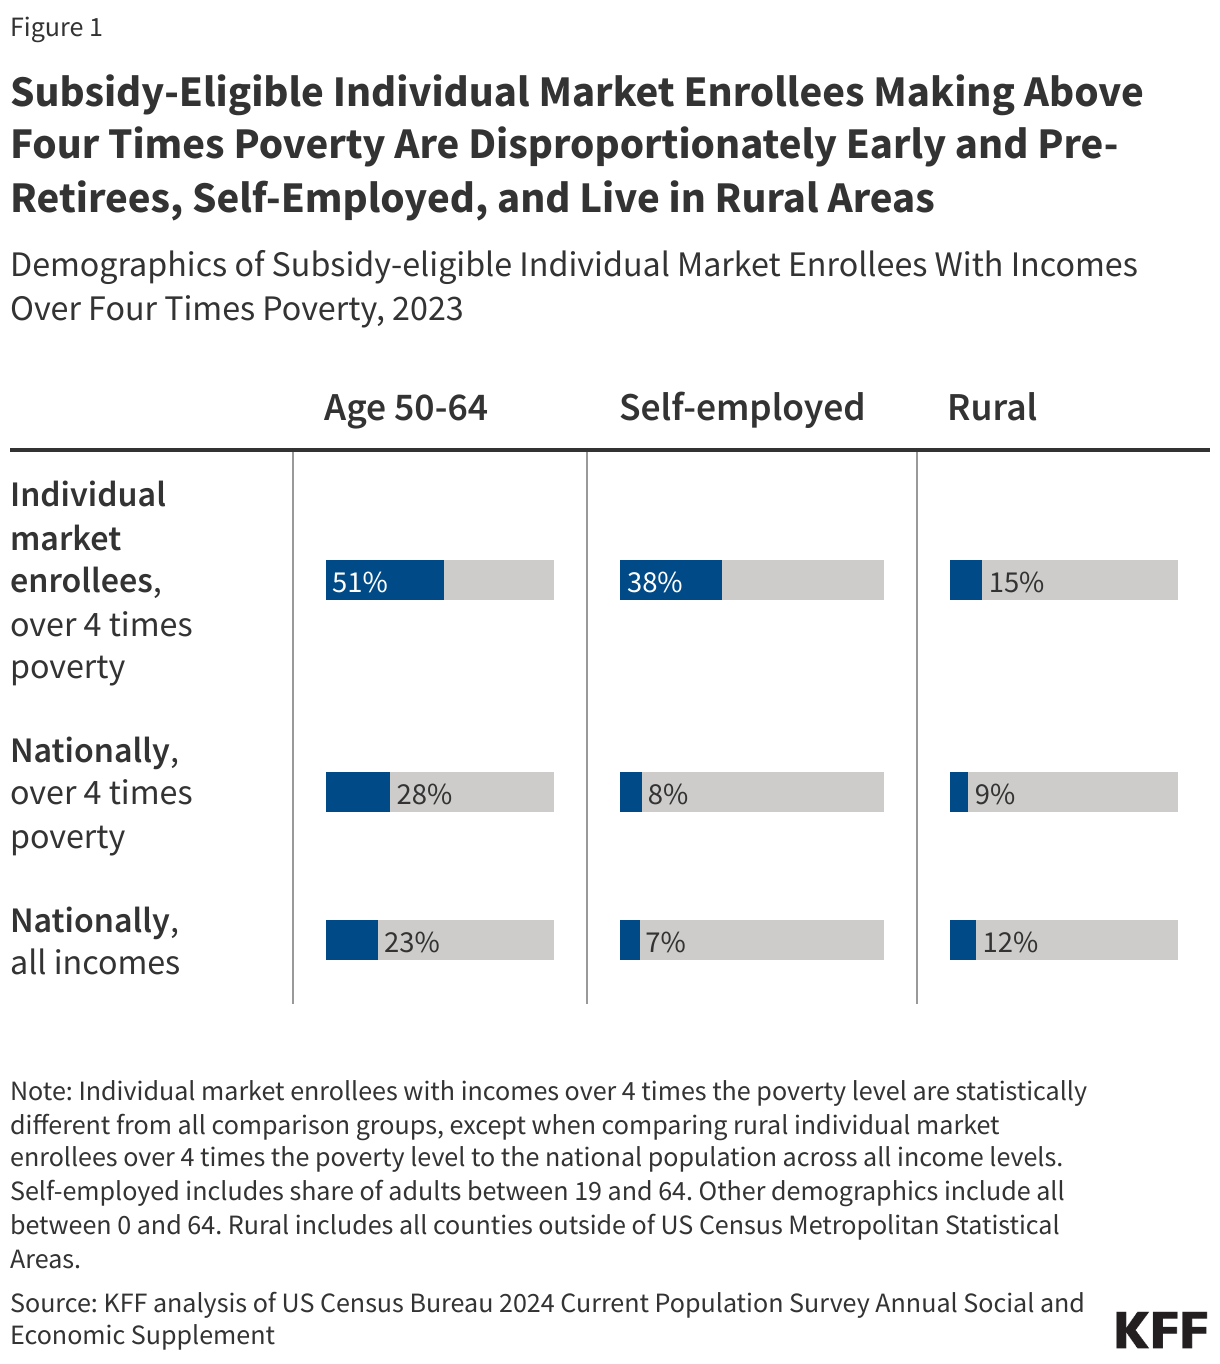
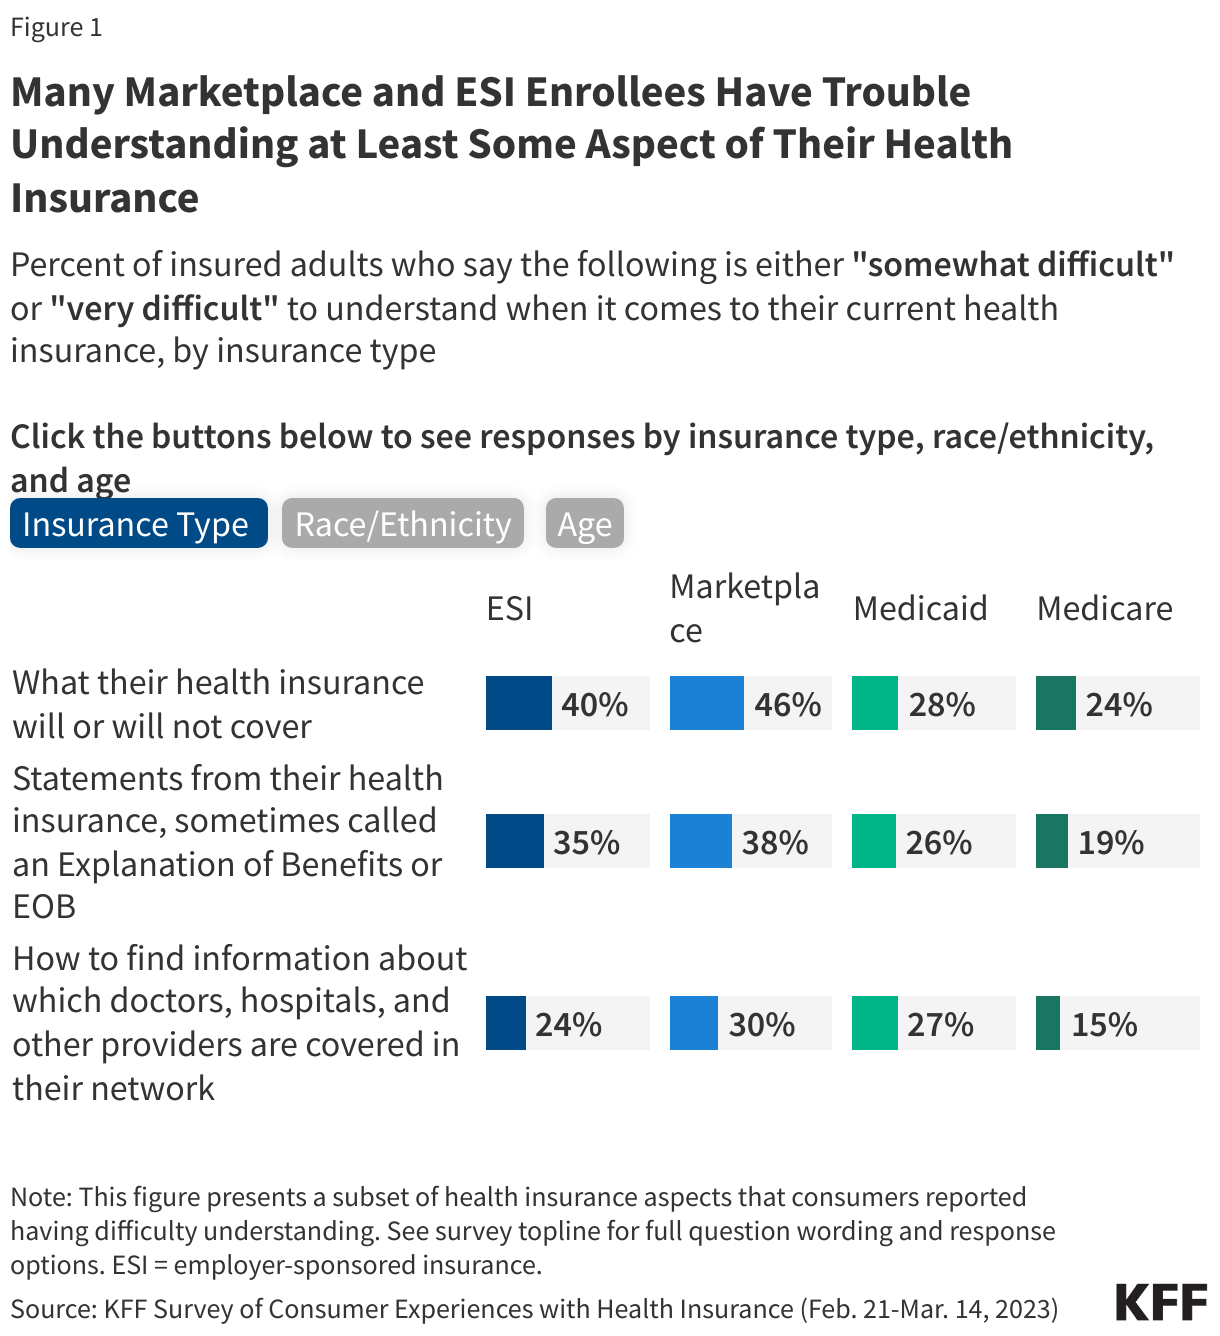
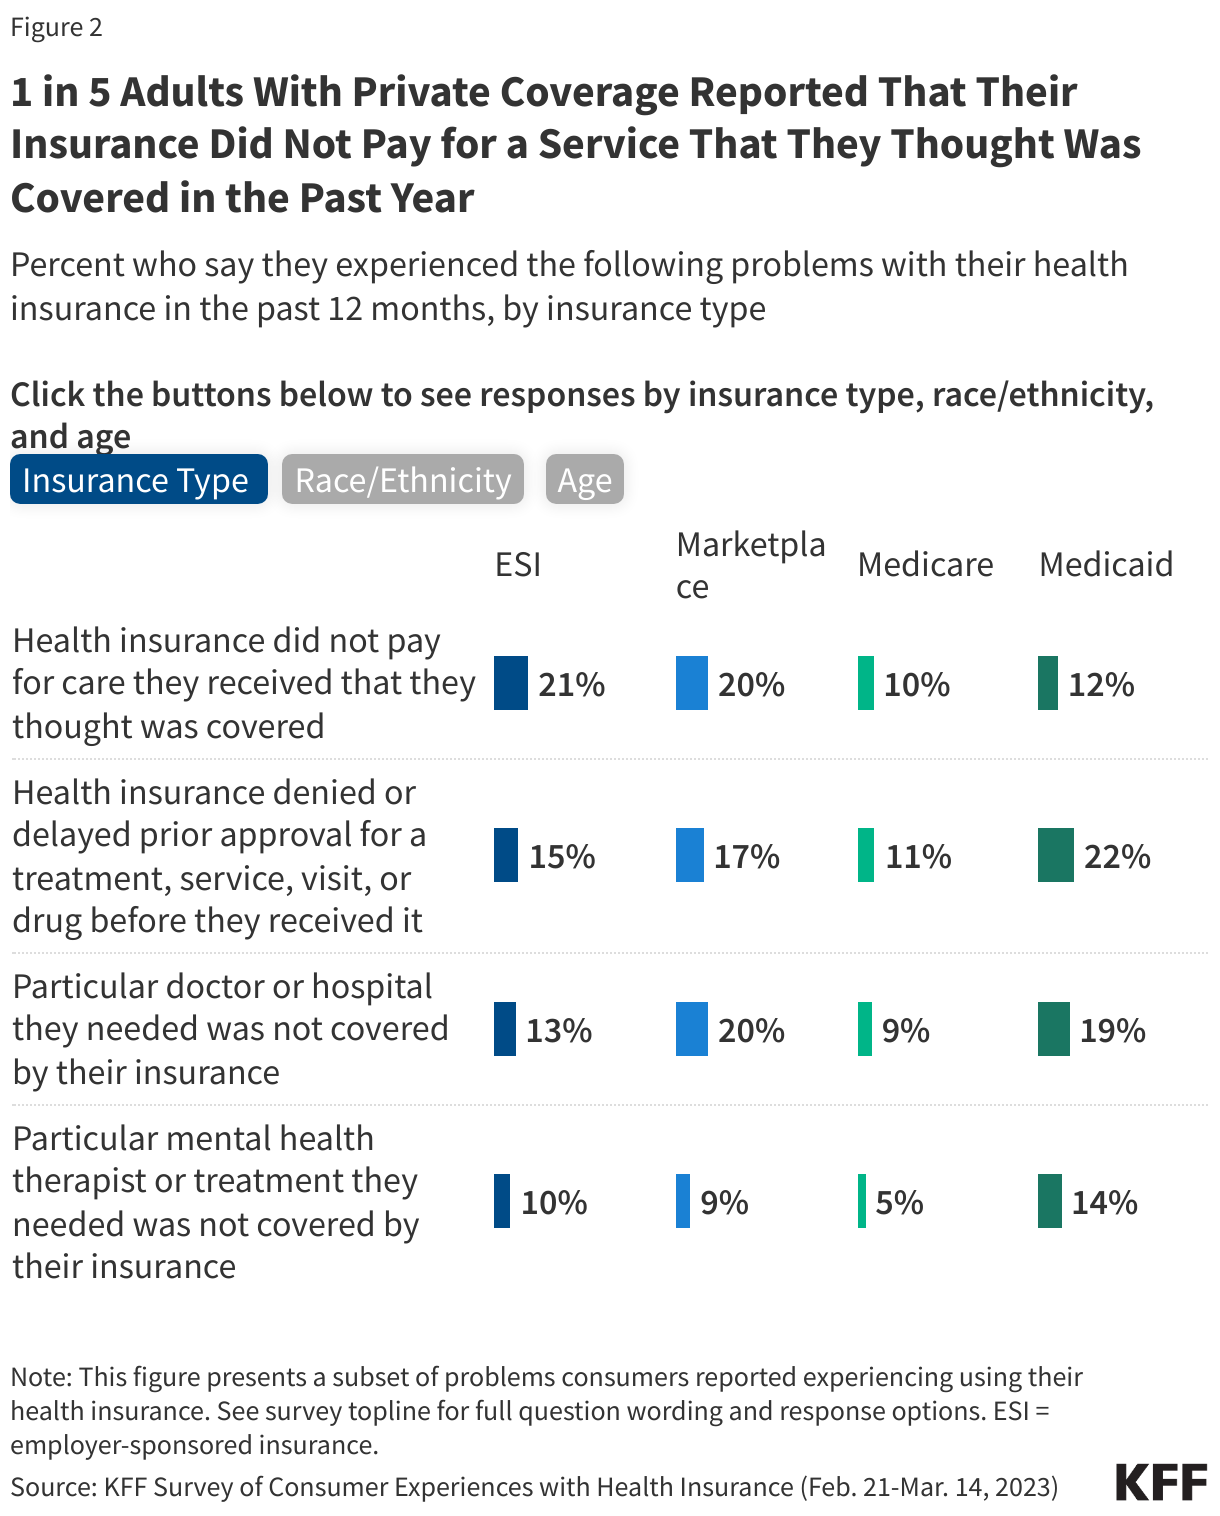
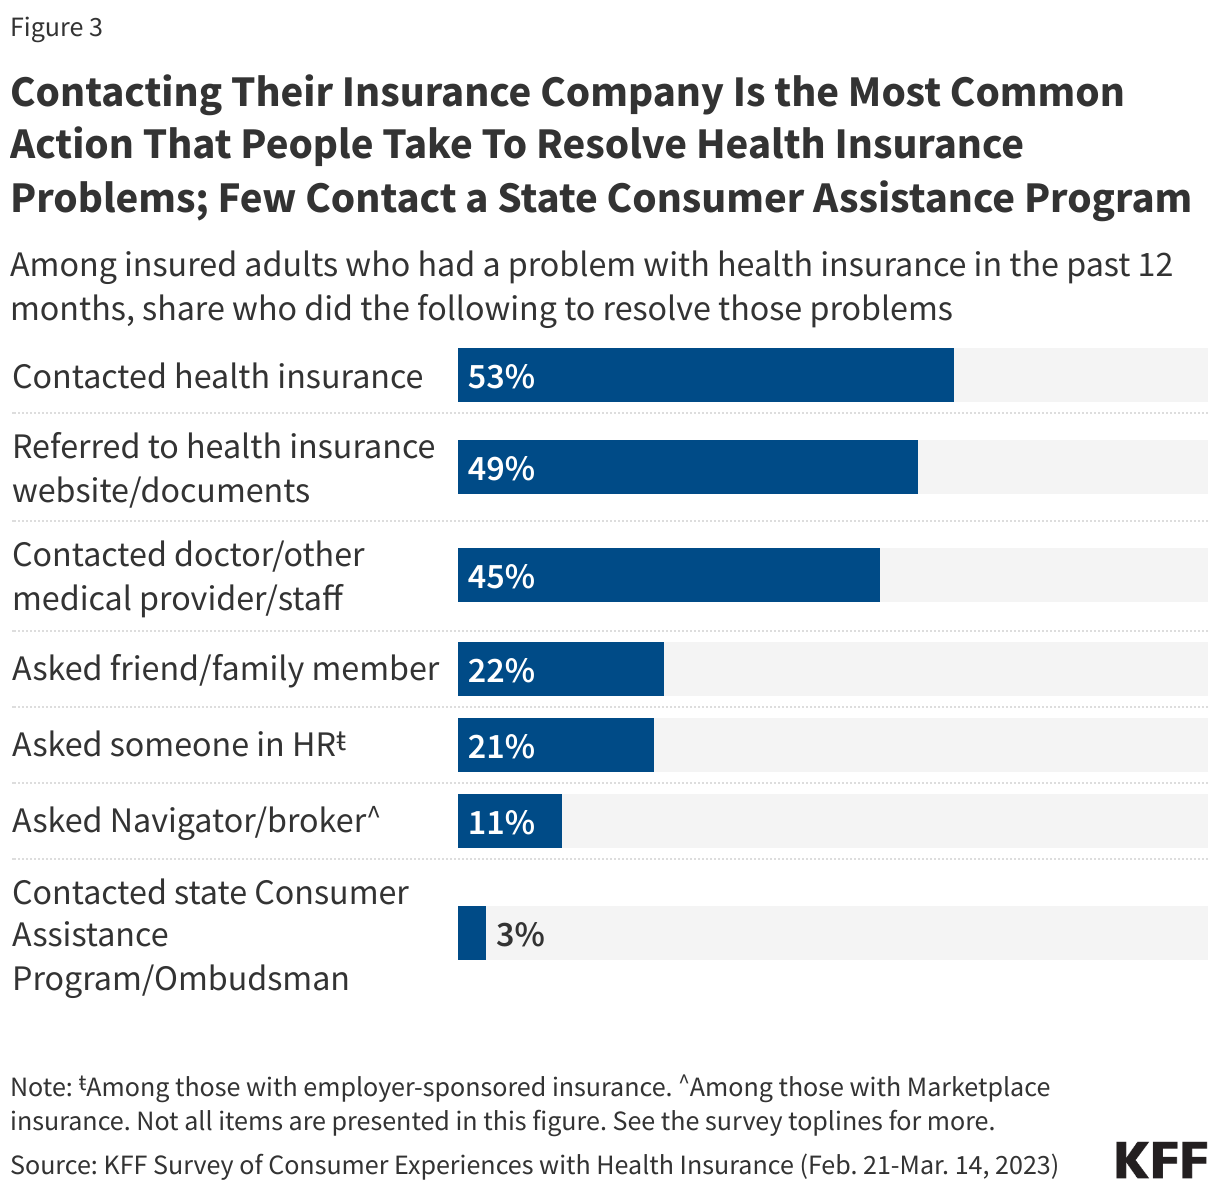
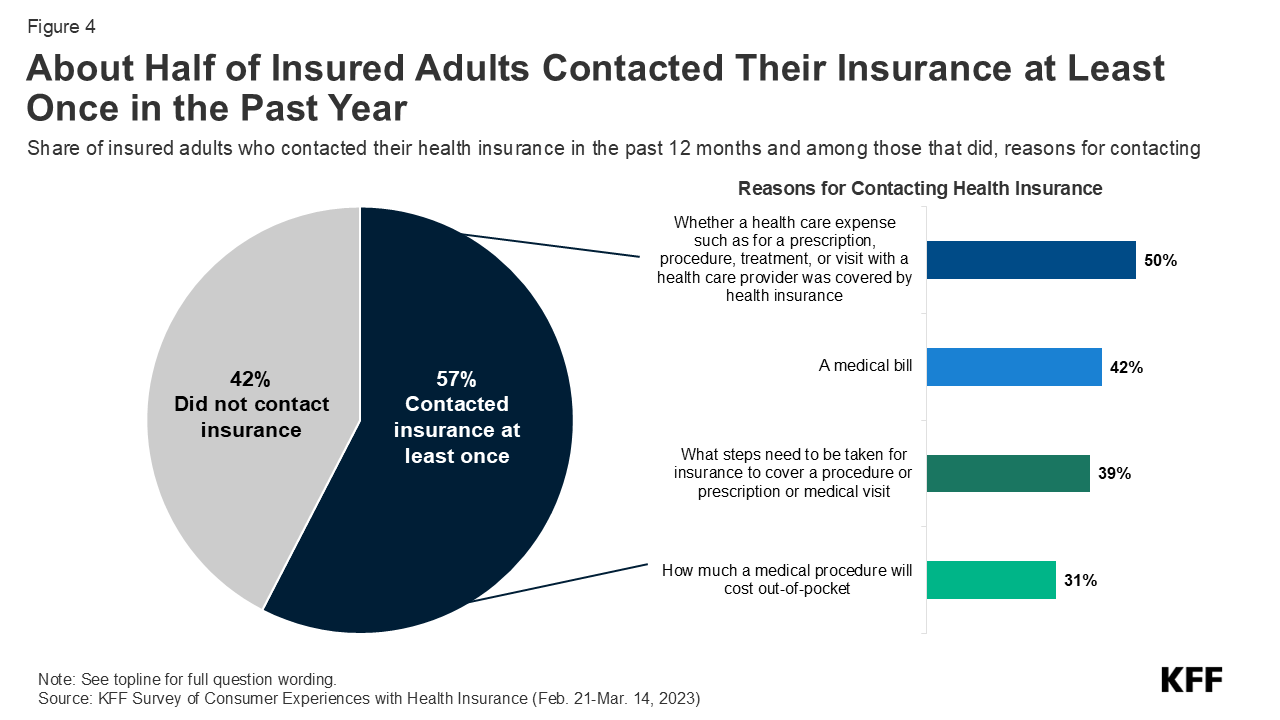
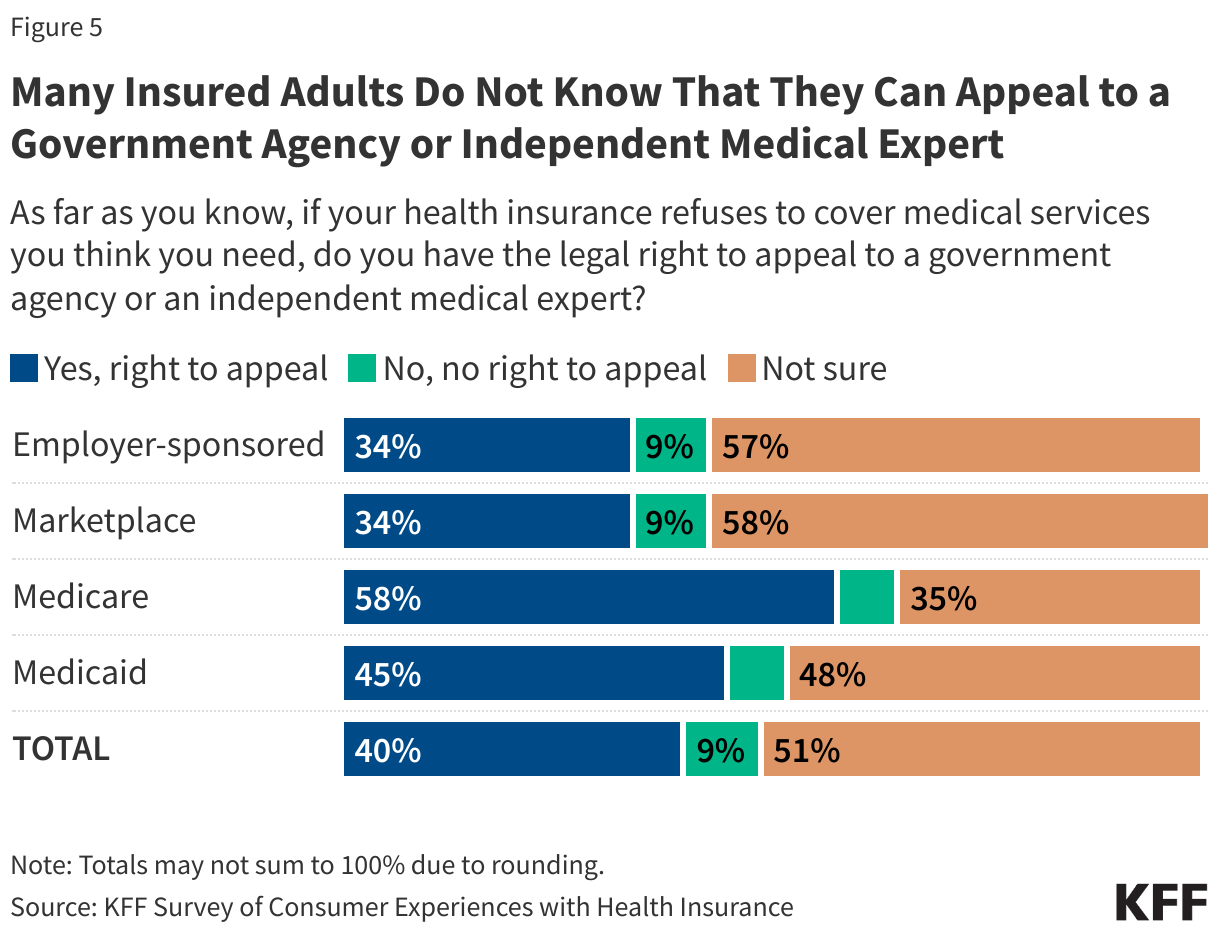
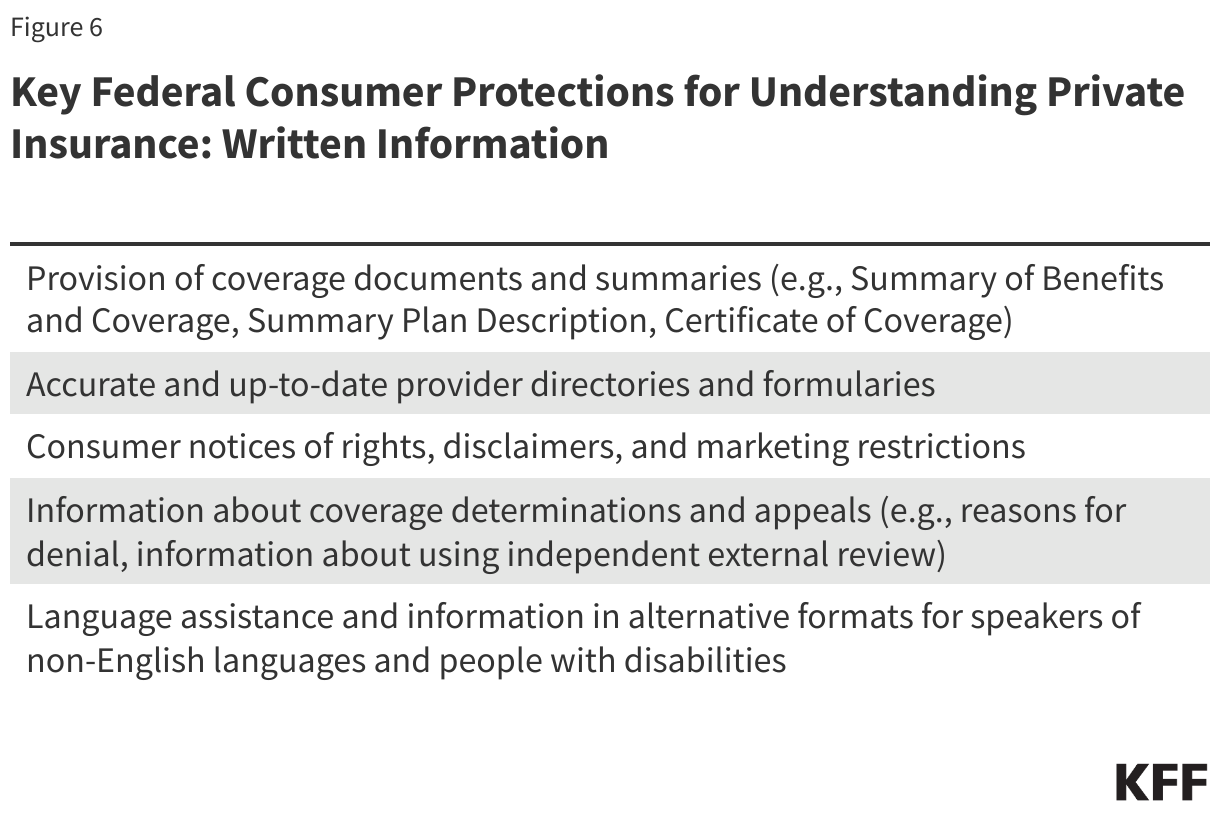
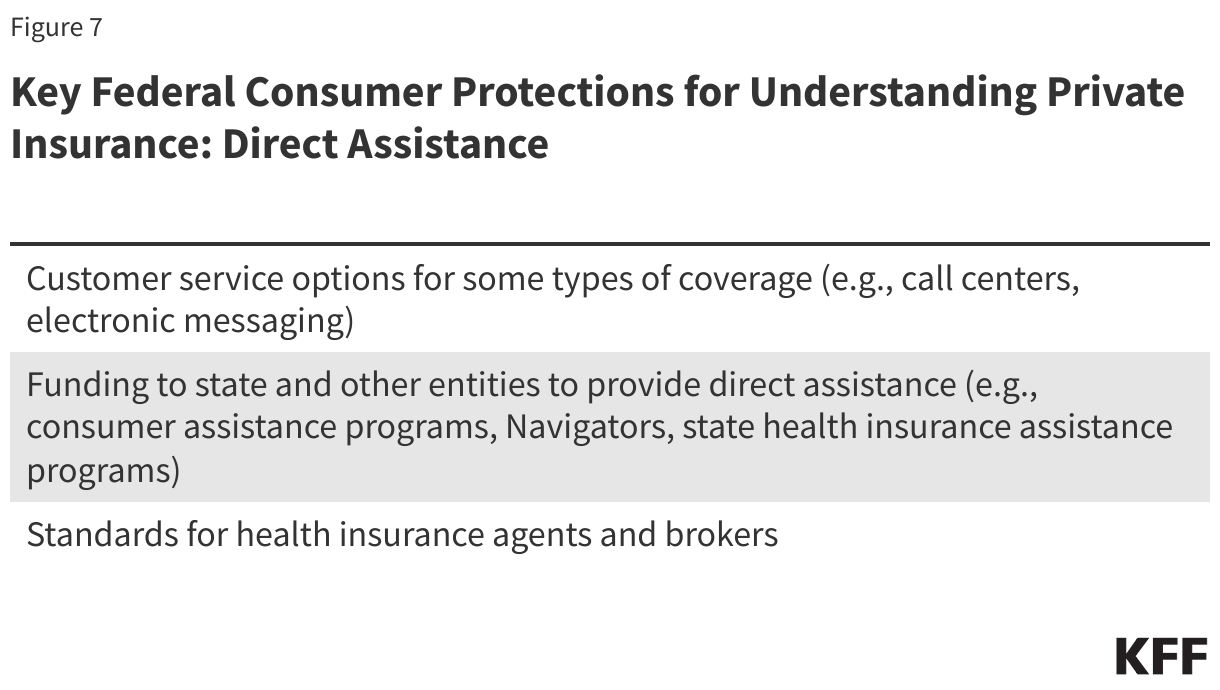


 Irving Washington
  Hagere Yilma