State Variation in Medicaid Per Enrollee Spending for Seniors and People with Disabilities
Proposals to fundamentally restructure Medicaid financing and substantially reduce federal funds under a per capita cap, such as the House GOP’s American Health Care Act, have important implications for the over 6 million seniors and 10 million nonelderly adults and children with disabilities who rely on the program for necessary medical and long-term care. Medicaid’s current financing structure guarantees federal matching funds as state spending increases. As a result of the options available under current law, there is substantial variation among state Medicaid programs in the eligibility pathways and covered services for seniors and people with disabilities. This in turn contributes to differences among states in spending per enrollee for these populations.
A per capita cap would limit the amount of federal Medicaid funding that states could receive per enrollee. Such a change could lock in historic variation in spending among states and limit states’ ability to respond to circumstances that increase health care spending, such as public health emergencies like the opioid epidemic, Flint water crisis, or HIV, natural disasters like Hurricane Katrina, or new medical advances like Hepatitis C drugs.
This issue brief explains the variation in Medicaid spending per enrollee for seniors, nonelderly adults with disabilities, and children with disabilities compared to other populations as well as variation in per enrollee spending for these populations among states. It also provides a snapshot of state choices about optional eligibility pathways and covered services important to many seniors and people with disabilities.
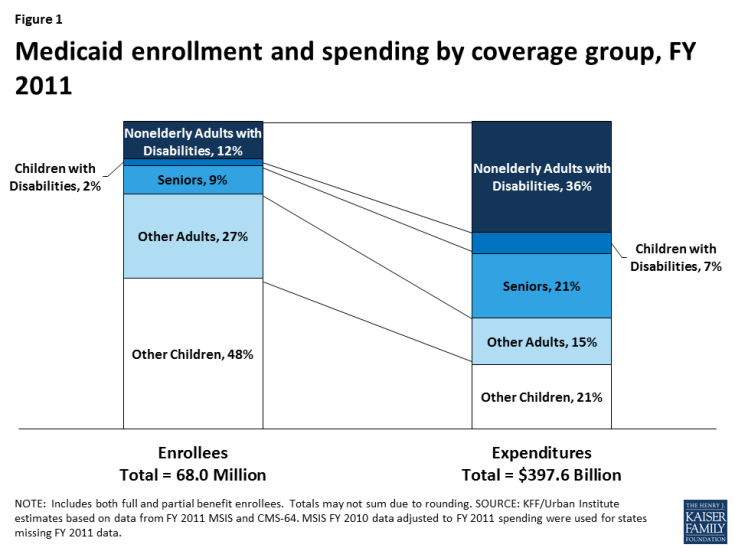
Seniors and people with disabilities together account for 23% of Medicaid enrollment but 64% of program spending as of FY 2011 (Figure 1). Children with disabilities and nonelderly adults with disabilities each account for a share of program spending that is about three times greater than their share of program enrollment (2% vs. 7%, and 12% vs. 36%), while the share of program spending devoted to seniors is more than double their share of enrollment (9% vs. 21%). These discrepancies are due to the greater health and long-term care needs of these populations, resulting in more intensive service use, compared to adults and children who come into the program based solely on their low incomes.
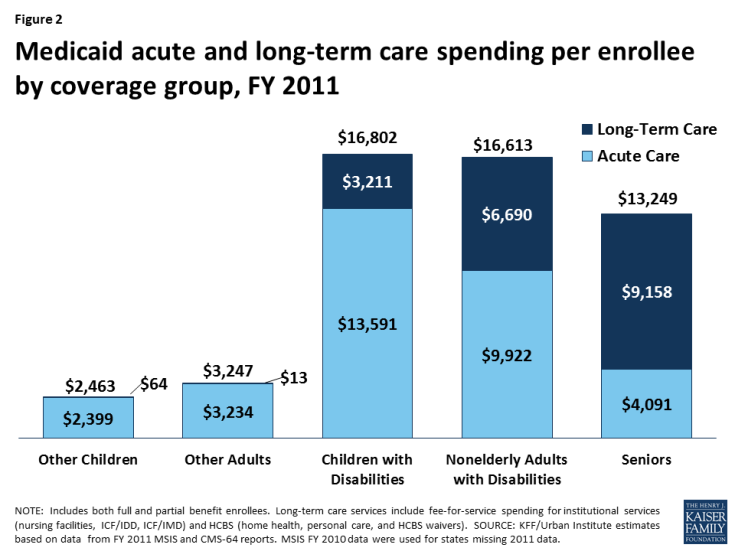
Medicaid spending per enrollee is substantially higher for seniors and people with disabilities compared to those without disabilities (Figure 2). Per enrollee spending for children with disabilities totaled $16,802 in FY 2011, nearly seven times higher than for other children ($2,463). In addition, per enrollee spending for nonelderly adults with disabilities is over five times higher ($16,613), and per enrollee spending for seniors is four times higher ($13,249), than per enrollee spending for other adults ($3,247). Some of these differences are due to seniors and people with disabilities’ greater use of long-term care services compared to those without disabilities. Some children and adults whose Medicaid eligibility is based solely on their low incomes do have disabilities and use long-term care services. However, seniors and people with disabilities also have higher spending per enrollee for acute care services compared to those without disabilities. Medicaid acute care spending per enrollee is nearly six times higher for children with disabilities ($13,591) compared to other children ($2,399) and over three times higher for nonelderly adults with disabilities ($9,922) compared to other nonelderly adults ($3,234).
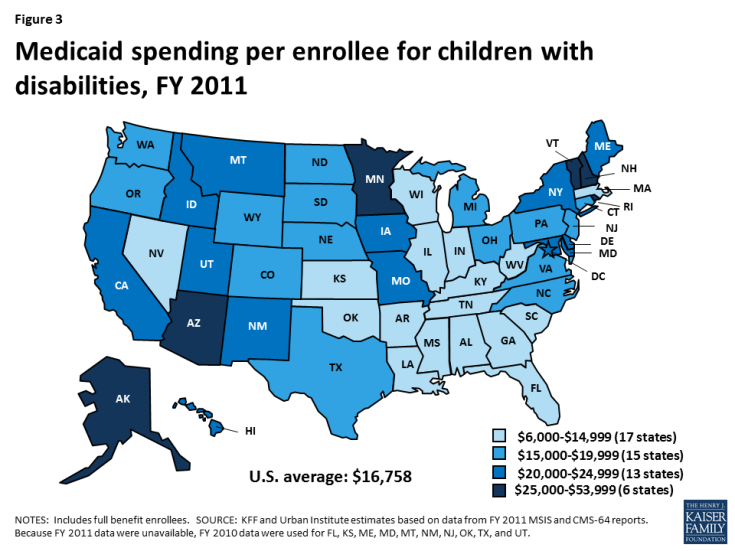
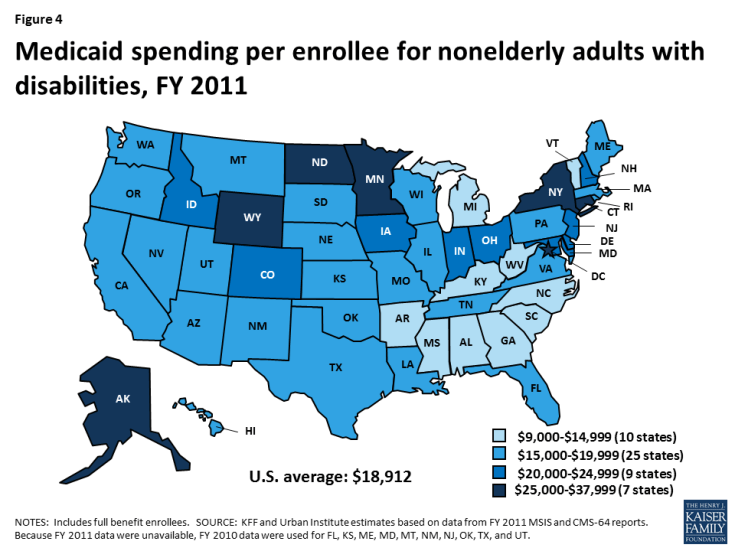
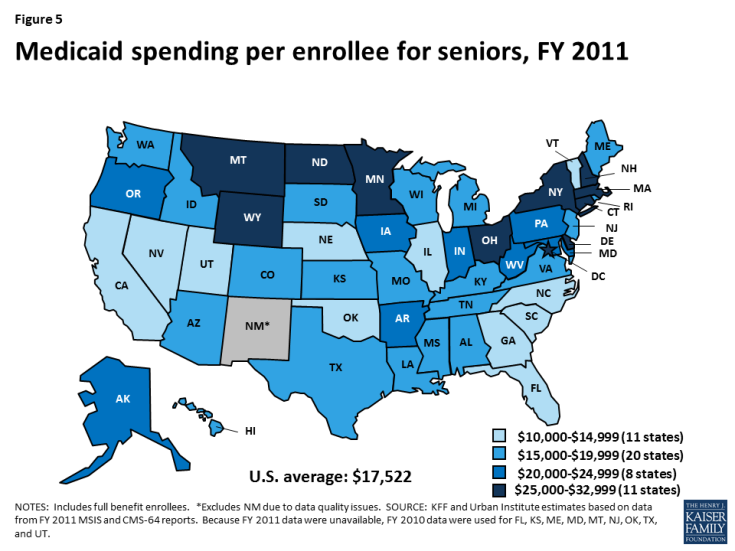
Per enrollee spending for seniors and people with disabilities varies substantially by state. Per enrollee spending for children with disabilities ranges from $6,945 in Tennessee to $53,557 in New Hampshire (Table 1). Seventeen states spend less than $15,000 per enrollee for children with disabilities, while six states spend $25,000 or more (Figure 3). Per enrollee spending for nonelderly adults with disabilities ranges from $9,903 in Alabama to $37,132 in New York (Table 1). Ten states spend less than $15,000 per enrollee for nonelderly adults with disabilities while seven states spend $25,000 or more (Figure 4). Per enrollee spending for seniors ranges from $10,518 in North Carolina to $32,199 in Wyoming (Table 1). Eleven states spend less than $15,000 per enrollee for seniors, while another 11 states spend $25,000 or more (Figure 5). The variation in per enrollee spending by state is due to state choices about eligibility and services, as many age and disability-related coverage pathways and most home and community-based long-term care services are offered at state option.
Many age and disability-related coverage pathways are offered at state option (Figure 6 and Table 1), contributing to the variation among states in per enrollee spending for seniors and people with disabilities. Mandatory Medicaid eligibility for seniors and people with disabilities generally is limited to those receiving Supplemental Security Income (SSI) benefits (equivalent to 74% FPL, or $8,820 per year for an individual, in 2017).1 However, all states have expanded eligibility for seniors and people with disabilities by offering optional coverage pathways. As of 2015, 21 states have increased eligibility for seniors and individuals with disabilities above the SSI level up to a federal maximum of 100% FPL ($12,060 per year for an individual in 2017). Nearly all states offer an eligibility pathway for children with significant disabilities living at home without regard to parental income who would be Medicaid-eligible if institutionalized. Forty-four states allow working individuals with disabilities with income above eligibility limits to buy into Medicaid. Forty-four states allowed people in need of nursing facility care to qualify for Medicaid with income up to 300% of SSI ($26,460 per year for an individual in 2017), and nearly all of these states use the same expanded financial eligibility standard for people receiving long-term care in the community.
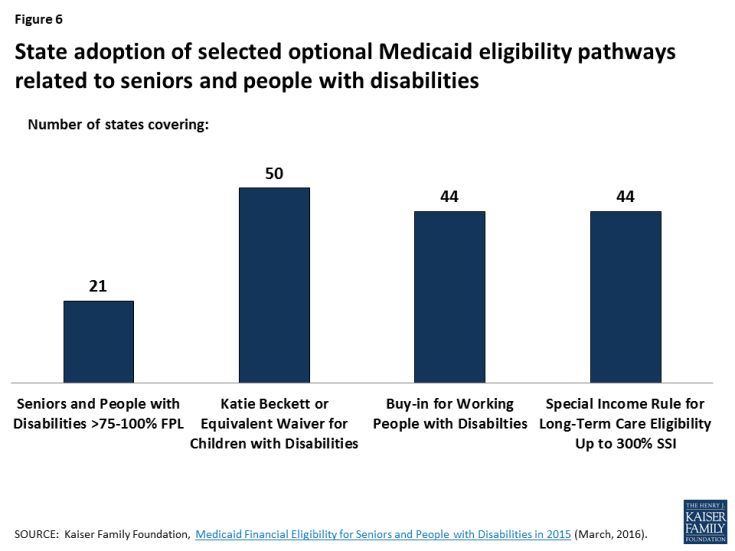
Figure 6: State adoption of selected optional Medicaid eligibility pathways related to seniors and people with disabilities
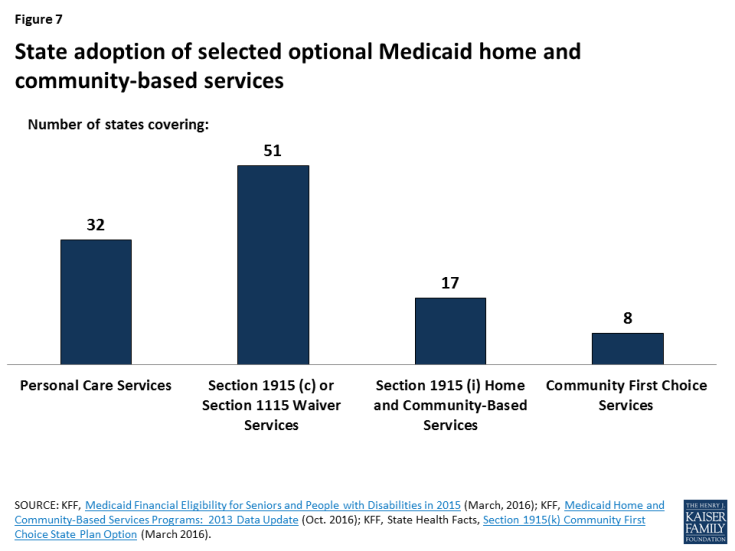
Variation among states in spending per enrollee for seniors and people with disabilities also is influenced by different state choices about Medicaid-covered services, as most home and community-based long-term care services are offered at state option (Figure 7 and Table 1). Federal minimum long-term care benefits include nursing facility services and home health services for those who qualify for nursing facility services. Beyond federal minimum requirements, all states offer some home and community-based services targeted to particular populations through optional Section 1915 (c) or equivalent Section 1115 waivers. Seventeen states offer targeted HCBS to those at risk of future institutional care through the Section 1915 (i) state plan option as of 2015. In addition, 32 states offer personal care services as of 2013, and eight states offer Community First Choice attendant care services and supports as of 2016.
The share of Medicaid enrollees receiving community-based, as opposed to institutional, long-term care services varies by population (Figure 8). Most children with disabilities (88%) and nonelderly adults with disabilities (79%) receiving Medicaid long-term care services reside in the community, with the remainder in institutions. Equal shares of seniors receiving Medicaid long-term care services reside in the community and in institutions.
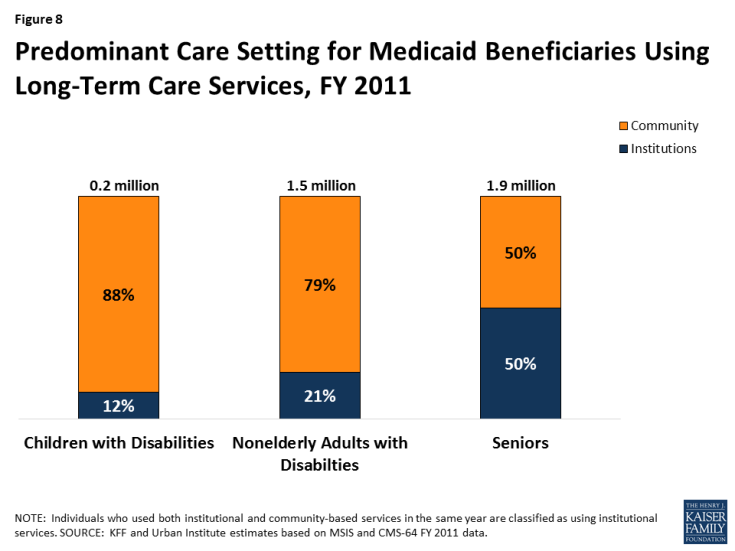
Figure 8: Predominant Care Setting for Medicaid Beneficiaries Using Long-Term Care Services, FY 2011
Looking Ahead
Seniors and people with disabilities account for a minority (23%) of Medicaid program enrollment but a majority (64%) of spending. This is due to their greater health and long-term care needs and more intensive services use compared to adults and children whose eligibility is not based on old age or disability. Medicaid per enrollee spending for both acute and long-term care services is substantially higher for seniors and people with disabilities compared to nonelderly adults and children without disabilities. Many of these services, especially long-term care in the community and nursing homes, are generally unavailable through private insurance and too costly to afford out-of-pocket.
Medicaid spending per enrollee for seniors and people with disabilities also varies substantially across states and reflects the fact that many eligibility pathways and services relevant to seniors and people with disabilities are optional. Medicaid’s financing structure, which allows federal spending to increase as state spending increases, accommodates state policy choices about optional populations and services. Current program financing also ensures that federal spending will be available as state spending increases due to new drug therapies or other medical advances yet to be developed that could offer important new treatments for seniors and people with disabilities and to help states meet their obligation to serve people in the community instead of institutions under the Americans with Disabilities Act and the Supreme Court’s Olmstead decision.
Changing federal Medicaid financing to a per capita capped allotment beginning in FY 2020, and repealing the Medicaid expansion as proposed in the American Health Care Act, would result in an estimated $839 billion reduction in federal Medicaid spending from 2017 to 2026, according to the Congressional Budget Office (CBO). The CBO decreased its initial estimate of $880 billion less in federal Medicaid spending over the 10-year period, which amounts to a reduction of about 25% by 2026, compared to current law, by an additional $41 billion to account for the effects of the House manager’s policy amendment. The amendment would increase states’ annual per capita allotments for enrollees in the elderly and blind/disabled categories by medical-CPI plus one percentage point beginning in FY 2020, while the allotments for children, expansion adults, and other adults would increase by medical-CPI. The CBO projects that Medicaid spending per enrollee will grow at a faster average annual rate than medical-CPI (4.4% vs. 3.7%) between 2017-2026. However, the inflationary factor to adjust state spending from the FY 2016 base year to FY 2019 when determining initial per capita cap funding levels remains at medical-CPI for all groups; the additional percentage point for the elderly and blind/disabled groups is not included in that calculation.
A per capita cap could lock in historical state differences in the scope of coverage and spending for seniors and people with disabilities. Tying Medicaid spending levels to a base year under a per capita cap also does not account for future spending increases due to new drug therapies or other medical advances yet to be developed and which could offer important new treatments for seniors and people with disabilities. Finally, seniors and people with disabilities may be especially affected by a per capita cap as most age and disability-related coverage pathways and many important services, such as community-based long-term care, are provided at state option, making them subject to potential cuts if states are faced with federal funding reductions.

