Health Coverage by Race and Ethnicity, 2010-2024
Summary
Health coverage plays a major role in enabling people to access health care and protecting families from high medical costs. There have been longstanding racial and ethnic disparities in health coverage that contribute to disparities in health. Due to Medicaid and Affordable Care Act (ACA) cuts in the 2025 reconciliation law and the expiration of the ACA’s enhanced premium tax credits, the number of uninsured is expected to increase by more than 14 million by 2034, potentially exacerbating racial disparities in coverage. This brief examines trends in health coverage by race and ethnicity from 2010 through 2024 and discusses the implications for health disparities. It is based on KFF analysis of American Community Survey (ACS) data for people under age 65. All noted differences between groups and years described in the text are statistically significant at the p<0.05 level. Key takeaways include:
Since 2010, there have been large gains in health coverage across racial and ethnic groups but racial and ethnic disparities in coverage persisted. The largest gains occurred after implementation of the ACA coverage expansions in 2014, with increases continuing until 2016. Hispanic people under age 65 had the largest percentage point increase in coverage, with their uninsured rate falling from 32.6% in 2014 to 19.1% as of 2016. Black, Asian, and American Indian or Alaska Native (AIAN) people also had larger percentage point increases in coverage compared to White people over that period. Despite these larger gains, Hispanic, Black, AIAN, and Native Hawaiian or Pacific Islander (NHPI) people under age 65 remained more likely than their White counterparts to be uninsured as of 2016. Beginning in 2017, coverage gains began reversing, and the overall number of uninsured increased for three consecutive years, coinciding with the first Trump administration. Pandemic-era policies drove broad coverage gains and reduced uninsured rates across most racial and ethnic groups between 2019 and 2023.
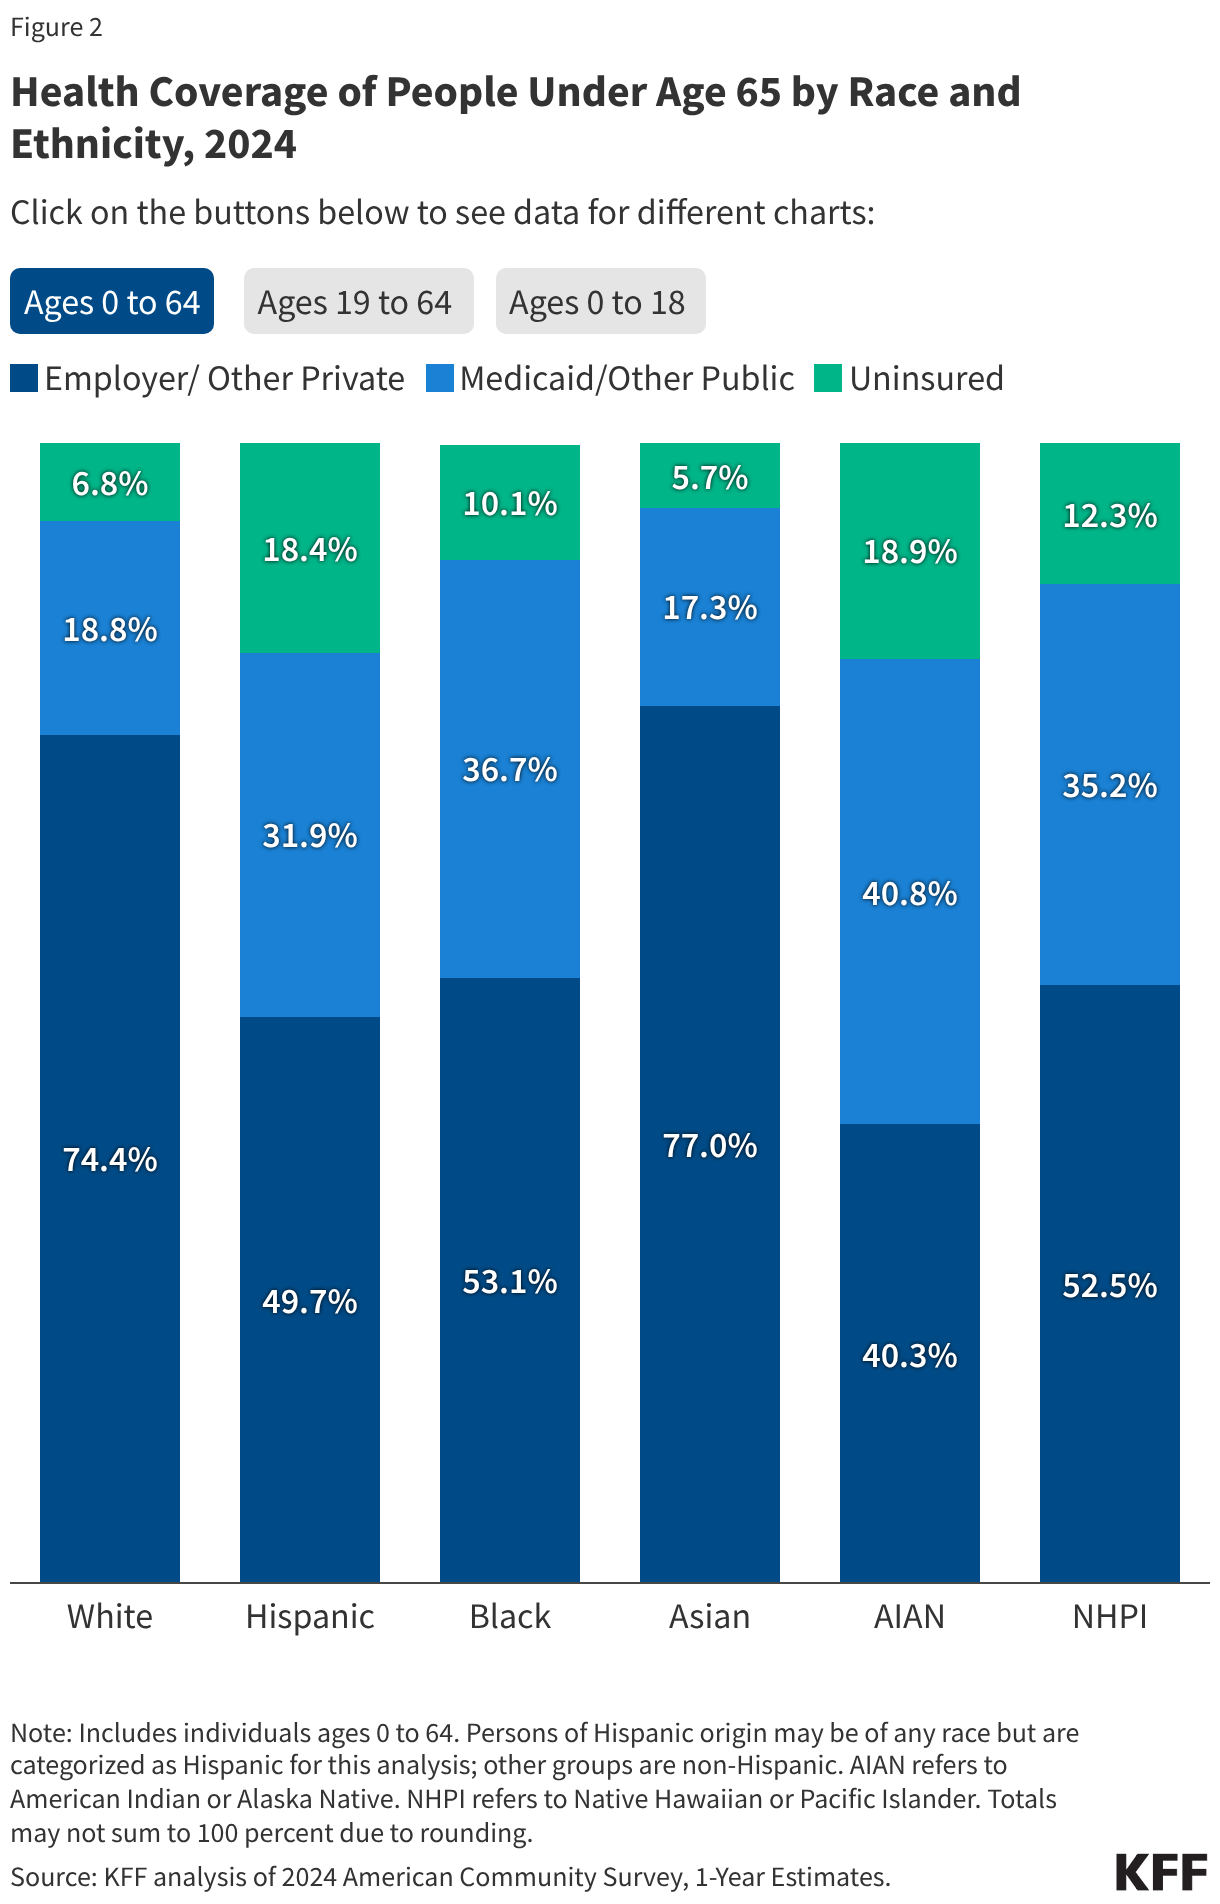
In 2024, the overall uninsured rate increased for the first time since 2019 as pandemic-era continuous enrollment in Medicaid came to an end, with significant increases among Hispanic, Black, and White people under age 65. Asian, AIAN and NHPI people did not have statistically significant changes in coverage over this period. As of 2024,AIAN and Hispanic people under age 65 had the highest uninsured rates at 18.9% and 18.4%, respectively. Uninsured rates for NHPI (12.3%) and Black people (10.1%) under age 65 also were higher than the rate for their White counterparts (6.8%). Asian people had the lowest uninsured rate at 5.7%.
Coverage disparities have persisted over time and, in some cases, widened despite earlier gains under the ACA. For example, between 2010 and 2024, the uninsured rate for AIAN people grew from 2.4 to 2.8 times higher than the uninsured rate for White people, the Hispanic uninsured rate grew from 2.5 to 2.7 times higher than the rate for White people, and Black people remained 1.5 times more likely to be uninsured than White people.
Recent policy changes are projected to lead to increased coverage losses in coming years, which will likely widen racial and ethnic coverage disparities. The 2025 reconciliation law makes significant changes to Medicaid and the ACA Marketplaces, which are projected to lead to large coverage losses. It also further restricts access to health coverage for lawfully present immigrants across public health insurance programs. Additionally, the expiration of enhanced premium tax credits for ACA Marketplace enrollees has led to substantial out-of-pocket premium increases and further growth in the uninsured population. The Congressional Budget Office estimates that the combined impact of the reconciliation law with the expiration of the ACA’s enhanced premium tax credits will increase the number of uninsured by more than 14 million in 2034. Medicaid and ACA Marketplace coverage losses will likely widen racial disparities in coverage given that disproportionately large shares of Hispanic, Black, AIAN, and NHPI people are covered through these sources. Coverage losses, in turn, would likely contribute to widening disparities in health.
Trends in Uninsured Rates by Race and Ethnicity, 2010-2024
Prior to the enactment of the ACA in 2010, Hispanic, Black, Asian, AIAN, and NHPI people under age 65 were more likely to be uninsured compared to their White counterparts, with Hispanic and AIAN people at the highest risk of lacking coverage (Figure 1). Their higher uninsured rates reflected more limited access to affordable health coverage options. Although the majority of individuals have at least one full-time worker in the family across racial and ethnic groups, there are ongoing racial disparities in employment and income that result in some groups having more limited access to coverage offered by an employer or having greater difficulty affording private coverage when it is available. While Medicaid helps fill some of these gaps in private coverage, prior to the ACA, Medicaid eligibility for parents in most states was limited to those with very low incomes (often below 50% of the poverty level), and adults without dependent children—regardless of how poor—were ineligible under federal rules.
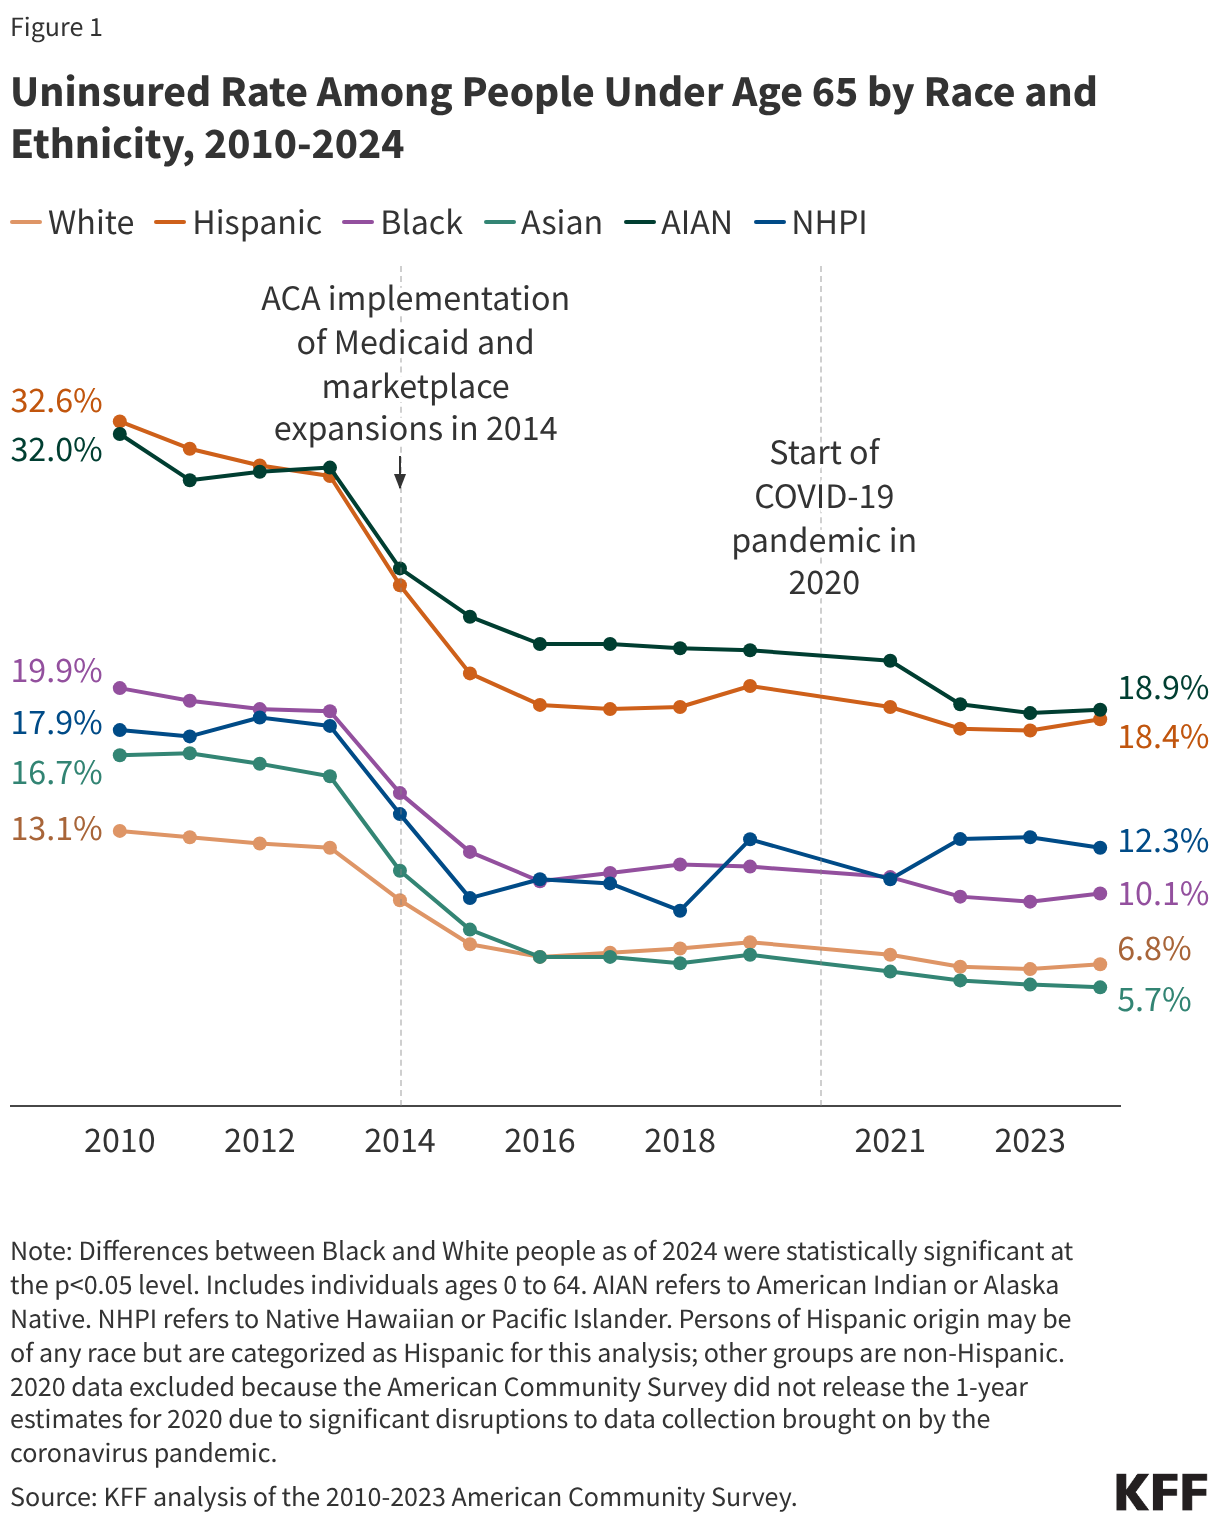
Between 2010 and 2016, there were large gains in coverage across racial and ethnic groups under the ACA, but racial and ethnic disparities in coverage persisted. The ACA created new coverage options for low- and moderate-income individuals. These included provisions to extend dependent coverage in the private market up to age 26 and prevent insurers from denying people coverage or charging them more due to health status. Further, beginning in 2014, the ACA expanded Medicaid coverage to nearly all adults with incomes at or below 138% of poverty in states that adopted the expansion and made tax credits available to people with incomes up to 400% of poverty to purchase coverage through a health insurance Marketplace. Following the ACA’s enactment in 2010 through 2016, coverage increased across all racial and ethnic groups, with the largest increases occurring after implementation of the Medicaid and Marketplace coverage expansions in 2014. Hispanic people under age 65 had the largest percentage point increase in coverage, with their uninsured rate falling from 24.8% to 19.1% between 2014 and 2016. Black, Asian, and AIAN people also had larger percentage point increases in coverage compared to White people over that period. Despite these larger gains, Hispanic, Black, AIAN, and NHPI people under age 65 remained more likely than their White counterparts to be uninsured as of 2016.
Beginning in 2017, coverage gains began reversing, and the number of uninsured increased for three consecutive years. The uninsured rate for the total population under age 65 increased from 10.0% in 2016 to 10.9% in 2019. Hispanic people had the largest statistically significant increase in their uninsured rate over this period (from 19.1% to 20.0%) although the absolute change was small. There were also small but statistically significant increases in the uninsured rates among White and Black people under age 65, which rose from 7.1% to 7.8% and 10.7% to 11.4%, respectively, between 2016 and 2019. Rates for AIAN, NHPI, and Asian people under age 65 did not have a significant change. These coverage losses likely reflected policy changes made by the first Trump administration after taking office in 2017. These changes included decreased funds for outreach and enrollment assistance, guidance encouraging states to seek waivers to add new eligibility requirements for Medicaid coverage as well as to increase the frequency of eligibility verifications, and changes to public charge immigration policy that made some immigrant families more reluctant to participate in Medicaid and the Children’s Health Insurance Program (CHIP) (which were later reversed by the Biden administration).
Pandemic-era policies drove broad coverage gains and reduced uninsured rates across most racial and ethnic groups between 2019 and 2023. After rising in the years before the pandemic, uninsured rates declined between 2019 and 2023, with 3.6 million more people under age 65 gaining coverage as the uninsured rate fell from 10.9% to 9.5%. Declines occurred across most racial and ethnic groups, with the largest drop among AIAN people (21.7% to 18.7%), alongside smaller but significant declines among Hispanic (20.0% to 17.9%), Black (11.4% to 9.7%), Asian (7.2% to 5.8%), and White people (7.8% to 6.5%), while changes for NHPI people were not statistically significant. These gains were driven largely by increased Medicaid coverage, which offset declines in employer-sponsored insurance, and reflected pandemic-era policies that stabilized and expanded coverage. These policies included the Families First Coronavirus Response Act’s continuous enrollment provision for Medicaid, which required states to pause disenrollments from Medicaid during the COVID pandemic in exchange for increased federal funding to states, enhanced ACA Marketplace subsidies under the American Rescue Plan Act and Inflation Reduction Act, increased outreach and enrollment efforts, and low Marketplace attrition.
After years of decline, the overall uninsured rate among people under age 65 increased in 2024, with significant increases among Hispanic, Black, and White people. The total number of people under age 65 without health coverage increased by more than 1.3 million to 26.7 million in 2024, and the uninsured rate for the population under age 65 increased from 9.5% to 9.8%.Hispanic people experienced the largest increase in uninsured rates between 2023 and 2024 (17.9% to 18.4%), followed by Black (9.7% to 10.1%) and White people (6.5% to 6.8%).Asian, AIAN andNHPI people did not have statistically significant changes in coverage over this period.
Coverage disparities have persisted, and in some cases widened, over time even with recent gains and the large earlier gains in coverage under the ACA. For example, in 2010, the uninsured rate for AIAN people was 2.4 times higher than the uninsured rate for White people; however, in 2024, the gap had increased to 2.9 times higher than the rate for White people. Similarly, the Hispanic uninsured rate grew from 2.5 to 2.8 times higher than the rate for White people from 2010 to 2024, while Black people remained 1.5 times more likely to be uninsured than White people.
Coverage by Race and Ethnicity as of 2024
Hispanic, Black, AIAN, and NHPI people under age 65 were more likely than their White counterparts to be uninsured as of 2024(Figure 2). AIAN and Hispanic people had the highest uninsured rates at 18.9% and 18.4%, respectively, as of 2024. Uninsured rates for NHPI (12.3%) and Black people (10.1%) also were higher than the rate for their White counterparts (6.8%). Asian people had the lowest uninsured rate at 5.7%, although uninsured rates vary among subgroups of the Asian population. The higher uninsured rates among some groups are driven by lower rates of private coverage. Medicaid coverage helps to narrow these differences but does not fully offset them.
Medicaid and CHIP coverage help fill gaps in private coverage and reduce coverage disparities for children, but some disparities in children’s coverage remain (Figure 2). Medicaid and CHIP cover larger shares of children than adults, reflecting more expansive eligibility levels for children. This coverage helps fill gaps in private coverage, with over half of Hispanic, Black, AIAN, and NHPI children covered by Medicaid and CHIP. However, there remain some disparities in children’s coverage. For example, AIAN children are about three times as likely as their White counterparts to lack coverage (13.6% vs. 4.4%). Moreover, Hispanic children are more than twice as likely as White children to be uninsured (9.8% vs. 4.4%).
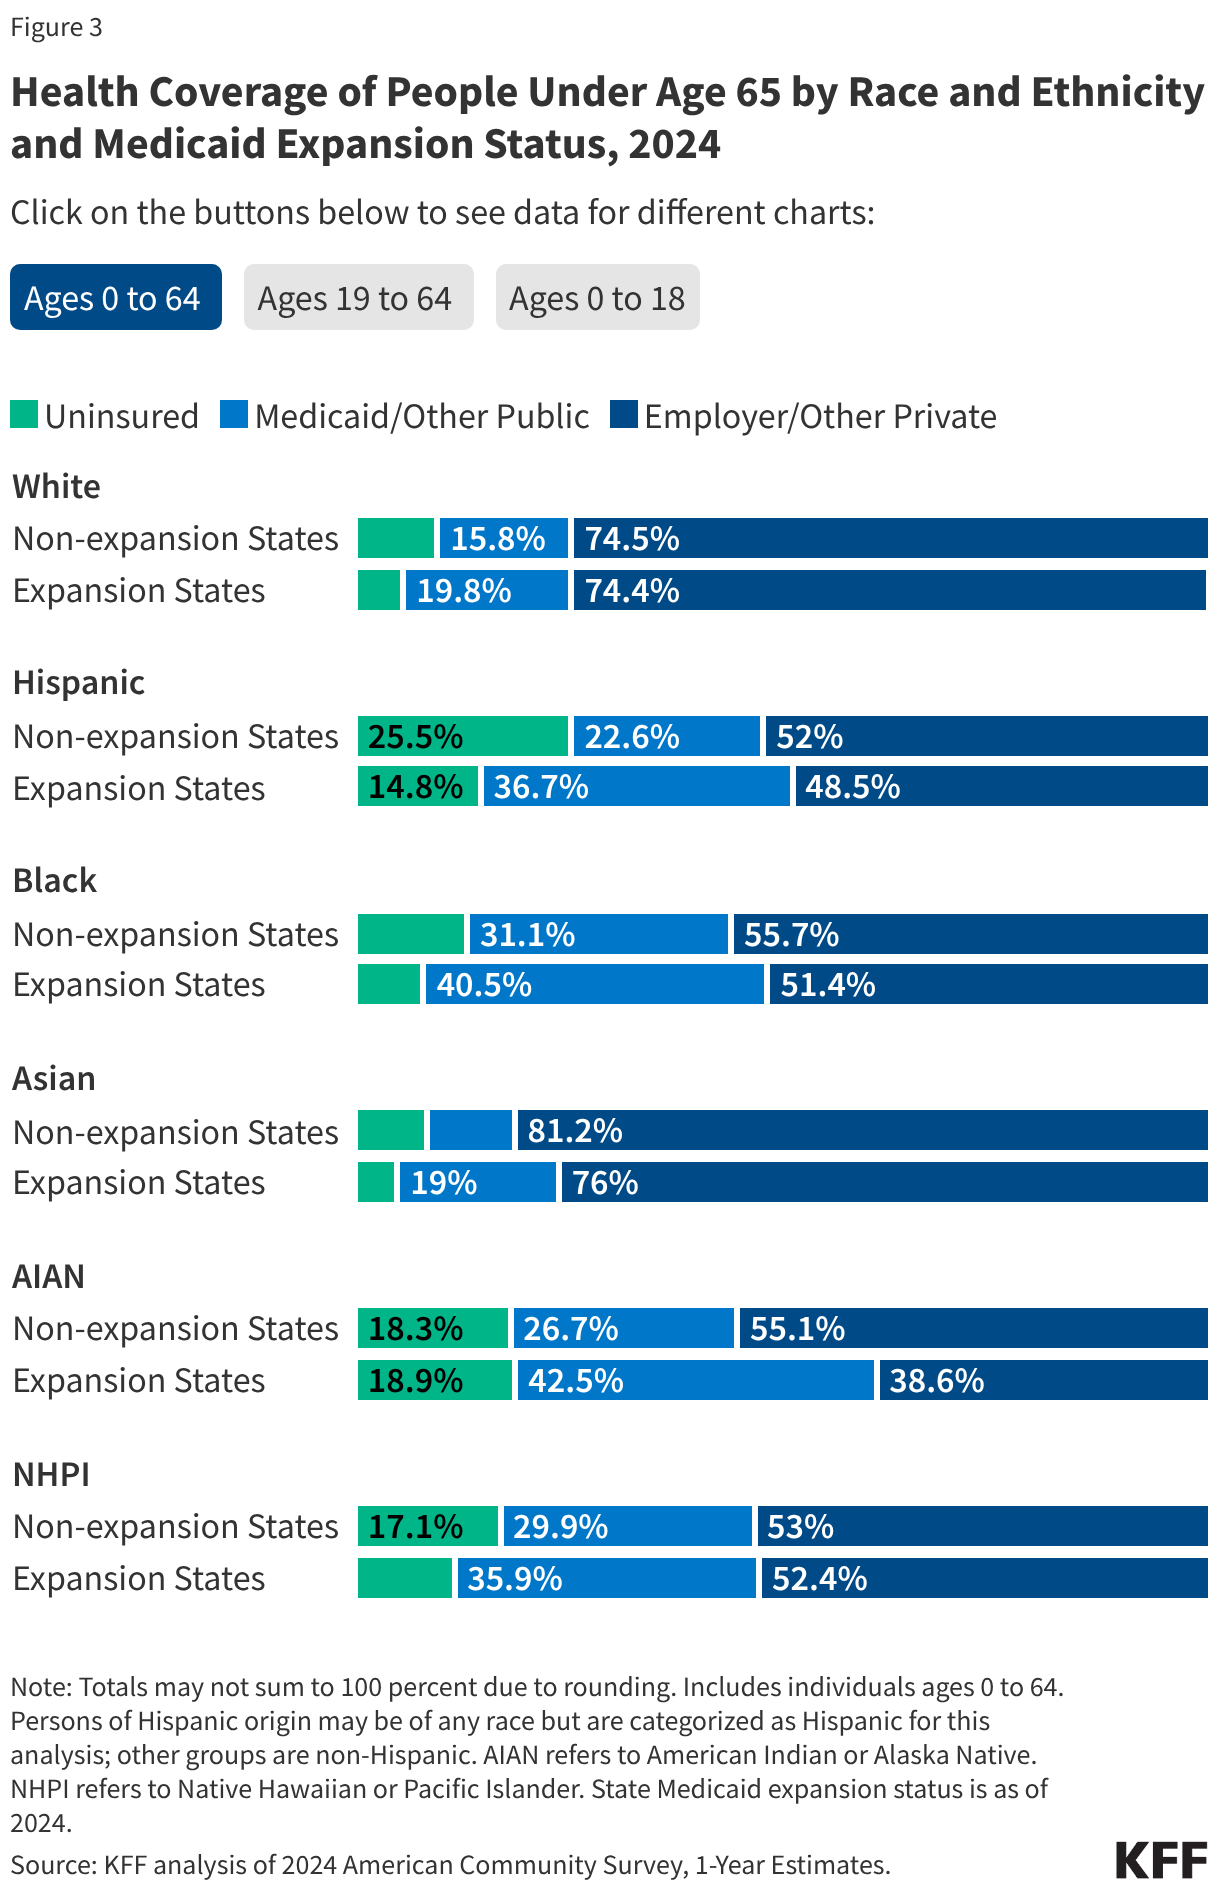
Among people under age 65, uninsured rates in states that have not expanded Medicaid are higher than rates in expansion states across most racial and ethnic groups as of 2024 (Figure 3). While uninsured rates for children are lower than for adults across groups, these differences between expansion and non-expansion states persist among children. For example, 16.0% of Hispanic children in non-expansion states are uninsured compared to 6.7% of Hispanic children in expansion states. The differences in coverage rates between Black and Hispanic people compared with White people are larger in non-expansion states compared with expansion states. However, the relative risk of being uninsured for Black, Hispanic, Asian and NHPI people compared with White people is similar in expansion and non-expansion states. For example, Hispanic people under the age of 65 years old are roughly 2.6 times as likely as their White counterparts to lack coverage in both expansion and non-expansion states. Uninsured rates for AIAN people are similar in expansion and non-expansion states.
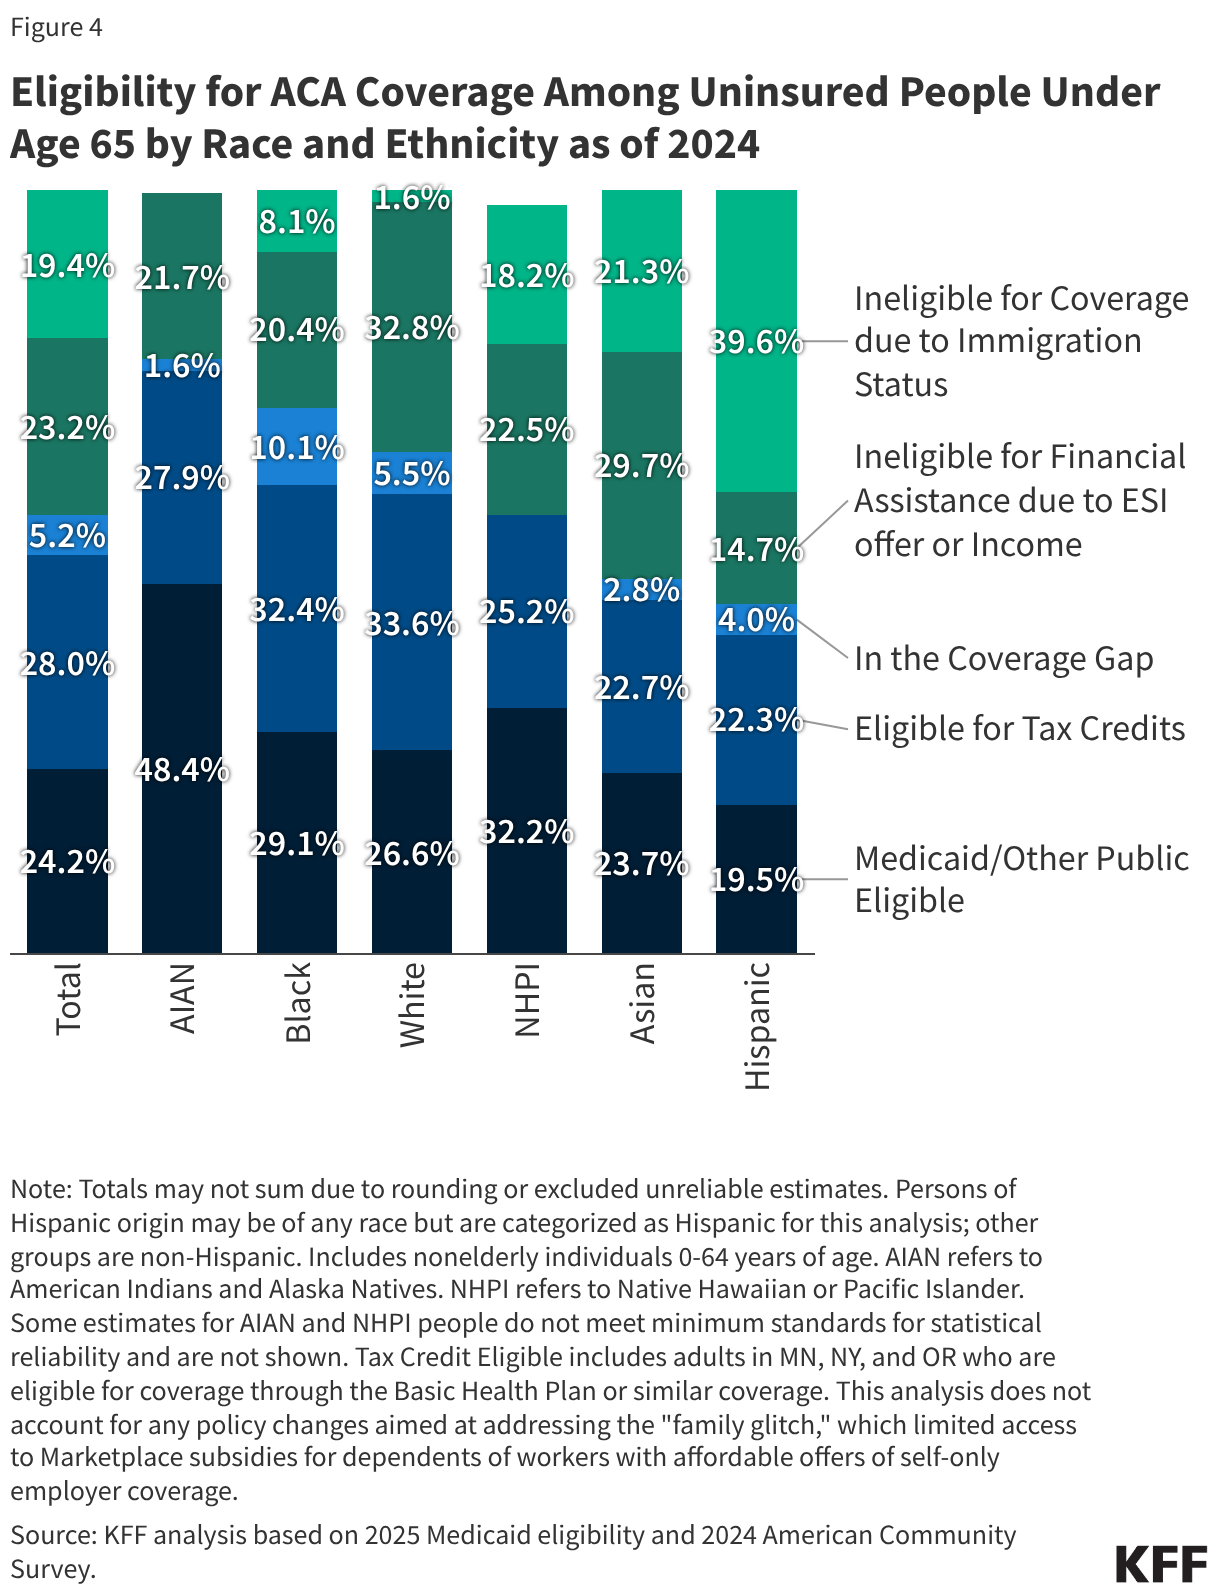
Eligibility for Coverage Among The Uninsured as of 2024
Overall, about half of uninsured people are eligible for Medicaid or Marketplace coverage, but eligibility varies across racial and ethnic groups, with smaller shares of Hispanic and Asian uninsured people eligible for assistance due to these groups having larger shares of ineligible noncitizen immigrants. Overall, over half (52.2%) of people who were uninsured in 2024 were eligible for financial assistance either through Medicaid or through subsidized Marketplace coverage, while the remaining half (47.8%) were not eligible because they fell in the Medicaid coverage gap in states that have not expanded Medicaid, had income too high to qualify for Marketplace premium tax credits, , were eligible for employer coverage, or had an ineligible immigration status. However, the share of the remaining uninsured eligible for assistance varied by race and ethnicity. For example, uninsured Black people under age 65 were more likely than their uninsured White counterparts to fall in the Medicaid coverage gap, reflecting that most of the 10 states that have not expanded Medicaid, are in the South where a higher share of the Black population resides. Uninsured Hispanic and Asian people under age 65 were also less likely than White people to be eligible for coverage options, in part, due to higher shares of noncitizens who face immigrant eligibility restrictions including eligibility restrictions for lawfully present immigrants and ineligibility for undocumented immigrants. (Figure 4).