New Orleans Ten Years After The Storm: The Kaiser Family Foundation Katrina Survey Project
Section 3: Progress In Specific Areas
Most See Progress In Many Areas, With Crime The Glaring Exception
Most New Orleans residents believe that at least some progress has been made on eight of nine key issues facing the city. Most notably, residents seems to recognize the nearly $14 billion dollars spent to repair the city’s storm protection infrastructure after Katrina, as over eight in ten (82 percent) say at least “some” progress has been made in repairing the levees, pumps and floodwalls, including 50 percent who say there has been “a lot” of progress. More than seven in ten say progress has been made in attracting more businesses and jobs to New Orleans (75 percent), making medical facilities and services more available (72 percent), and making public transportation more available (71 percent), and at least half perceive progress in strengthening the public school system (59 percent), dealing with destroyed or abandoned buildings (53 percent), and making affordable housing more available (50 percent). By contrast, just about a third (35 percent) say at least some progress has been made in controlling crime and assuring public safety, while two-thirds (64 percent) say there has been little to no progress in this area.
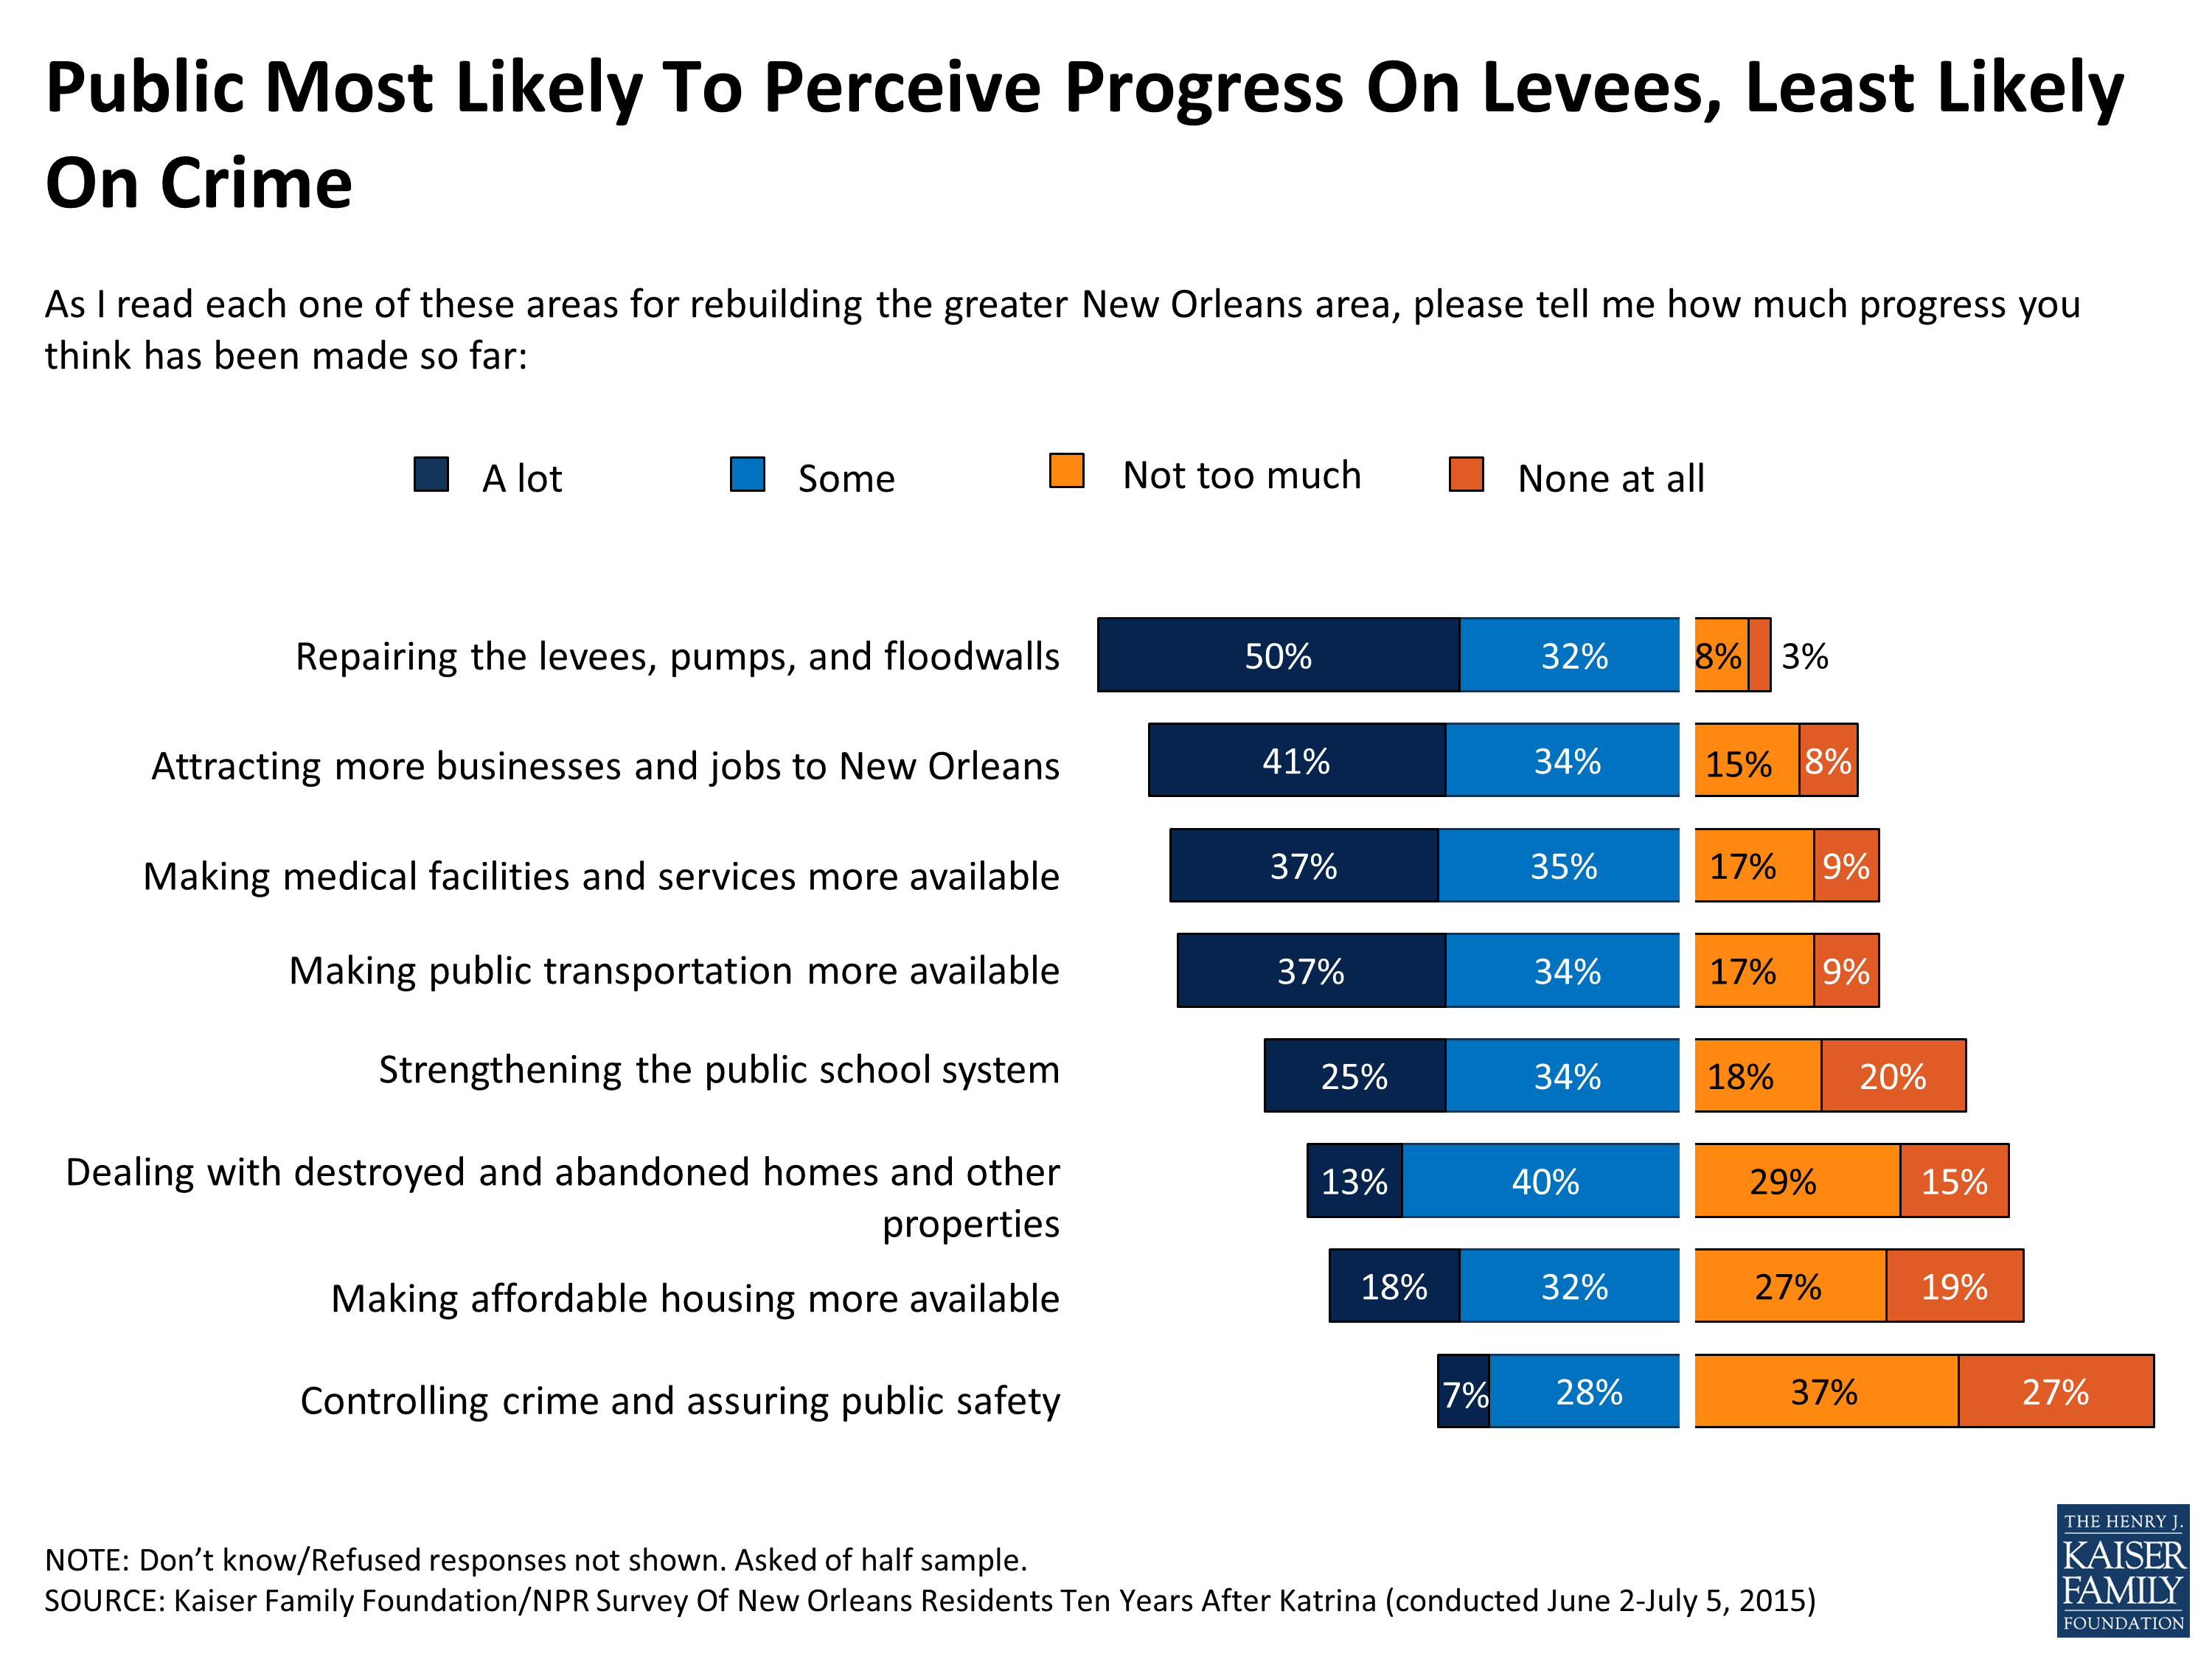
Figure 10
All in all, this progress report highlights increasingly positive public attitudes over the past five years on many of these key issues. When it comes to strengthening flood protection infrastructure, attracting jobs and business, and making medical facilities and public transportation more available, larger shares of residents now believe progress has been made than said the same in 2010. By contrast, when it comes to public schools, affordable housing, and crime, public perceptions of progress appear to be stagnant, with similar shares saying progress has been made today as said so 5 years ago.
Further, a large majority of residents (84 percent) continue to see political corruption as a serious problem, similar to the share who held this view in 2010 (86 percent).
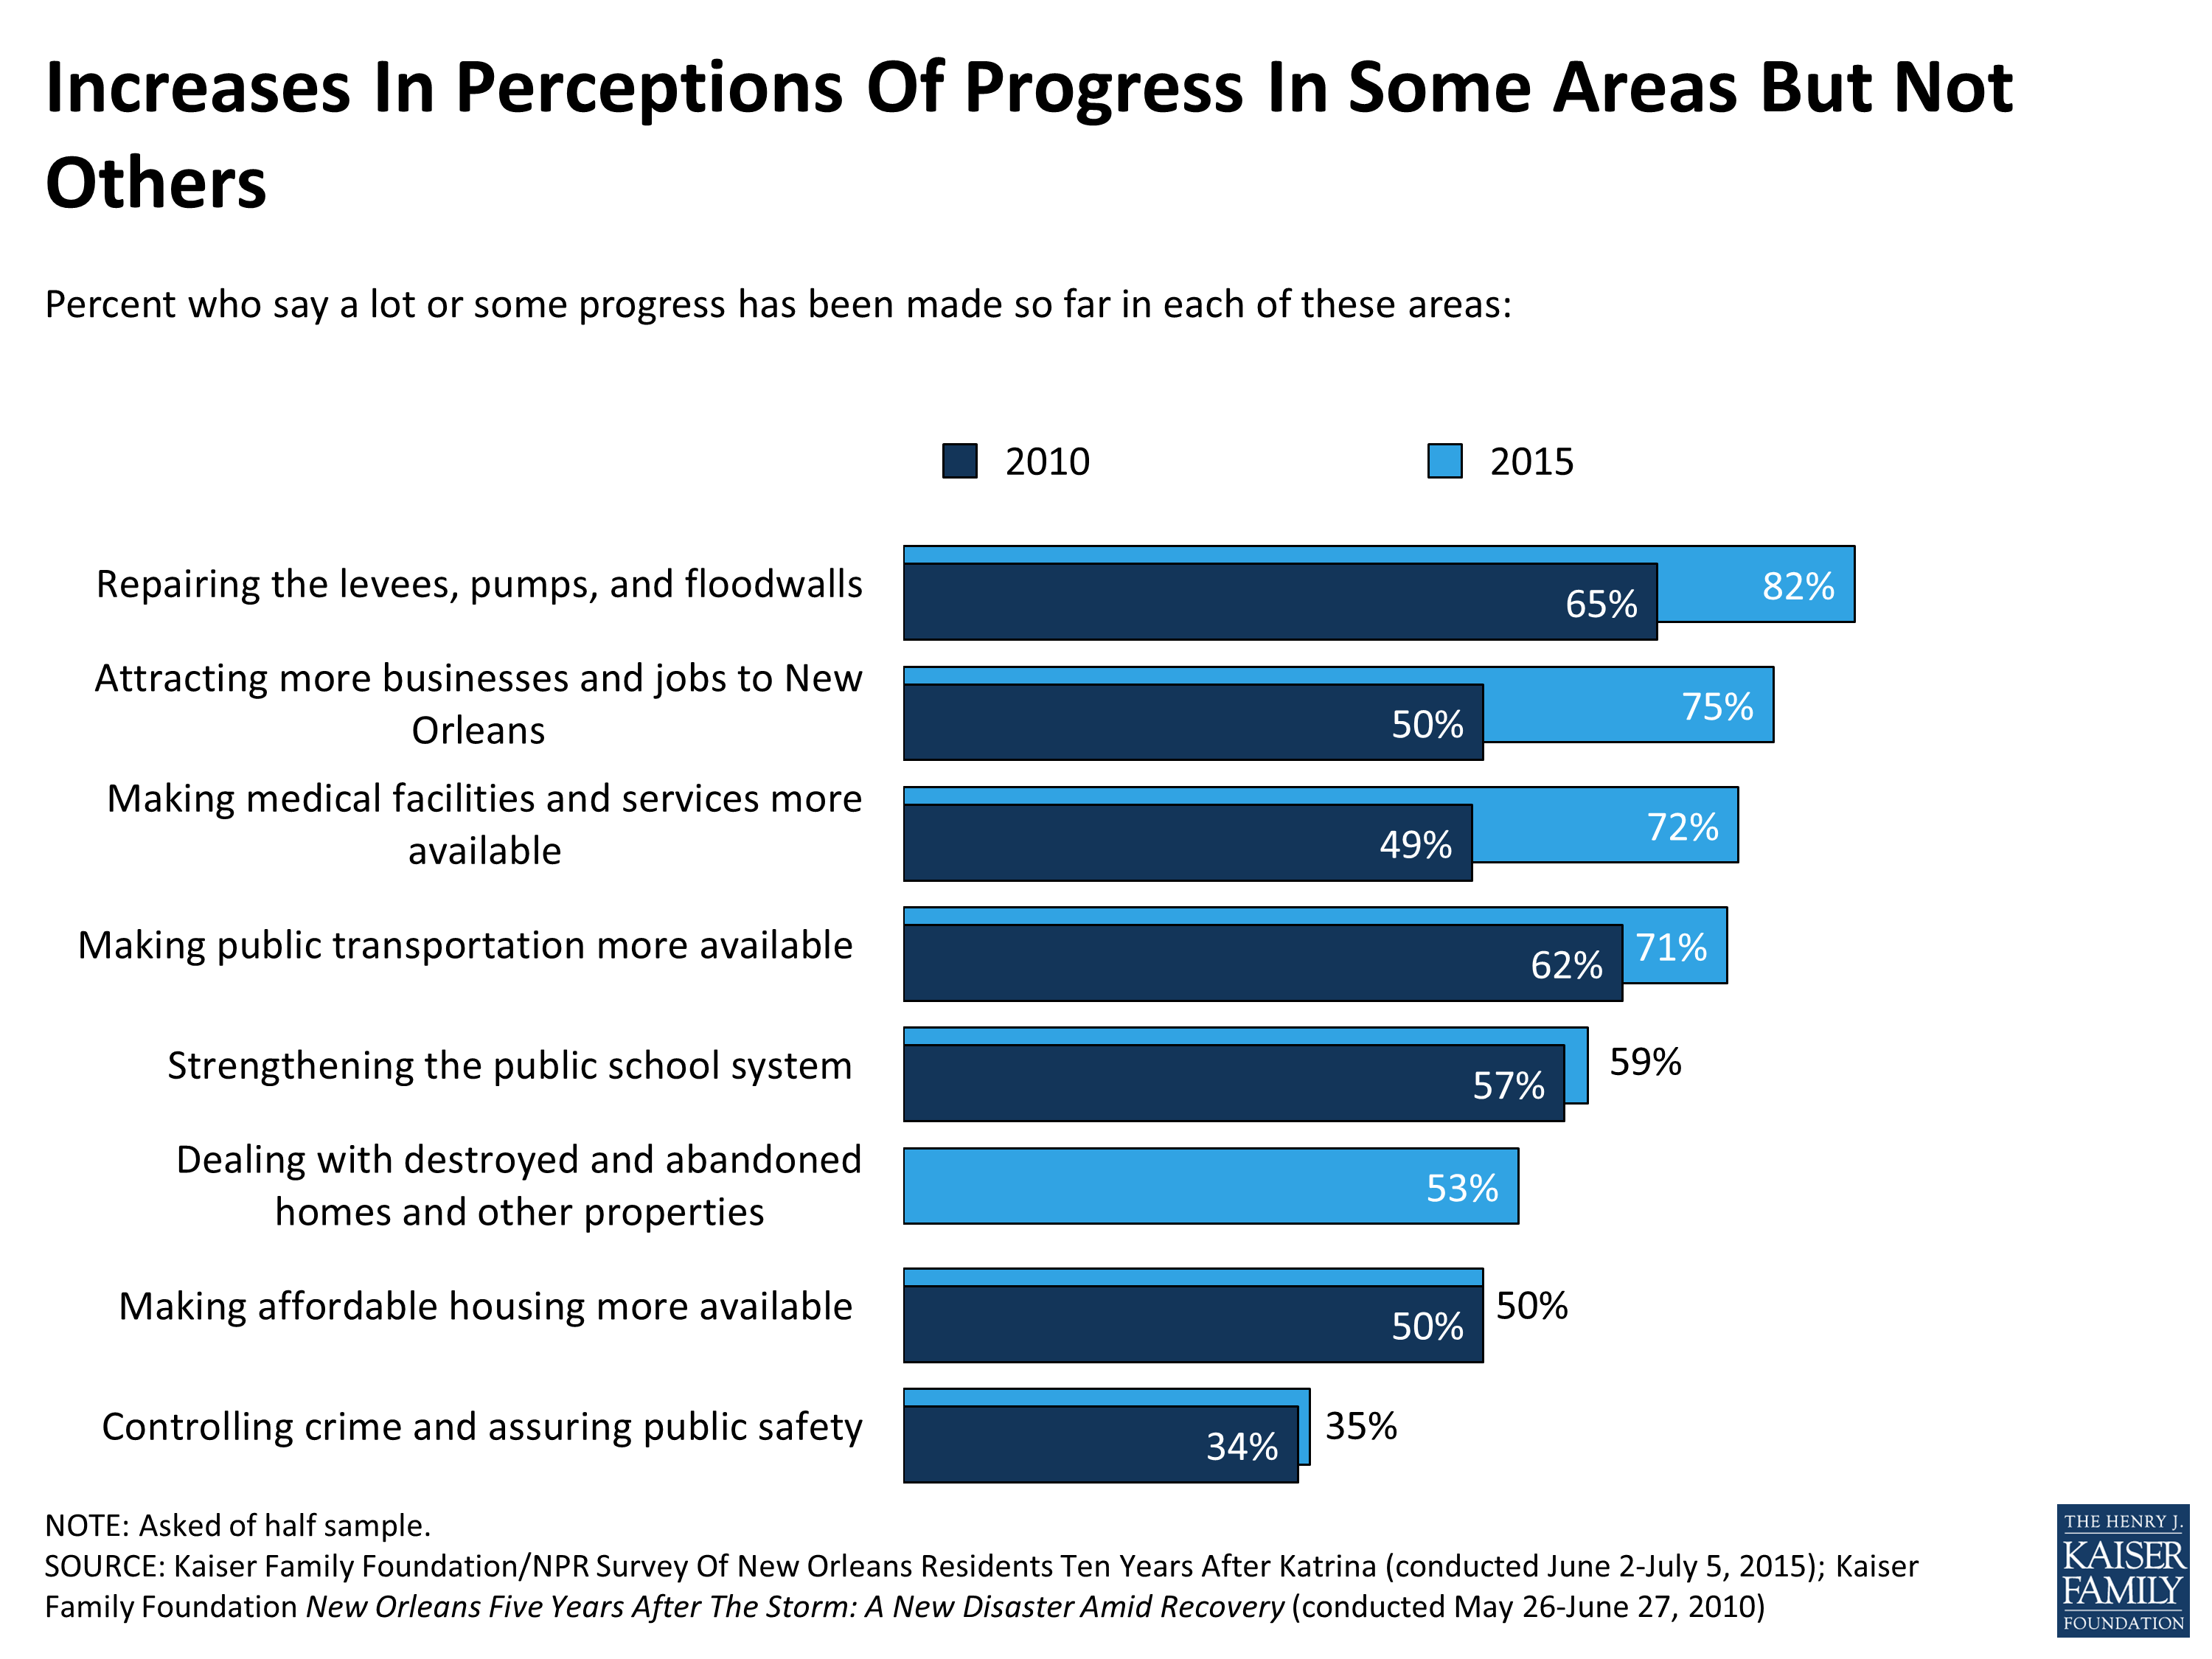
Figure 11
For the most part, whites are more likely than African Americans to say progress has been made in specific areas, most notably attracting jobs (90 percent versus 65 percent), strengthening public schools (66 percent versus 55 percent), making affordable housing available (56 percent versus 44 percent), and dealing with abandoned properties (66 percent versus 45 percent). This last point may be related to the fact that African Americans are more likely than whites to say their own neighborhood has a major problem with abandoned and destroyed buildings (35 percent versus 10 percent).
One of the few exceptions where the survey finds African Americans more likely than whites to express positive views is on public transportation. Over three-quarters (77 percent) of African Americans believe the city has made progress in this area compared to 63 percent of whites. African Americans may be in a better position to judge the city’s progress in this area, as they are about twice as likely as whites to say they rely on public transportation (34 percent versus 16 percent).
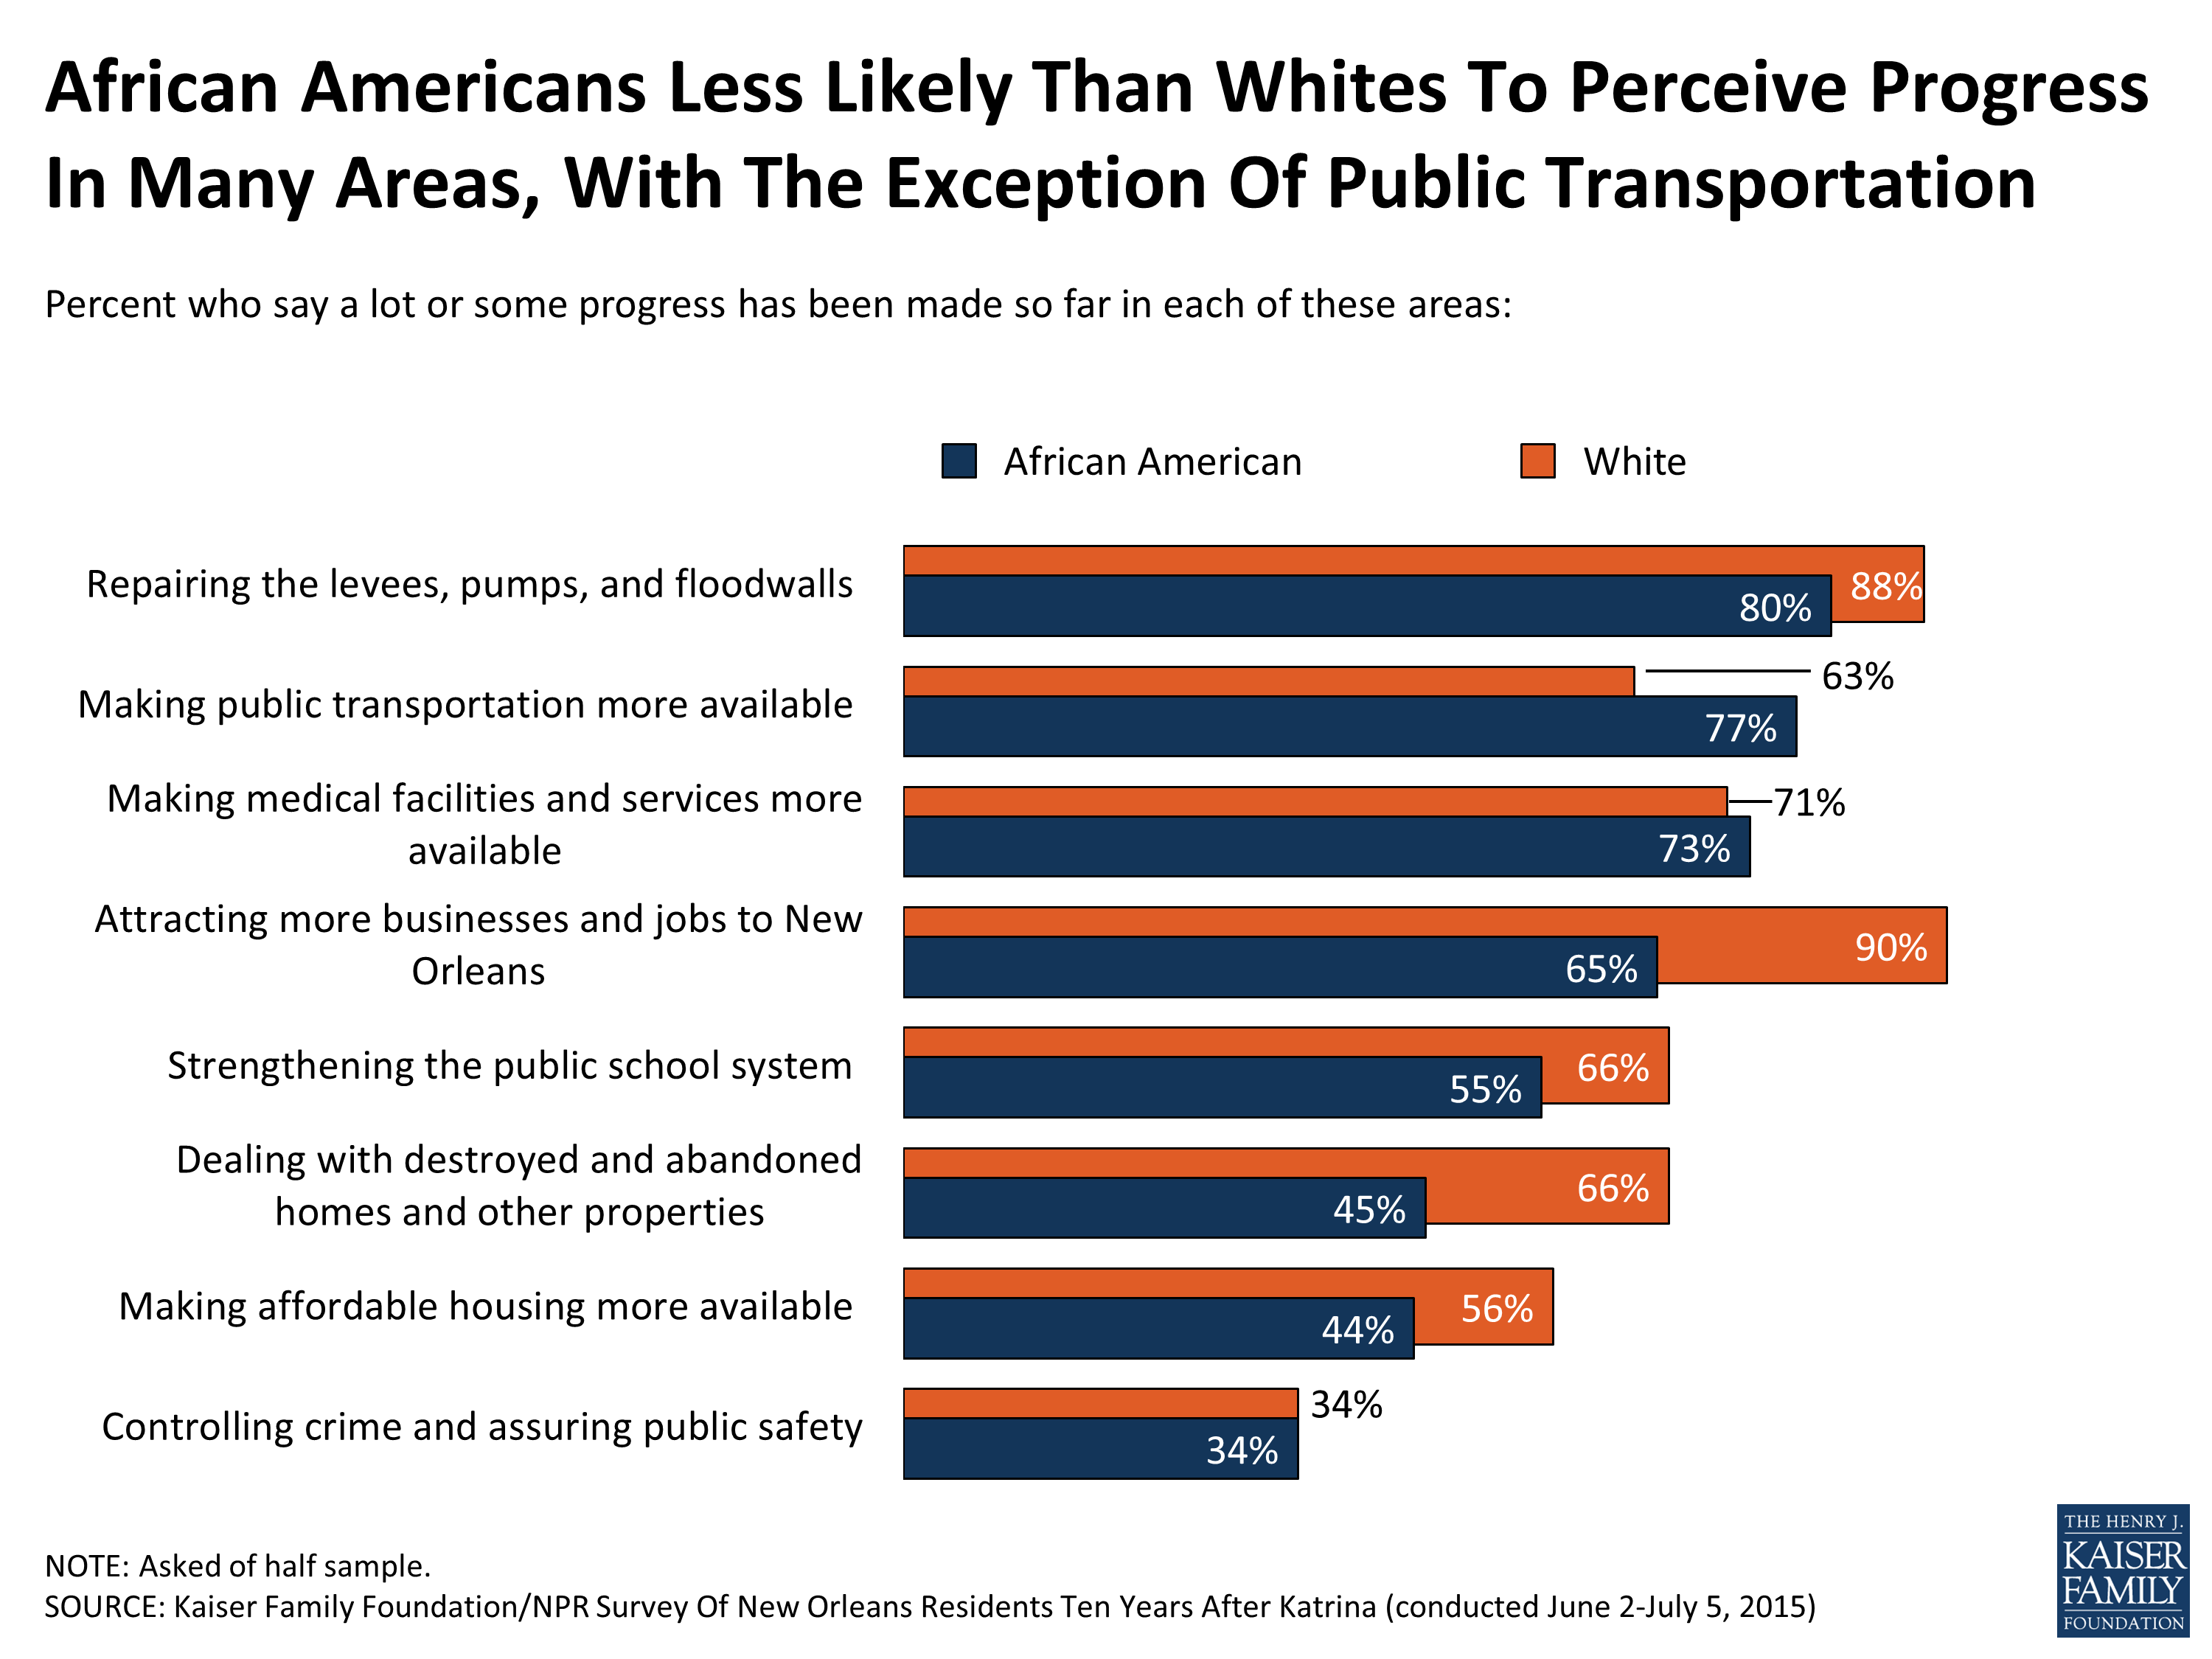
Figure 12
Reflecting the fact that crime is the area where residents are least likely to perceive progress, it is also at the top of the list of residents’ priorities for the city going forward. Four in ten (41 percent) say controlling crime and assuring public safety should be “one of the top priorities” for New Orleans today, followed by strengthening the public school system (37 percent). Though the vast majority believe progress has been made in repairing the levees, pumps, and floodwalls, one-third (33 percent) say this should continue to be a top priority, ranking third on the list. About a quarter each would place a top priority on medical facilities (28 percent), affordable housing (27 percent), dealing with abandoned properties (24 percent) and attracting more jobs to the area (24 percent), while fewer (16 percent) prioritize improvements to public transportation.
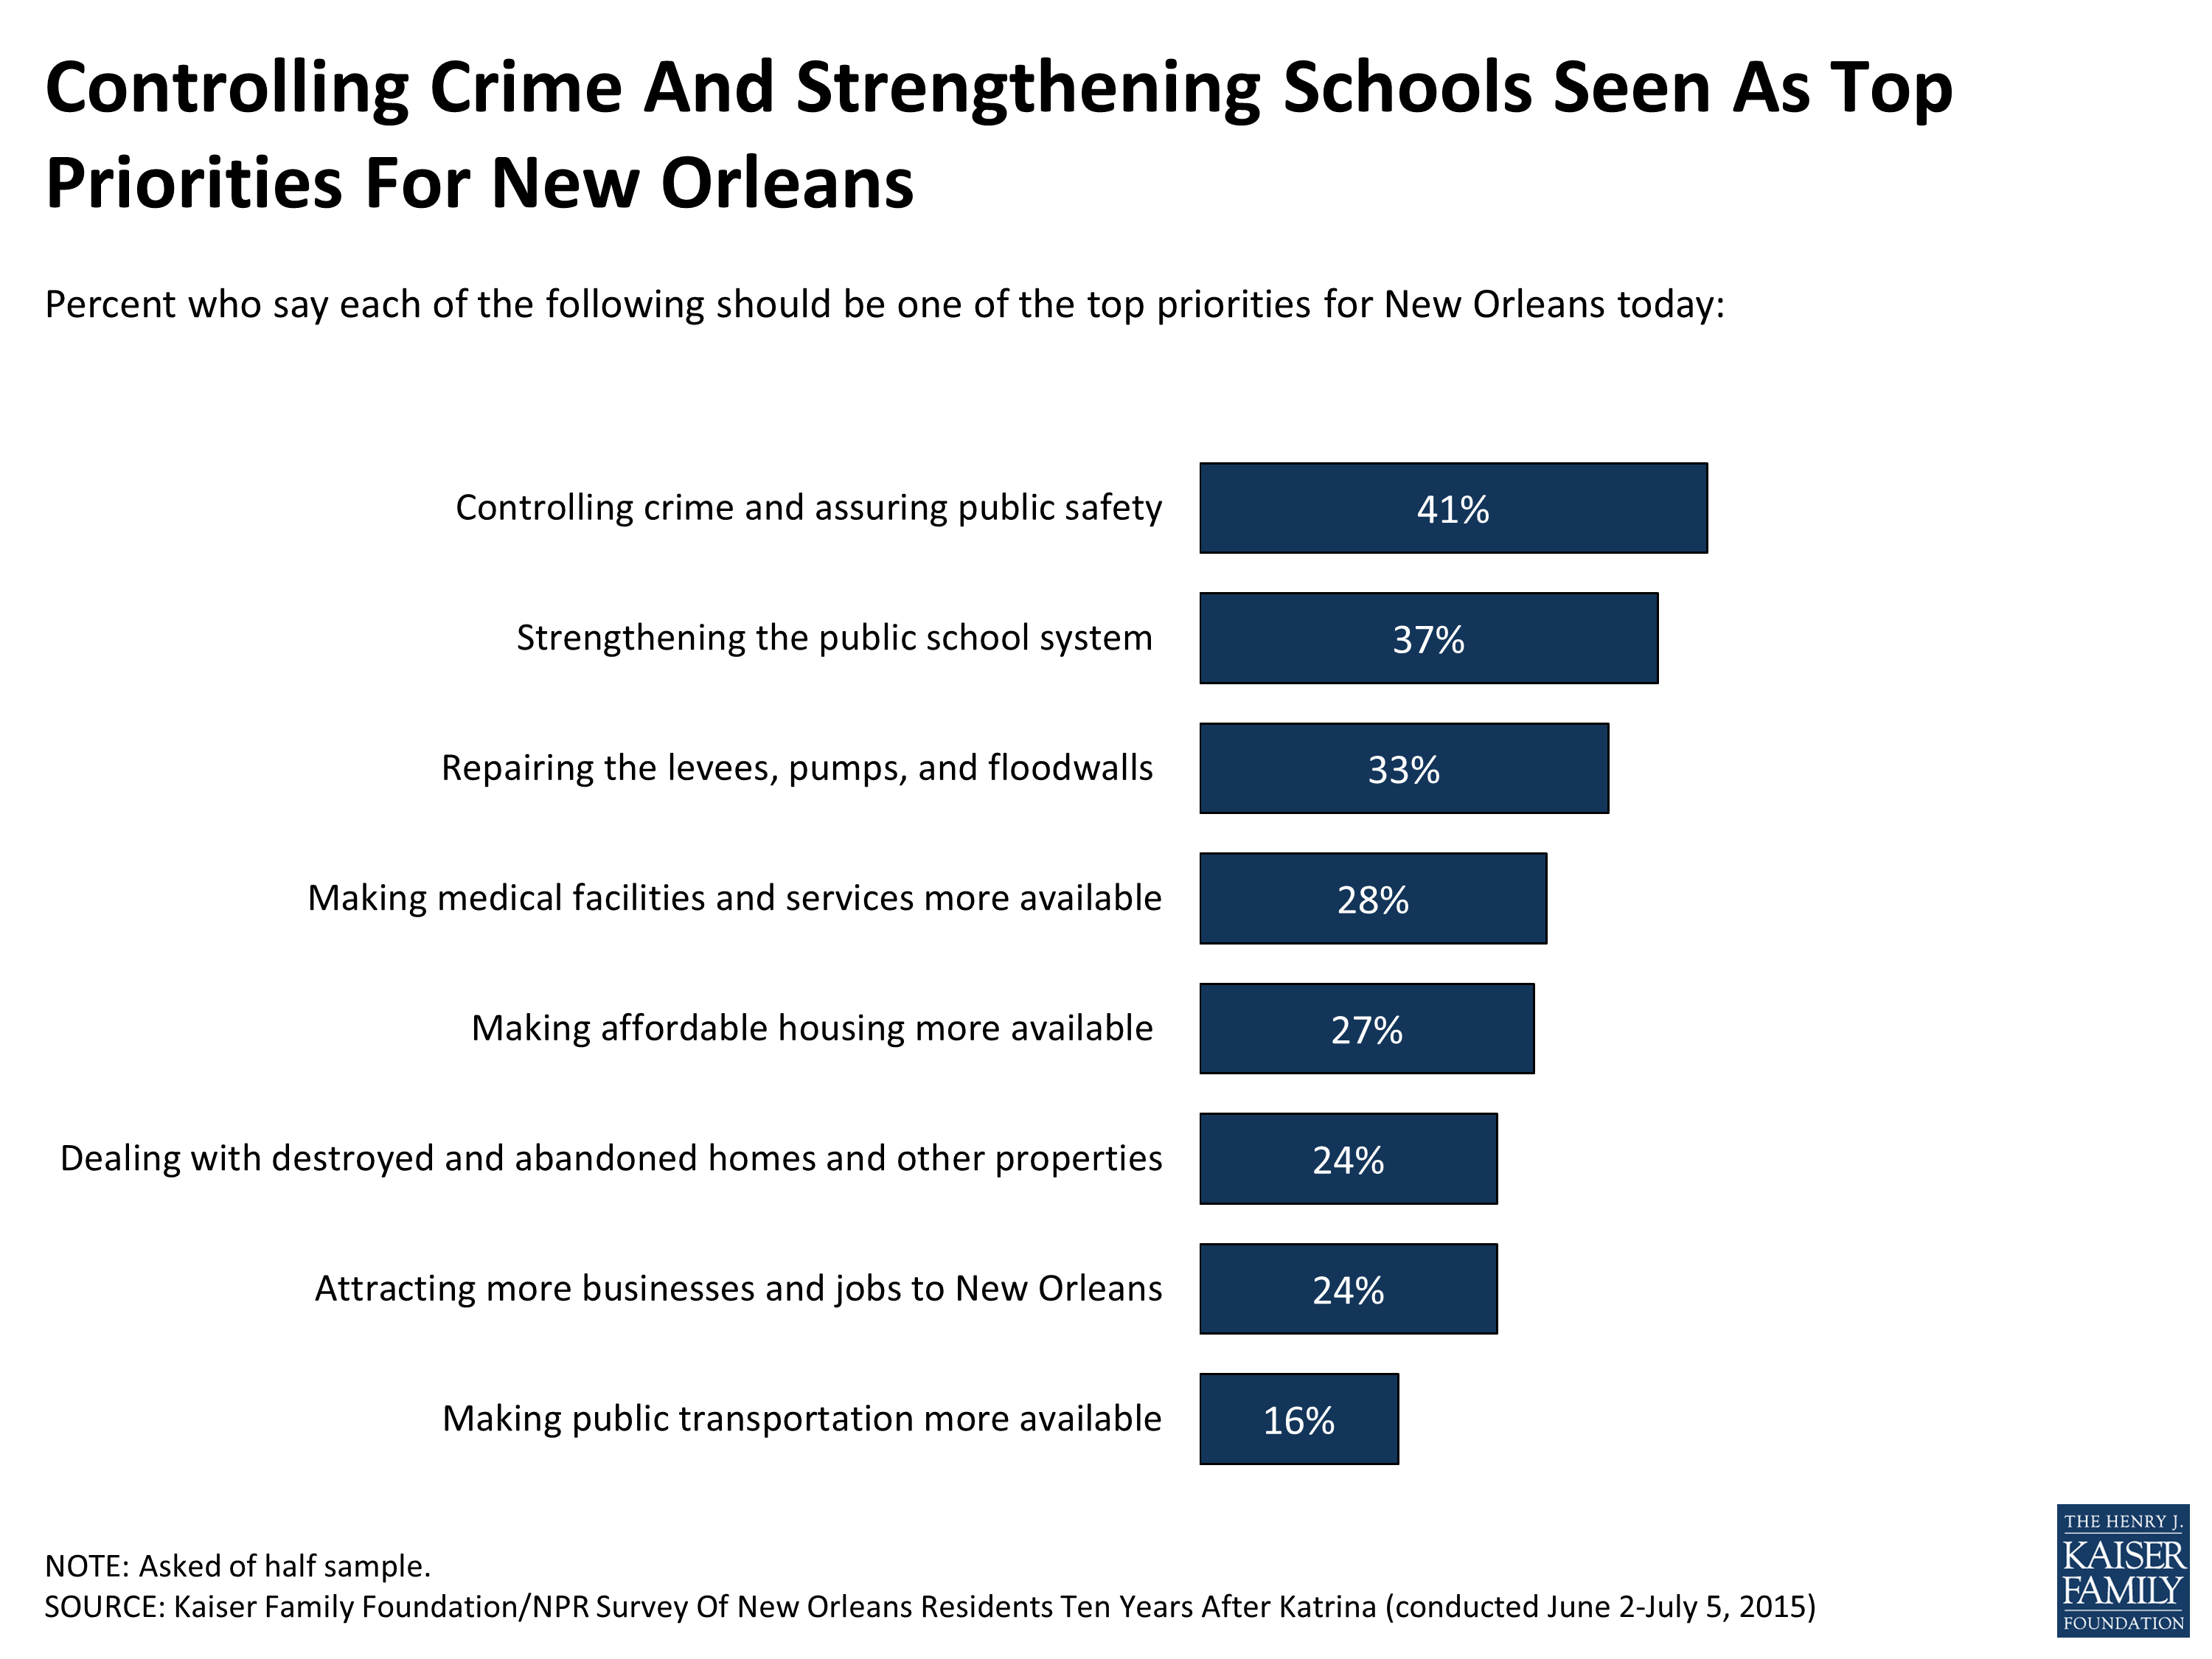
Figure 13
Amenities In Their Own Neighborhoods
Consistent with other survey findings, New Orleanians’ reports of amenities in their own neighborhoods have improved significantly over the past several years, though large racial disparities remain. Compared with 2008 and 2010, more residents overall now say their neighborhood has enough places to buy fresh groceries (68 percent, up from 50 percent in 2008), sufficient public transportation (67 percent, up from 43 percent), and enough restaurants (65 percent, up from 56 percent). While fewer than half (46 percent) now say their neighborhood has enough places for children to play outside, this is also a significant increase from prior years.
While reports of neighborhood services have improved since 2008 across racial groups, African Americans remain less likely than whites to say their neighborhood has sufficient places to buy groceries (63 percent, compared to 78 percent of whites), restaurants (55 percent versus 83 percent), and places for children to play outside (36 percent versus 63 percent). Once again, public transportation is the exception to this pattern. About two-thirds of both African Americans (67 percent) and whites (68 percent) say their neighborhood has enough public transportation.
| Table 4: Increasingly Positive Ratings Of Neighborhood Services, But Racial Gaps Remain | |||||||||
| TOTAL | African American | White | |||||||
| Percent who say their neighborhood has enough… | 2015 | 2010 | 2008 | 2015 | 2010 | 2008 | 2015 | 2010 | 2008 |
| …places where you can buy groceries including fresh produce | 68% | 54% | 50% | 63% | 44% | 43% | 78% | 73% | 59% |
| …public transportation* | 67 | 59 | 43 | 67 | 56 | 36 | 68 | 66 | 56 |
| …restaurants | 65 | 57 | 56 | 55 | 45 | 39 | 83 | 77 | 81 |
| …places where children can play outside | 46 | 38 | 32 | 36 | 28 | 22 | 63 | 55 | 45 |
| *2010 and 2008 wording was “bus service” | |||||||||
Crime And Police Presence
As noted above, New Orleanians rank controlling crime and assuring public safety as the top priority for the city and as the area where the least progress has been made. They also overwhelmingly see crime as the city’s biggest problem; nearly six in ten residents (58 percent) name crime in an open-ended question about the biggest problem facing New Orleans, a response that has topped the list since this question was first asked in 2008. While rates of violent and property crime in New Orleans have declined in recent years, they remain significantly higher than the national average.1 Louisiana continues to have the highest incarceration rate in the country2, and the city’s criminal justice system has been the subject of much public scrutiny over the past 10 years.3
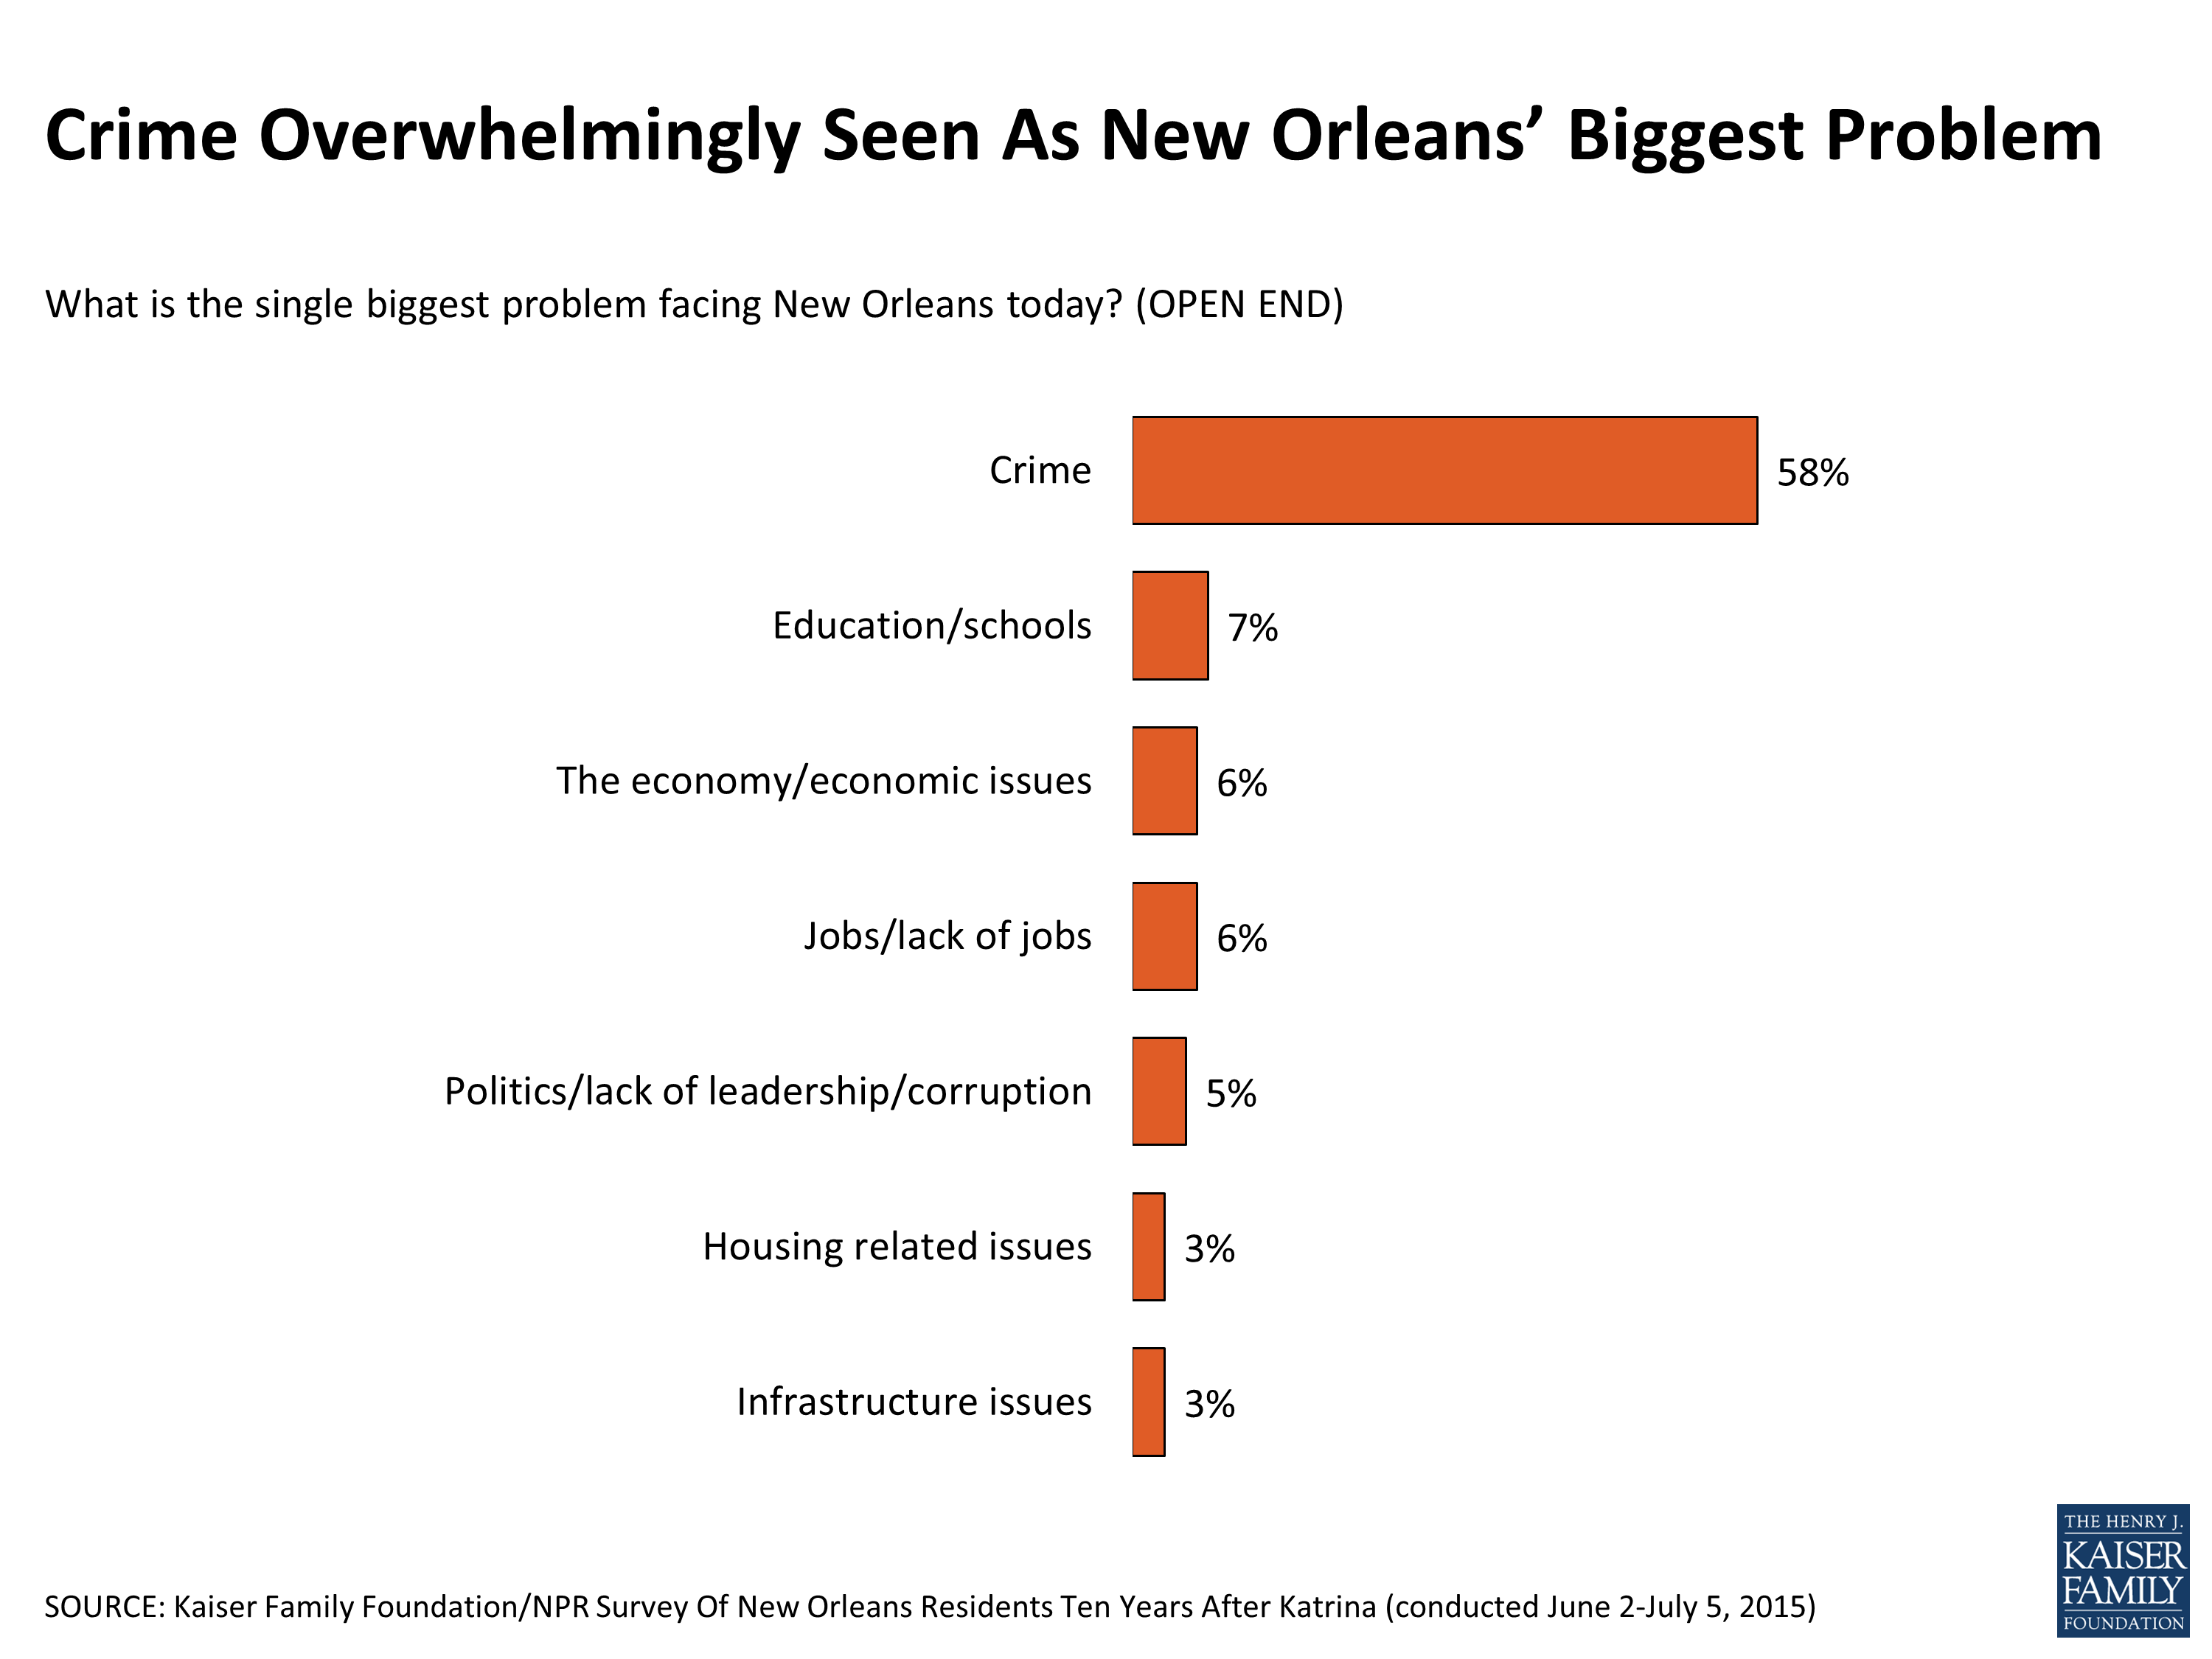
Figure 14
The survey finds that residents’ personal worries about crime have increased somewhat over the past five years, returning closer to 2008 levels. About three in ten (29 percent) now say they are “very” worried they will be the victim of a violent crime, up from 23 percent in 2010. Furthermore, while most residents say they feel at least somewhat safe from crime in their neighborhood, the share who say they feel “not too safe” or “not safe at all” has increased since 2010 (from 23 percent to 30 percent). In contrast with reported improvements in other neighborhood services, there has been a decline since 2010 in the share who say their neighborhood has enough police presence (44 percent, down from 58 percent).
| Table 5: Measures Of Personal Safety Declined Since 2010 | |||
| 2015 | 2010 | 2008 | |
| How worried are you, if at all, that you will be the victim of a violent crime? | |||
| Very worried | 29% | 23% | 31% |
| Somewhat worried | 33 | 31 | 35 |
| Not too worried | 23 | 29 | 22 |
| Not at all worried | 15 | 18 | 12 |
| These days, how safe from crime do you feel in your neighborhood? | |||
| Very safe | 18 | 22 | 17 |
| Somewhat safe | 52 | 54 | 54 |
| Not too safe | 19 | 13 | 19 |
| Not safe at all | 11 | 10 | 10 |
| Would you say your neighborhood does or does not have enough police presence? | |||
| Does have enough | 44 | 58 | 52 |
| Does NOT have enough | 54 | 41 | 47 |
| Note: Don’t know/Refused responses not shown. | |||
Racial disparities exist on all these measures, with African Americans more likely than whites to say that they are very worried about being a victim of violent crime (36 percent versus 17 percent), that they don’t feel safe from crime in their neighborhood (35 percent versus 21 percent) and that their neighborhood does not have enough police presence (59 percent versus 46 percent).
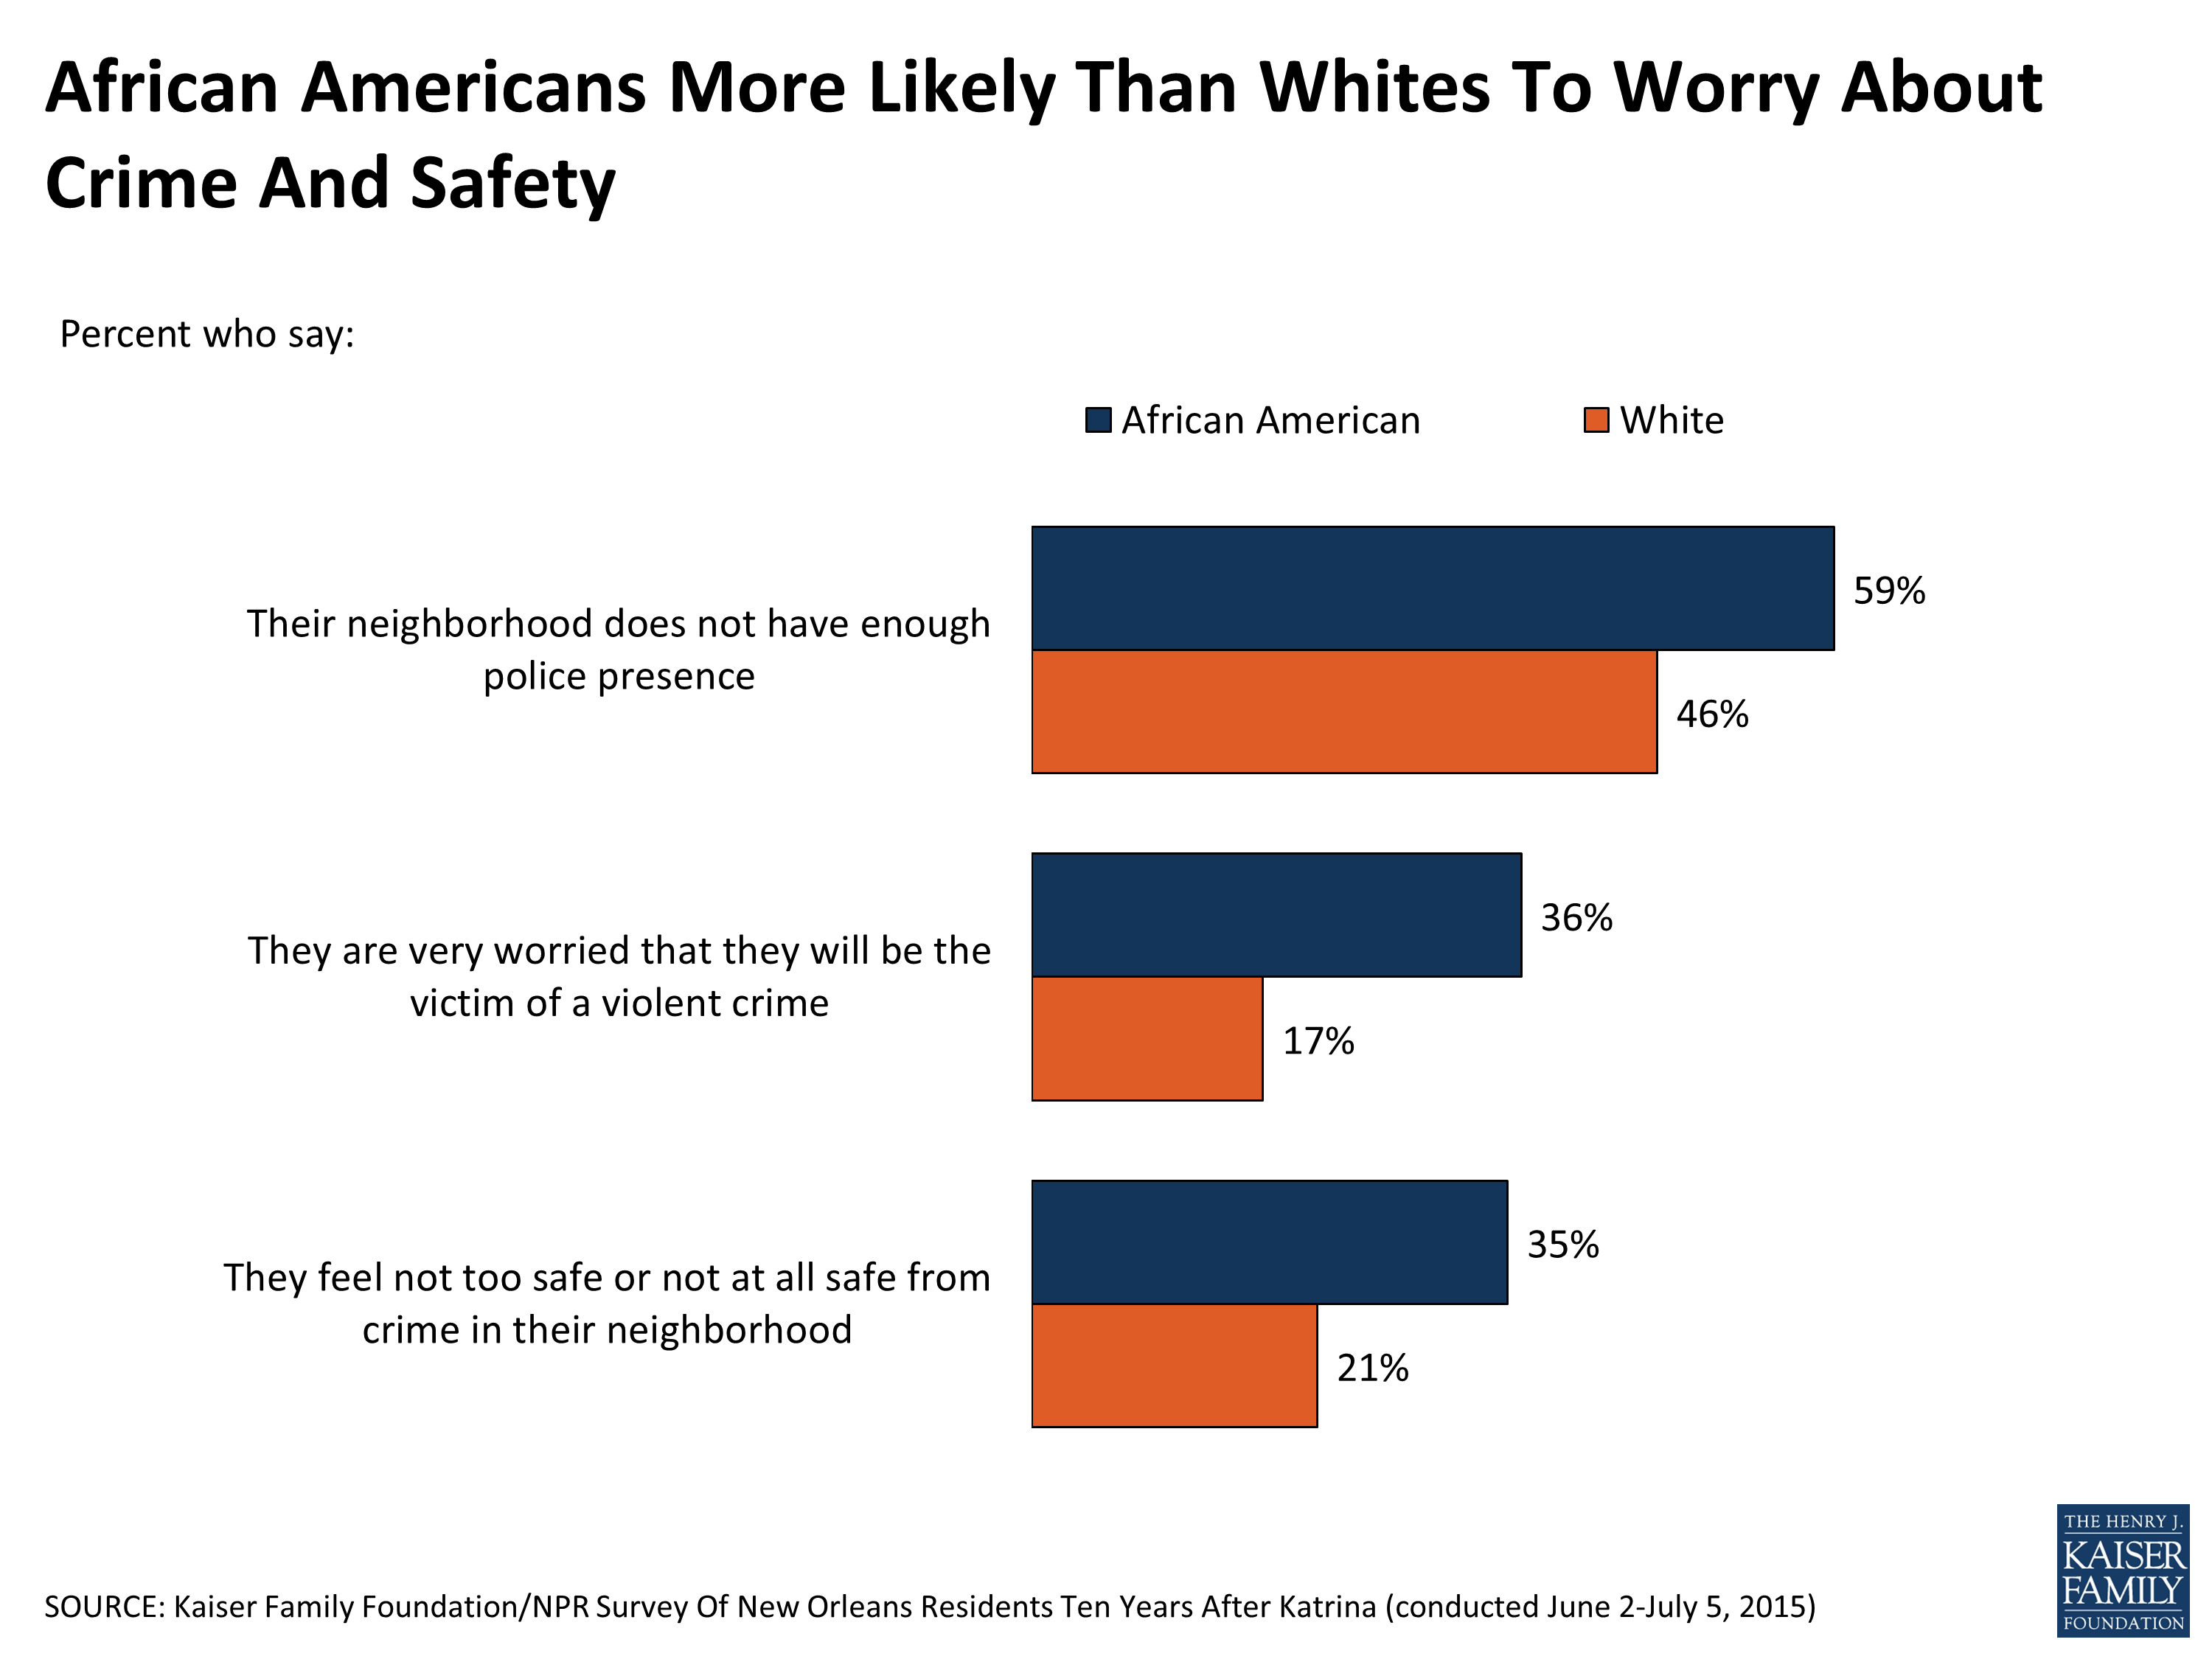
Figure 15
Despite recent efforts to reform New Orleans’ policing and criminal justice system4, the police force continues to suffer from a distinct lack of public trust, particularly among African Americans. While most whites (59 percent) say they trust the police to do what is right for their community “almost always” or “most of the time,” a majority (58 percent) of African Americans say they trust the police “only some of the time” or “almost never.” This racial divide in police trust is not specific to New Orleans and may be part of a broader national trend that has been exacerbated by widespread attention to recent events in cities such as Ferguson, Missouri and Charleston, South Carolina. However, in New Orleans the gap in trust between African Americans and whites does not appear to have widened over the past 5 years, and in fact the share of African Americans who say they mostly trust the police has increased slightly, from 34 percent in 2010 to 42 percent today.
| Table 6: African Americans Less Likely Than Whites To Trust Police, But Racial Gap Has Not Widened Since 2010 | ||||||
| 2015 | 2010 | |||||
| How much of the time do you think you can trust the police to do what is right for you or your community? | Total | African American | White | Total | African American | White |
| Almost always/Most of the time (NET) | 48% | 42% | 59% | 44% | 34% | 59% |
| Almost always | 14 | 10 | 21 | 13 | 9 | 18 |
| Most of the time | 34 | 32 | 38 | 31 | 25 | 41 |
| Only some of the time/Almost never (NET) | 50 | 58 | 38 | 55 | 64 | 40 |
| Only some of the time | 34 | 38 | 28 | 40 | 45 | 31 |
| Almost never | 16 | 20 | 10 | 15 | 19 | 9 |
Public Schools
As noted above, Parish residents rank strengthening the public school system as the second-highest priority for the city, after controlling crime and assuring public safety. While nearly six in ten residents (59 percent) believe that at least some progress has been made in this area, 42 percent of parents with children under age 19 say they are “very” worried that their children won’t be able to get a good education (albeit down somewhat from 51 percent in 2010). This worry is concentrated among African American parents, over half (53 percent) of whom say they are very worried, compared to just 17 percent of white parents.
The public school system in New Orleans today looks nothing like it did prior to Hurricane Katrina. In May 2014, the Recovery School District, a state control board that had been overseeing most of the city’s public schools since 2005, shut down the last of its five traditional public schools, making New Orleans the first school district in the nation to be made up entirely of charter schools.5 The survey finds a majority (60 percent) of parents believe the increase in charter schools is a good thing for New Orleans, while a quarter (24 percent) say it hasn’t made much difference and 12 percent say it is a bad thing. Statistics show the student body of public schools, including charters, is 85 percent African American.6 Thus, it is notable that African American parents are somewhat more ambivalent about the increase in charter schools; though a slim majority (53 percent) of this group views the trend as a good thing, 14 percent see it is a bad thing and 30 percent say it hasn’t made much difference.
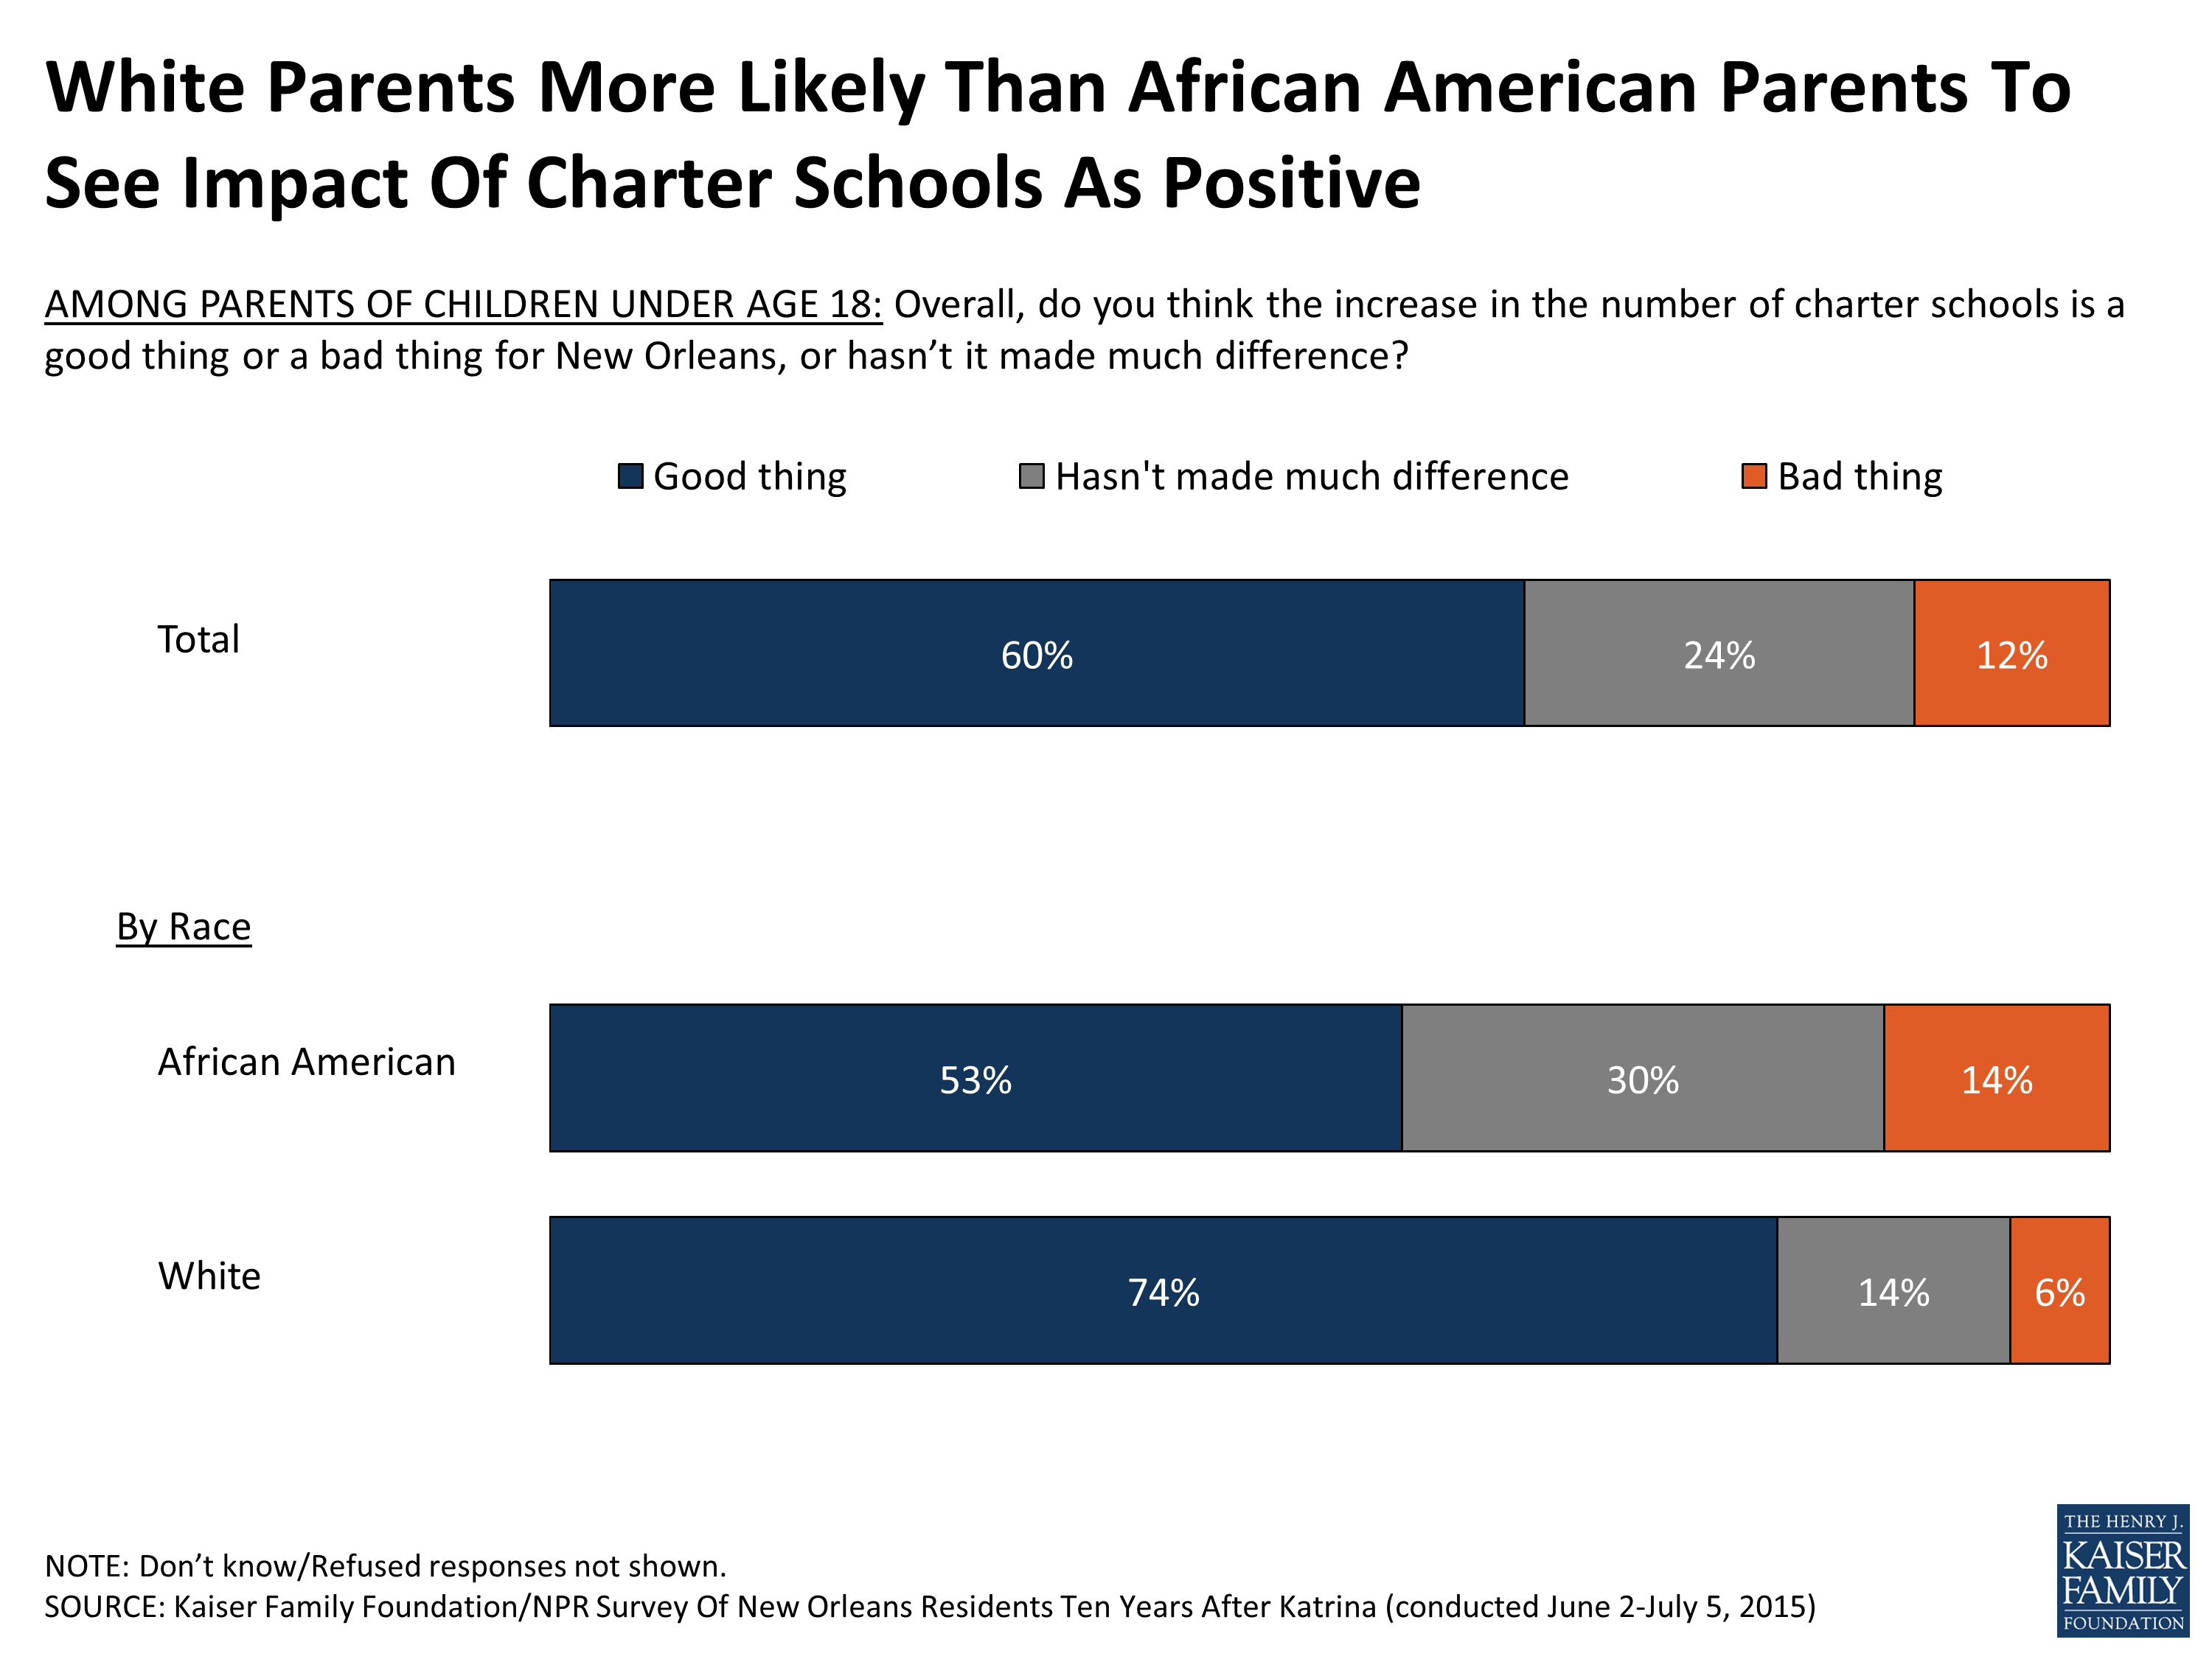
Figure 16
Health Care
When Charity Hospital closed its doors due to Hurricane Katrina, many of the city’s poor and uninsured were left without a place to go for care. In the intervening 10 years, dozens of new community clinics have opened, providing residents with more opportunities to access health care outside the hospital setting. In August 2015, a new hospital – University Medical Center New Orleans – opened, aiming to replace Charity as the city’s main trauma and safety-net hospital while also providing high-end specialty care to privately insured patients.7
Many survey trends reflect an improvement in residents’ perceptions of access to health care in the city. Nearly four in ten (37 percent) now say there has been “a lot” of progress in making medical facilities and services more available, up from just 14 percent five years ago. Further, a large majority (88 percent) says their own health needs are being met at least “somewhat” well, and the share saying they are being met “very well” is up 19 percentage points since 2006.
| Table 7: Increasingly Positive Ratings Of Progress On Medical Facilities | |||
| 2015 | 2010 | 2008 | |
| Please tell me how much progress you think has been made so far in making medical facilities and services more available? | |||
| A lot | 37 | 14 | 5 |
| Some | 35 | 35 | 33 |
| Not too much | 17 | 32 | 40 |
| None at all | 9 | 17 | 19 |
| NOTE: Don’t know/ Refused responses not shown. | |||
| Table 8: Majority Say Health Needs Are Being Met Very Well | ||||
| 2015 | 2010 | 2008 | 2006 | |
| Overall, how well would you say your health needs are being met today? | ||||
| Very well | 55 | 55 | 42 | 36 |
| Somewhat well | 33 | 29 | 44 | 53 |
| Not too well | 7 | 10 | 10 | 9 |
| Not at all well | 4 | 5 | 4 | 2 |
| NOTE: Don’t know/ Refused responses not shown. | ||||
Worries about access to care have also dissipated: just over half (54 percent) of residents now say they are “very” or “somewhat” worried that health care services might not be available if they need them, down from 85 percent in 2006. And while nearly two-thirds (64 percent) say there are not enough health care services available for uninsured and low-income people in the city, this is down from a near-unanimous 93 percent in 2006.
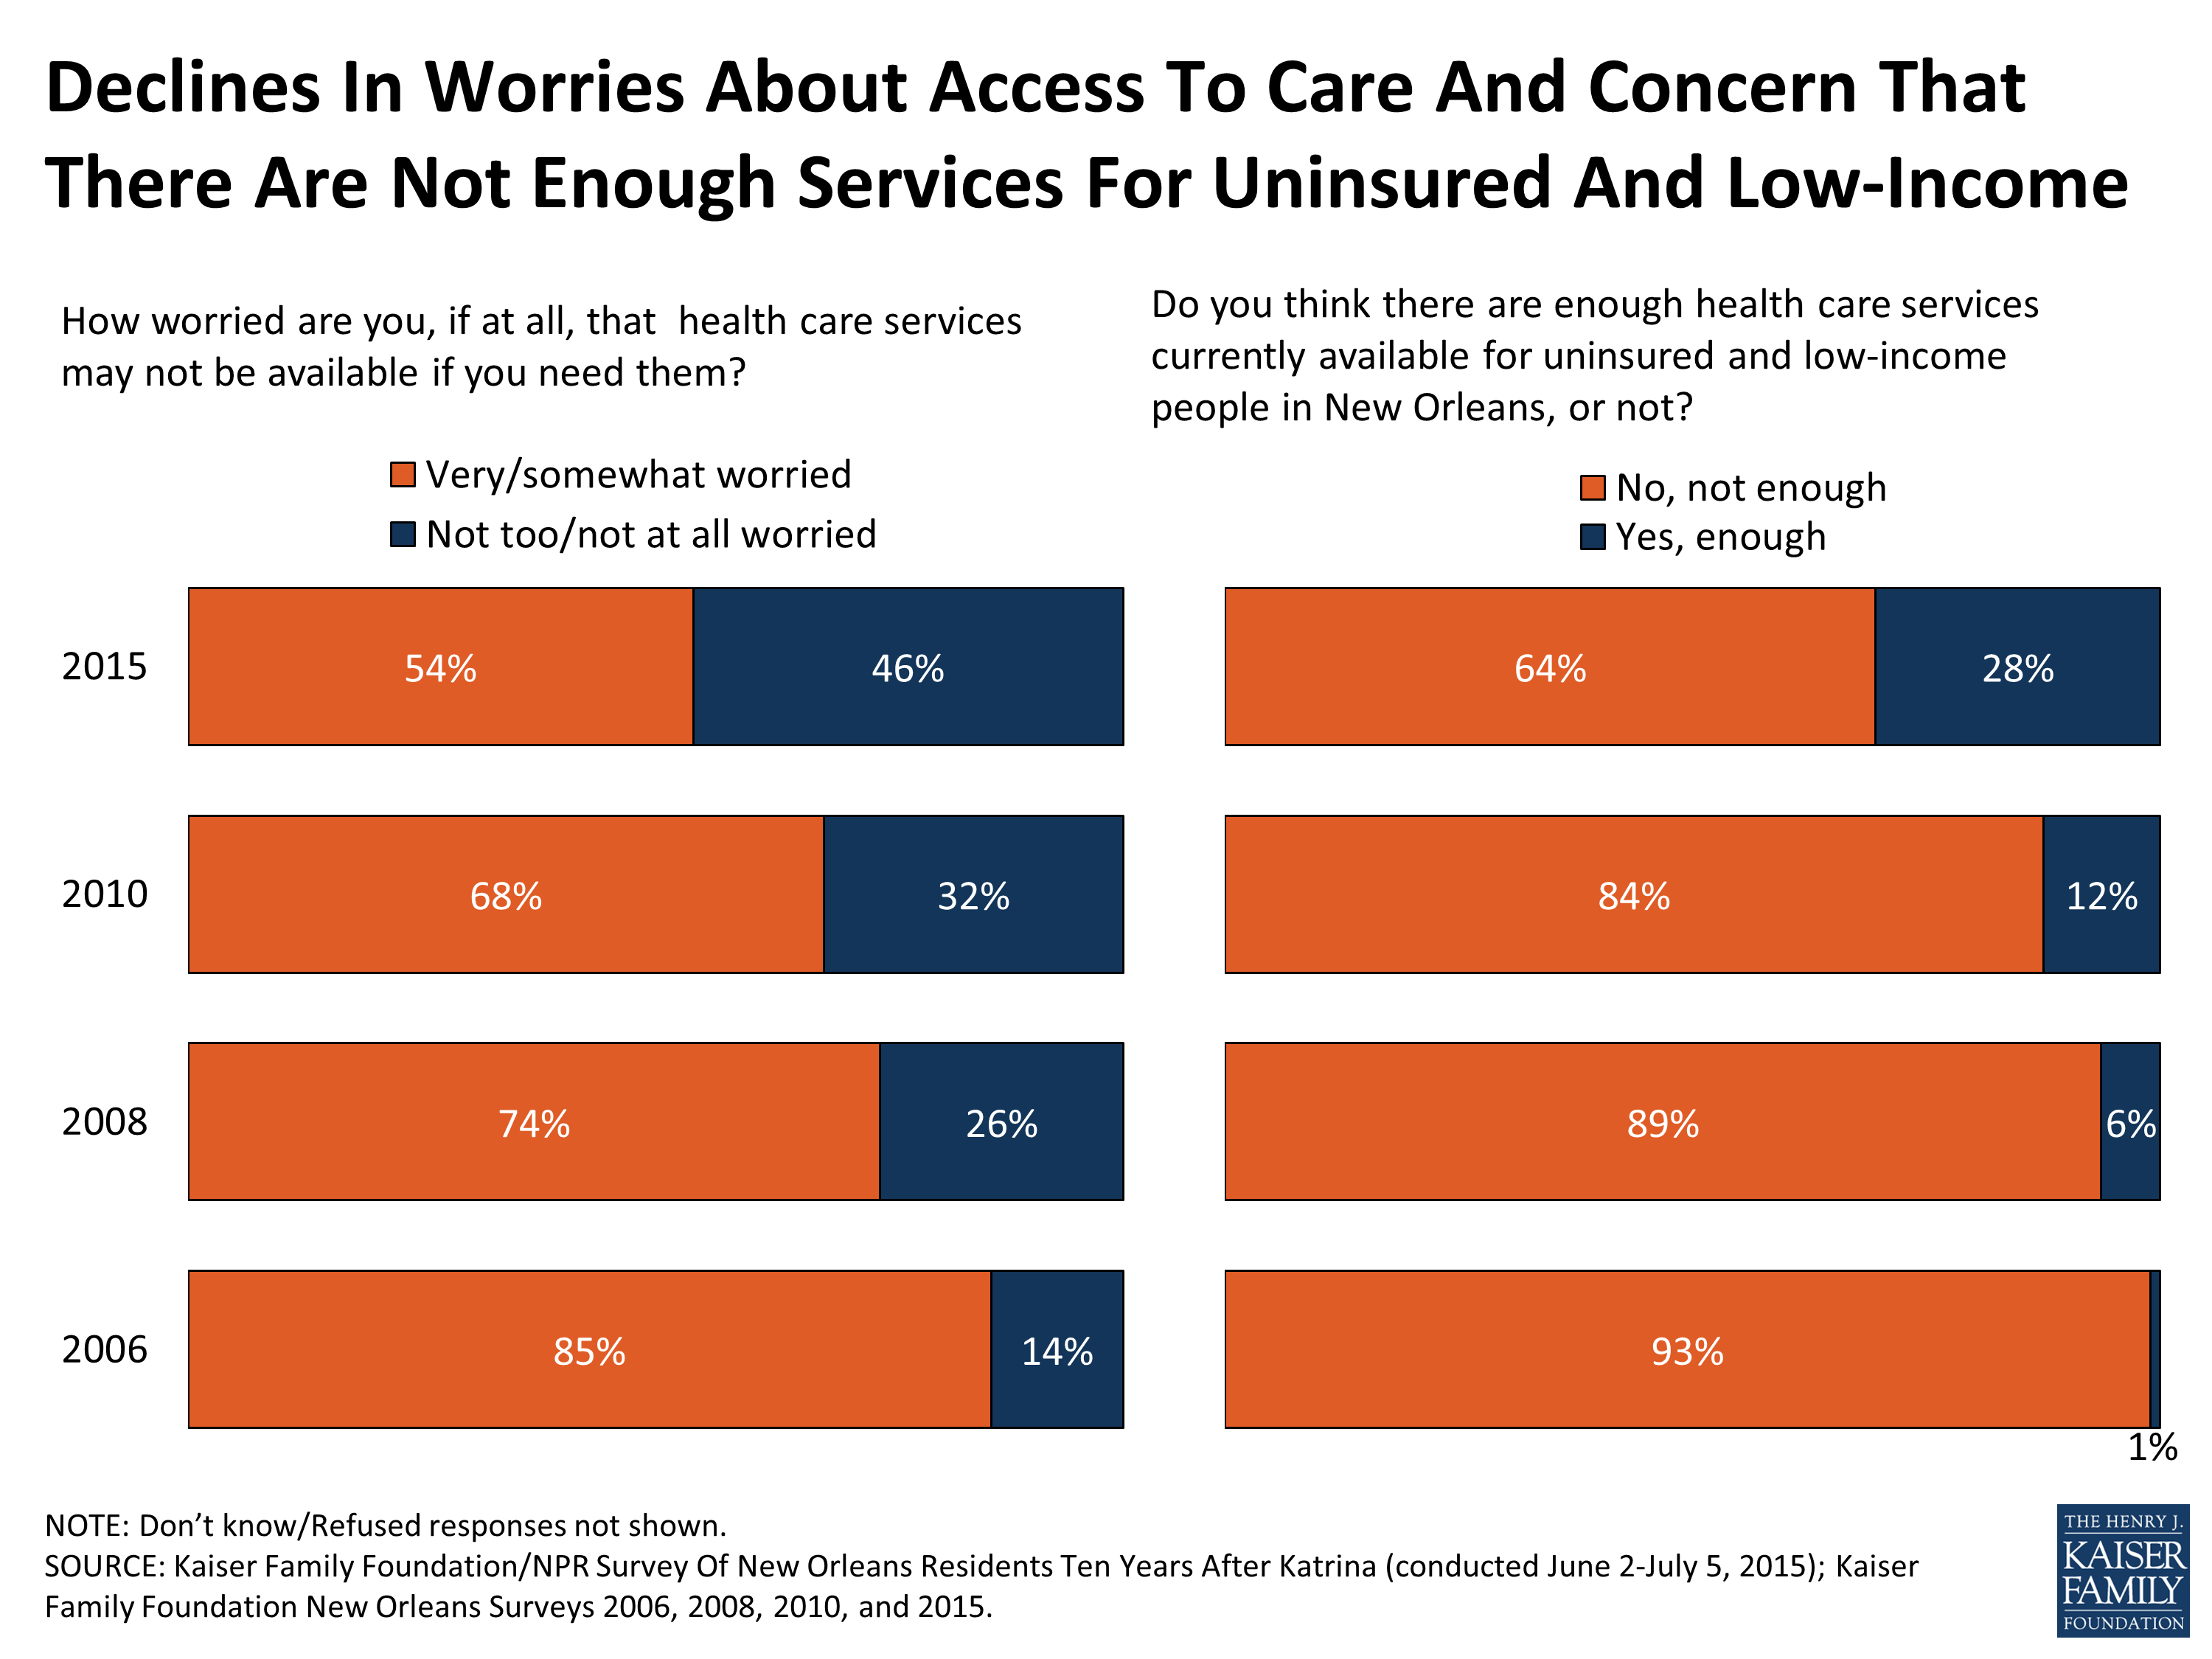
Figure 17
Despite these improvements, it comes as no surprise that the city’s more vulnerable populations – including those with lower incomes and those without health insurance – report problems accessing and affording health care at higher rates than their counterparts. Overall, about a quarter of residents (23 percent) say that in the past 6 months they have skipped or postponed needed medical care, and about one in five (19 percent) say they have not filled a prescription or skipped doses of a medicine. These proportions are even higher among those with incomes below 200 percent of the poverty level (32 percent and 26 percent, respectively) and among the uninsured (47 percent and 33 percent). Similarly, about a quarter (27 percent) of residents overall say they had problems paying medical bills in the past 6 months, with much higher rates among the uninsured (51 percent), those with lower incomes (41 percent), and African Americans (34 percent).
| Table 9: Uninsured, Lower-Income, And African Americans More Likely To Report Problems With Health Care Access And Affordability | |||||||
| INSURANCE STATUS | INCOME | RACE | |||||
| Percent who say, in the past 6 months, they… | TOTAL | Uninsured, ages 18-64 | Insured, ages 18-64 |
Less Than 200% FPL | 200% FPL Or More | African American | White |
| …did NOT get, or postponed medical care when they needed it | 23% | 47% | 21% | 32% | 17% | 25% | 21% |
| …did NOT fill a prescription, skipped doses, or took less than the prescribed dose of a medication | 19 | 33 | 19 | 26 | 13 | 22 | 15 |
| …had problems paying for medical bills | 27 | 51 | 26 | 41 | 14 | 34 | 16 |