Medicare Advantage 2016 Data Spotlight: Overview of Plan Changes
Plan Offerings in 2016
Number of Plans Offered
In total, 2,001 Medicare Advantage plans will be available nationwide for individual enrollment in 2016, 56 more than in 2015 (Figure 1). In 2016, 203 plans that were available in 2015 will be exiting the Medicare Advantage market, and 259 plans will be offered for the first time. An earlier analysis describes the nature of change at the national and state level as plans enter and exit the market in 2016.1 While virtually every state will see some change in the number of plan offerings, most of the plans exiting the market in 2016 attracted relatively few enrollees in 2015. Nationwide, the number of plans offered has been relatively stable since 2011.
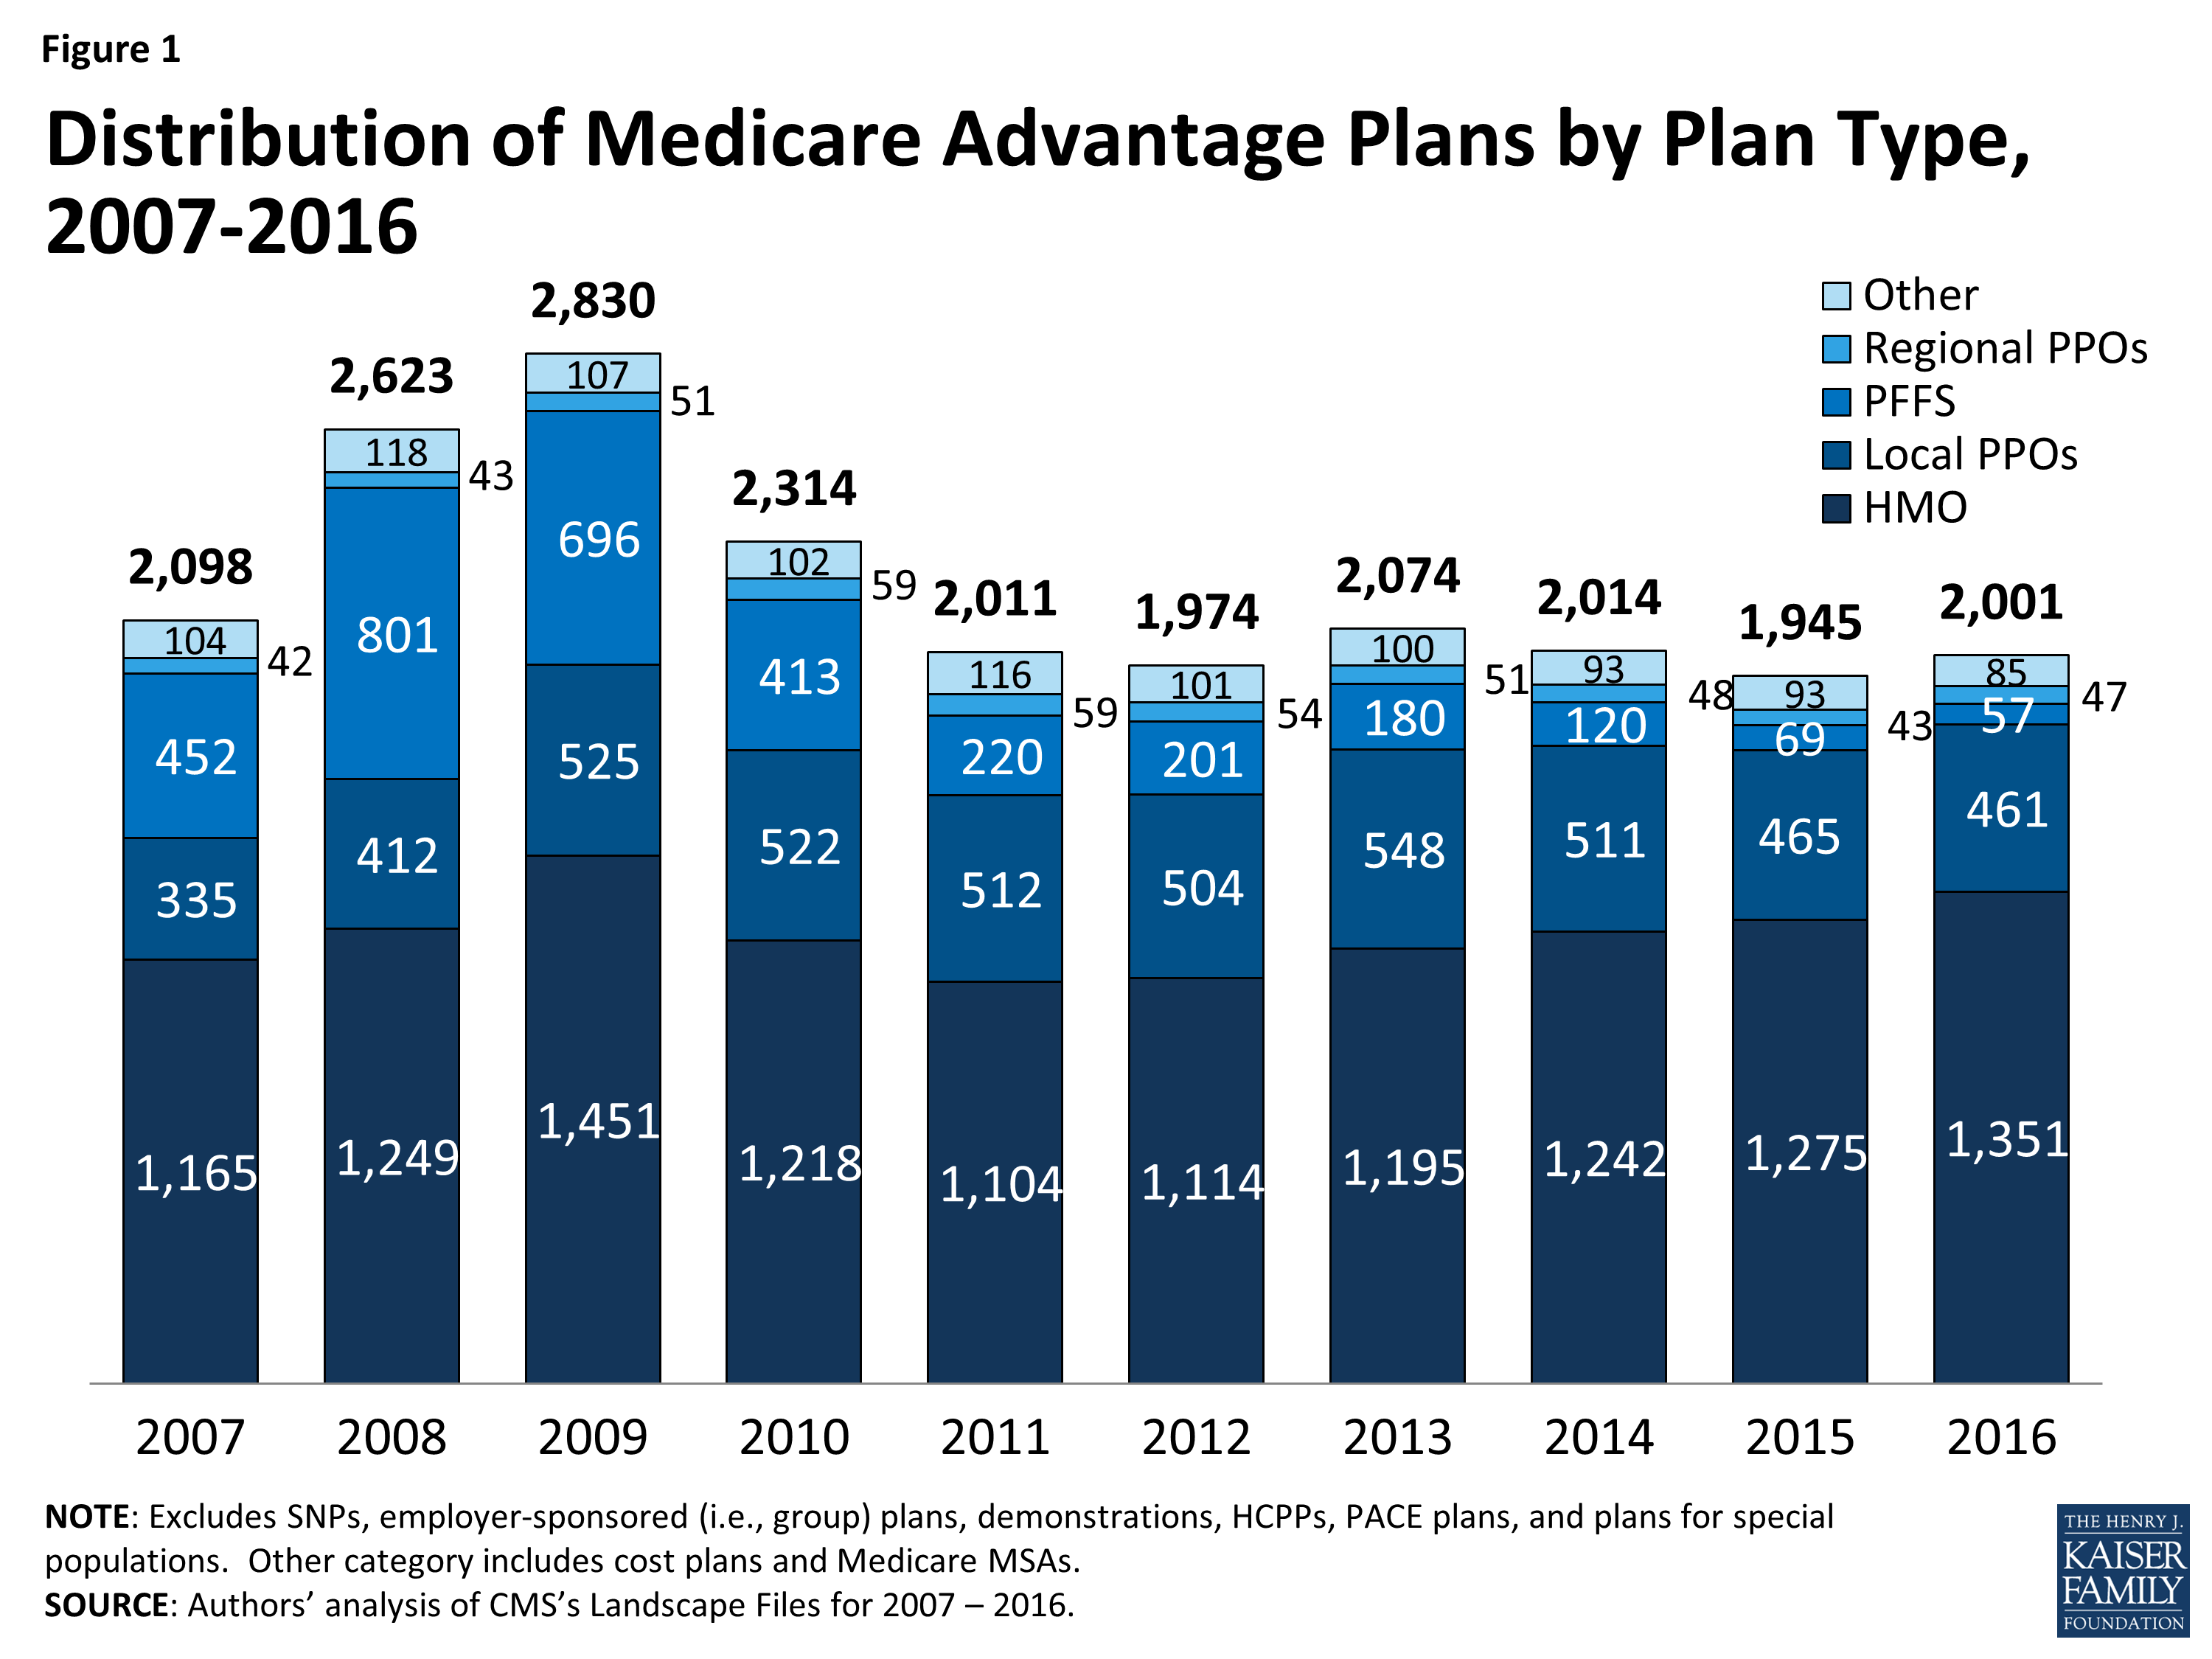
Figure 1: Distribution of Medicare Advantage Plans by Plan Type, 2007-2016
HMOs continue to account for the majority of plans available, and will account for two-thirds of all plans offered in 2016 (Table A1). Since 2013, the number of HMOs has increased each year, with 76 more HMOs in 2016, while the availability of other plan types has either remained similar or decline. In 2016, there will be limited changes in the number of local PPOs, regional PPOs, and private fee-for-service (PFFS) plans.
Locally, the number of plans available to Medicare beneficiaries in 2016 will not be very different from in 2015. The average beneficiary will be able to choose from among 19 plans, on average, in 2016 – as compared with 18 plans in 2015 (Figure 2). Beneficiaries in metropolitan areas will be able to choose from 21 plans, on average, and beneficiaries in non-metropolitan areas will be able to choose from 11 plans, on average, an increase of 1 plan from 2015. The average number of plans available in the lowest cost counties (i.e., lowest quartile of counties) will remain the same (15 plans) while the average number of plans available in other counties will increase by 1 plan (from 22 plans to 23 plans in the highest cost counties; Table A2).
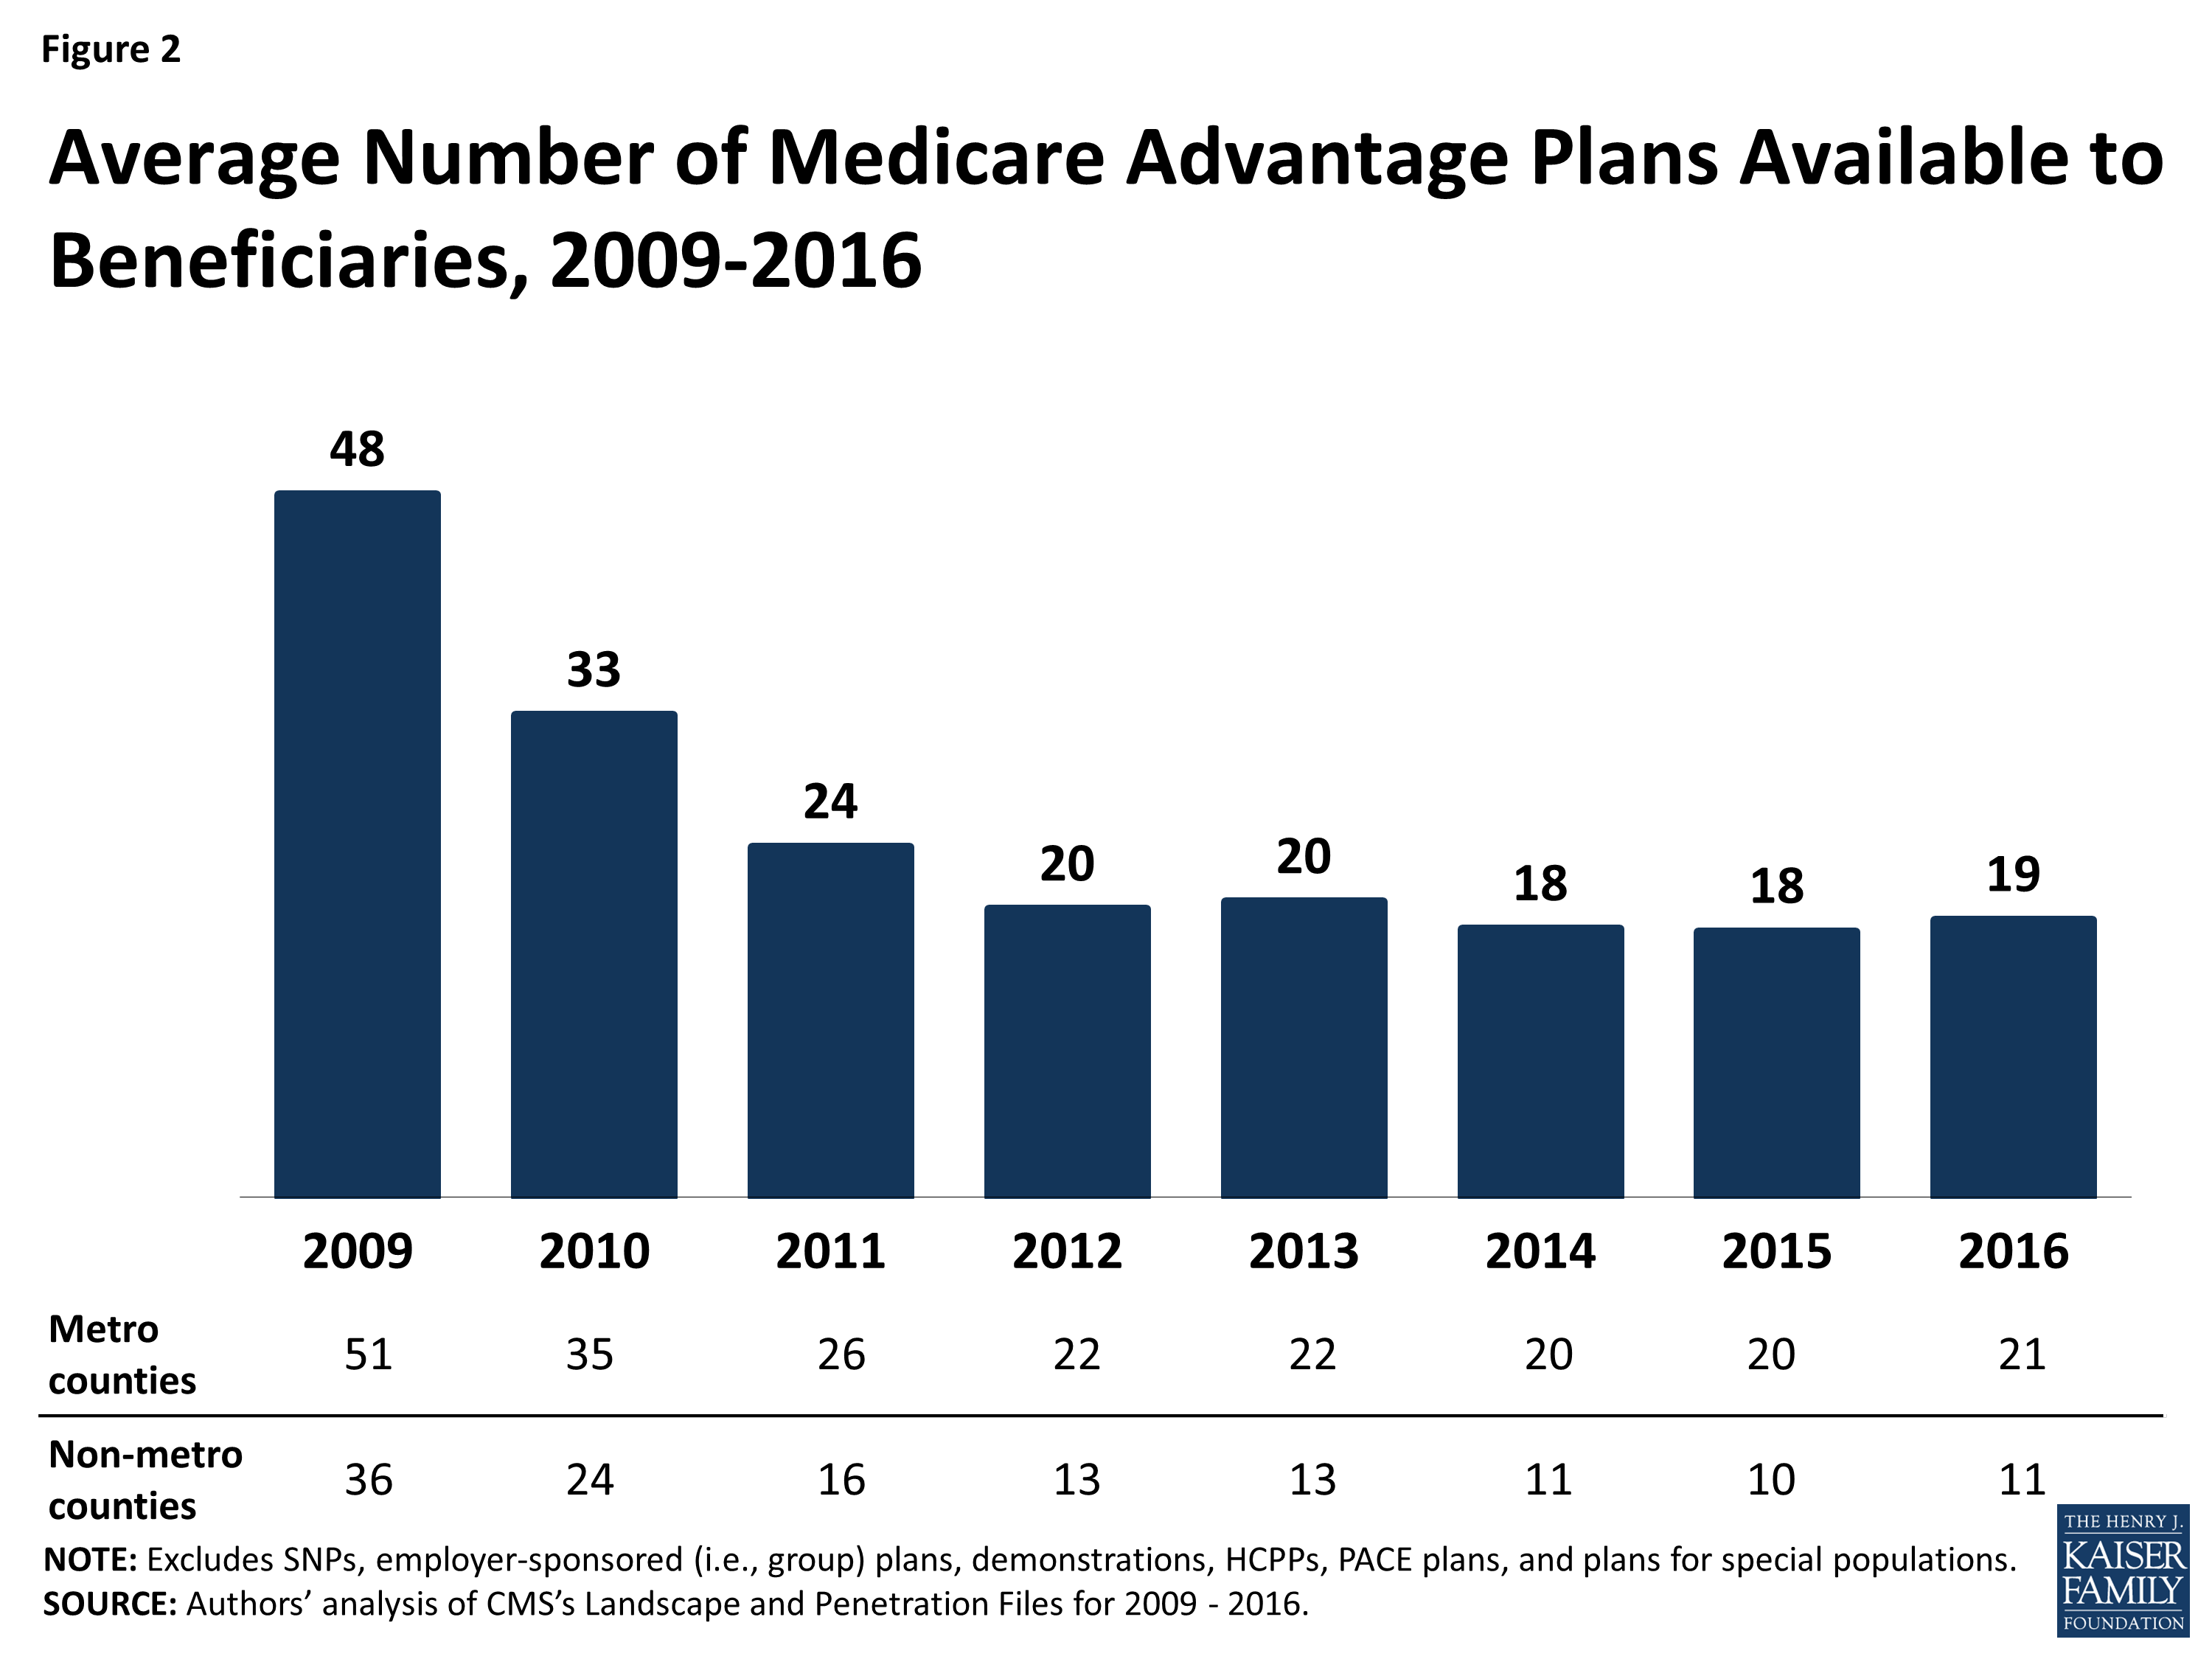
Figure 2: Average Number of Medicare Advantage Plans Available to Beneficiaries, 2009-2016
Number of Firms Offering Medicare Advantage Plans
The average Medicare beneficiary will be able to choose from many plans, but in some areas, these plans will be offered by a handful of firms. The average Medicare beneficiary will be able to choose from plans offered by 6 firms, on average, in 2016, with sizeable variation across counties (Figure 3). One-quarter of beneficiaries will be able to choose from plans offered by three or fewer firms, while another quarter of beneficiaries will be able to choose from plans offered by 8 or more firms. The number of firms offering Medicare Advantage plans will be highest in the New York City area, with at least 19 firms offering plans in Bronx County, Kings County, New York County, and Queens County. In contrast, in 445 counties in 28 states accounting for 4 percent of Medicare beneficiaries, only one firm will offer Medicare Advantage plans in 2016.
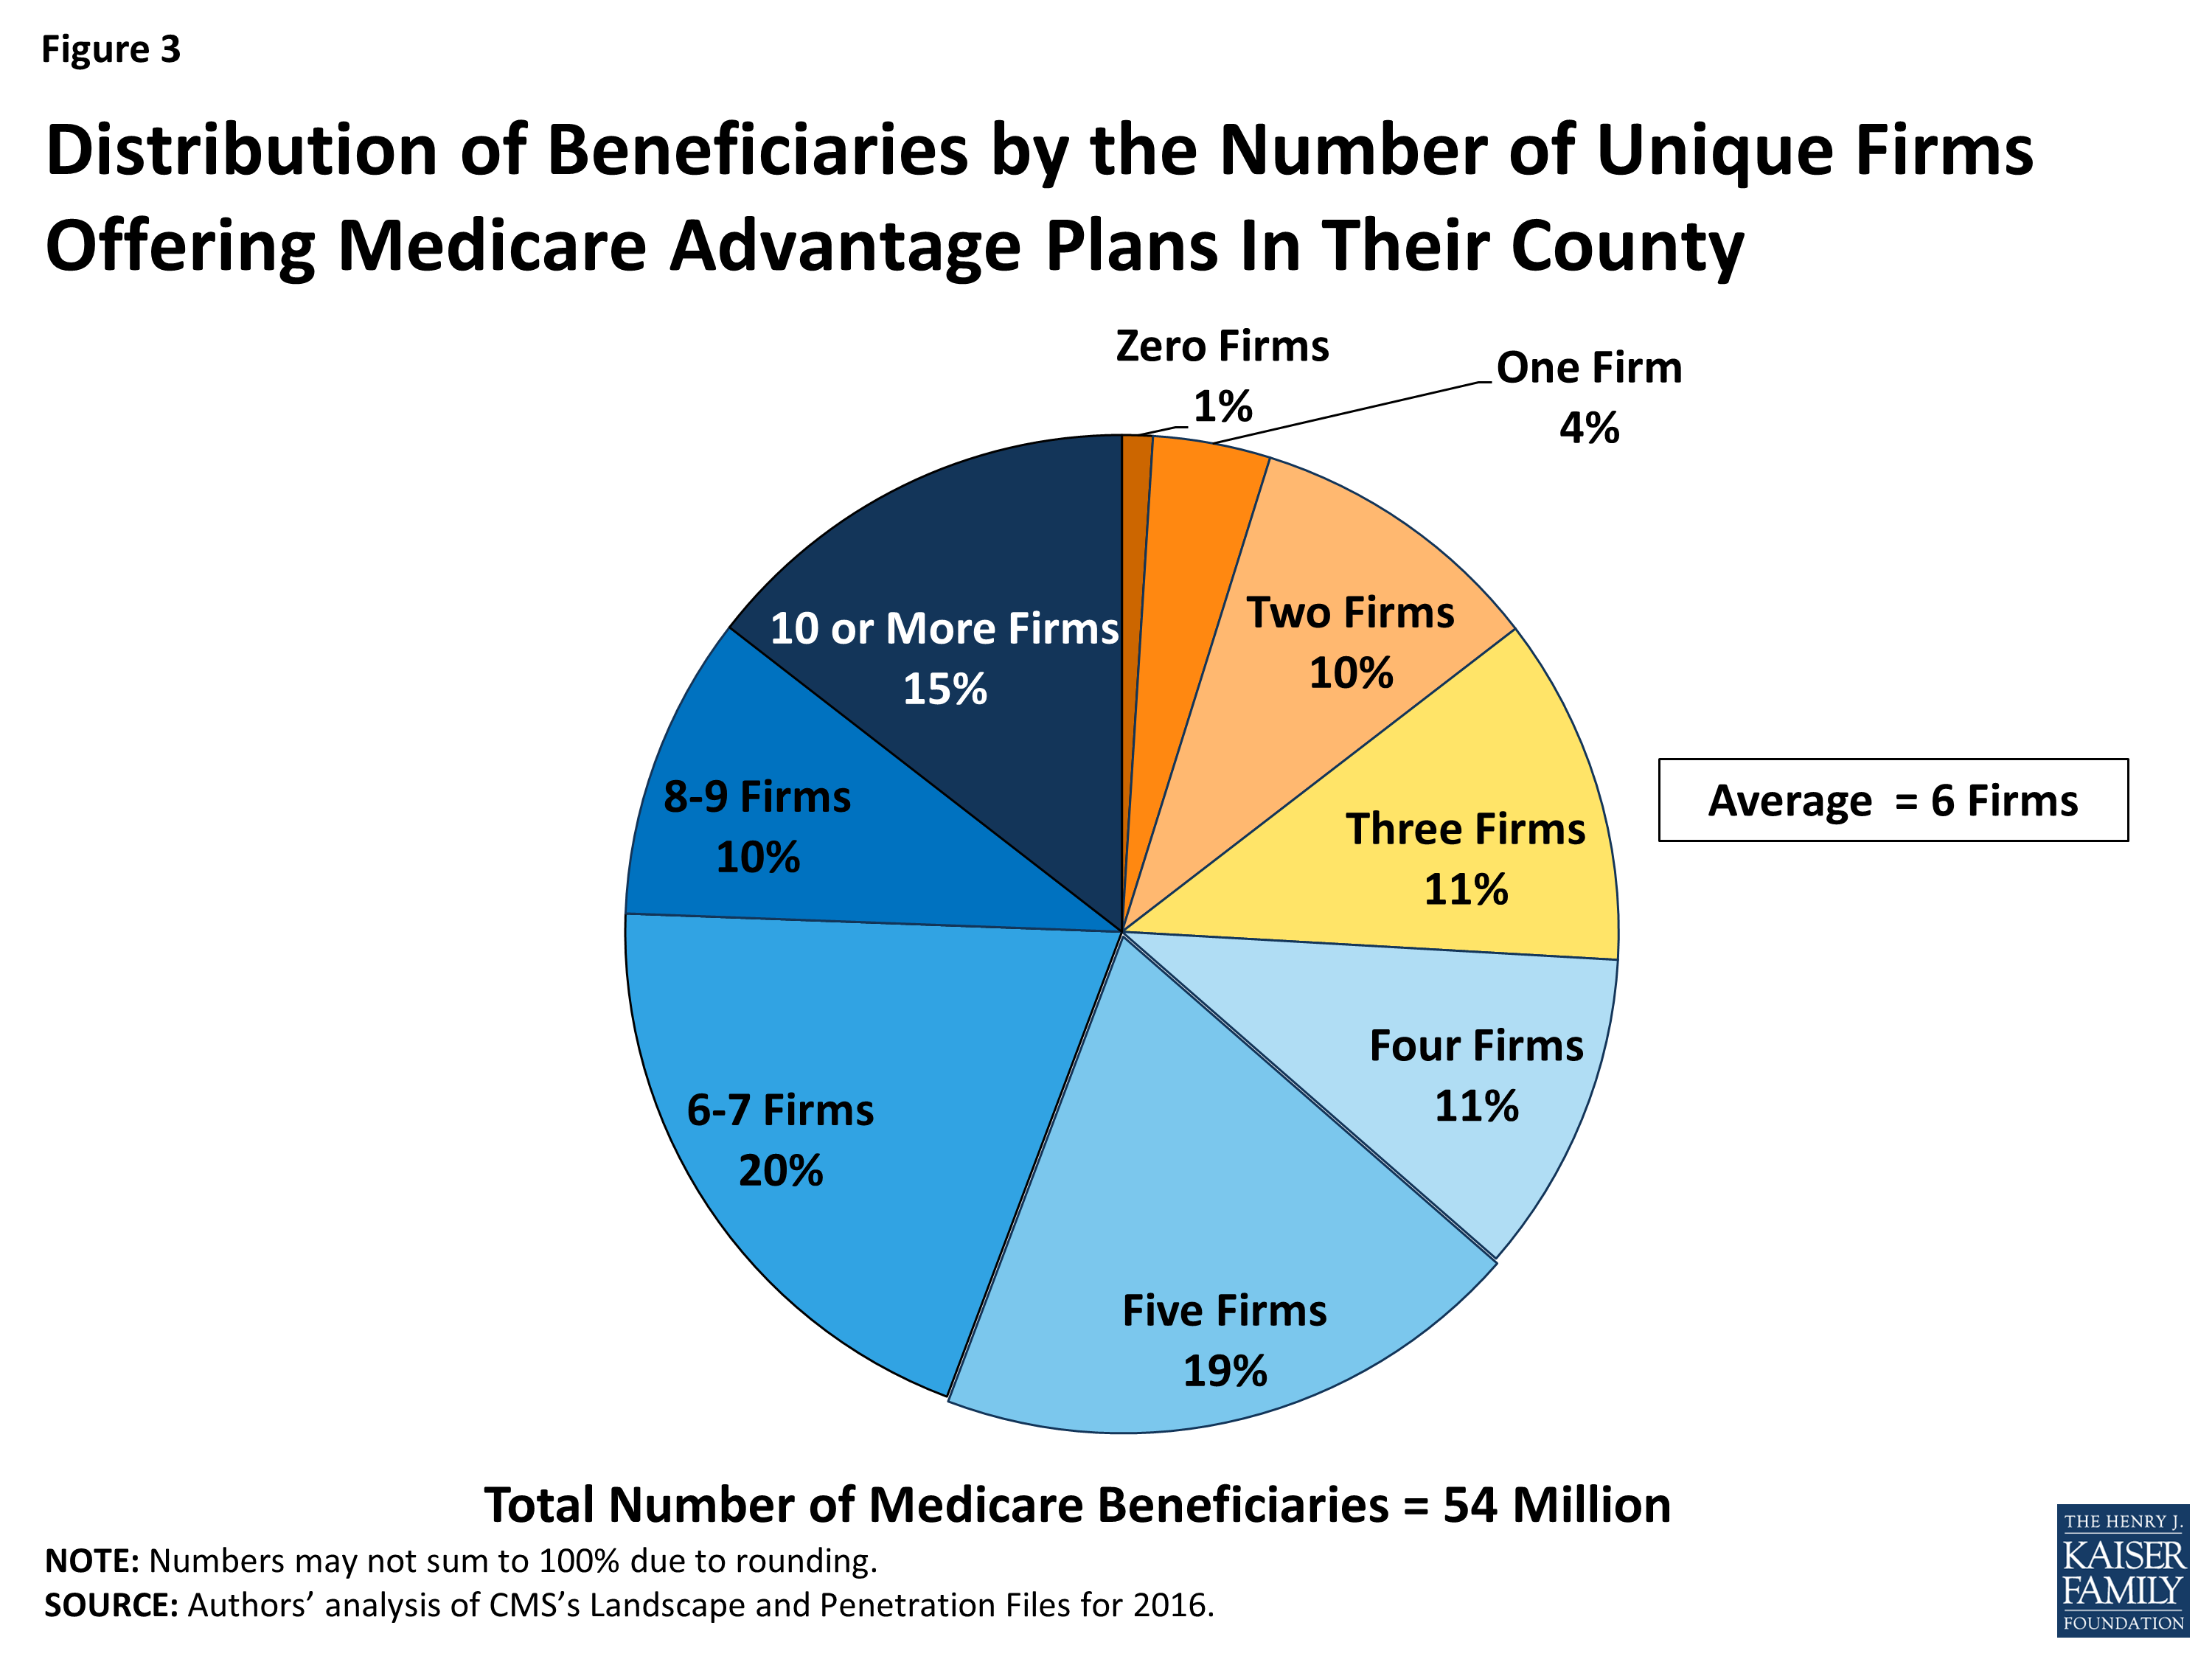
Figure 3: Distribution of Beneficiaries by the Number of Unique Firms Offering Medicare Advantage Plans In Their County
Access to Medicare Advantage Plans
As in recent years, virtually all Medicare beneficiaries (99%) will continue to have access to a Medicare Advantage plan as an alternative to traditional Medicare (Figure 4). All beneficiaries in metropolitan areas (100%) and the vast majority of beneficiaries in non-metropolitan areas (97%) will continue to have access to at least one Medicare Advantage plan – the same percentages as in 2015. Consistent with prior years, a smaller share of beneficiaries in non-metropolitan counties than in metropolitan counties will have access to HMOs or local PPOs, although these plans will be available to at least 70 percent of beneficiaries in non-metropolitan counties.
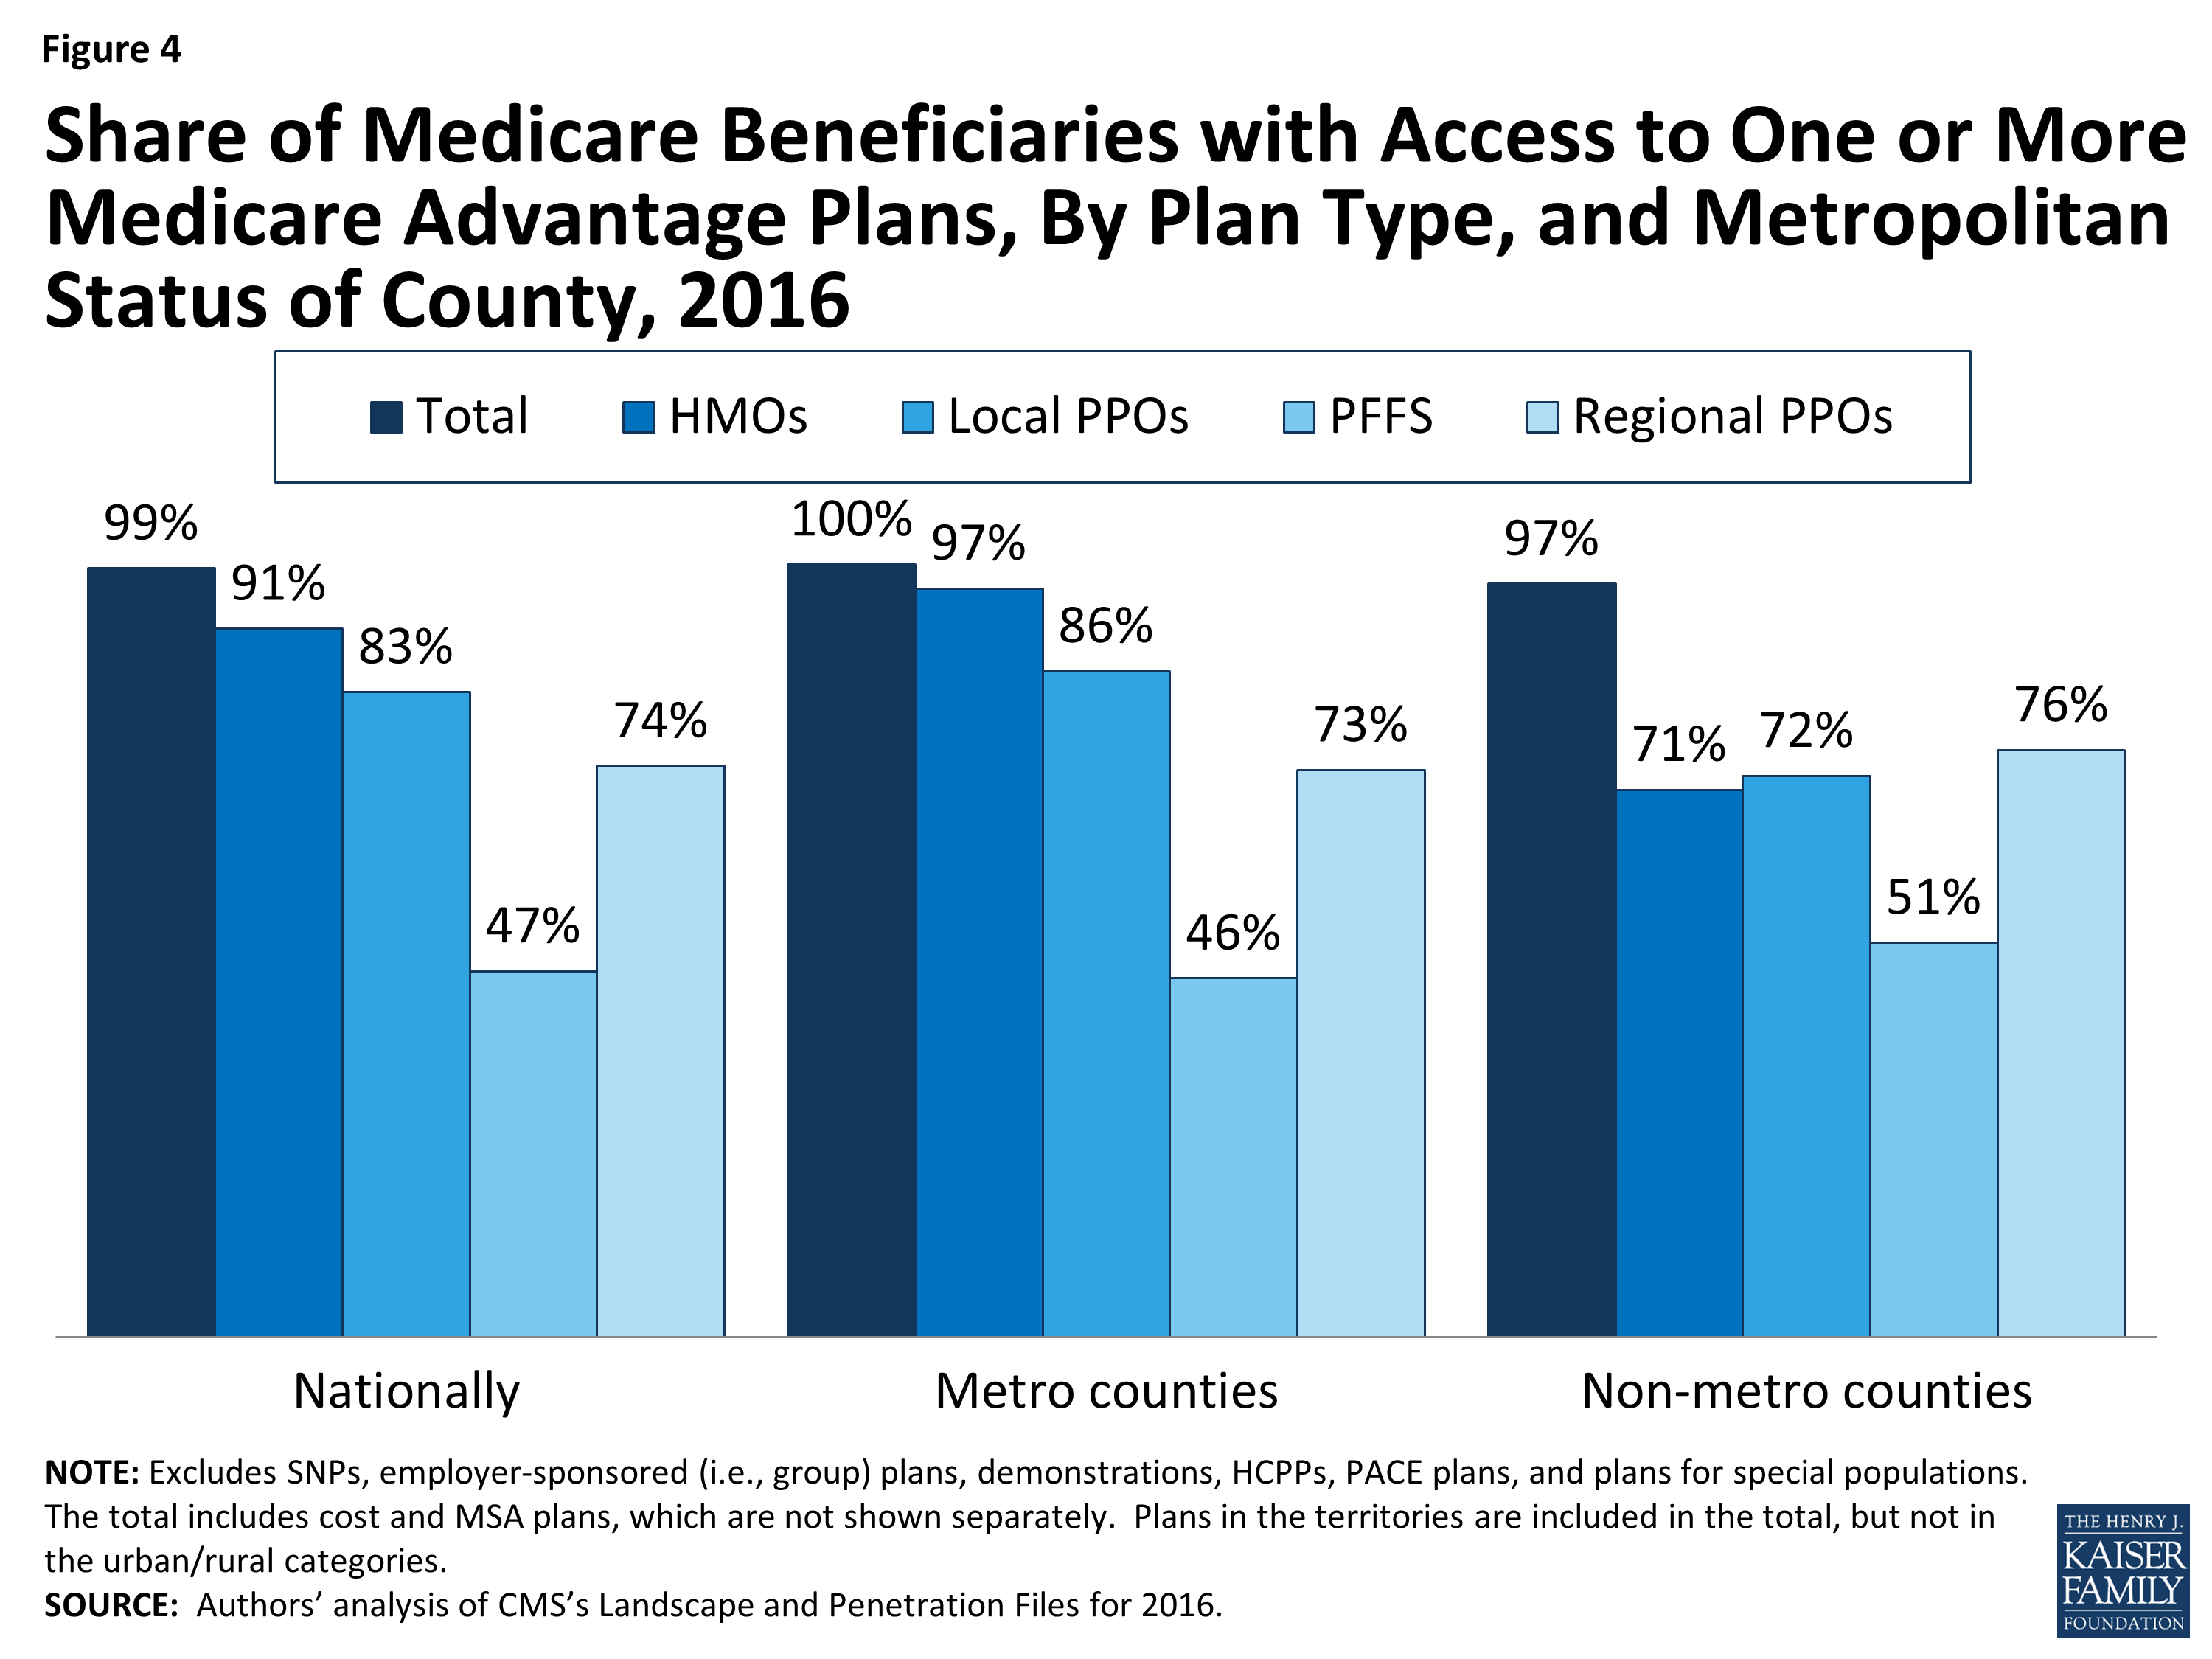
Figure 4: Share of Medicare Beneficiaries with Access to One or More Medicare Advantage Plans, By Plan Type, and Metropolitan Status of County, 2016