2019 Employer Health Benefits Survey
Section 14: Employer Practices and Health Plan Networks
Employers are continuously reviewing and modifying their health plans to incorporate new options and to respond to changes in policy and the economy. We continue to monitor new options, such as telemedicine, and ask about changes in the policy environment, such as the elimination of the federal requirement that people have health insurance. This year we also asked additional questions about how employers view the provider network options available to them.
SHOPPING FOR HEALTH COVERAGE
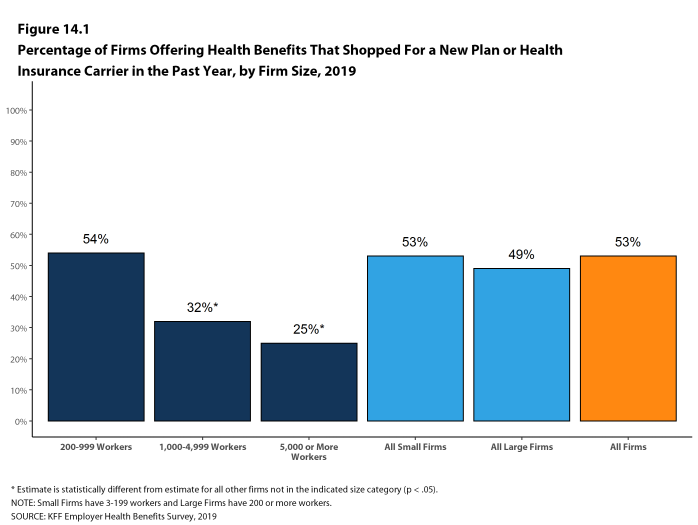
Fifty-three percent of firms offering health benefits reported shopping for a new health plan or a new insurance carrier in the past year, similar to the percentage last year. Firms with 1,000-4,999 workers and firms with 5,000 or more workers were less likely to shop for coverage (32% and 25%, respectively) than firms in other size categories [Figure 14.1].
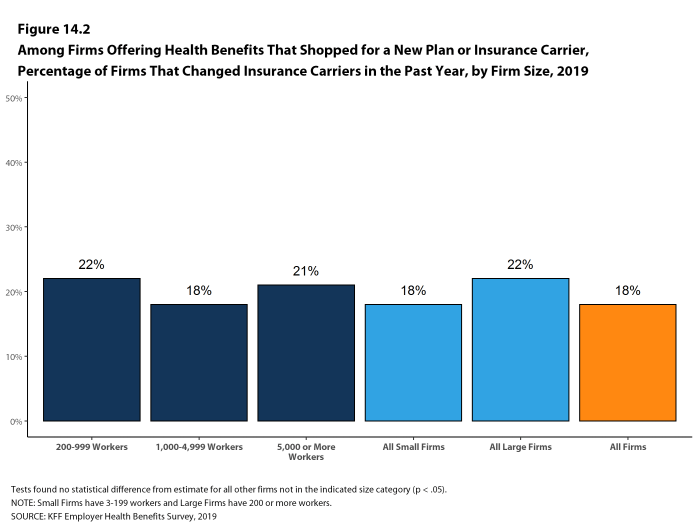
- Among firms that offer health benefits and who shopped for a new plan or carrier in the past year, 18% changed insurance carriers [Figure 14.2].
Figure 14.1: Percentage of Firms Offering Health Benefits That Shopped for a New Plan or Health Insurance Carrier in the Past Year, by Firm Size, 2019
ALTERNATIVE CARE SETTINGS: TELEMEDICINE, ON-SITE CLINICS, AND RETAIL CLINICS
Many firms provide coverage for health services delivered outside typical provider settings.
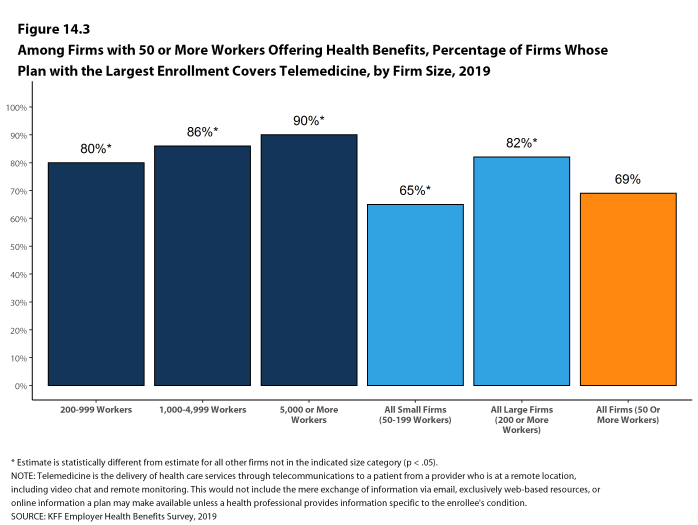
- Telemedicine is the delivery of health care services through telecommunications to a patient from a provider who is at a remote location, including video chat and remote monitoring. This would not include the mere exchange of information via email, exclusively web-based resources, or online information a plan may make available unless a health professional provides information specific to the enrollee’s condition. Sixty-nine percent of firms with 50 or more workers that offer health benefits cover the provision of some health care services through telemedicine in their largest health plan, similar to the percentage in 2018. [Figure 14.3]. Firms with 50-199 workers are less likely than larger firms to cover services provided through telemedicine.
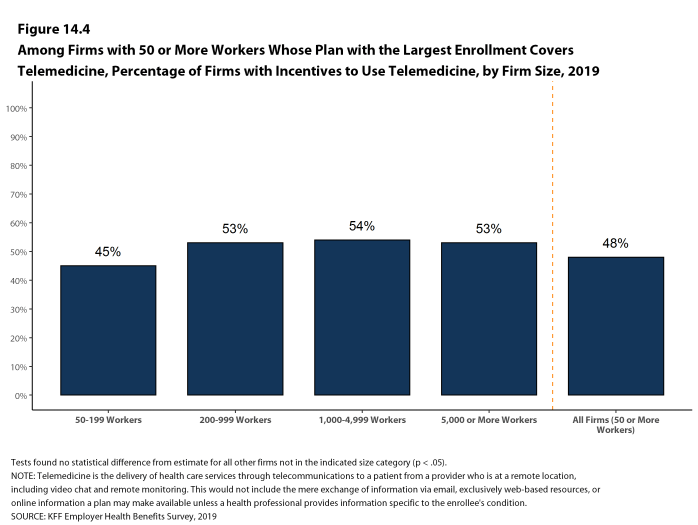
- Among firms with 50 or more workers with plans that cover health services through telemedicine, 48% provide a financial incentive for workers to use telemedicine instead of visiting a traditional physician’s office in-person, similar to the percentage in 2018 [Figure 14.4].
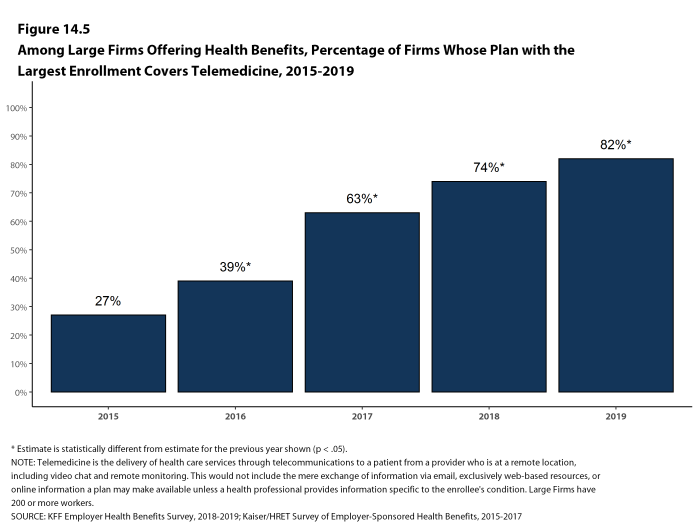
- The percentage of large firms reporting that they cover services through telemedicine increased from 74% last year and 39% three years ago to 82% this year [Figure 14.5].
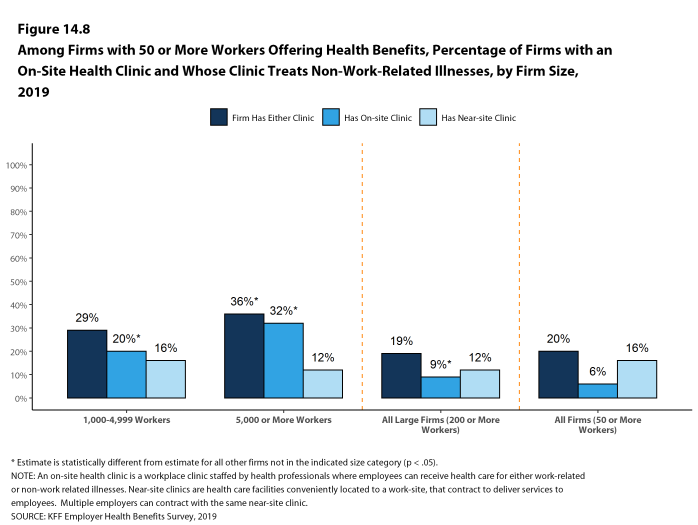
- Some employers provide health services to their employees though clinics that they establish or sponsor at or near their place of work. This year we expanded the survey to ask about ‘near-site’ health clinics, which are clinics conveniently located to a worksite that contract with an employer to serve it workers. On-site and near-site clinics may treat work-related injuries and may also provide other health services.
- Among firms with 50 or more employees that offer health benefits, 20% have an on-site or a near-site health clinic for their employees at one or more of their workplace locations. Firms with 5,000 or more workers are more likely than smaller firms to have one of these clinics [Figure 14.8].
- Among firms reporting that they have an on-site or near-site clinic at one of their workplace locations, 21% say they have an on-site clinic, 72% say that they have a near-site clinic, and 7% say that they have both types of clinics. Generally, smaller firms are more likely to say that they have near-site clinics and larger firms are more likely to say that they have on-site clinics [Figure 14.8].
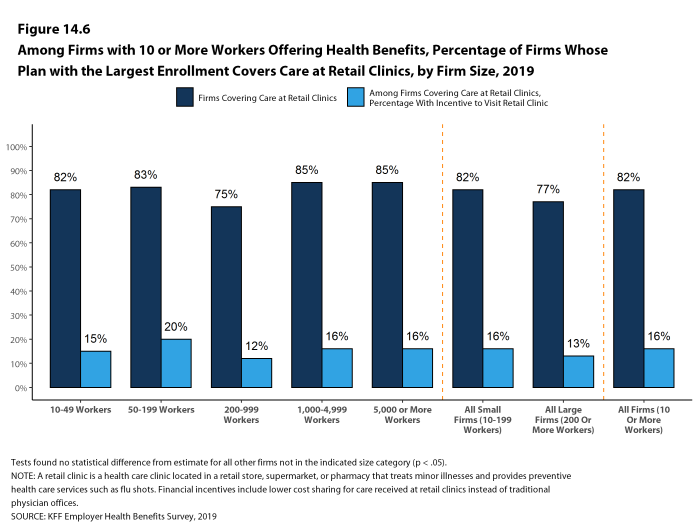
- Eighty-two percent of firms with 10 or more employees that offer health benefits cover health care services received in retail clinics, such as those located in pharmacies, supermarkets and retail stores, in their largest health plan [Figure 14.6]. These clinics are often staffed by nurse practitioners or physician assistants and treat minor illnesses and provide preventive services.
- Among firms with 10 or more employees covering health services received in retail clinics in their largest plan, 16% provide a financial incentive for workers to use a retail health clinic instead of visiting a traditional physician’s office [Figure 14.6].
Figure 14.3: Among Firms With 50 or More Workers Offering Health Benefits, Percentage of Firms Whose Plan With the Largest Enrollment Covers Telemedicine, by Firm Size, 2019
Figure 14.4: Among Firms With 50 or More Workers Whose Plan With the Largest Enrollment Covers Telemedicine, Percentage of Firms With Incentives to Use Telemedicine, by Firm Size, 2019
Figure 14.5: Among Large Firms Offering Health Benefits, Percentage of Firms Whose Plan With the Largest Enrollment Covers Telemedicine, 2015-2019
Figure 14.6: Among Firms With 10 or More Workers Offering Health Benefits, Percentage of Firms Whose Plan With the Largest Enrollment Covers Care at Retail Clinics, by Firm Size, 2019
Figure 14.7: Among Large Firms Offering Health Benefits, Percentage of Firms Whose Plan With the Largest Enrollment Covers Care at Retail Clinics and That Have a Financial Incentive for Workers to Visit Retail Clinics Instead of a Physician’s Office, 2010-2019
FIRM APPROACHES TO PLAN NETWORKS
Firms and health plans can structure their networks of providers and their cost sharing to encourage enrollees to use providers who are lower cost or who provide better care. Periodically we ask employers about network strategies, such as using tiered or narrow networks. For 2019, we added questions about additional network strategies and about employer satisfaction with the network options available to them.
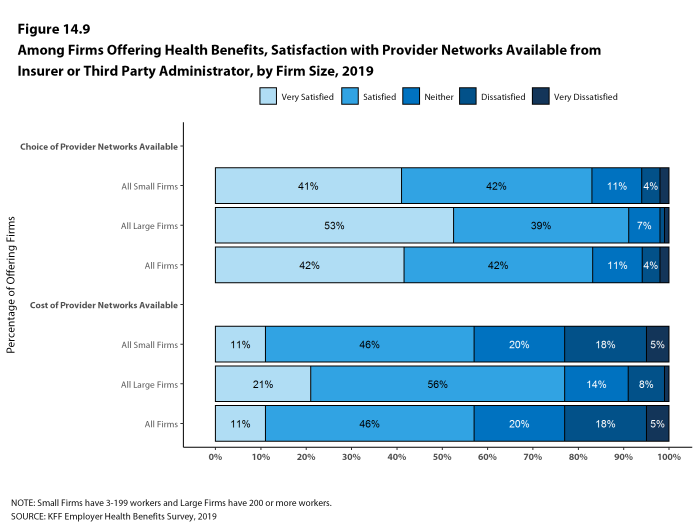
- Employers overall report being quite satisfied with the choice of provider networks made available to them by their insurer or plan administrator.
- Among employers offering health benefits, 42% of firms report being ‘very satisfied’ and 42% report being ‘satisfied’ by the choice of provider networks available to them. Employers with 1,000-4,999 and with 5,000 or more workers are more likely to be ‘very satisfied’ with the available network choices [Figure 14.9].
- Employers are somewhat less satisfied with the cost of the provider networks available to them from their insurer or administrator. Among employers offering health benefits, only 11% of firms report being ‘very satisfied’ while 46% report being ‘satisfied’ with the cost of provider networks available to them. Large firms are more likely than small firms to be very satisfied with the cost of available provider networks, while small firms are more likely to be ‘dissatisfied’ or ‘very dissatisfied’ with the cost of the provider networks available to them [Figure 14.9].
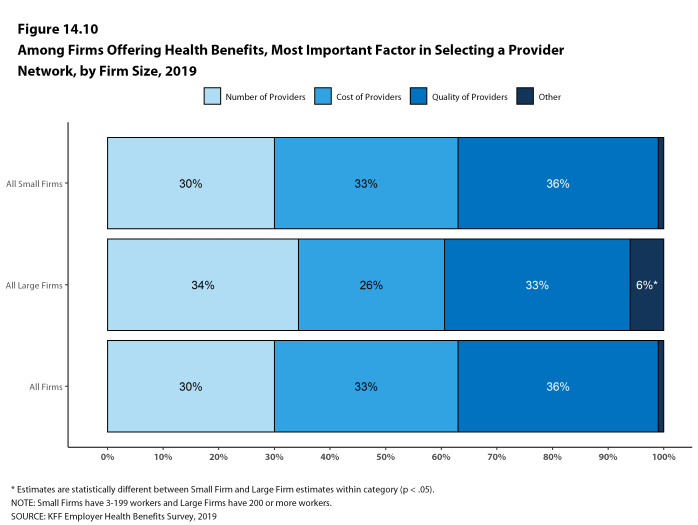
- Employers offering health benefits were asked what the most important factor is when assessing the provider networks they will offer to employees: number and convenience of providers, cost of providers, quality of providers, or some other factor.
- Employers overall are fairly evenly divided across the first three factors, with 30% of employers identifying the number and convenience of providers as most important, 33% identifying the cost of providers as most important, and 36% identifying the quality providers as most important [Figure 14.10].
- Employers with 1,000-4,999 and with 5,000 or more workers are less likely to say that cost of providers is the most important factor they consider when assessing provider networks.
Figure 14.9: Among Firms Offering Health Benefits, Satisfaction With Provider Networks Available From Insurer or Third Party Administrator, by Firm Size, 2019
TIERED NETWORKS
- Some employers offer health plans with provider networks that are divided into two or more groups or ‘tiers’. A tiered or high-performance network typically groups providers in the network based on the cost, quality and/or efficiency of the care they deliver. These networks generally use financial incentives, such as lower cost sharing, to encourage enrollees to use providers in the preferred groupings.
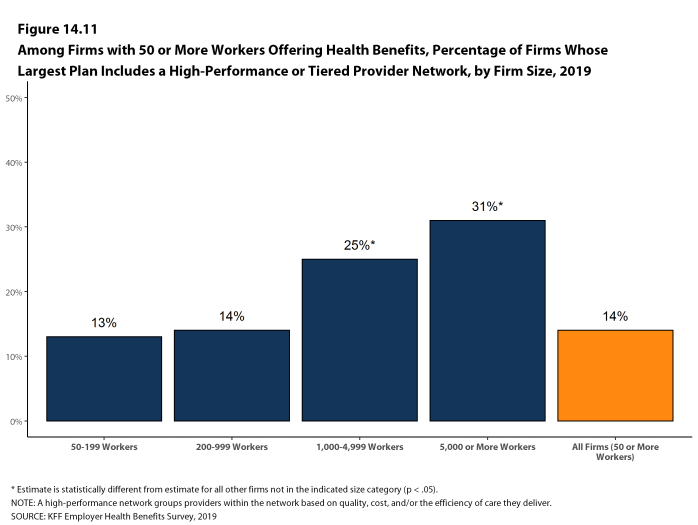
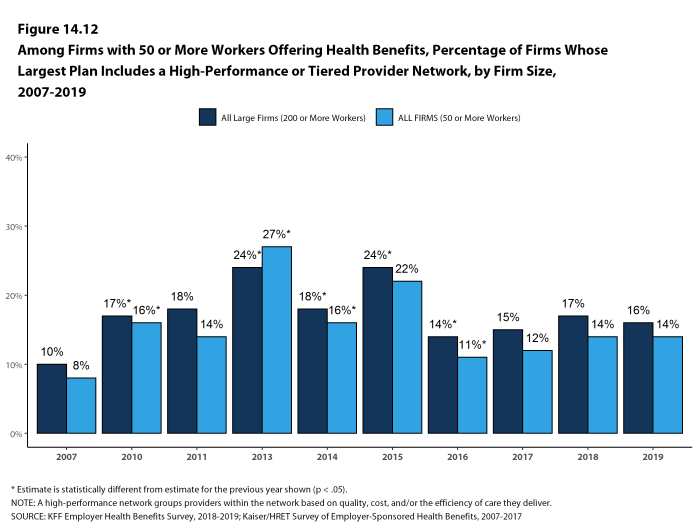
- Fourteen percent of firms with 50 or more workers that offer health benefits include a high-performance or tiered provider network in their health plan with the largest enrollment, similar to the percentage last year [Figure 14.11] and [Figure 14.12].
- Firms with 1,000-4,999 and with 5,000 or more workers are more likely to include a high-performance or tiered provider network in their health plan with the largest enrollment than smaller firms [Figure 14.11].
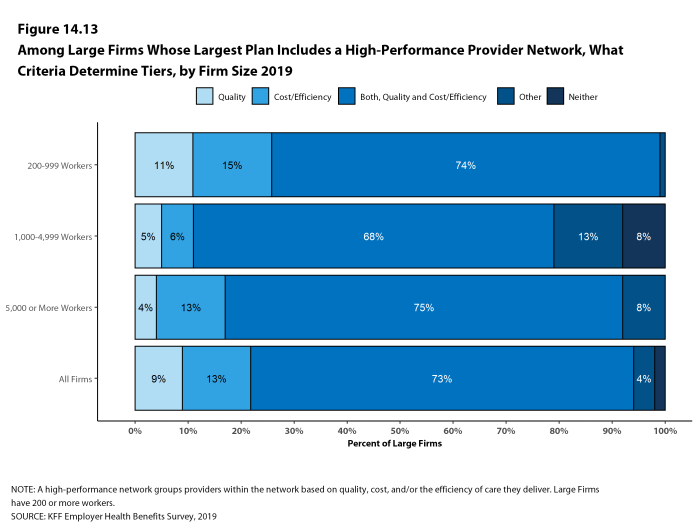
- Seventy-three percent of large firms offering a tiered or high-performance network say that the network tiers are based on both quality and cost/efficiency of care, 9% say the tiers are based on quality of care, 13% say the tiers are based on the cost/efficiency of care, and 4% say the tiers are based on some other factor [Figure 14.13].
Figure 14.11: Among Firms With 50 or More Workers Offering Health Benefits, Percentage of Firms Whose Largest Plan Includes a High-Performance or Tiered Provider Network, by Firm Size, 2019
Figure 14.12: Among Firms With 50 or More Workers Offering Health Benefits, Percentage of Firms Whose Largest Plan Includes a High-Performance or Tiered Provider Network, by Firm Size, 2007-2019
OTHER PLAN NETWORK ISSUES
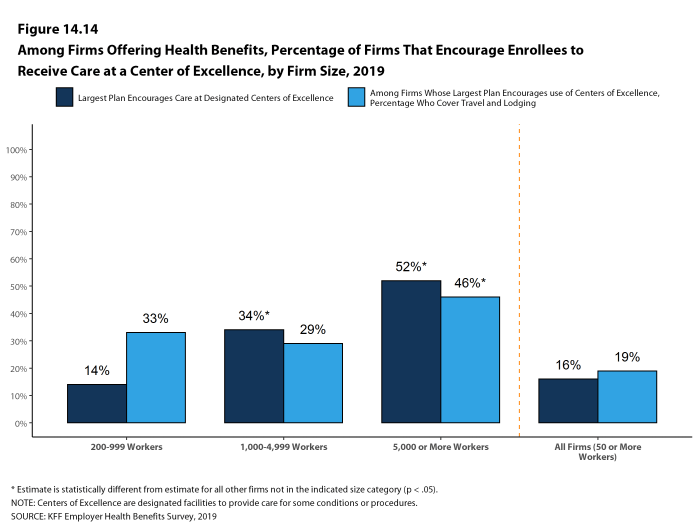
- Some employers and health plans designate providers as ‘Centers of Excellence’ and encourage enrollees to use these providers to treat certain conditions. Centers of Excellence are designated providers that firms or health plans have identified as meeting high standards for both the cost and quality of care.
- Sixteen percent of employers with 50 or more employees offering health benefits say their plan with the largest enrollment encourages enrollees to use Centers of Excellence, including 34% of employers with 1,000-4,999 workers and 52% of employers with 5,000 or more workers [Figure 14.14].
- Among large employers that say that they encourage enrollees to use Centers of Excellence in their plan with the largest enrollment, 33% pay for the travel and lodgings costs for enrollees to receive care at a designated Center of Excellence [Figure 14.14].
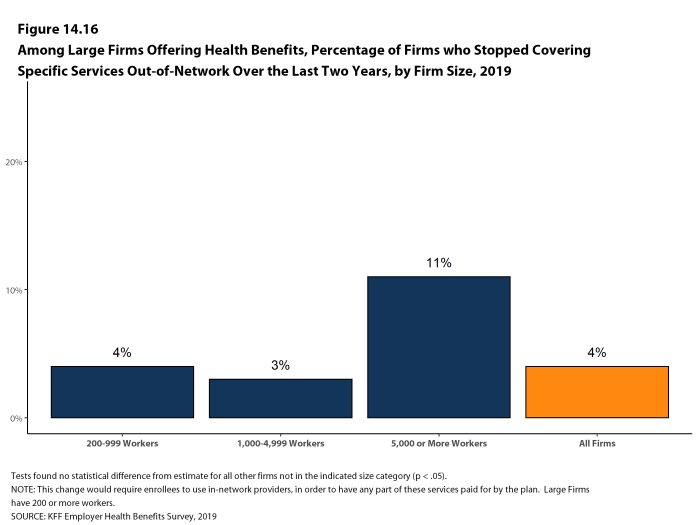
- Another strategy for some employers is to eliminate out-of-network coverage for specified services. These firms may feel that they can better control use or quality of care by restricting coverage to in-network providers.
- Four percent of large firms report they stopped covering specified health services provided out-of-network within the last two years [Figure 14.16].
- Services identified by employers that reported dropping out-of-network for services included mental health, bariatric surgery and dialysis.
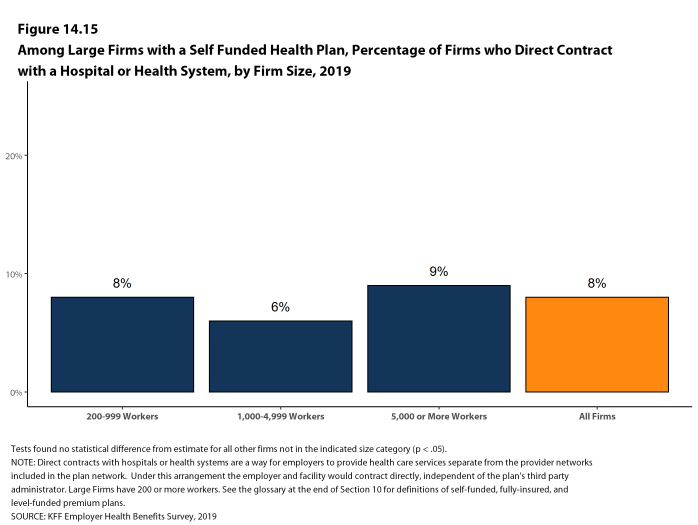
- Some employers also contract directly with certain health plans or health systems, outside of their established provider networks, to treat patients with specified conditions. Among large employers offering health benefits, 8% have such an arrangement [Figure 14.15].
Figure 14.14: Among Firms Offering Health Benefits, Percentage of Firms That Encourage Enrollees to Receive Care at a Center of Excellence, by Firm Size, 2019
Figure 14.15: Among Large Firms With a Self Funded Health Plan, Percentage of Firms Who Direct Contract With a Hospital or Health System, by Firm Size, 2019
NARROW NETWORKS
- One way that employers and health plans can affect the cost and quality of services in their provider networks is to eliminate hospitals or health systems that are not performing well.
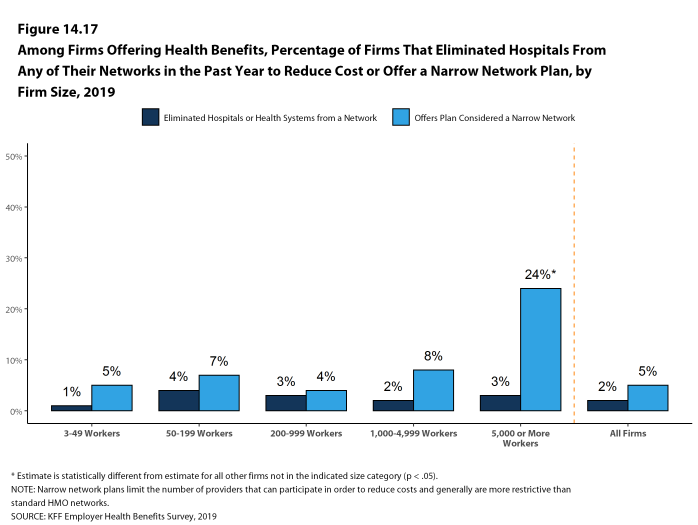
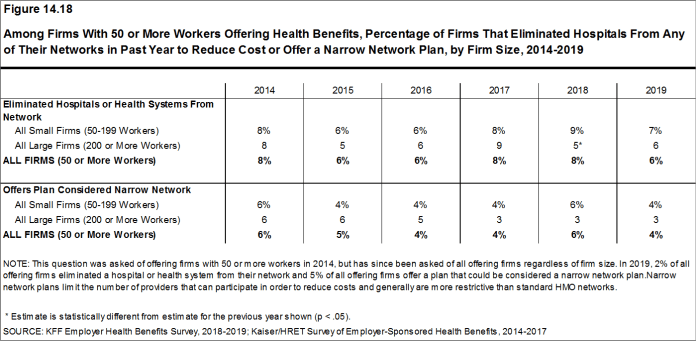
- Only a small share (2%) of firms offering health benefits say that either they or their insurer eliminated a hospital or health system from a provider network during the past year in order to reduce the plan’s cost [Figure 14.17].
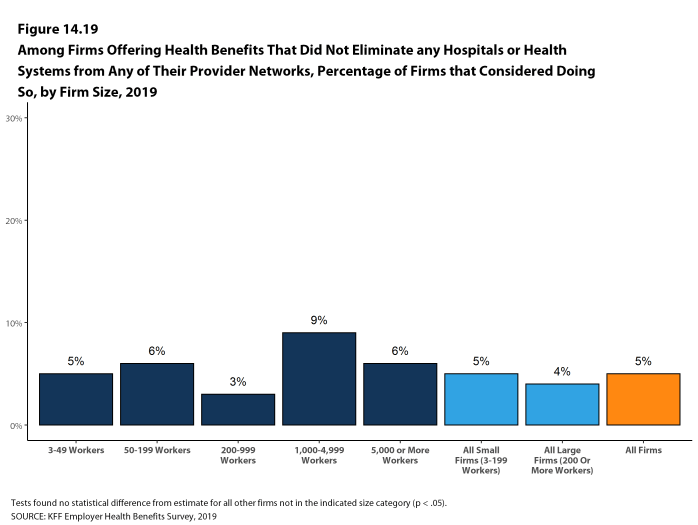
- Among firms saying that they did not eliminate a hospital or health system from a provider network in the previous year, 5% say that they considered doing so [Figure 14.19].
- Another approach that employers can use is to offer a health plan with a relatively small, or narrow, network of providers. Narrow network plans limit the number of providers that can participate in order to reduce costs and generally are more restrictive than standard HMO networks.
- Five percent of firms offering health benefits report that they offer at least one plan that they considered to be a narrow network plan, similar to the percentage reported last year [Figure 14.18].
- Firms with 5,000 or more workers offering health benefits are more likely than firms of other sizes to offer at least one plan with a narrow network [Figure 14.17].
- Five percent of firms offering health benefits report that they offer at least one plan that they considered to be a narrow network plan, similar to the percentage reported last year [Figure 14.18].
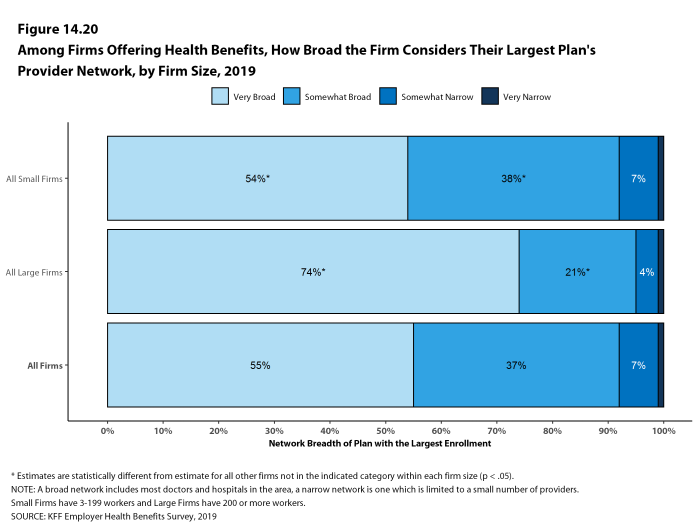
- Employers offering health benefits were asked to characterize how broad the provider network is in the plan with the largest enrollment. Fifty-five percent of firms say that the network in the plan with the largest enrollment is ‘very broad’, 37% say it is ‘somewhat broad’, 7% say it is ‘somewhat narrow’ [Figure 14.20].
- Employers offering health benefits were further asked how much cost savings the firm would need to realize to shift any of their health plans to narrower networks.
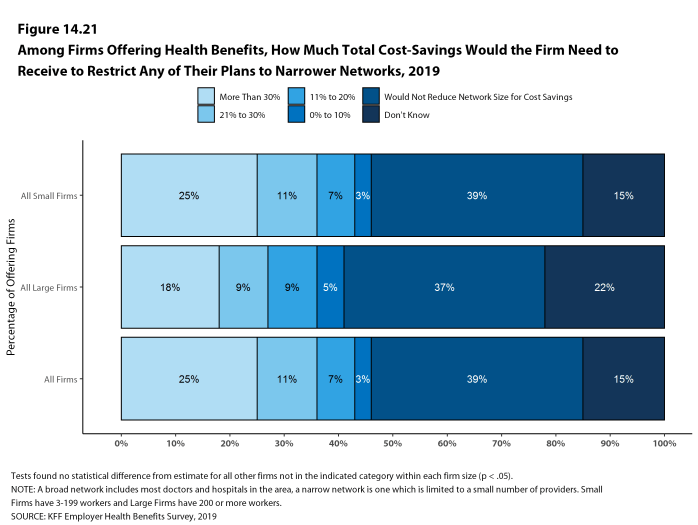
- A significant share of employers (39%) say that they would not reduce network size for cost savings, 25% say that they would need to realize savings of more than 30%, and 11% say that they would need to realize savings of between 20% and 30% [Figure 14.21].
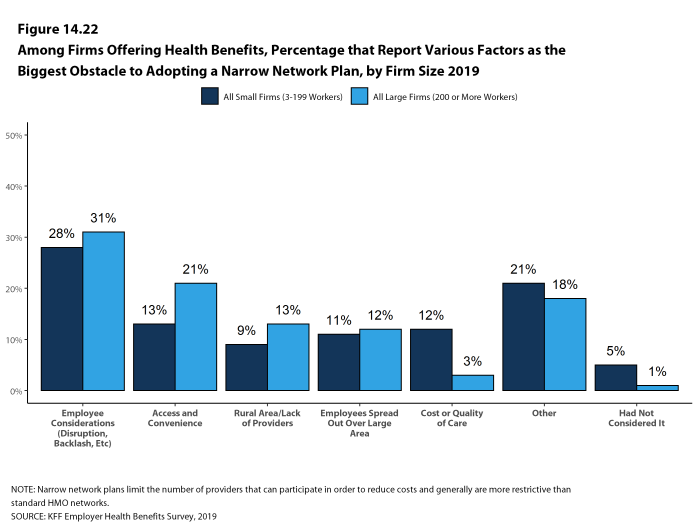
- Employers were also asked what the biggest obstacle is to adopting a narrower network plan or plans. Only 5% of employers say that they had not considered the idea of a narrower network plan, 28% cite employee considerations, such as disruption of provider relationships or employee backlash, 14% cite concerns about access or convenience for employees, 9% say that they were in a rural area and/or there was a lack of providers, 11% say that their employees were spread out over a large area, and 12% cite concerns about the cost or quality of care [Figure 14.22].
Figure 14.17: Among Firms Offering Health Benefits, Percentage of Firms That Eliminated Hospitals From Any of Their Networks in the Past Year to Reduce Cost or Offer a Narrow Network Plan, by Firm Size, 2019
Figure 14.18: Among Firms With 50 or More Workers Offering Health Benefits, Percentage of Firms That Eliminated Hospitals From Any of Their Networks in Past Year to Reduce Cost or Offer a Narrow Network Plan, by Firm Size, 2014-2019
Figure 14.19: Among Firms Offering Health Benefits That Did Not Eliminate Any Hospitals or Health Systems From Any of Their Provider Networks, Percentage of Firms That Considered Doing So, by Firm Size, 2019
Figure 14.20: Among Firms Offering Health Benefits, How Broad the Firm Considers Their Largest Plan’s Provider Network, by Firm Size, 2019
Figure 14.21: Among Firms Offering Health Benefits, How Much Total Cost-Savings Would the Firm Need to Receive to Restrict Any of Their Plans to Narrower Networks, 2019
Figure 14.22: Among Firms Offering Health Benefits, Percentage That Report Various Factors As the Biggest Obstacle to Adopting a Narrow Network Plan, by Firm Size 2019
PRESCRIPTION DRUG PRACTICE
The cost of prescription drugs is one of the largest challenges facing employers and families. Recent policy options have focused on the complexity involving the delivery and pricing of prescription drugs and the lack of transparency about the true price for individual prescriptions. We asked employers about two issues related to price transparency, prescription drug rebates and programs operated by drug manufacturers to assist patients with the cost of prescriptions.
Rebates are payments made by drug manufacturers to insurers, pharmacy benefit managers (PBMs), and employers that reduce the actual price of the drugs, usually in exchange for favorable placement on health plan formularies. Some payers are concerned that insurers and PBMs may not be passing all of the rebates they collect onto the ultimate payers. Drug manufacturers operate or fund programs to reduce the costs of prescriptions for patients. Some are aimed at lower income or uninsured patients, while others assist people with coverage who still may face high out-of-pocket costs. Some drug manufacturers provide coupons to patients who are prescribed their drugs. Coupons are discounts that prescription users can present at the pharmacy that reduce their cost sharing liability. Payers are concerned that coupons and some patient assistance programs affect the incentives employees otherwise may have to use lower cost drugs.
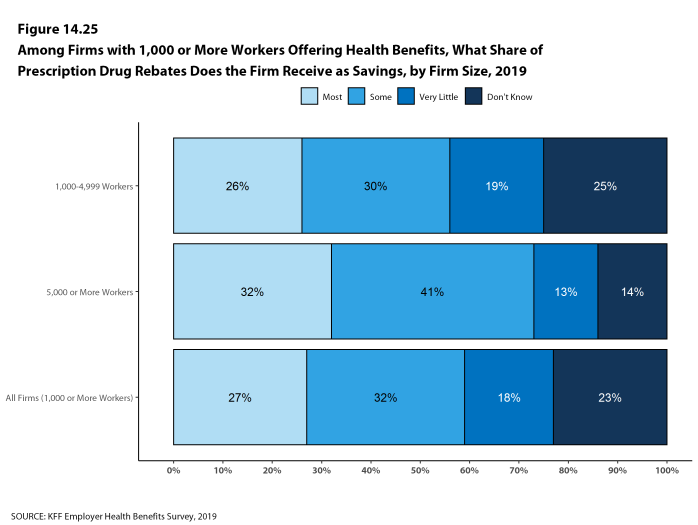
- Among employers with 1,000 or more employees offering health benefits, 27% say that they receive ‘most’ of the prescription drug rebate negotiated by their PBM or health plan, 32% say that they receive ‘some’ of the negotiated rebate, 18% say that they receive ‘very little’ of the negotiated rebate, and 23% do not know [Figure 14.25].
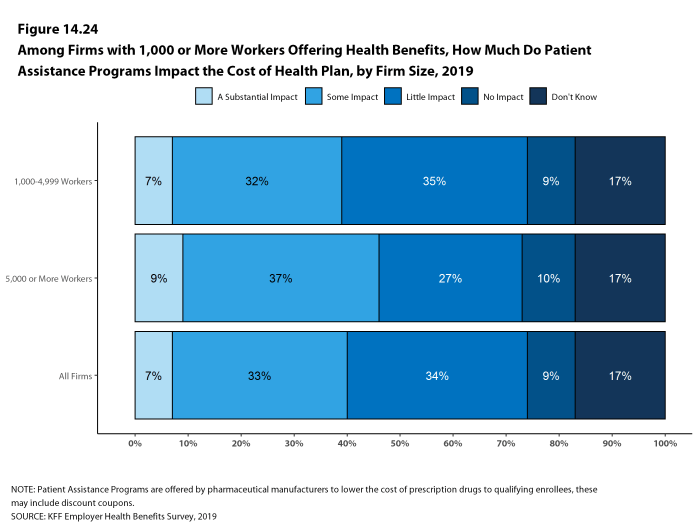
- Among employers offering health benefits with 1,000 or more employees, 7% say they believe that drug coupons and patient assistance programs have a ‘substantial impact’ on the cost of their health plans, 33% say that coupons and patient assistance programs have ‘some impact’ on plan costs, 34% say that they have ‘little impact’ on plan costs, 9% say that they have ‘no impact’ on plans costs, and 17% do not know [Figure 14.24].
Figure 14.24: Among Firms With 1,000 or More Workers Offering Health Benefits, How Much Do Patient Assistance Programs Impact the Cost of Health Plan, by Firm Size, 2019
REPEAL OF THE ACA’s INDIVIDUAL RESPONSIBILITY PROVISION
The Affordable Care Act included a tax penalty, sometimes called the Individual Mandate, for tax payers who did not have health insurance that met minimum requirements. This penalty was essentially eliminated beginning for tax year 2019. Although employers with more than 50 full-time equivalent employee are still required to offer health benefits to their full-time employees, some have predicted that the repeal of the individual mandate will reduce the share of workers electing to take up coverage at their work.
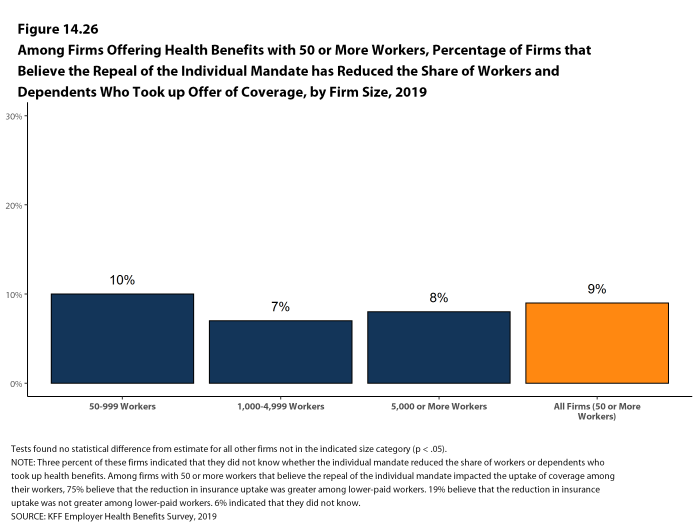
- Among firms offering health benefits with at least 50 employees, 9% say that they believed the repeal of the individual requirement reduced the percentage of employees and dependents that elected the firm’s coverage in 2019 [Figure 14.26].
- Among firms that say that they believe repeal of the Individual Mandate reduced employee take up, 75% say that the reduction in take up was greater among lower-paid employees and their dependents than among other workers.
EXCISE TAX ON HIGH COST HEALTH PLANS
The high-cost plan tax, sometimes called the “Cadillac Tax”, is an excise tax on health benefit plans with premiums and other costs that exceed specified thresholds. The tax is 40% of the amount by which plan costs exceed the specified thresholds, and is calculated with respect to each employee based on the combinations of health benefits received by that employee, including the employer and employee share of health plan premiums (or premium equivalents for self-funded plans), Flexible Spending Account (FSA) contributions, and employer contributions to health savings accounts and health reimbursement arrangement contributions. The tax was originally scheduled to begin in 2018, but has been delayed twice and recently a bill passed the House which would repeal the provision entirely.29
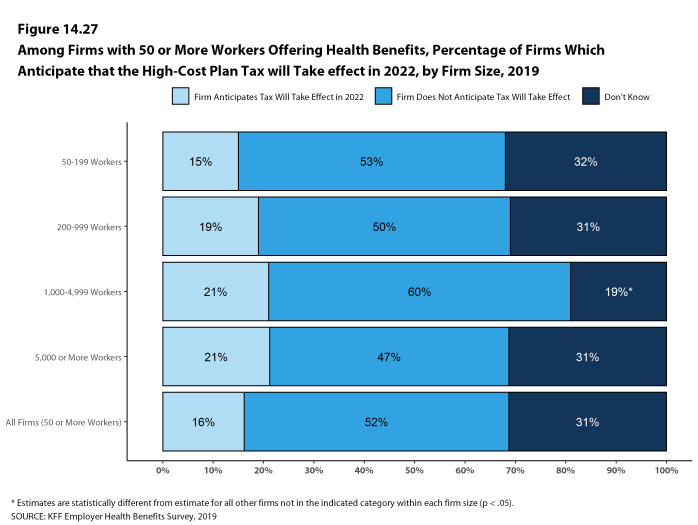
- Only 16% of firms offering health benefits with 50 or more employees say they expect the high-cost plan tax to take effect as scheduled, 52% say it will not take effect as scheduled, and 31% say they do not know.
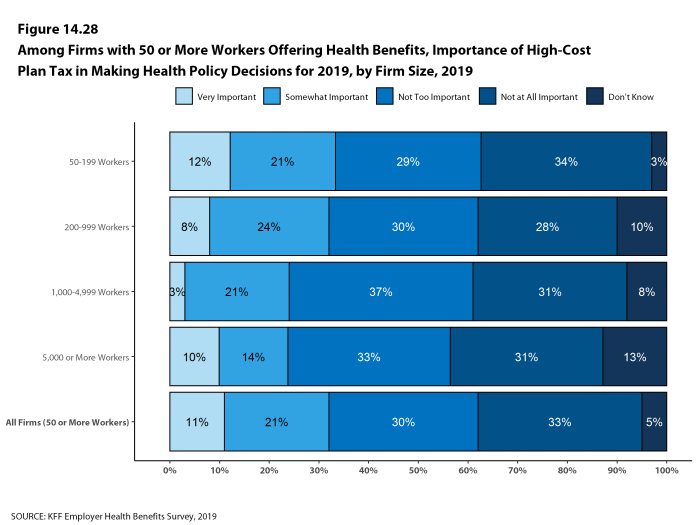
- Among firms offering health benefits with 50 or more employees, 33% say that the upcoming high-cost plan tax was ‘very important’ or ‘somewhat important’ when making health benefit decisions for 2019, while 62% say that was ‘not too important’ or ‘not important at all’ [Figure 14.28].
Figure 14.27: Among Firms With 50 or More Workers Offering Health Benefits, Percentage of Firms Which Anticipate That the High-Cost Plan Tax Will Take Effect in 2022, by Firm Size, 2019
PRIVATE EXCHANGES AND DEFINED CONTRIBUTIONS
A private exchange is a virtual market that allows employers to provide their workers with a choice of several different health benefit options, often including voluntary or ancillary benefits options. Private exchanges generally are created by consulting firms, insurers, or brokers, and are different than the public exchanges run by the states or the federal government. There is considerable variation in the types of exchanges currently offered: some exchanges allow workers to choose between multiple plans offered by the same carrier while in other cases multiple carriers participate. Private exchanges have been operating for several years, but enrollment remains modest.
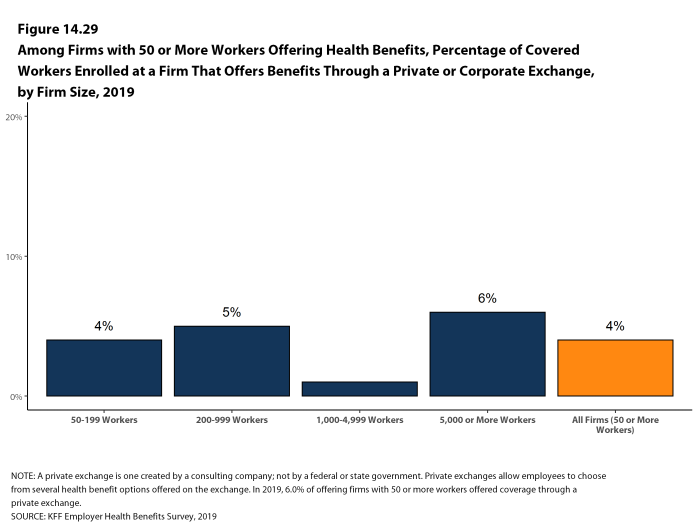
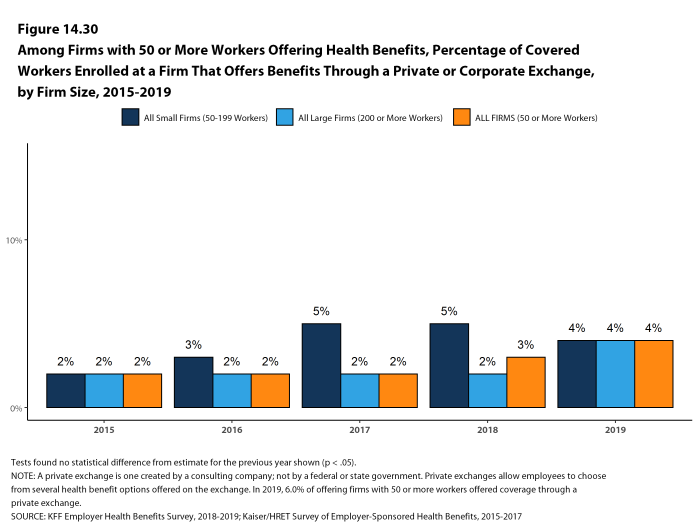
- Six percent of firms offering health benefits with 50 or more workers offer coverage through a private exchange. These firms provide coverage to 4% of covered workers in firms with 50 or more workers. These percentages are similar to those in 2018.
- Among firms with 50 or more employees offering health benefits through a private exchange, 81% say they use a defined contribution approach for their employees receiving coverage through a private exchange. A defined premium contribution is a set dollar amount offered to the employee to help pay for health
insurance.
- Among firms with 50 or more employees offering health benefits through a private exchange, 81% say they use a defined contribution approach for their employees receiving coverage through a private exchange. A defined premium contribution is a set dollar amount offered to the employee to help pay for health
Figure 14.29: Among Firms With 50 or More Workers Offering Health Benefits, Percentage of Covered Workers Enrolled at a Firm That Offers Benefits Through a Private or Corporate Exchange, by Firm Size, 2019
PROFESSIONAL EMPLOYER ORGANIZATION
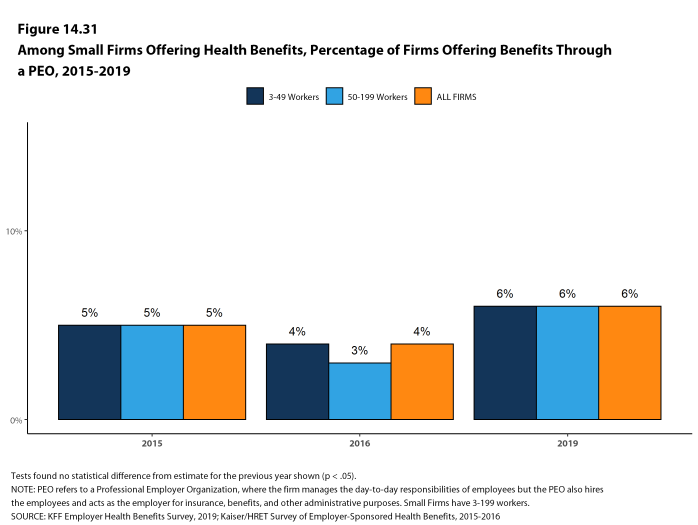
Some firms provide for health and other benefits by entering into a co-employment relationship with a Professional Employer Organization (PEO). Under this arrangement, the firm manages the day-to-day responsibilities of employees, but the PEO hires the employees and acts as the employer for insurance, benefits, and other administrative purposes. Six percent of small firms offering health benefits offer coverage through a PEO, similar to the last year this question was asked [Figure 14.31].
- Middle Class Health Benefits Tax Repeal Act, H.R. 748, 116th Cong. (2019)↩

