2015 Survey of Health Insurance Marketplace Assister Programs and Brokers
Section 5: Consumer Assistance by Health Insurance Brokers
For the first time this year, the survey included health insurance brokers who helped consumers apply for non-group coverage in the Marketplace. Most, though not all state Marketplaces provided contact information for their certified brokers. As a result, survey findings are generalizable to most states but may not reflect experiences unique to some states.
Characteristics of Marketplace brokers
The vast majority (86%) of brokers who sold non-group coverage in the Marketplace this year had done so during the first Open Enrollment period and prior to 2014. Similar to Assistance Programs, 80% of returning brokers said they thought this year’s Open Enrollment went better than the first.
The opening of ACA Marketplaces in January 2014 changed the business of selling non-group health insurance for most brokers. Most say the time involved in selling a private policy has increased relative to pre-ACA days (66%), and revenue earned per policy has decreased (57%); but most also say they sell more non-group policies overall than they did pre-ACA (60%). Forty percent of brokers say their overall revenue from the sale of non-group policies has increased, 40% say overall revenue has decreased, and 20% say it is about the same. (Figure 22)

Figure 22: Changes in Broker Work and Revenues from Sale of Non-group Policies since ACA Implementation
Most brokers who sold Marketplace coverage (79%) also sold policies outside of the Marketplace. On average, brokers report helping about 140 consumers, both in and outside of the Marketplace, with eligibility and enrollment during the second Open Enrollment period. On average, brokers helped almost twice as many clients apply for coverage through the Marketplace (91) compared to outside of the Marketplace (49).
Some brokers were busier than others. Sixty percent said they helped up to 50 Marketplace consumers during this Open Enrollment period, while 20% of brokers said they helped more than 100. (Figure 23) Returning brokers, on average, helped about 8% fewer consumers this year compared to year one.
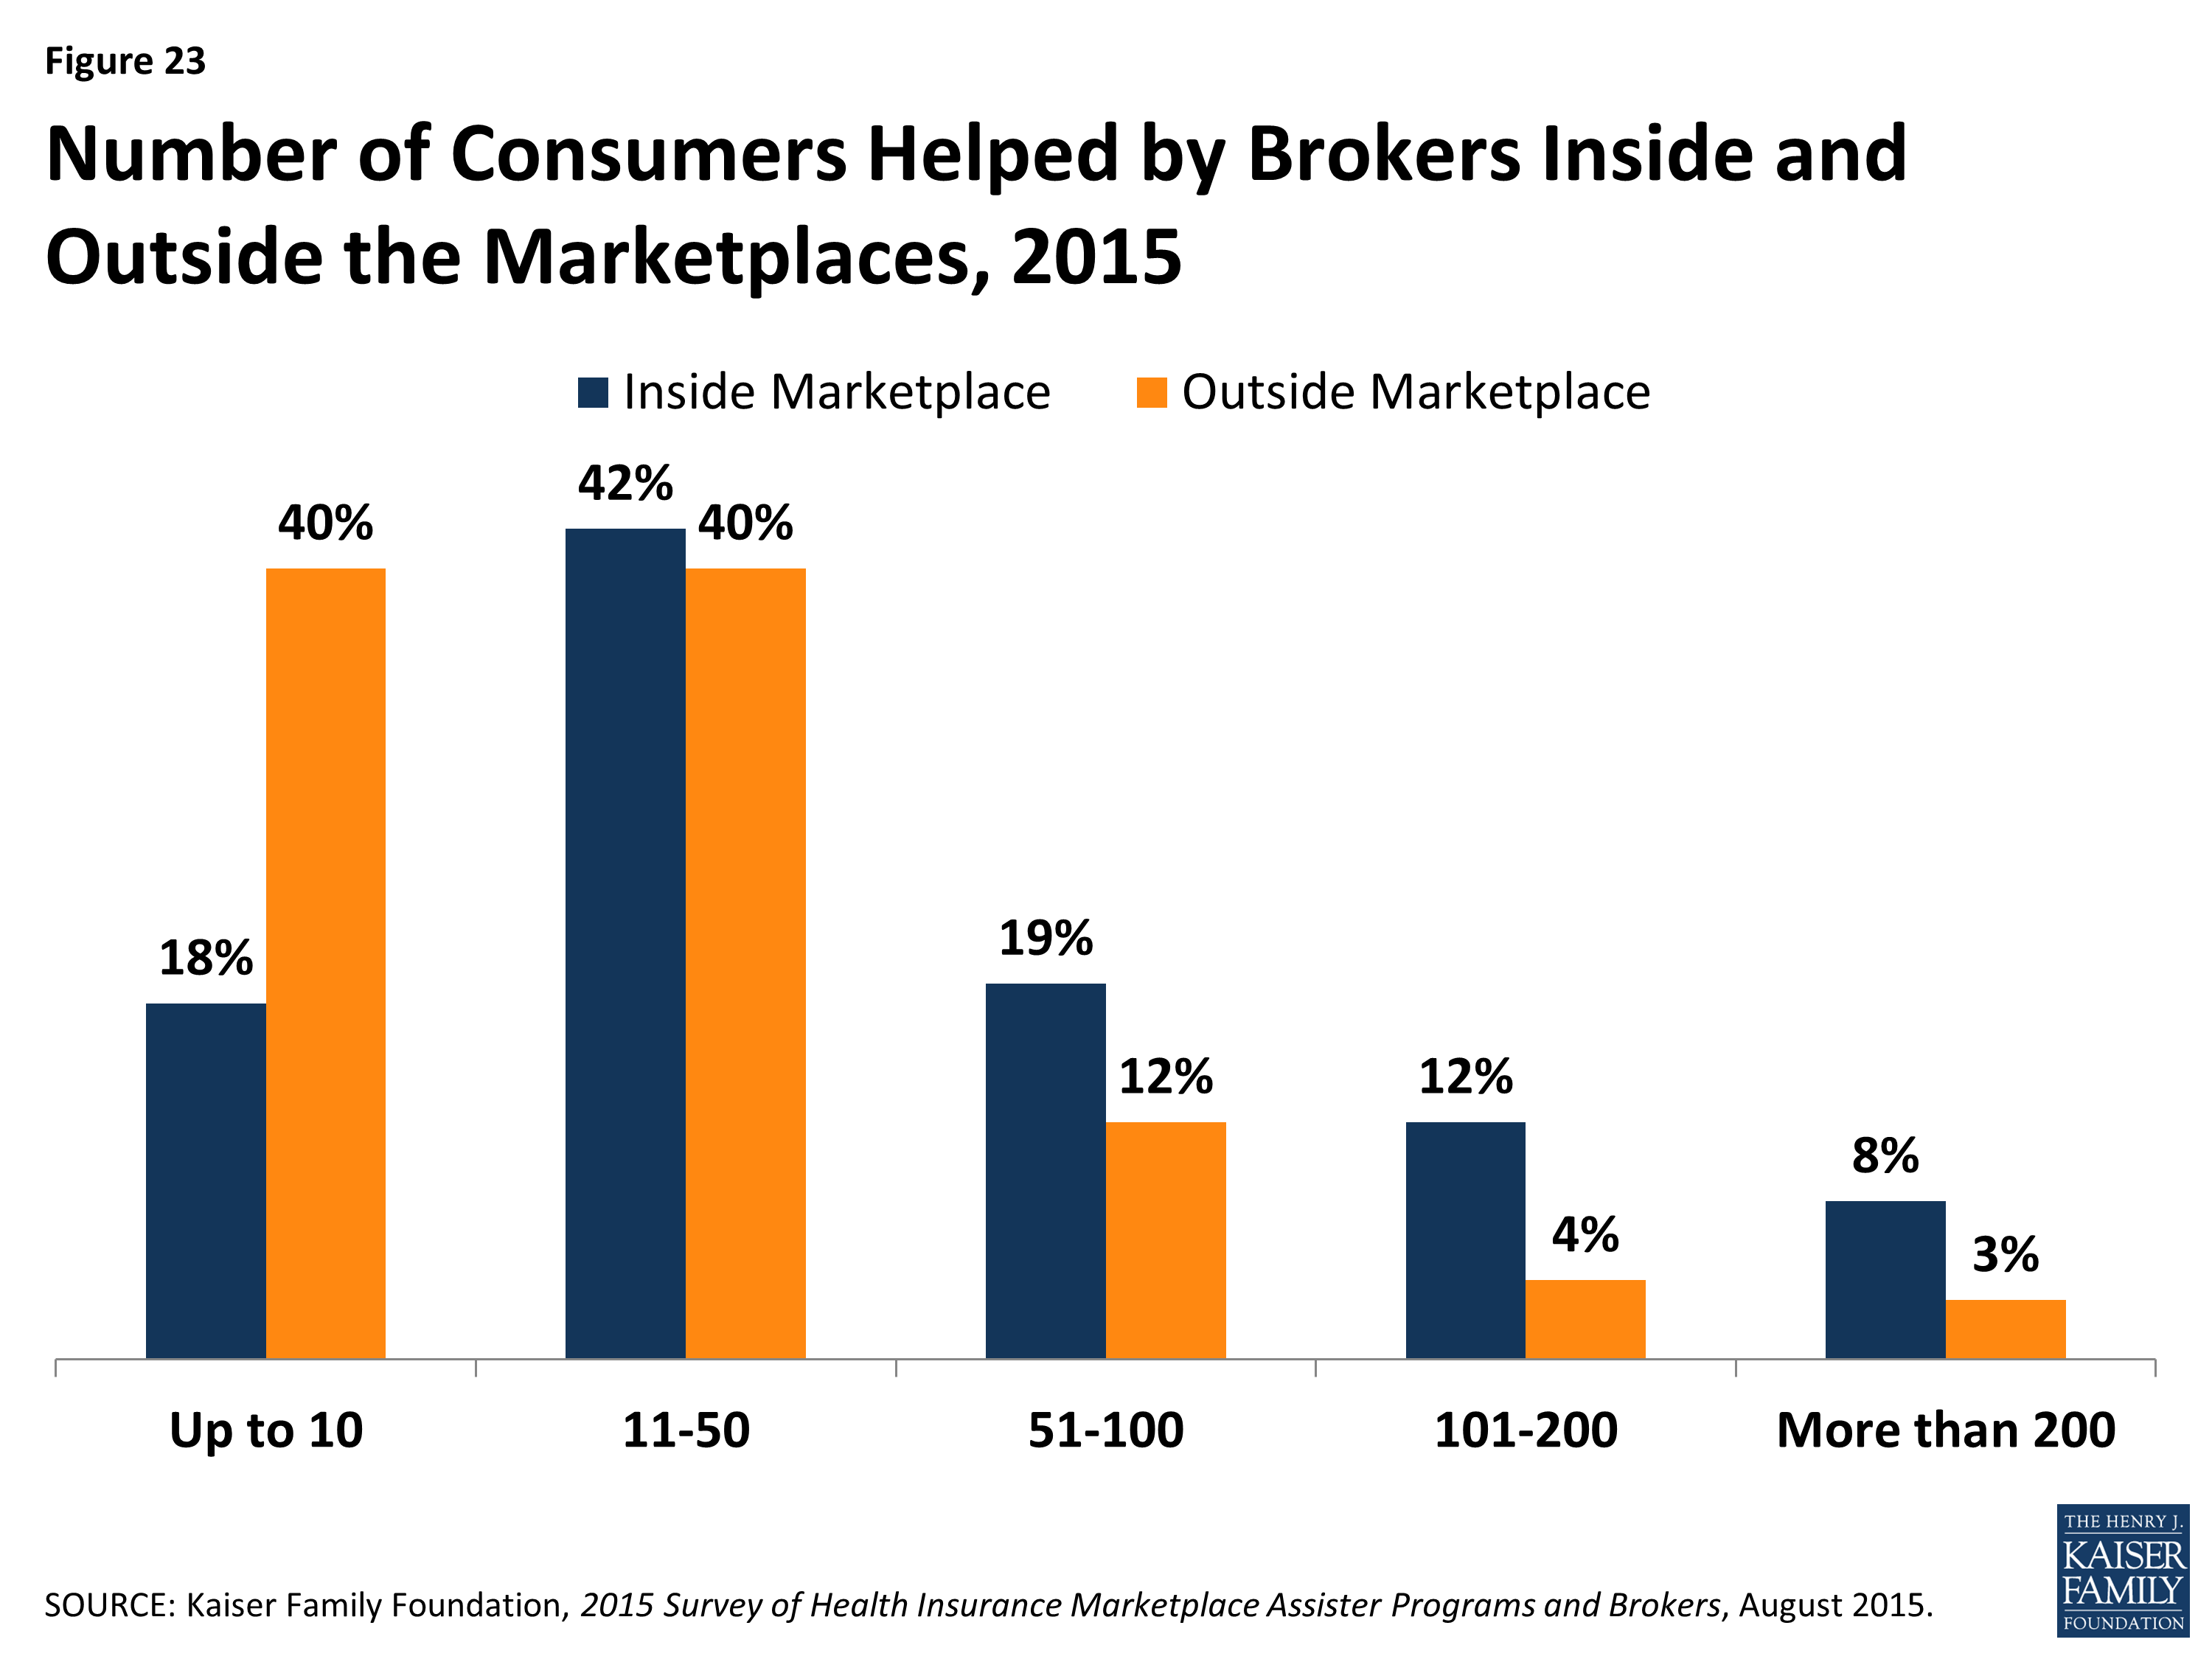
Figure 23: Number of Consumers Helped by Brokers Inside and Outside the Marketplaces, 2015
Comparing Activities of brokers and Assister Programs
Brokers generally engaged in similar consumer assistance activities as Assister Programs, but with emphasis on different services. For example, the vast majority of both brokers and Assister Programs said they help consumers compare and select QHPs, apply for premium tax credits, and resolve post-enrollment problems. But, compared to Assister Programs, brokers were less likely to engage in outreach and public education activities (33% vs 80%) and less likely to help consumers appeal Marketplace eligibility decisions (39% vs 58%). Compared to Assister Programs brokers were more likely to help small businesses select coverage (34% vs 9%).
Brokers were also less likely, compared to Assister Programs to help individuals apply for Medicaid and CHIP (49% vs 90%). Brokers who said they helped consumers with Medicaid applications were more likely to be from SBM states, where Marketplace websites are better integrated with Medicaid. However, when Marketplaces determined that consumers should complete a separate Medicaid application, brokers helped them do this less often than did Assister Programs. (13% vs. 69%)
Similar to Assister Programs, most brokers said, on average it took about one-to-two hours to help each client that was applying to the Marketplace for the first time, and about one hour to help clients who were returning to renew or change their Marketplace coverage.
Also similar to Assister Programs, most brokers said they would like to receive additional training on a range of topics, including tax related issues, Marketplace appeals and renewal procedures, Medicare, and Medicaid. And, similar to Assister Programs, brokers report that when they did need to seek technical assistance from Marketplace Call Centers, help was often inconsistent or ineffective. (Table 8)
| Table 8: Use and Effectiveness of Technical Help from Marketplace For Brokers | ||||||
| % That Sought Technical Help from Marketplace | % That Said Technical Help from Marketplace Was Effective | |||||
| Most/all of the time | Some of the time | Rarely/never | Most/all of the time | Some of the time | Rarely/never | |
| Translation Services | 14% | 10% | 76% | 48% | 20% | 32% |
| Immigration Questions | 27% | 13% | 60% | 47% | 28% | 25% |
| Tax Questions | 16% | 25% | 58% | 37% | 30% | 33% |
| Questions About QHP Choices | 4% | 6% | 89% | 44% | 25% | 32% |
| NOTE: Numbers may not sum to 100% due to rounding | ||||||
Comparing clients of brokers and Assister Programs
Similar to Assister Programs, brokers overwhelmingly said the consumers they helped had limited understanding of the ACA and limited health insurance literacy. In other respects, though, brokers served a somewhat different clientele. For example,
- 82% of brokers said few or none of their clients needed language translation help, compared to 53% of Assister Programs
- 9% of brokers said most or all of their clients lacked internet at home, compared to 35% of Assister Programs
- 49% of brokers said they helped Latino clients, compared to 77% of Assister Programs
- 50% of brokers said most or nearly all clients they served were uninsured when they sought help, compared to 83% of Assister Programs
- 8% of brokers said most or nearly all clients had income low enough to qualify for Medicaid, compared to 50% of Assister Programs.
Brokers also reported higher rates of client continuity and were more likely than Assister Programs (47% vs 29%) to say most of the consumers they helped this year were people whom they had also helped during the first Open Enrollment period.