2015 Survey of Health Insurance Marketplace Assister Programs and Brokers
Section 2: How Many Assisters Are There and How Many People Did They Help?
An estimated 30,400 Assisters together helped more than 5.9 million people during the second Open Enrollment period. Based on numbers of staff reported by survey respondents, we estimate all Programs combined employed at least 30,400 full-time equivalent (FTE) staff and volunteers to provide assistance across the country. This is roughly a 7% increase over the number of FTE Assisters in Year 1.In addition, we estimate Assisters together helped more than 5.9 million people apply for coverage and financial assistance during the second Open Enrollment period.1 Two things about this national estimate are noteworthy.
Assister Programs that received Marketplace funding or HRSA funding helped most of the consumers. Navigators and FEAPs, which comprise 15% of all Assister Programs nationwide, helped 31% of all consumers who received assistance this year. FQHCs, which account for 25% of all Assister Programs, assisted 37% of all consumers helped. By contrast, CACs, which make up 61% of all Assister Programs, assisted 31% of consumers helped. While the contribution of volunteer CAC Programs is substantial and not to be taken for granted, it was the formally funded Assister Programs – which had more resources and larger staff – that provided most of the help. (Figure 3)
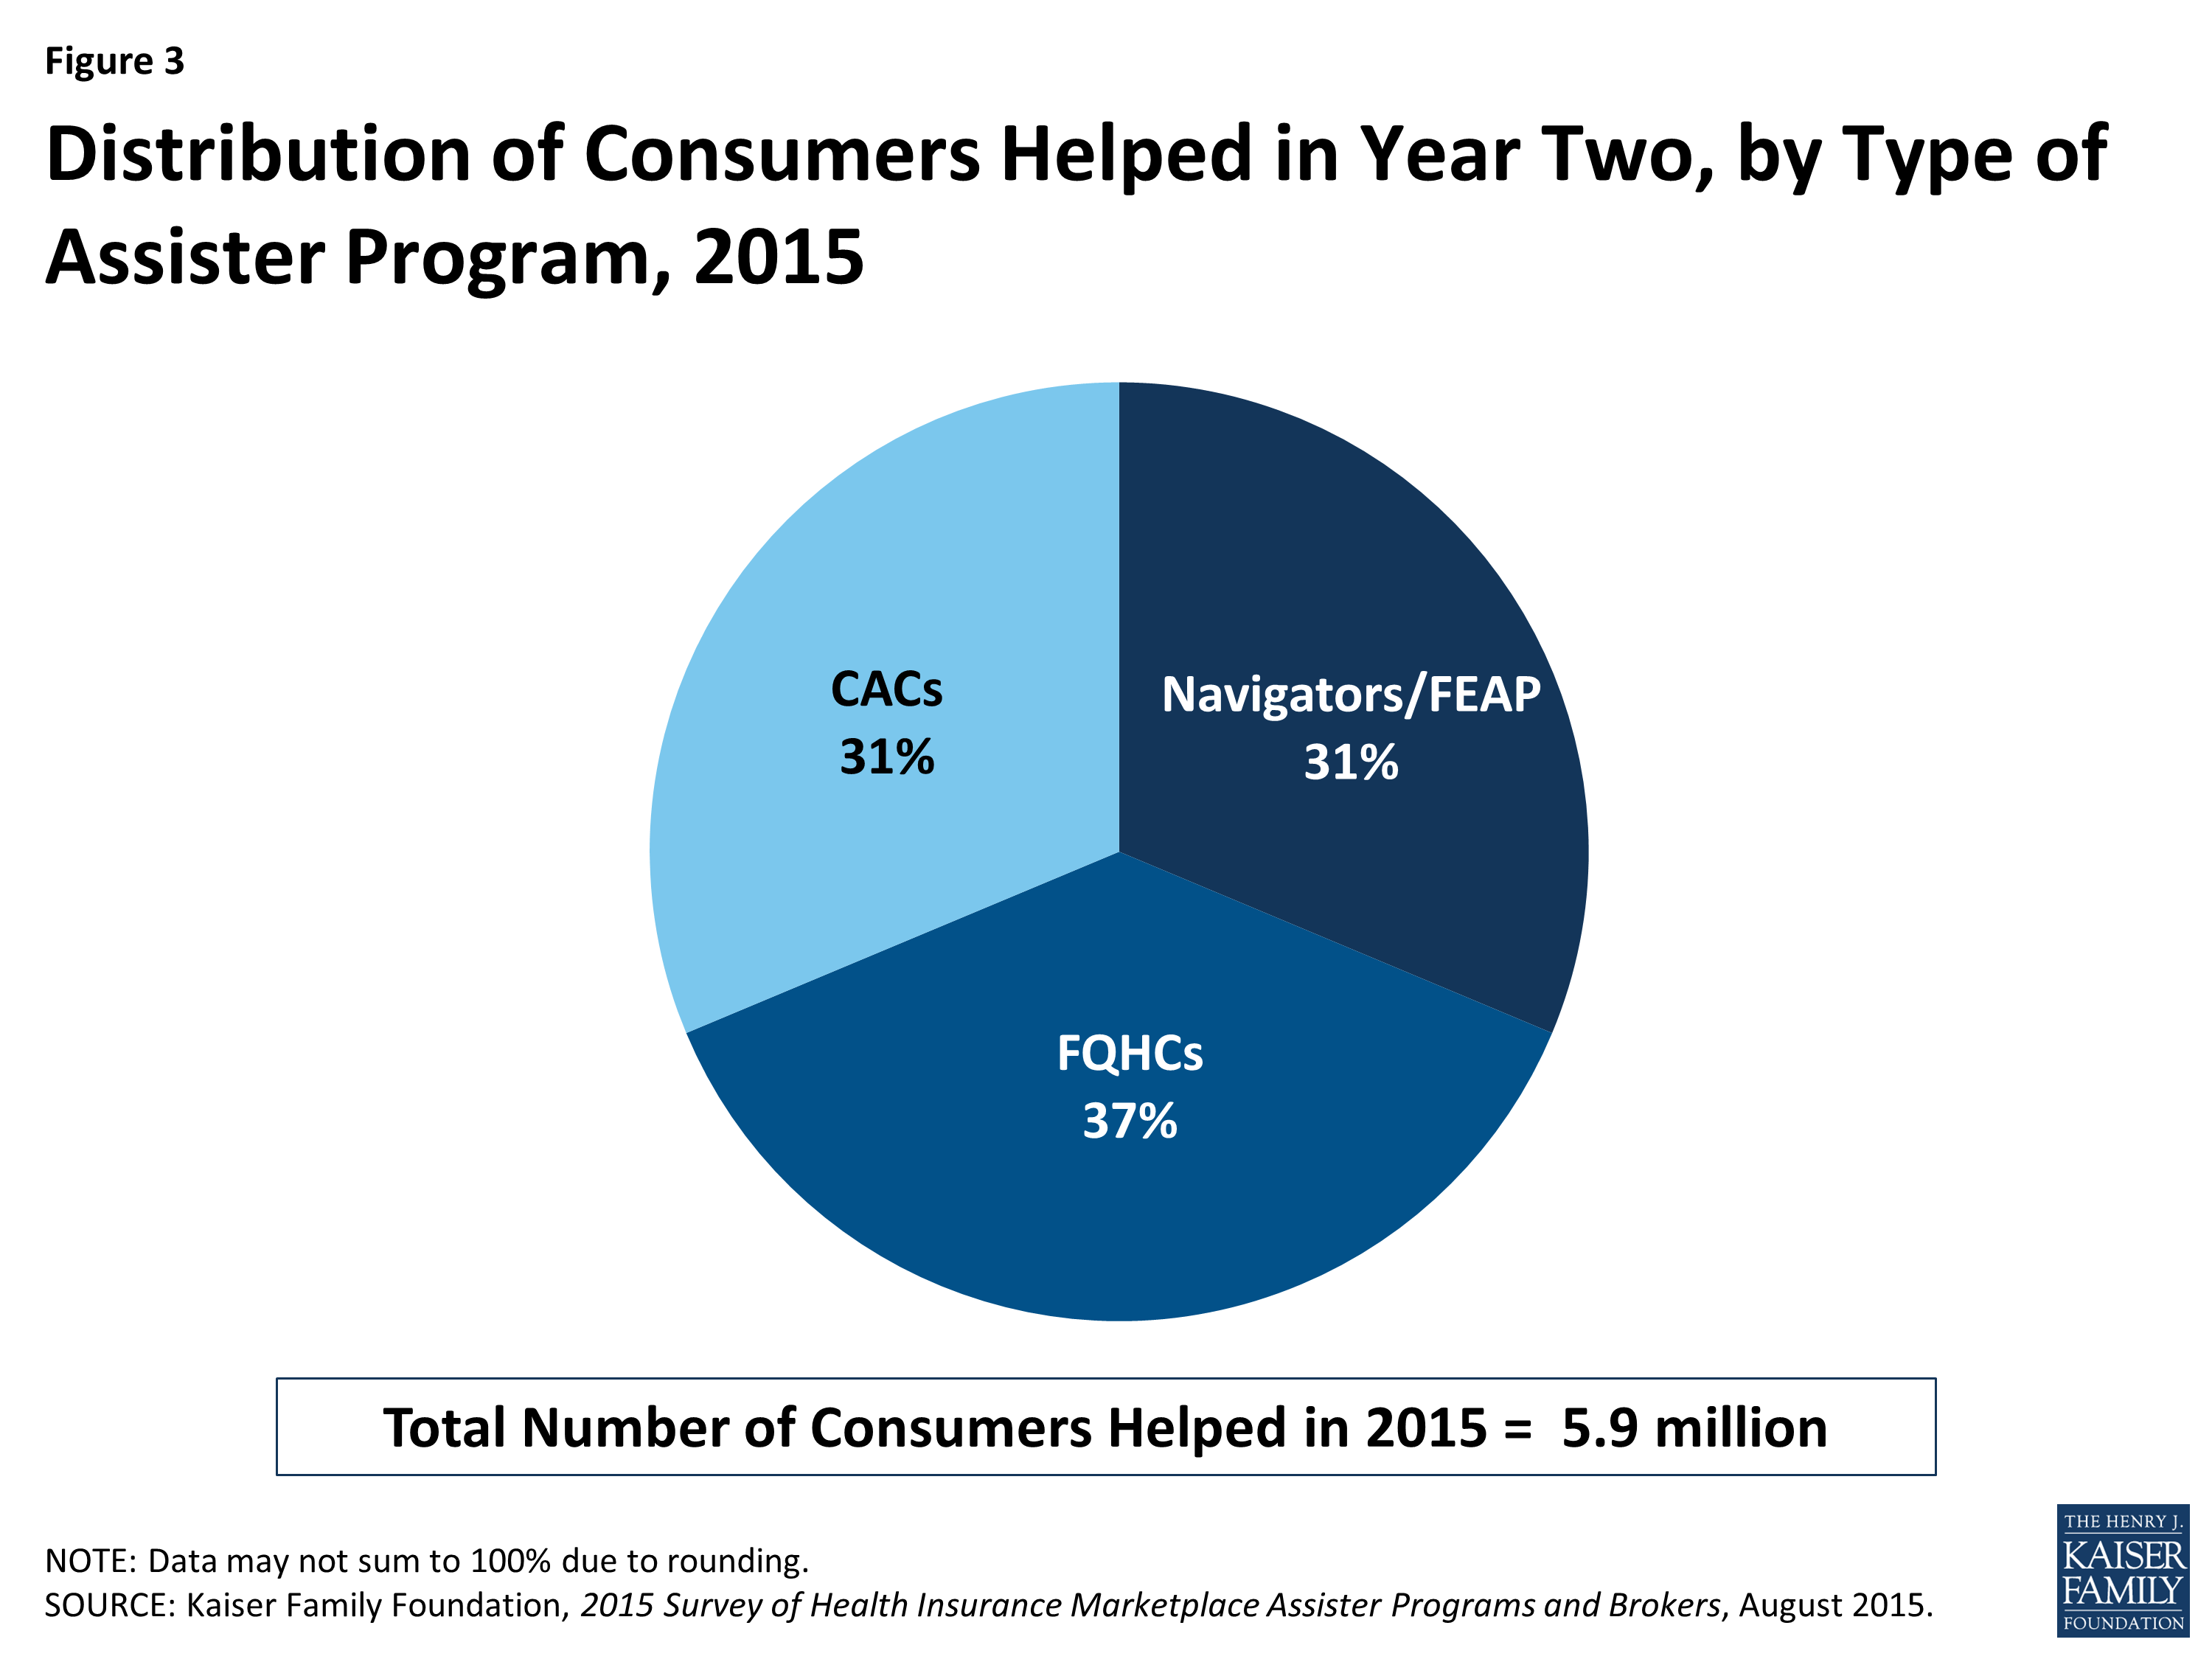
Figure 3: Distribution of Consumers Helped in Year Two, by Type of Assister Program, 2015
Returning Navigator and FQHC Programs helped about the same number of people this year, while the number helped by returning CACs declined sharply. Based on data reported by returning Assister Programs, the estimated number of people helped this year declined by 19% overall compared to last year. Returning Programs report helping 7.1 million in year one vs. 5.8 million this year. However, CAC Programs, as a group, account for most of the decline. Returning Navigators and FQHCs, together, helped about the same number of people they did last year (4.1 million in year one vs. 4 million in year two), while the number of people helped by returning CACs fell 40 percent. (3 million in year one to 1.8 million in year two). (Figure 4)
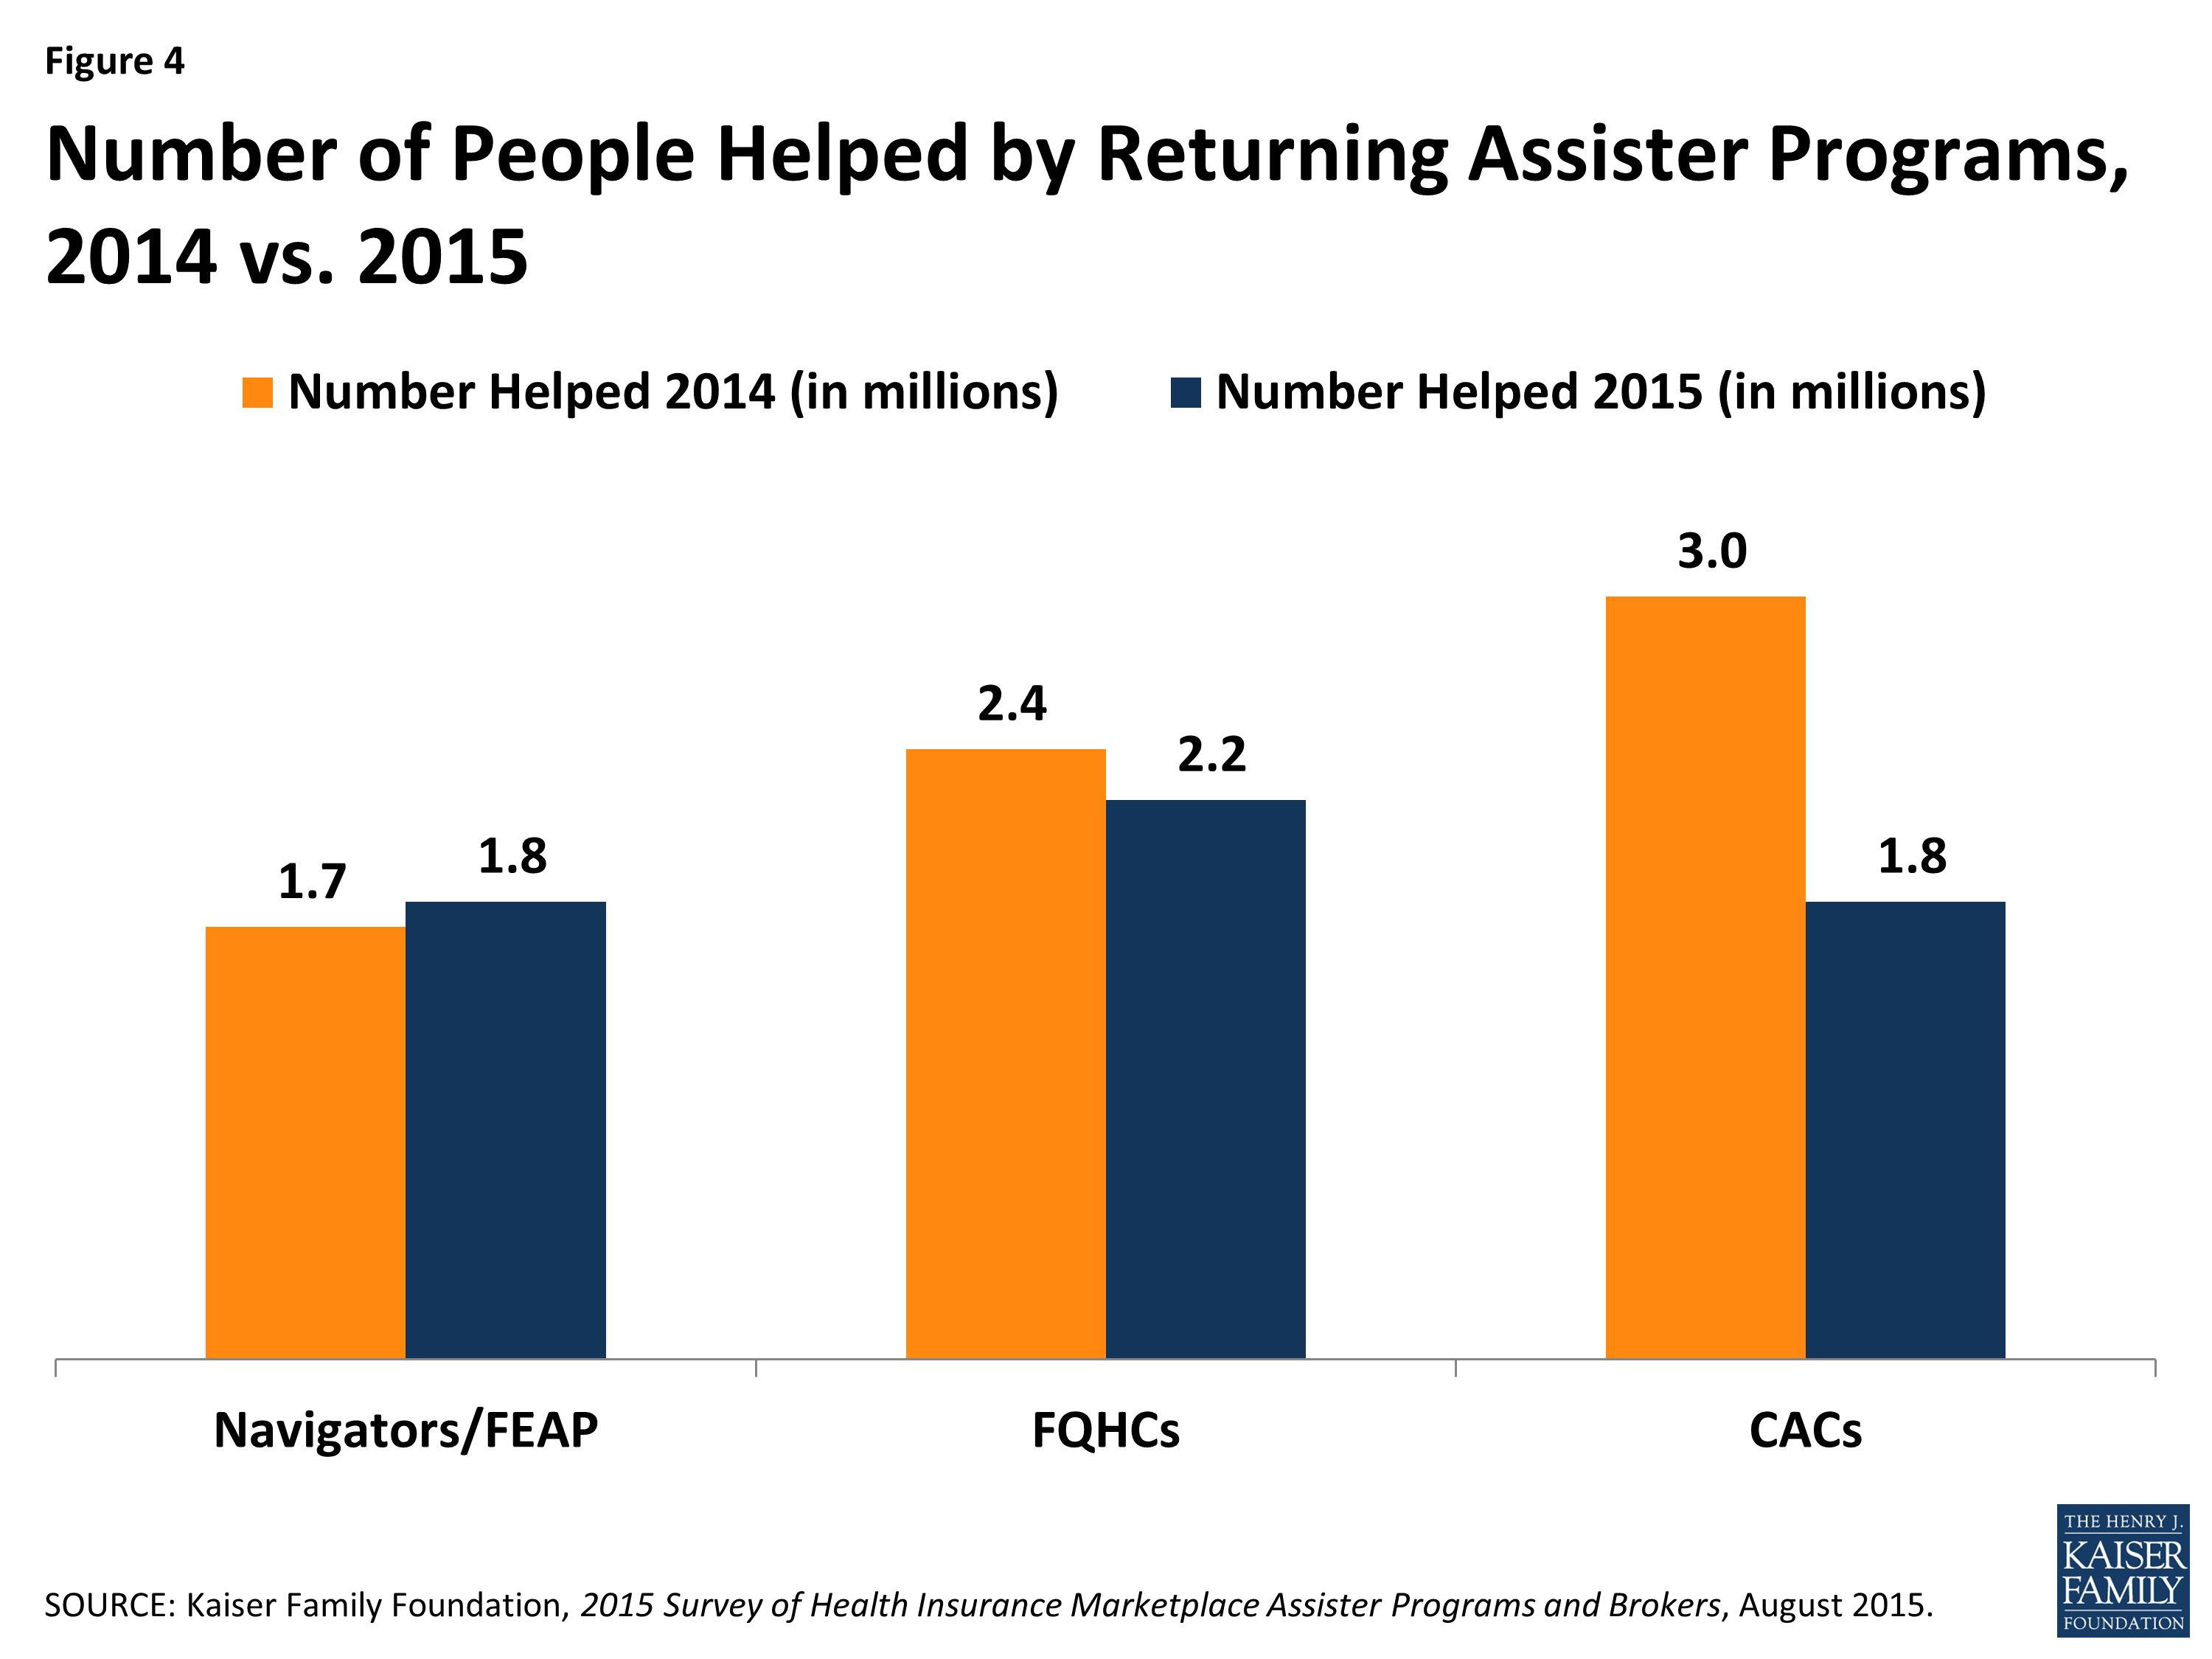
Figure 4: Number of People Helped by Returning Assister Programs, 2014 vs. 2015
Even within Program types, however, there was also variation in the number of people helped in year two vs. year one. For example, 40% of returning Navigator Programs helped more people this year compared to last year, as did 30% of returning CACs. (Figure 5)
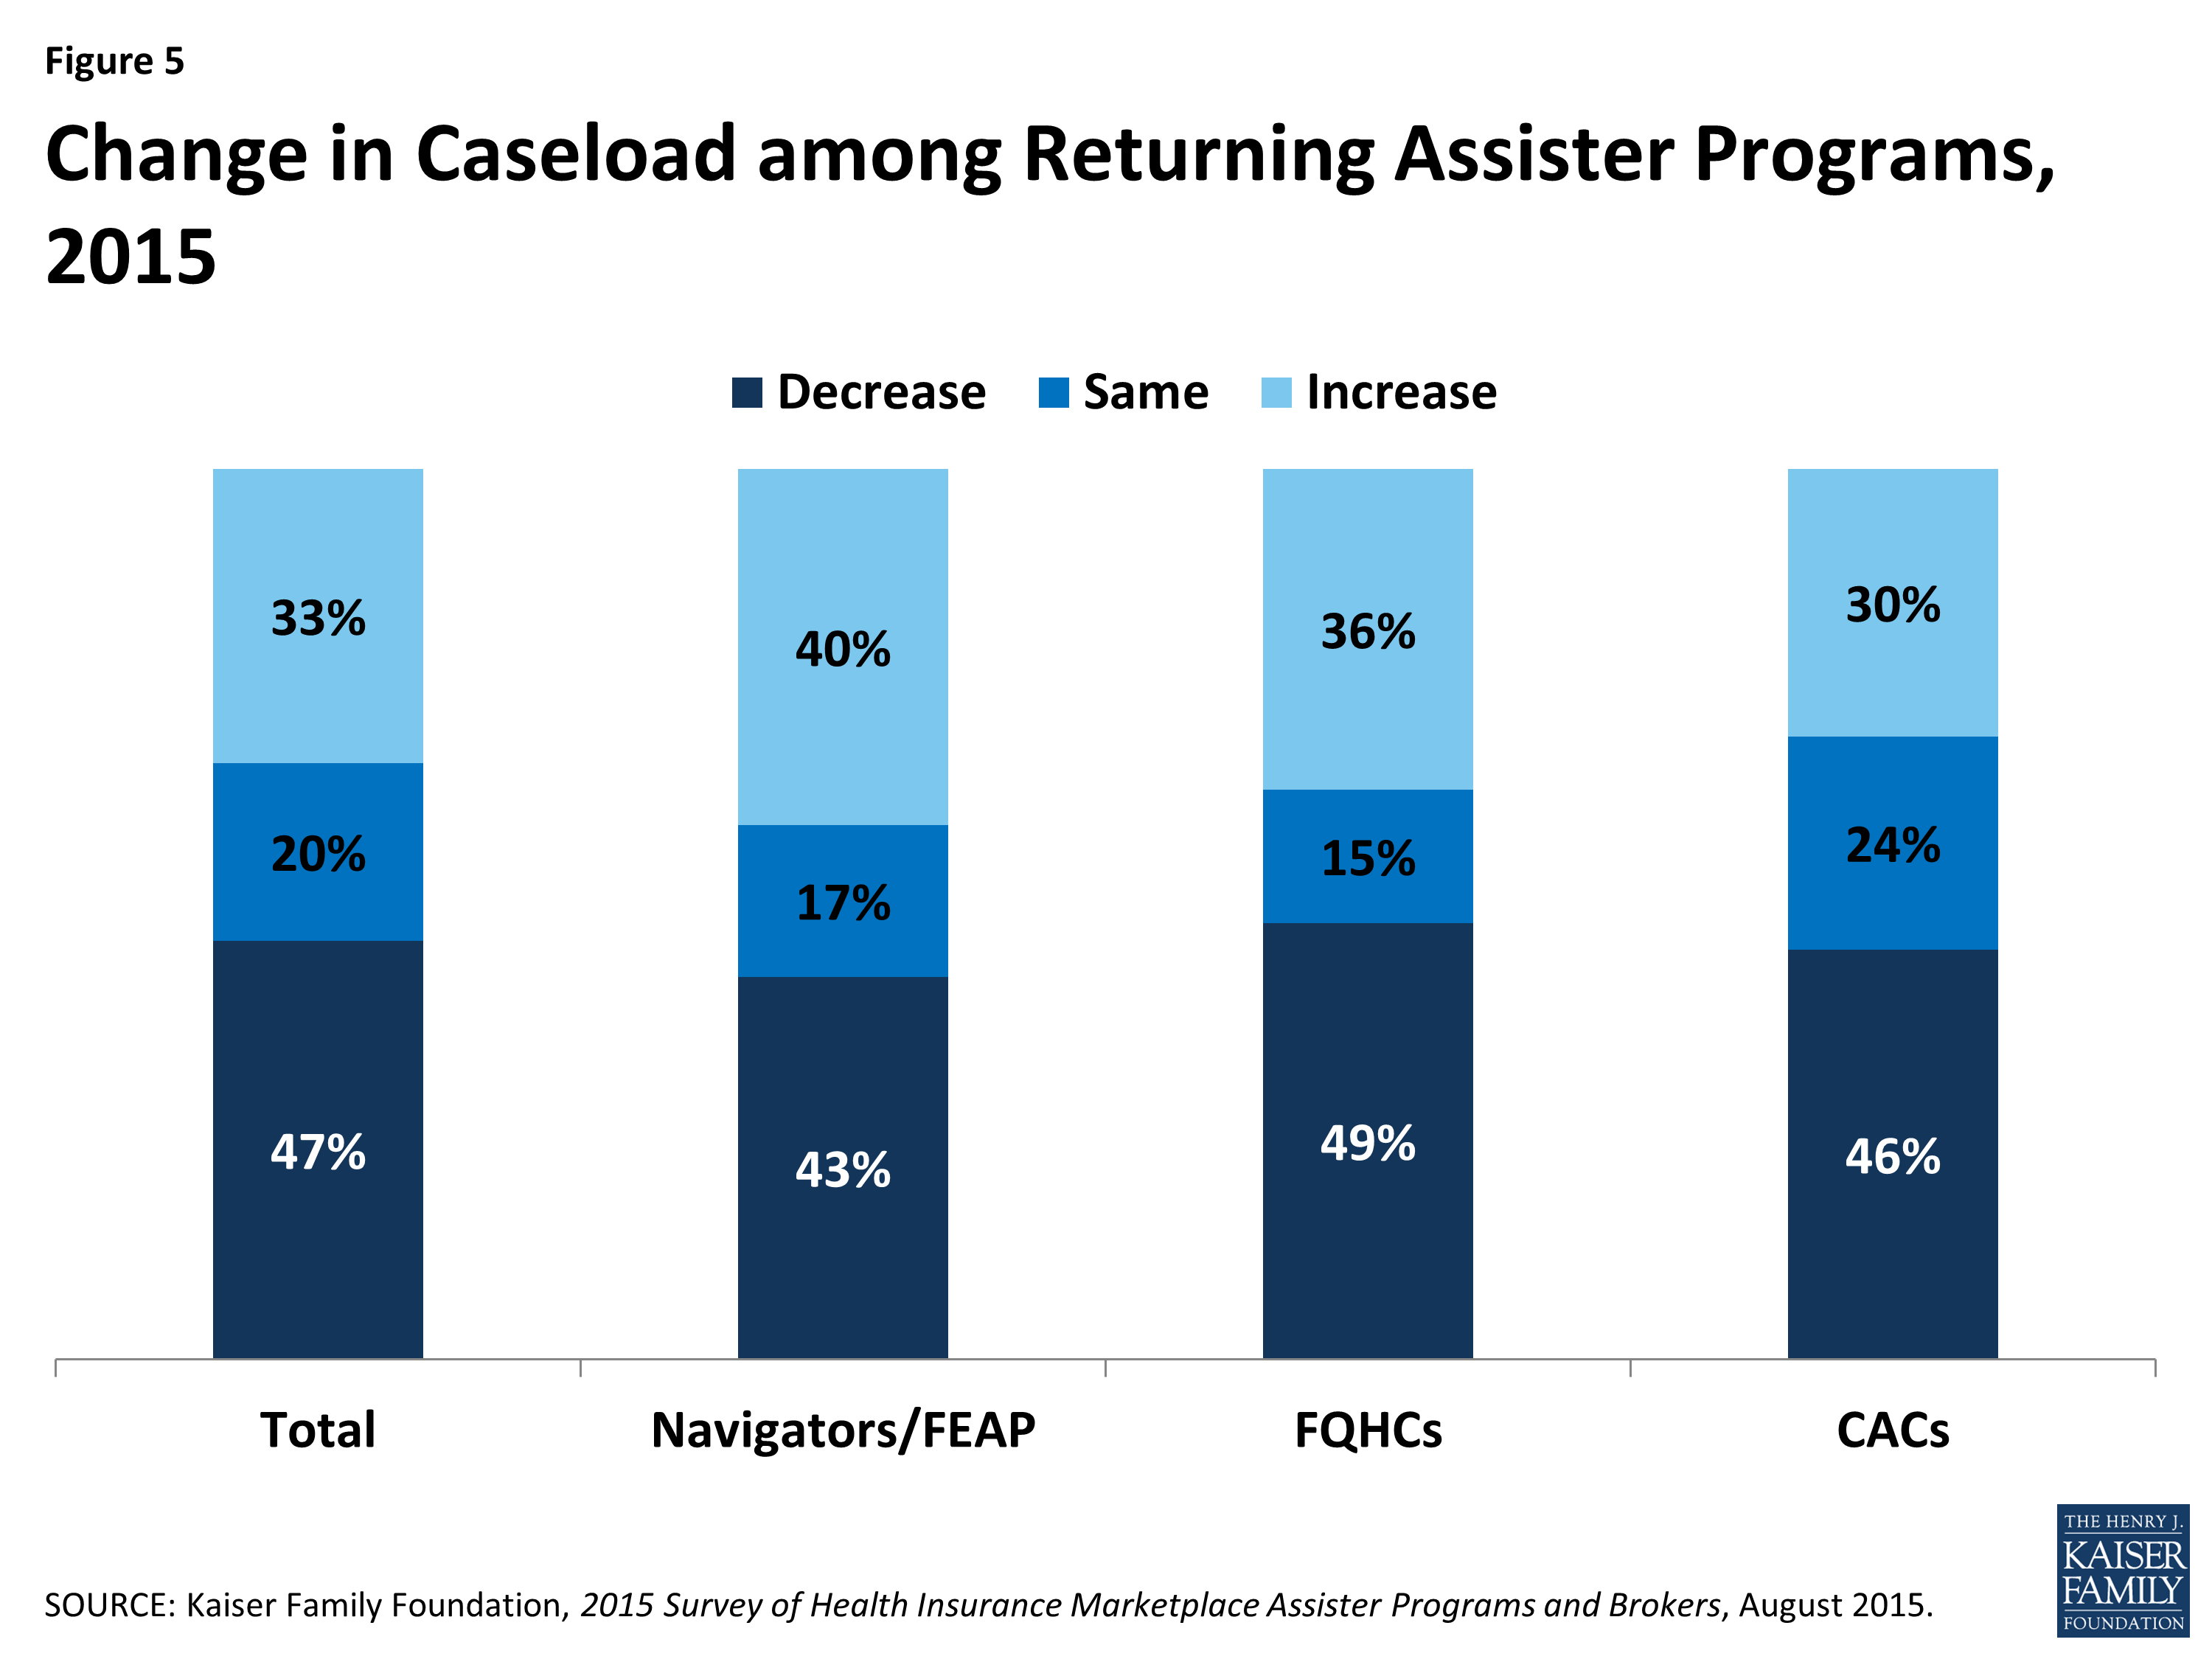
Figure 5: Change in Caseload among Returning Assister Programs, 2015
A number of differences between the first and second Open Enrollment periods could have affected the numbers of consumers helped, such as:
- The second Open Enrollment period was half as long as the first one (3 months vs. 6 months)
- Most Marketplace websites worked better in the second year, and website difficulties led many consumers to seek in-person help in year one.
- About half of all enrollees during the second Open Enrollment period (4.2 million individuals) had first enrolled the year before and fewer of these consumers may have needed help; more than 2 million returning enrollees auto-renewed their health coverage and subsidies for 2015.
- On the other hand, people who were uninsured as the second Open Enrollment period began may have been harder to reach. First year Marketplace enrollees tended to be the most motivated and capable, while those who remained uninsured were likely less informed about the ACA and/or more burdened by language barriers, transportation problems, and other limitations.
–
Our national estimate of 5.9 million consumers helped by Assister Programs this year cannot be compared to our estimate of the total number helped during the first Open Enrollment Period due to changes in the way the question was asked. However, returning Assister Programs were asked separately this year to compare the number of people they helped during the first and second Open Enrollment periods. Estimates based on those responses are not impacted by the survey method changes. The responses by returning assisters suggest a 19 percent decline in number of people helped this year, compared to last year.
Consumer Assistance resources continue to be unevenly distributed across Marketplaces. Forty-seven percent of all Assisters nationwide worked in the 16 states and the District of Columbia with a SBM and 53% worked in the 34 states with a FFM or FPM, while 29% of the uninsured in 2014 resided in SBM states and 71% lived in FFM or FPM states. (Figure 6) As a result FFM and FPM states, on average, have fewer than half the number of Assisters per 10,000 uninsured compared to SBM states. A similar distribution was observed during year one. (Figure 7)
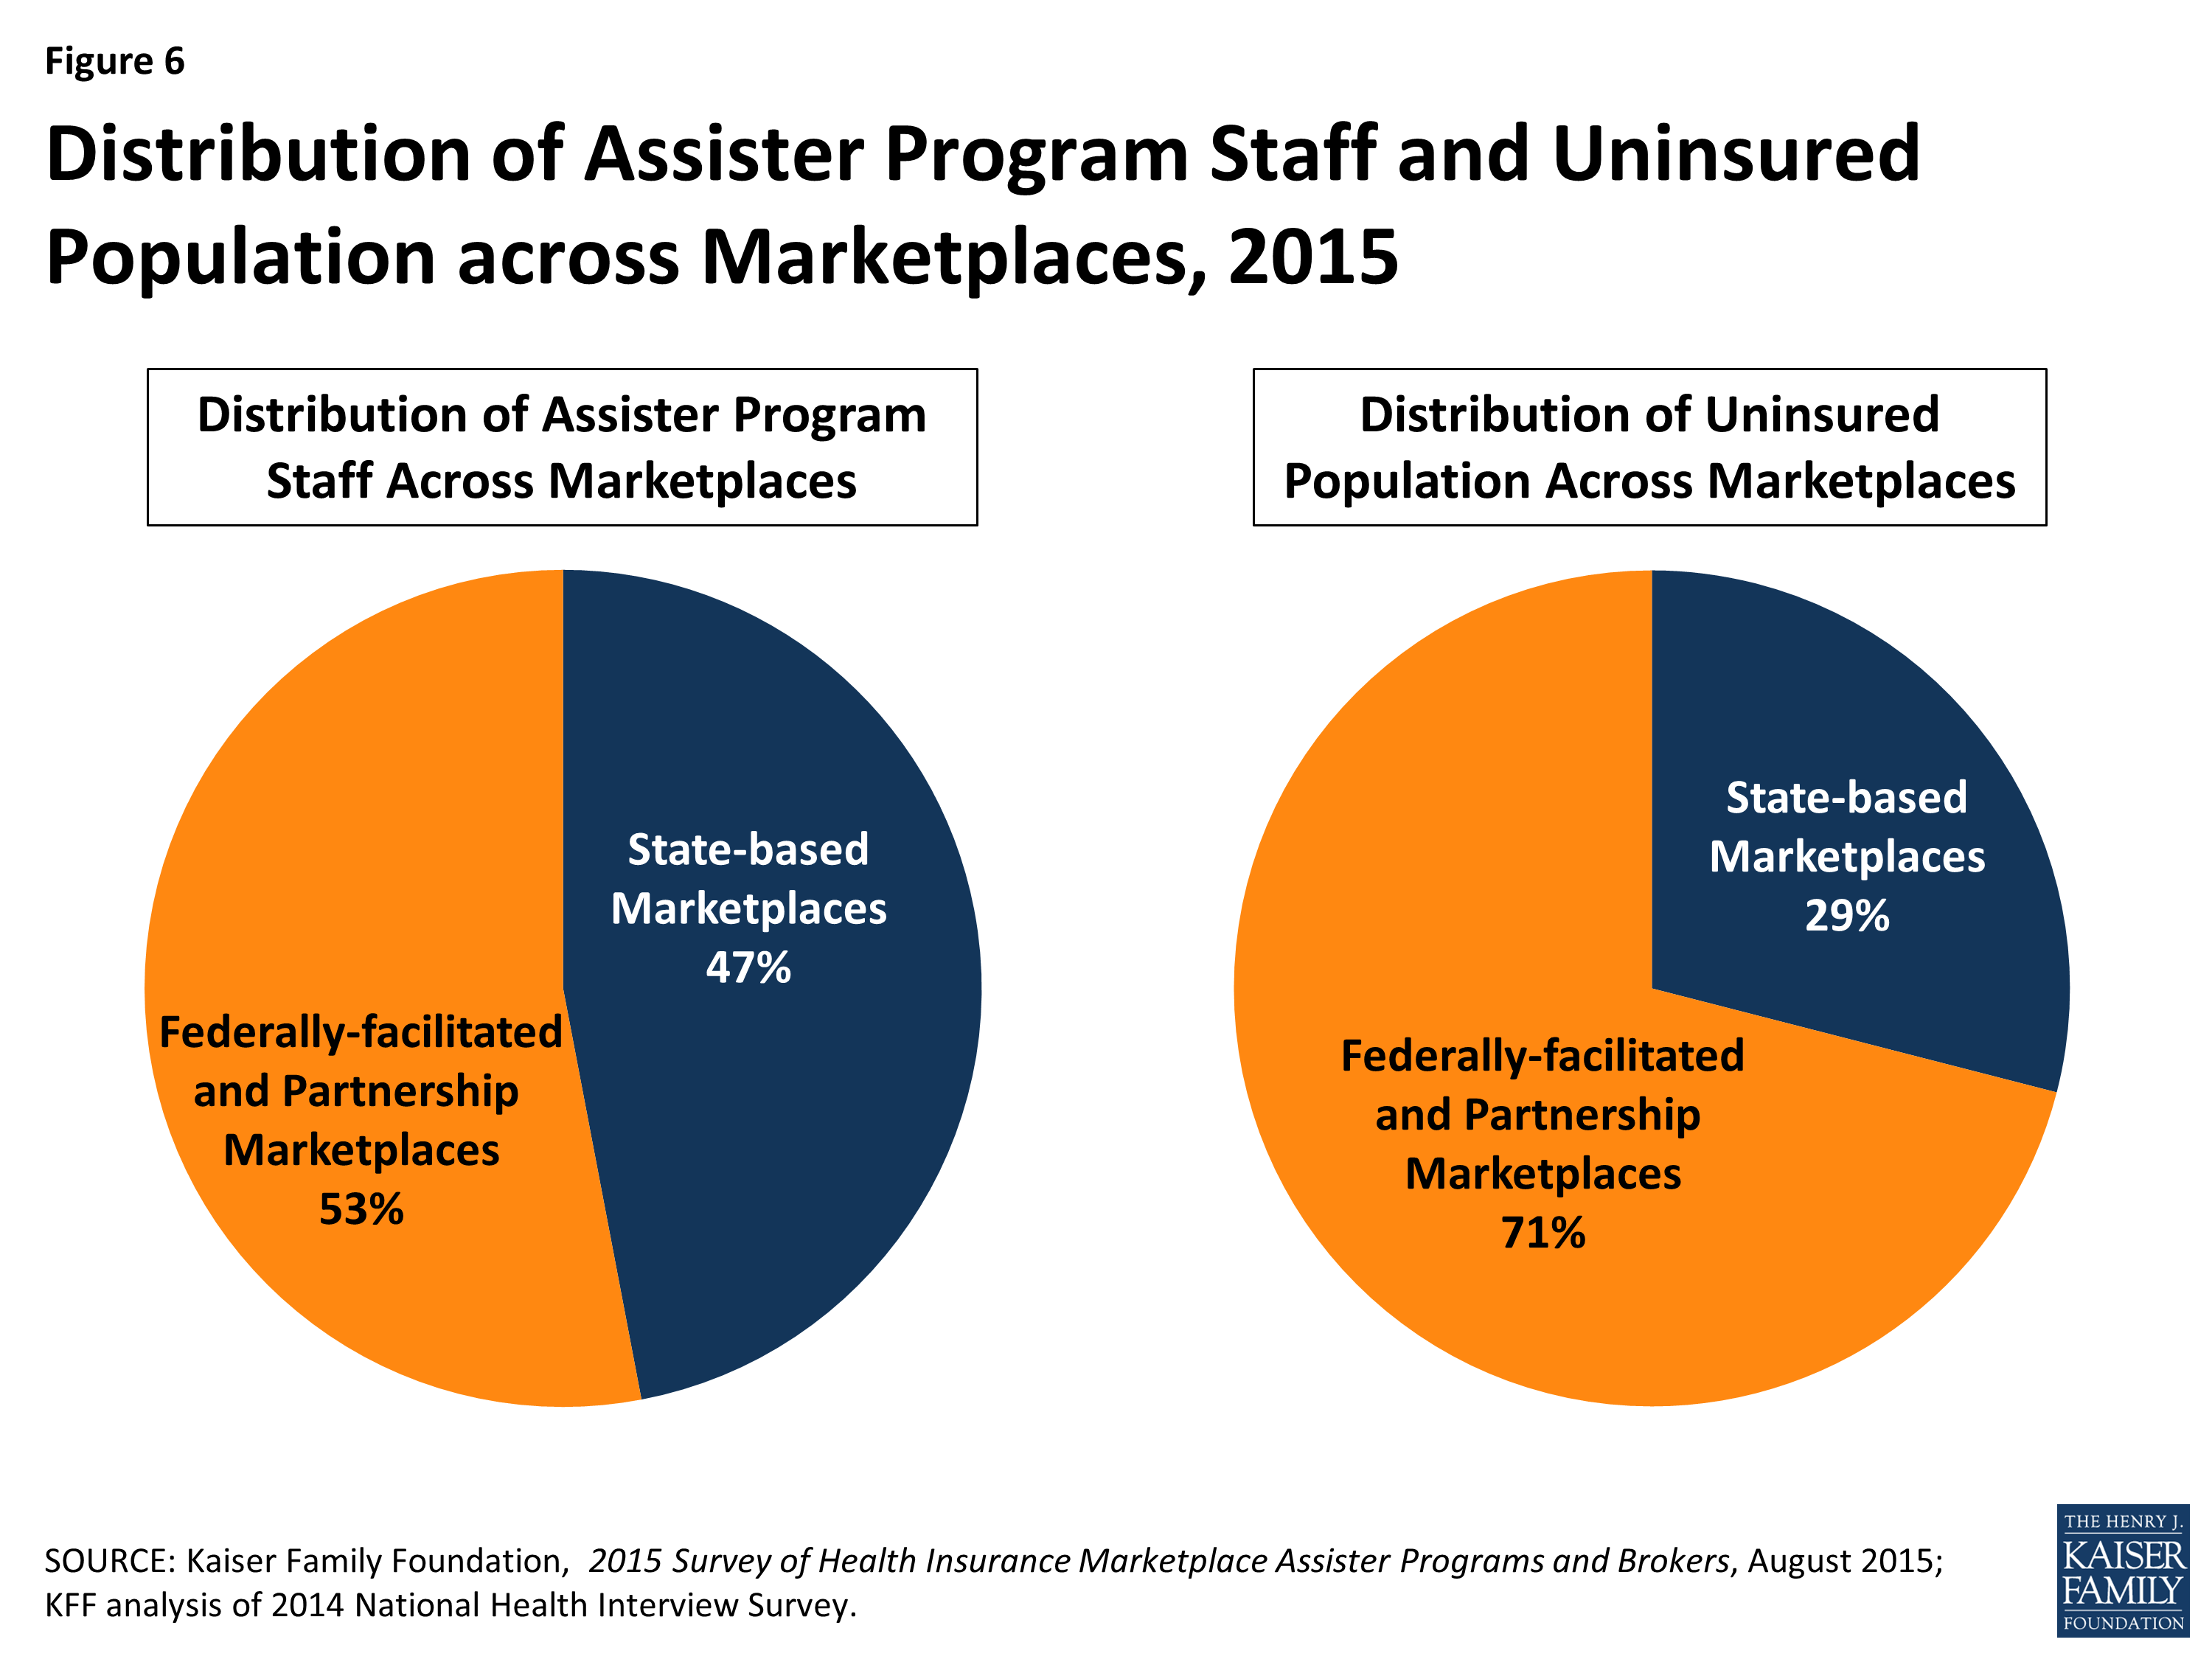
Figure 6: Distribution of Assister Program Staff and Uninsured Population across Marketplaces, 2015
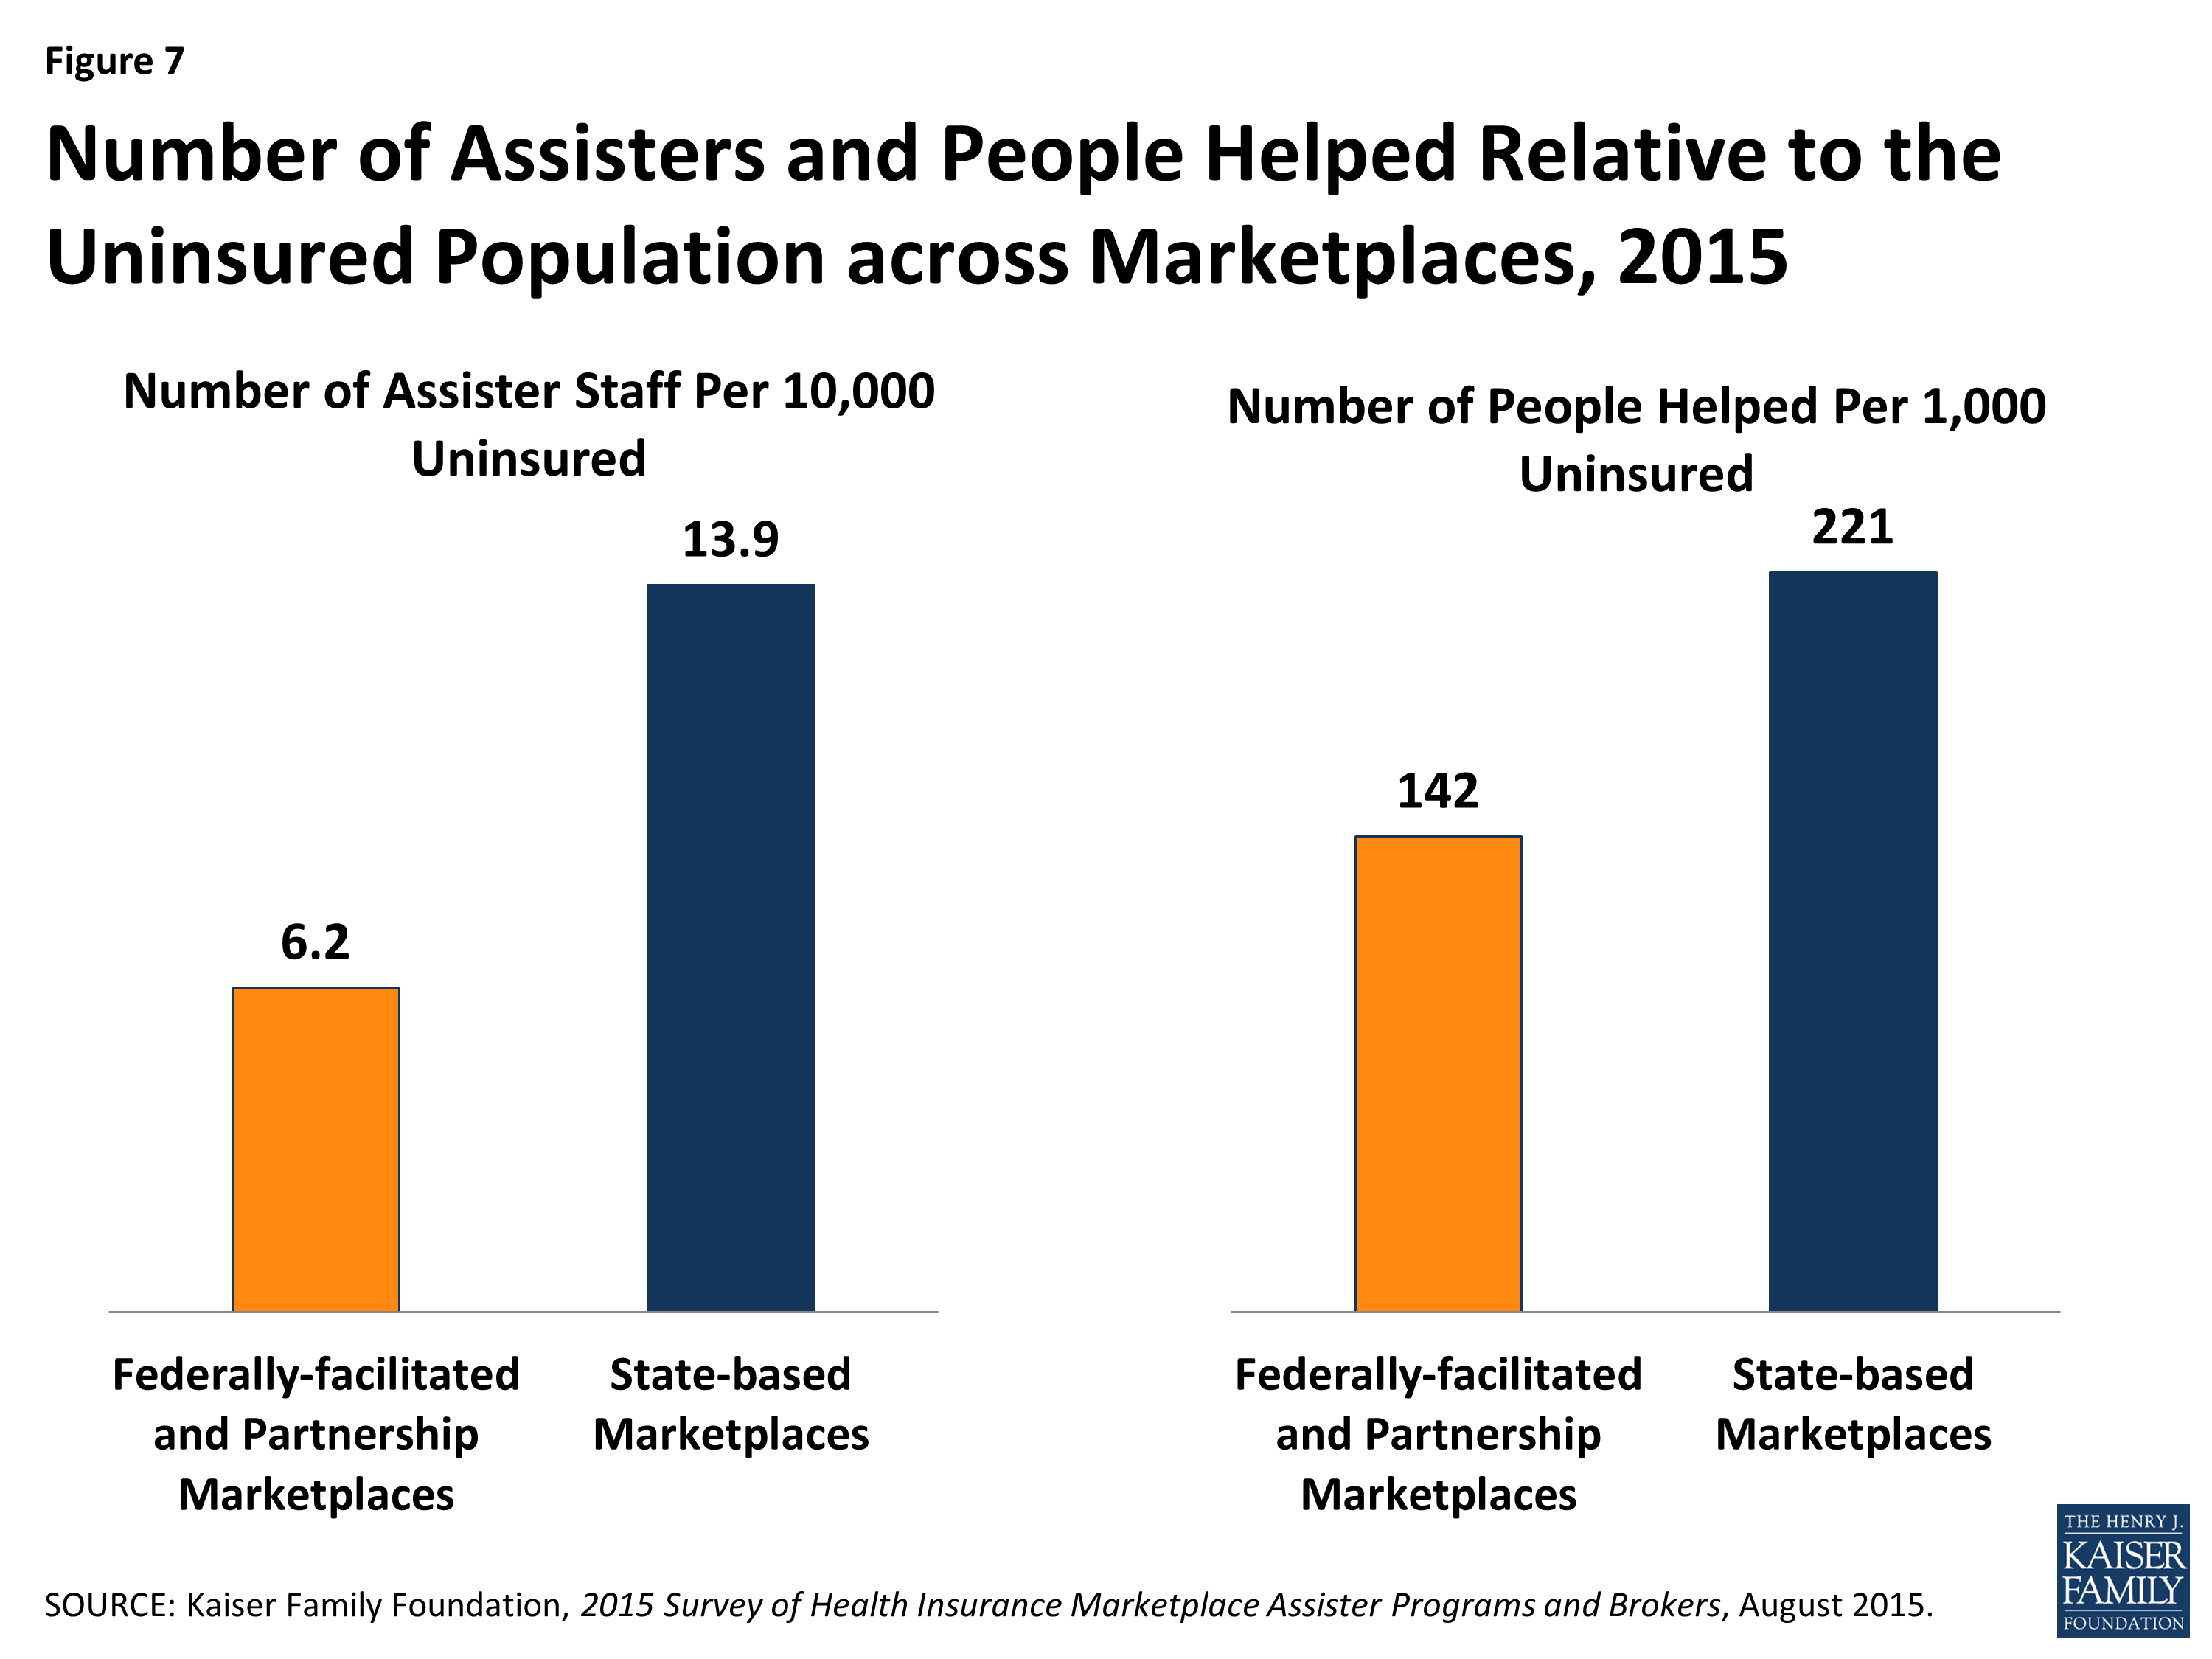
Figure 7: Number of Assisters and People Helped Relative to the Uninsured Population across Marketplaces, 2015
Relative to the number of uninsured, more people were helped in SBM states compared to FFM/FPM states. Of the estimated 5.9 million people helped during the second Open Enrollment period almost 3.7 million, or 62%, lived in FFM/FPM states and almost 2.3 million, or 38%, were in SBM states. Expressed relative to the uninsured population, an estimated 142 people were helped per 1,000 uninsured in FFM/FPM states, and 221 were helped per 1,000 uninsured in SBM states. (Figure 7) This difference is likely driven in part by the disparity in Assister staff across SBM and FFM/FPM states. Another factor may be that a smaller share of FFM states had expanded Medicaid. The Medicaid coverage gap may have discouraged some poor uninsured from seeking help if they thought they would not qualify for coverage.