2015 Survey of Health Insurance Marketplace Assister Programs and Brokers
Section 1: Characteristics of Assister Programs
In all, more than 4,600 Marketplace Assister Programs were established to help consumers during the second Open Enrollment. This total is based on Program data provided by all state and federal Marketplaces, and represents a 3% increase in the number of Programs established during the first Open Enrollment.
Once again, most Assister Programs that help people enroll in the Marketplace are not funded by Marketplaces. Navigators, which are funded directly by the Marketplace, comprise about 14% of total Programs. Assister Programs in FQHCs, primarily supported by HRSA grants, comprised another 25% and CAC Programs were 61%. Mostly CACs are voluntary Programs, supported by their sponsoring non-profit organizations, foundations, and other sources. Marketplaces are required to recognize and certify qualified CACs, but are not required to provide them financial support. (Figure 1) This distribution of Assister Program types is somewhat different from that during the first Open Enrollment period, and includes a larger proportion of CACs, largely because of a reclassification of Assister Program types in California.1
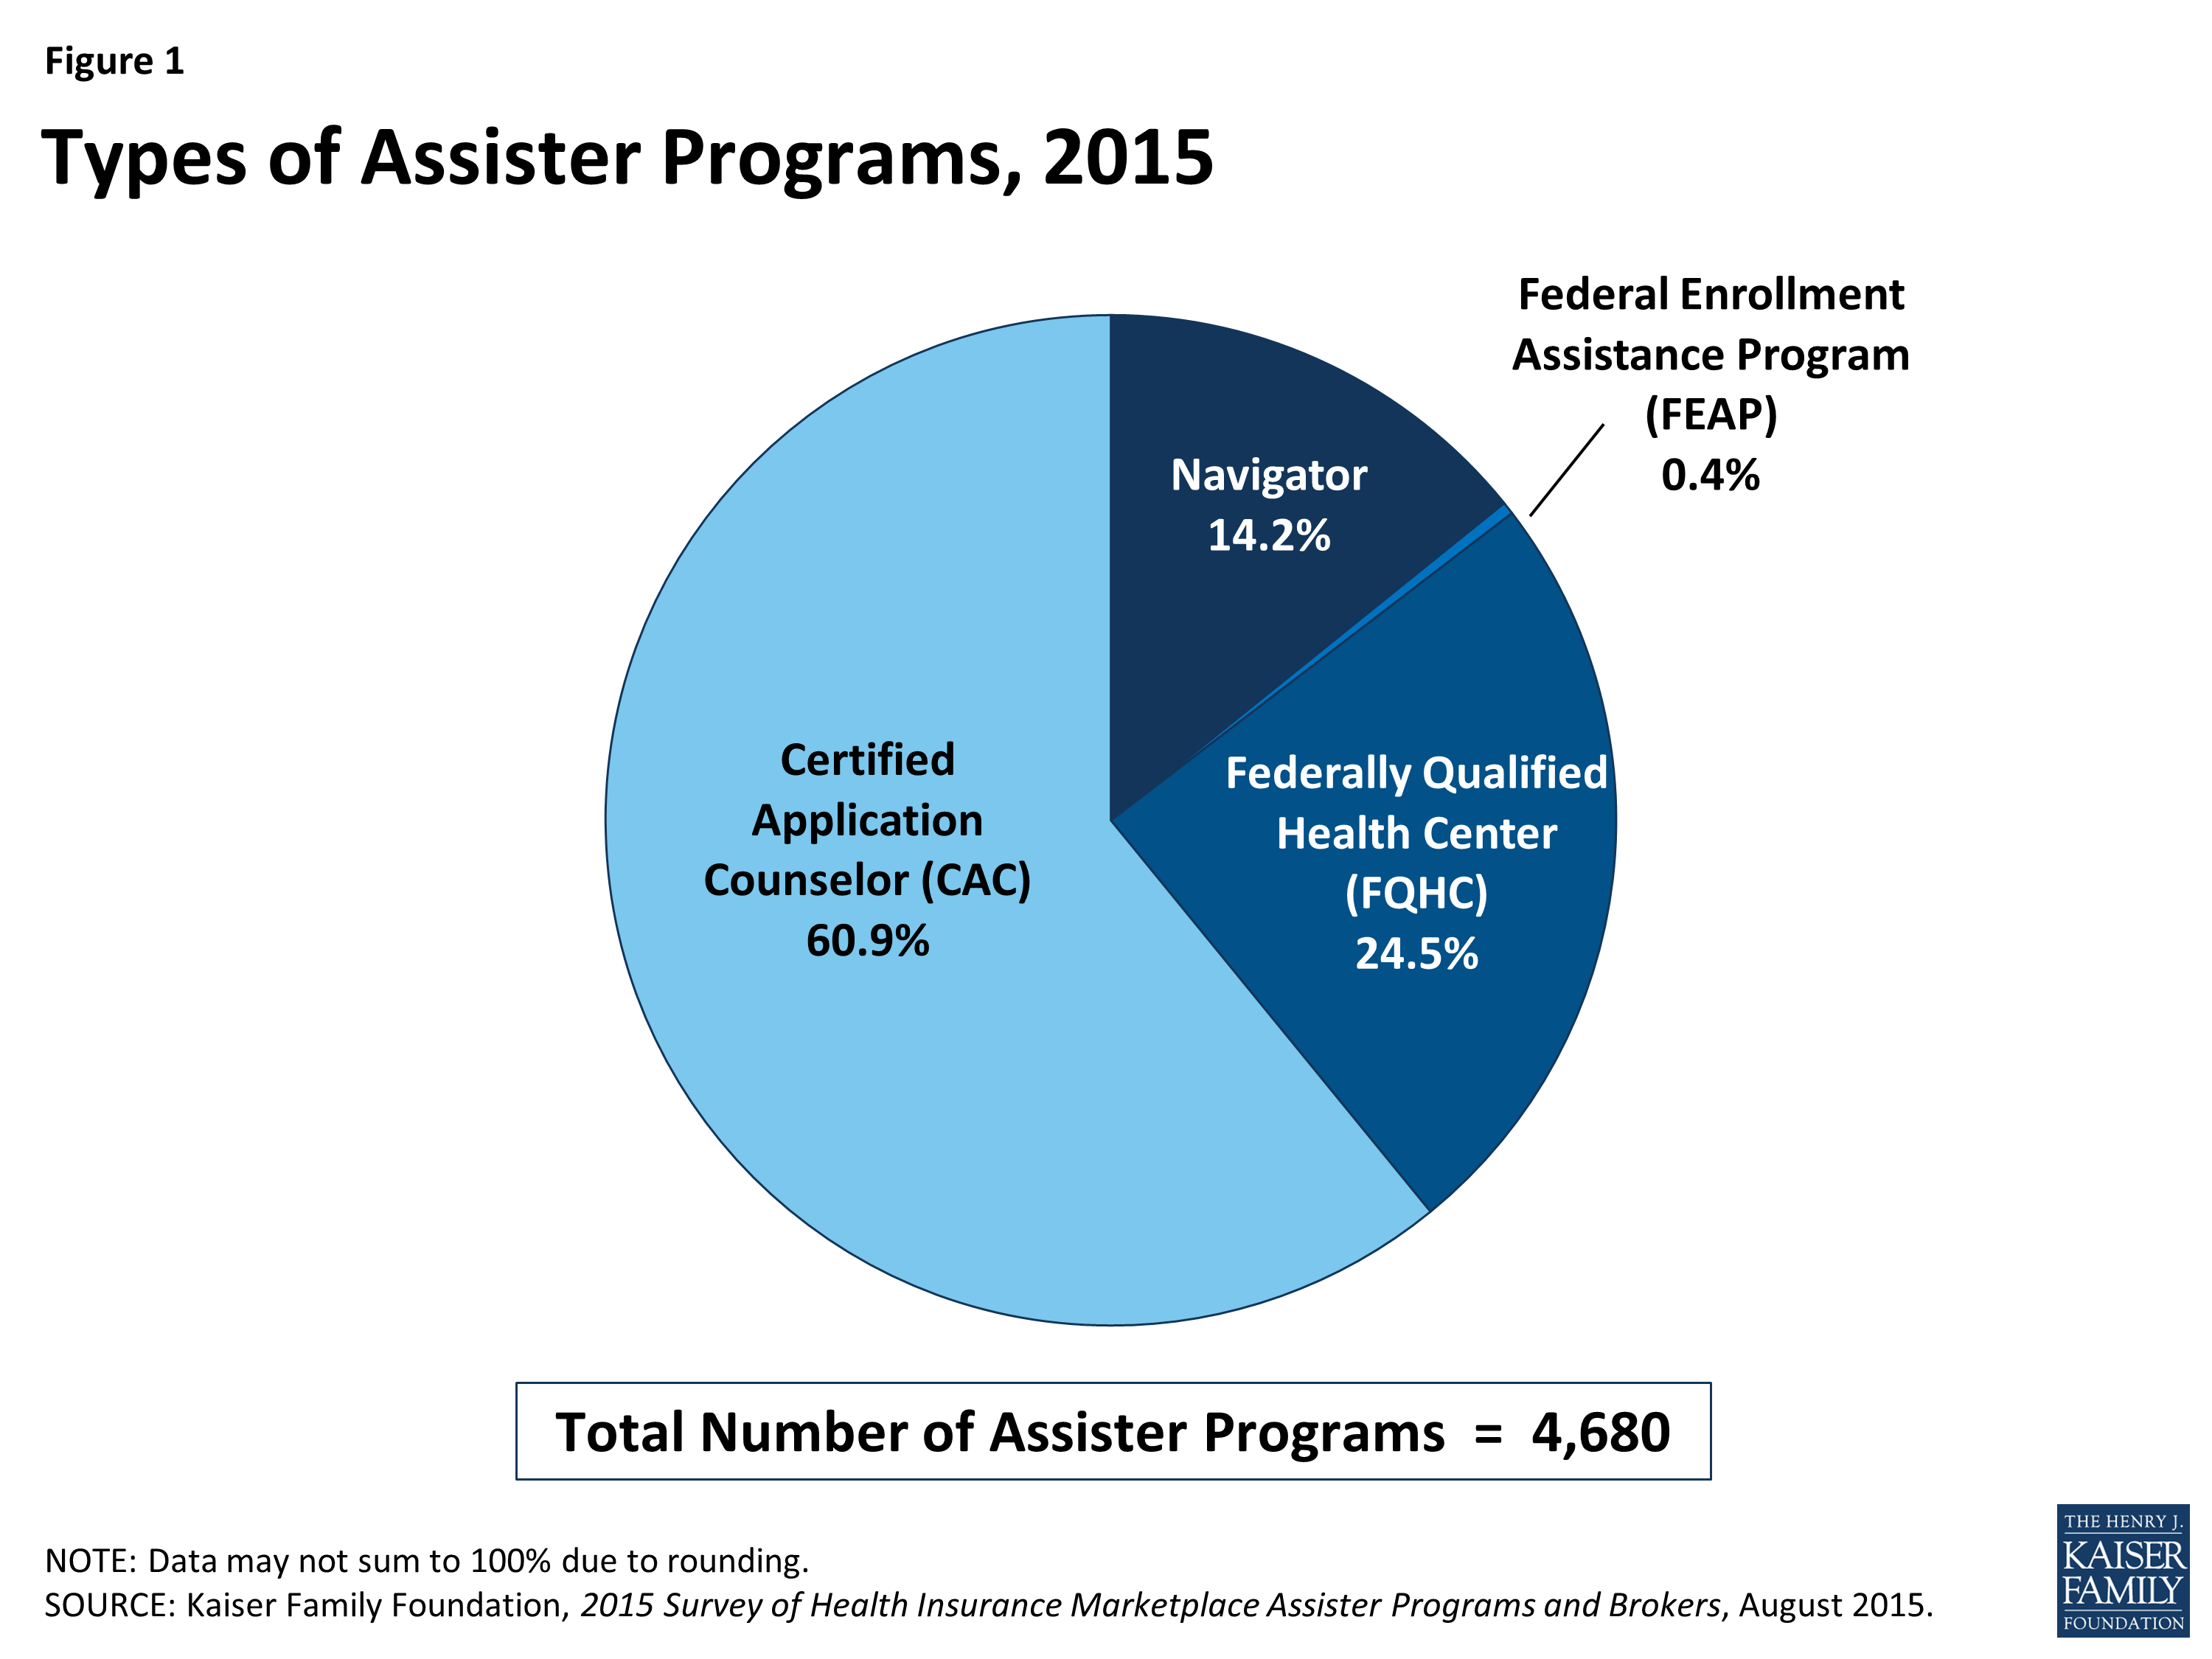
Figure 1: Types of Assister Programs, 2015
Most Assister Programs this year also helped consumers during the first Open Enrollment. Over 90% of Programs indicated they operated during the first year. As a result, these Programs were more experienced. Prior to the first Open Enrollment, just two-thirds of Programs had experience helping consumers enroll in Medicaid and CHIP and only 16% of Programs had previously helped consumers enroll in private health insurance.
Most Assister Programs served specific geographic or population-based communities. Fourteen percent of all Programs operated in a statewide service area, the same proportion as in year one. However, the number of Navigator Programs operating statewide increased to 26% in year two (compared to 17% in year one). This could be attributable to funding requirements that encourage statewide coverage.
Assister Programs varied in size and in the number of consumers they helped. Most Programs have a small staff; 68% have five or fewer full-time-equivalent (FTE) staff, either paid or volunteer, while only 6% of Programs have more than 20 FTE staff. CACs were more likely to have small staff, with 71% of such Programs reporting five or fewer FTE staff, compared to 56% of Navigators. CACs were also more likely to rely primarily on volunteers (19% vs. 4% for other Program types.) These results are similar to year one.
Navigator and FQHC Assister Programs were more likely to report helping large numbers of consumers. This year 40% of Navigators and FQHCs said they helped more than 1,000 people during Open Enrollment. By contrast, 13% of CACs helped more than 1,000 people. This is similar to the distribution in year one. (Table 1)
| Table 1: Assister Programs by Size, Service Area, and Numbers of People Helped | ||||
| Program Characteristics | All Assister Programs | Program Type | ||
| Navigator and FEAP | FQHC | CAC | ||
| Worked during first Open Enrollment | 91% | 95% | 96% | 87%*^ |
| Statewide vs. specific geographic service area | ||||
| Statewide | 14% | 27% | 10%* | 13%* |
| Specific area within state | 80% | 68% | 87%* | 80%*^ |
| Other | 6% | 5% | 3% | 7%^ |
| Paid staff vs. volunteer | ||||
| Most/all volunteers | 13% | 5% | 3% | 19%*^ |
| Most/all paid staff | 87% | 95% | 97% | 81%*^ |
| Number of full-time-equivalent staff and volunteers | ||||
| 5 or fewer | 68% | 55% | 67%* | 71%* |
| 6-10 | 17% | 19% | 22% | 14%^ |
| 11-20 | 7% | 11% | 6% | 6%* |
| 21-50 | 5% | 9% | 3%* | 5% |
| More than 50 | 1% | 4% | 1% | 1% |
| Don’t know/No answer | 2% | 1% | 1% | 3% |
| Mean FTE staff size | 6.8 | 12.2 | 6.1 | 5.8 |
| Number of consumers helped during Open Enrollment | ||||
| 100 or fewer | 32% | 14% | 9% | 45%*^ |
| 101-500 | 31% | 28% | 33% | 30% |
| 501-1,000 | 13% | 17% | 18% | 10%*^ |
| 1,001-2,500 | 13% | 22% | 22% | 8%*^ |
| 2,501-5,000 | 5% | 8% | 10% | 2%*^ |
| More than 5,000 | 5% | 10% | 8% | 3%*^ |
| Don’t know/No answer | 1% | – | 1% | 2% |
| Mean number of people helped per Program | 1,274 | 2,727 | 1,929 | 652 |
| Portion of Consumers helped who were new to Marketplace vs. renewing | ||||
| Most/nearly all renewing or changing | 21% | 18% | 23% | 21% |
| About half new/half renewing or changing | 22% | 26% | 27% | 20% |
| Most/nearly all new to Marketplace | 53% | 52% | 46% | 56% |
|
*Significantly different from Navigator and FEAP at the 95% confidence level; ^Significantly different from FQHC at the 95% confidence level
NOTE: Numbers may not sum to 100% due to rounding.
|
||||
Assister Program budgets this year were mostly modest. Twenty-nine percent of all Programs reported having an annual budget for consumer assistance of $50,000 or less. Slightly more (31%) had annual budgets between $50,000 and $500,000. Only 4% of Programs reported annual budgets larger than $500,000. CACs tended to have the smallest budgets compared to other types of Assister Programs. (Table 2)
Navigators were more likely to receive most of their funding from the Marketplace, while FQHCs relied more heavily on grants from HRSA. CACs were most likely to rely on re-programmed resources from their sponsoring organization or from other sources of private sector support.
| Table 2: Assister Program Budgets and Sources of Funding, FY 2014 | ||||
| All Assister Programs | by Program Type | |||
| Navigator and FEAP | FQHC | CAC | ||
| FY 2015 Program budget | ||||
| Up to $50,000 | 29% | 21% | 13%* | 38%*^ |
| $50,001 – $200,000 | 21% | 28% | 36% | 13%*^ |
| $200,001 – $500,000 | 10% | 21% | 12%* | 7%* |
| $500,001 – $1,000,000 | 2% | 10% | 1%* | 1%* |
| More than $1,000,000 | 2% | 4% | 1% | 2% |
| Don’t know/No answer | 35% | 17% | 37% | 39% |
| Programs receiving most (>50%) of budget from this funding source | ||||
| Grants or other direct payment from Marketplace | 13% | 42% | 3%* | 9%*^ |
| Grants from HRSA, other federal agency | 21% | 10% | 53%* | 11%^ |
| Grants or payments from other state agencies | 5% | 17% | 1%* | 3%*^ |
| Grants from private foundations | 2% | 2% | – | 5%* |
| Grants from other outside private sources | 1% | – | – | 2% |
| Funds re-programmed from sponsoring organization’s own budget | 16% | 2% | 2% | 25%*^ |
|
*Significantly different from Navigator and FEAP estimate at the 95% confidence level; ^Significantly different from FQHC at the 95% confidence level
NOTE: Columns may not sum to 100% because not all Programs received a majority of funding from a single source.
|
||||
Assister Programs engaged in a range of activities during Open Enrollment. Virtually all Programs provided eligibility and enrollment assistance, helping consumers apply for private health insurance and subsidies or for Medicaid and CHIP. Eighty percent of Programs also provided outreach and education to consumers. Beyond outreach and enrollment support, nearly 80% of Programs assisted consumers with post-enrollment questions and problems. Additionally, almost 6 in 10 helped consumers appeal Marketplace eligibility decisions, and new this year, more than 6 in 10 Programs helped consumers with ACA tax-related questions. (Table 3)
These percentages were similar to those reported last year; however, more Assister Programs this year reported helping consumers apply for exemptions from the individual mandate (61% this year vs. 50% last year).
| Table 3: Assistance Activities Conducted by Assister Programs | |
| Activity | % Programs |
| Help individuals apply for Medicaid/Children’s Health Insurance Program | 90% |
| Help individuals compare private health insurance plan (QHP) options | 84% |
| Help individuals apply for premium tax credits and cost sharing subsidies | 81% |
| Outreach and public education to individuals and families | 80% |
| Help individuals with post-enrollment questions and problems (e.g., denied claims) | 79% |
| Help with ACA tax-related questions | 62% |
| Help individuals apply for exemptions from the individual responsibility requirement | 61% |
| Help individuals appeal eligibility determinations | 58% |
| Help other Assister Program staff resolve questions or problems for their clients | 58% |
| Outreach and public education to small businesses | 27% |
Most Programs returned to help consumers for a second year, and almost half of those experienced changes in their staff size and budget. This year 91% of responding Programs said they had also provided consumer assistance during the first Open Enrollment period. Roughly half said their budget and staff size in year two were about the same as in year one. About one-in five Programs grew while about one-in-four experienced declines in their staff or budget. (Figure 2)
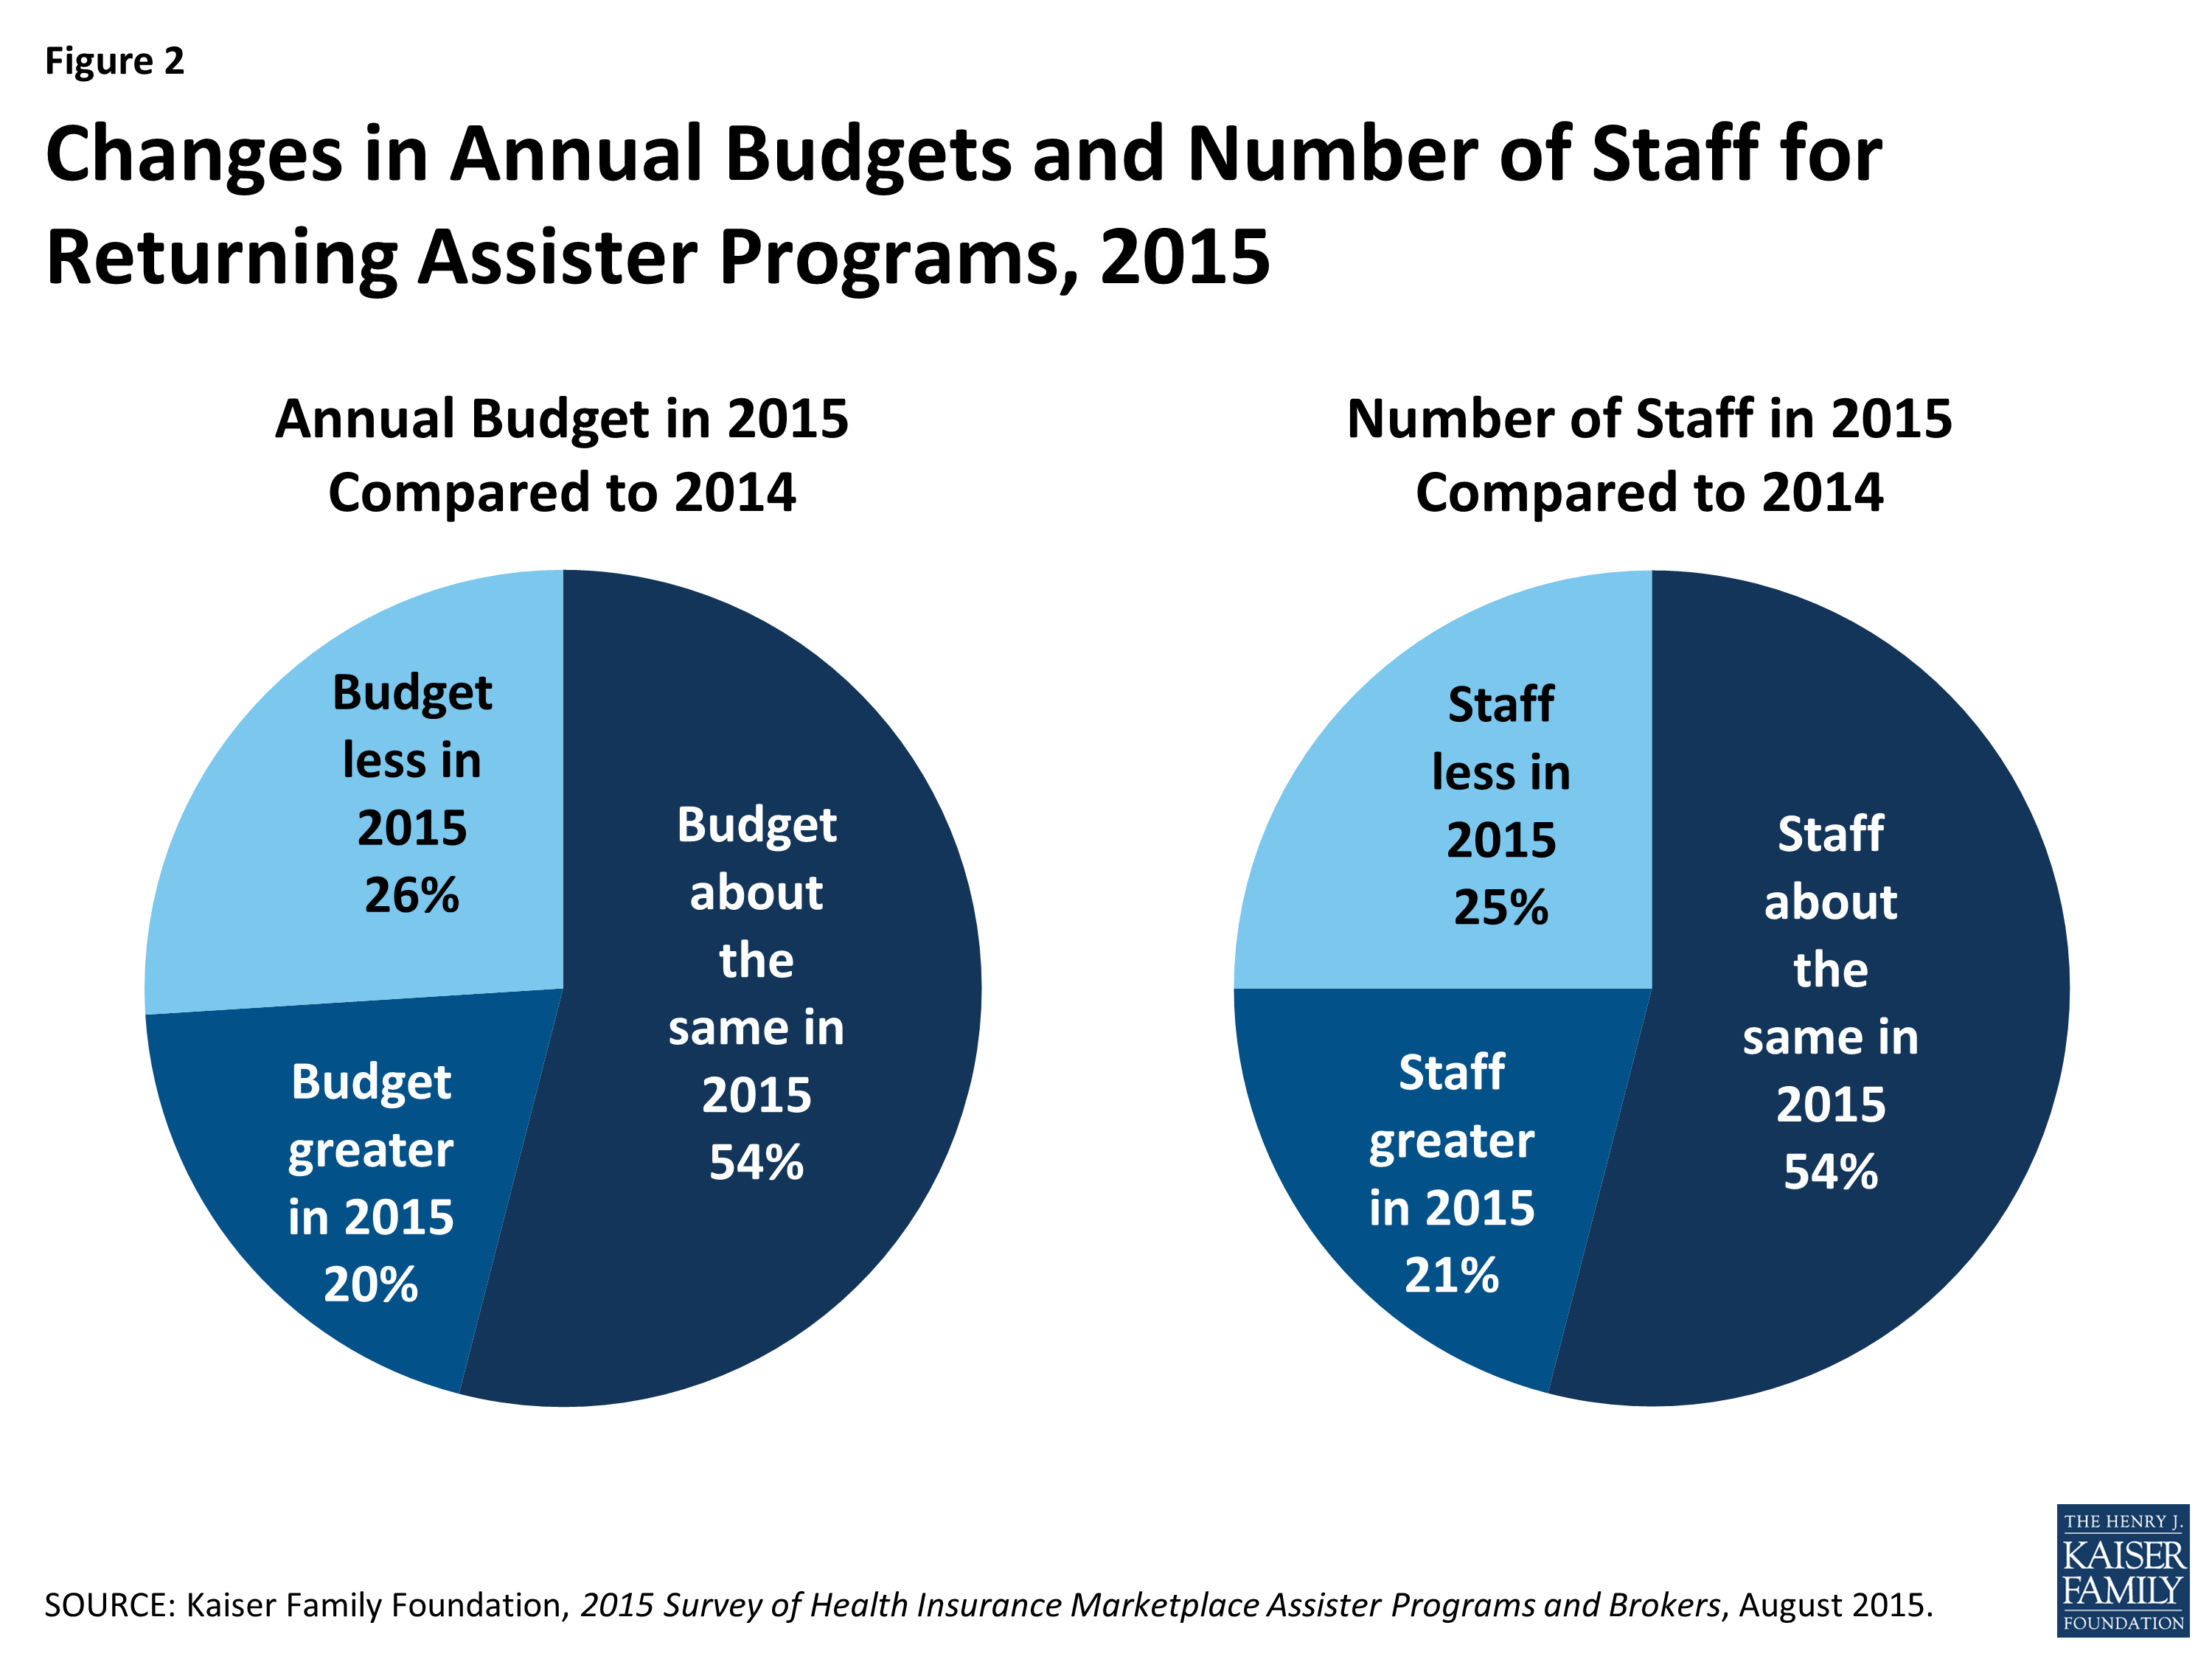
Figure 2: Changes in Annual Budgets and Number of Staff for Returning Assister Programs, 2015
Staff continuity was strong in returning Programs. More than three-quarters of returning Programs said most or almost all of their staff from year one returned to help consumers in year two.