What to Know About Recent Federal Actions Involving State Medicaid Program Integrity
The Trump Administration continues its focus on rooting out fraud, waste, and abuse in federal programs, including Medicaid. In March 2026, President Trump issued an Executive Order establishing the Task Force to Eliminate Fraud, chaired by Vice President J.D. Vance. In May 2026, the Centers for Medicare and Medicaid Services (CMS) announced a six-month nationwide moratoria (or pause) on the enrollment of new Medicare hospice and home health agency providers. The Department of Health and Human Services (HHS) has also taken nationwide and state-specific action in the Medicaid program, including:
CMS state-specific financial action and inquiries:
- In early 2026, CMS used multiple procedures simultaneously to address potential fraud in Minnesota, including deferring (or pausing) $350 million in federal Medicaid funding for past expenditures.
- In May 2026, CMS issued what it reports is the largest deferral in its history, deferring $1.3 billion in federal Medicaid funding for past expenditures in California.
- CMS has also sent letters seeking information about Medicaid program integrity, provider oversight, and fraud prevention to California, Florida, Maine, and New York.
- In April 2026, CMS sent a letter (the same letter went to all states and DC) asking all state Medicaid programs to “swiftly revalidate” Medicaid providers at high risk of “waste, fraud, abuse, and corruption” and to provide a broader strategy on provider revalidations to CMS within 30 days.
- In May 2026, CMS announced the HHS Office of the Inspector General (HHS-OIG) would be initiating a review of every state’s Medicaid Fraud Control Unit (MFCU) before its next annual recertification. In June 2026, three weeks after the 53 state/territory Medicaid Fraud Control Units (MFCUs) received notice that they would be under review, HHS announced that it is denying the Hawaii MFCU’s annual recertification, which discontinues federal funding for the Fraud Control Unit.
Federal request for information:
- In February 2026, CMS released a Request for Information (RFI) seeking input on how CMS can more effectively combat fraud, waste, and abuse in Medicaid/CHIP, Medicare, and the ACA Marketplaces.
There are no reliable measures of fraud against Medicaid. Measuring fraud is difficult, in part, because it can only be determined with certainty after the fact and if it is identified (through recovery and enforcement actions). Recovery and enforcement data show that in 2025 the 53 state and territory Medicaid Fraud Control Units reported $2 billion in recoveries1.
The current use of payment deferrals, given the magnitude of federal funding at stake and the time it takes to resolve administrative disputes, creates uncertainty and could be destabilizing for state budgets. If states have inadequate funding to maintain existing Medicaid programs, they may face difficult decisions regarding how to limit Medicaid spending or divert spending from other state programs. Additionally, new program integrity requests come at a time when states are facing historic reductions in federal Medicaid funding and new administrative requirements, including implementing work requirements and more frequent eligibility renewals for Medicaid expansion adults. Against this backdrop, this brief describes recent HHS actions (state-specific and nationwide) related to Medicaid program integrity and outlines some open questions going forward.
How has CMS engaged with individual states on program integrity?
CMS focused its increased state-specific Medicaid oversight first on Minnesota. In response to potential fraud in Minnesota, CMS applied a new approach by separately using both deferrals of payments for services already delivered and announcing potential withholding of future federal funds. In January 2026, CMS announced the potential withholding of future federal funds ($515 million in federal Medicaid matching payments per quarter) but has since accepted Minnesota’s corrective action plan. This resolves the threat of the withhold, provided the state successfully implements the corrective action plan. The corrective action plan includes 17 specific elements (e.g., a pause on accepting new providers into 13 high-risk Medicaid service categories, revalidation of more than 5,500 Medicaid providers, increased use of data analytics to review claims before they are paid) as well as specific implementation dates. CMS’s approval of the corrective action plan does not resolve the ongoing, separate, deferral process.
As of June 8, 2026, CMS has deferred federal payments totaling $350 million for Medicaid expenditures incurred by Minnesota. The first deferral, announced February 25, 2026, temporarily halts $259 million in federal payments for expenditures incurred in quarter four of FY 2025, and remains in place after a District Court denied the state’s request to block the CMS action and require it to release the funds to the state. While the ruling noted that the deferral “likely complies with the controlling federal regulations” it also noted the deferral is “historically unprecedented in its size and timing” (Figure 1).
On April 29, 2026, CMS notified Minnesota that it was deferring an additional $91 million in federal Medicaid funding for past expenditures incurred in quarter one of FY 2026, bringing the total amount of deferred federal funds to $350 million. On May 7, 2026, the District Court granted a joint motion submitted by both CMS and Minnesota, which pauses litigation “for 120 days so that [CMS and Minnesota] can attempt to resolve the deferrals.” CMS and Minnesota must submit a status report to the Court by September 3, 2026.
Previously, CMS requested documentation from Minnesota for Medicaid fee-for-service and managed care encounters to determine the allowability of the deferred state expenditures. The typical process to resolve a deferral can take months as the state and CMS have specific, sequential timeframes for response (which can also be extended); however, it’s unclear how the typical timeframe aligns with the 120-day litigation pause. In the meantime, Minnesota will remain without access to the deferred federal funds.
CMS has also deferred $1.3 billion in federal funds for California. CMS announced this deferral on May 13, 2026, reporting it as the largest in CMS history. Unlike the compliance (withholding) process, which requires an initial hearing opportunity before CMS may impose financial penalties, a deferral pauses federal payments for state claims until the state can demonstrate the allowability of those claims. The deferral halts reimbursement for the federal share of certain expenses California claimed in quarter four of FY 2025. Of the $1.3 billion in deferred funds, $1.1 billion are deferrals of home care (services that help older adults and people with disabilities with self-care) expenditures, while the remaining $200 million is part of an ongoing federal review of a variety of claims unrelated to home care (Box 1). The state reiterated that increased spending on Medicaid home care reflects state and federal policy choices to increase the availability of home care.
Box 1. CMS deferred $1.1 billion in federal financial participation for home care services claimed by California in quarter four of FY 2025.
On April 2, 2026, CMS requested that within 2 weeks California provide claims data related to certain home care services. California requested an extension, which CMS declined. The state submitted two rounds of partial data, completing the request on May 7, 2026. However, CMS reported that due to the lag in time it took the state to respond, it derived the home care deferral amount using the following estimation processes:
- $501 million (44%) of the home care deferral was determined based on the “significant growth” observed in the state’s claiming (between FFY 2023 and FFY 2025) relative to other states. CMS calculated this deferred amount “to estimate the questionable claims related to [CMS’s] concerns with the growth rate and was used for deferral purposes since the state did not timely provide the requested data.”
- $632 million (56%) of the home care deferral was derived by applying “program integrity metrics” to identify “statistical outliers” and delayed claims from the data California supplied in response to the CMS’s request. The deferral letter does not describe how statistical outliers are identified.
With deferrals, CMS pauses payment for state Medicaid expenditures that have already occurred and requires the state to provide additional information demonstrating that expenditures are “allowable.” If CMS ultimately disallows some or all of the federal matching payments that have been deferred, the state could request reconsideration from CMS or appeal with the Departmental Appeals Board. If an appeal is unsuccessful, the state could seek relief in U.S. District Court. While CMS and Congress2 have initiated probes into other state Medicaid programs, requesting detailed information about each state’s program integrity policies and procedures, CMS has only publicly announced deferrals in two states (Minnesota and California) and compliance action (resulting in a corrective action plan) in Minnesota (Figure 2).
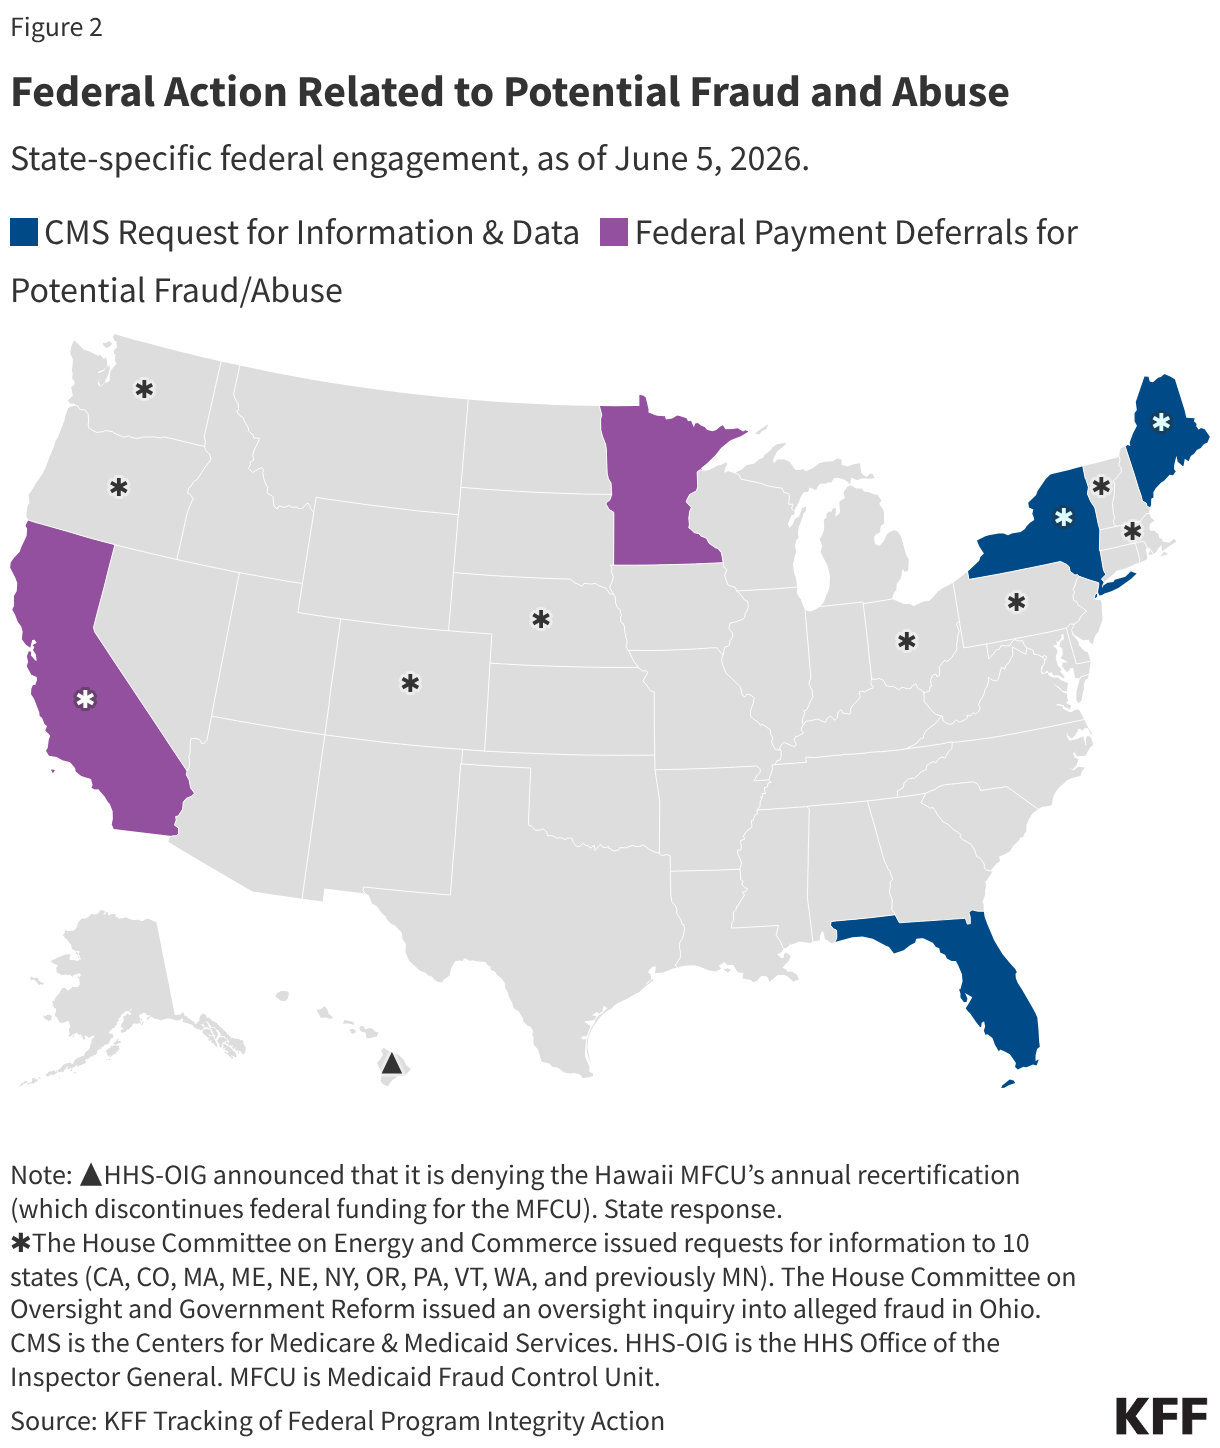
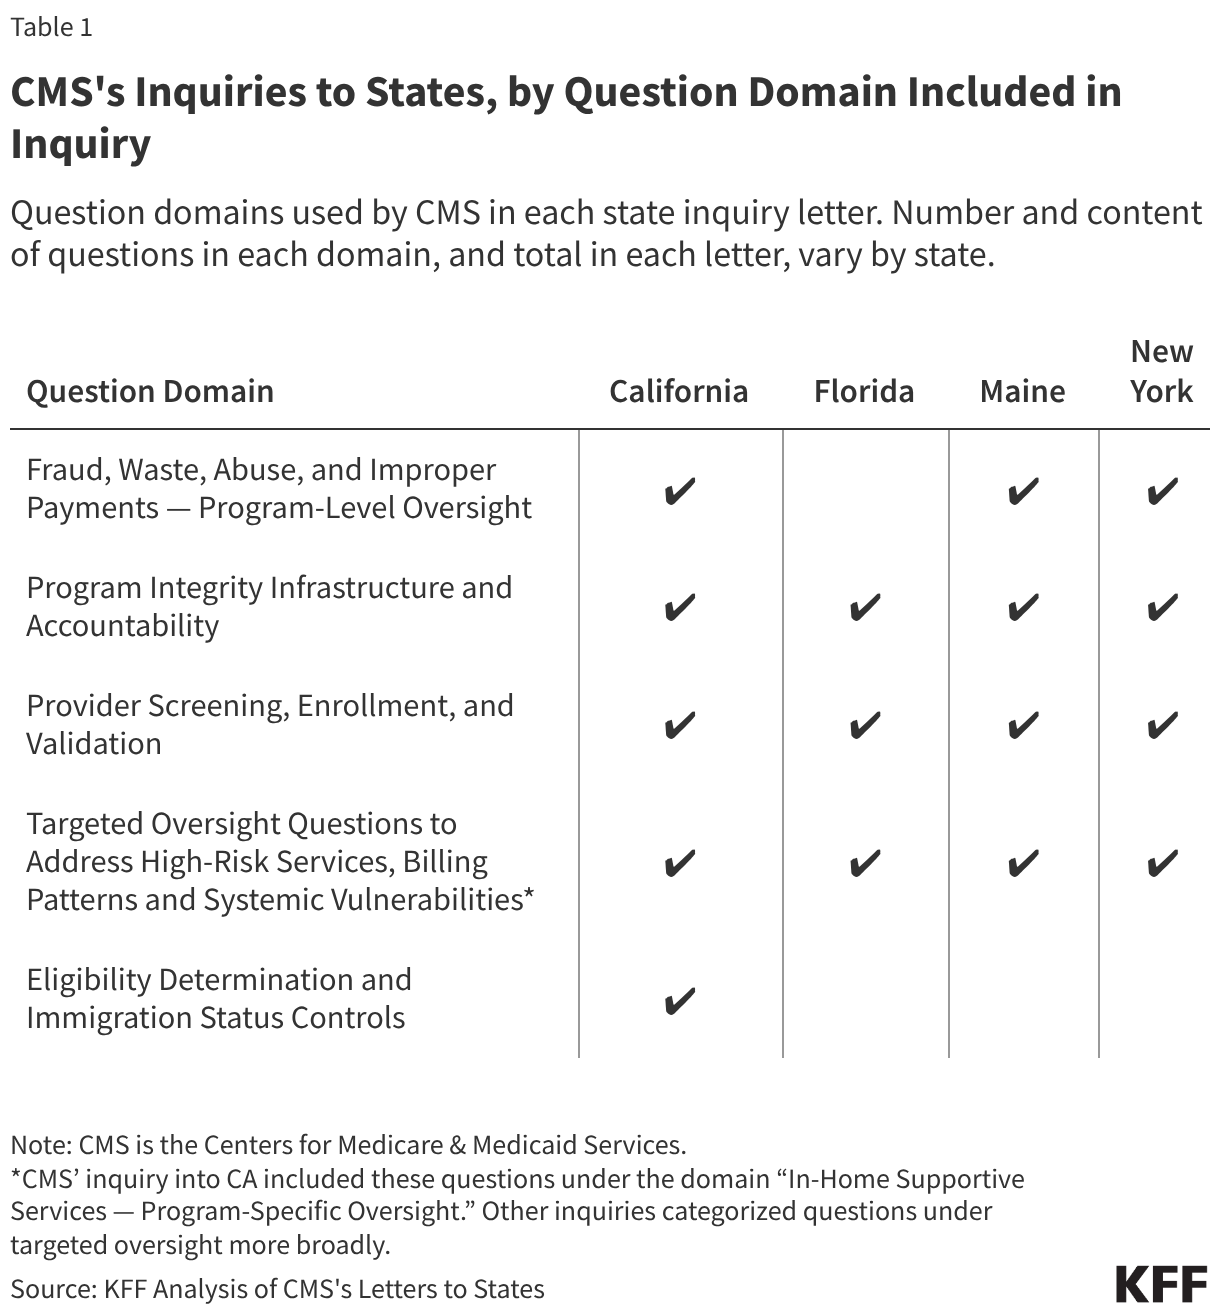
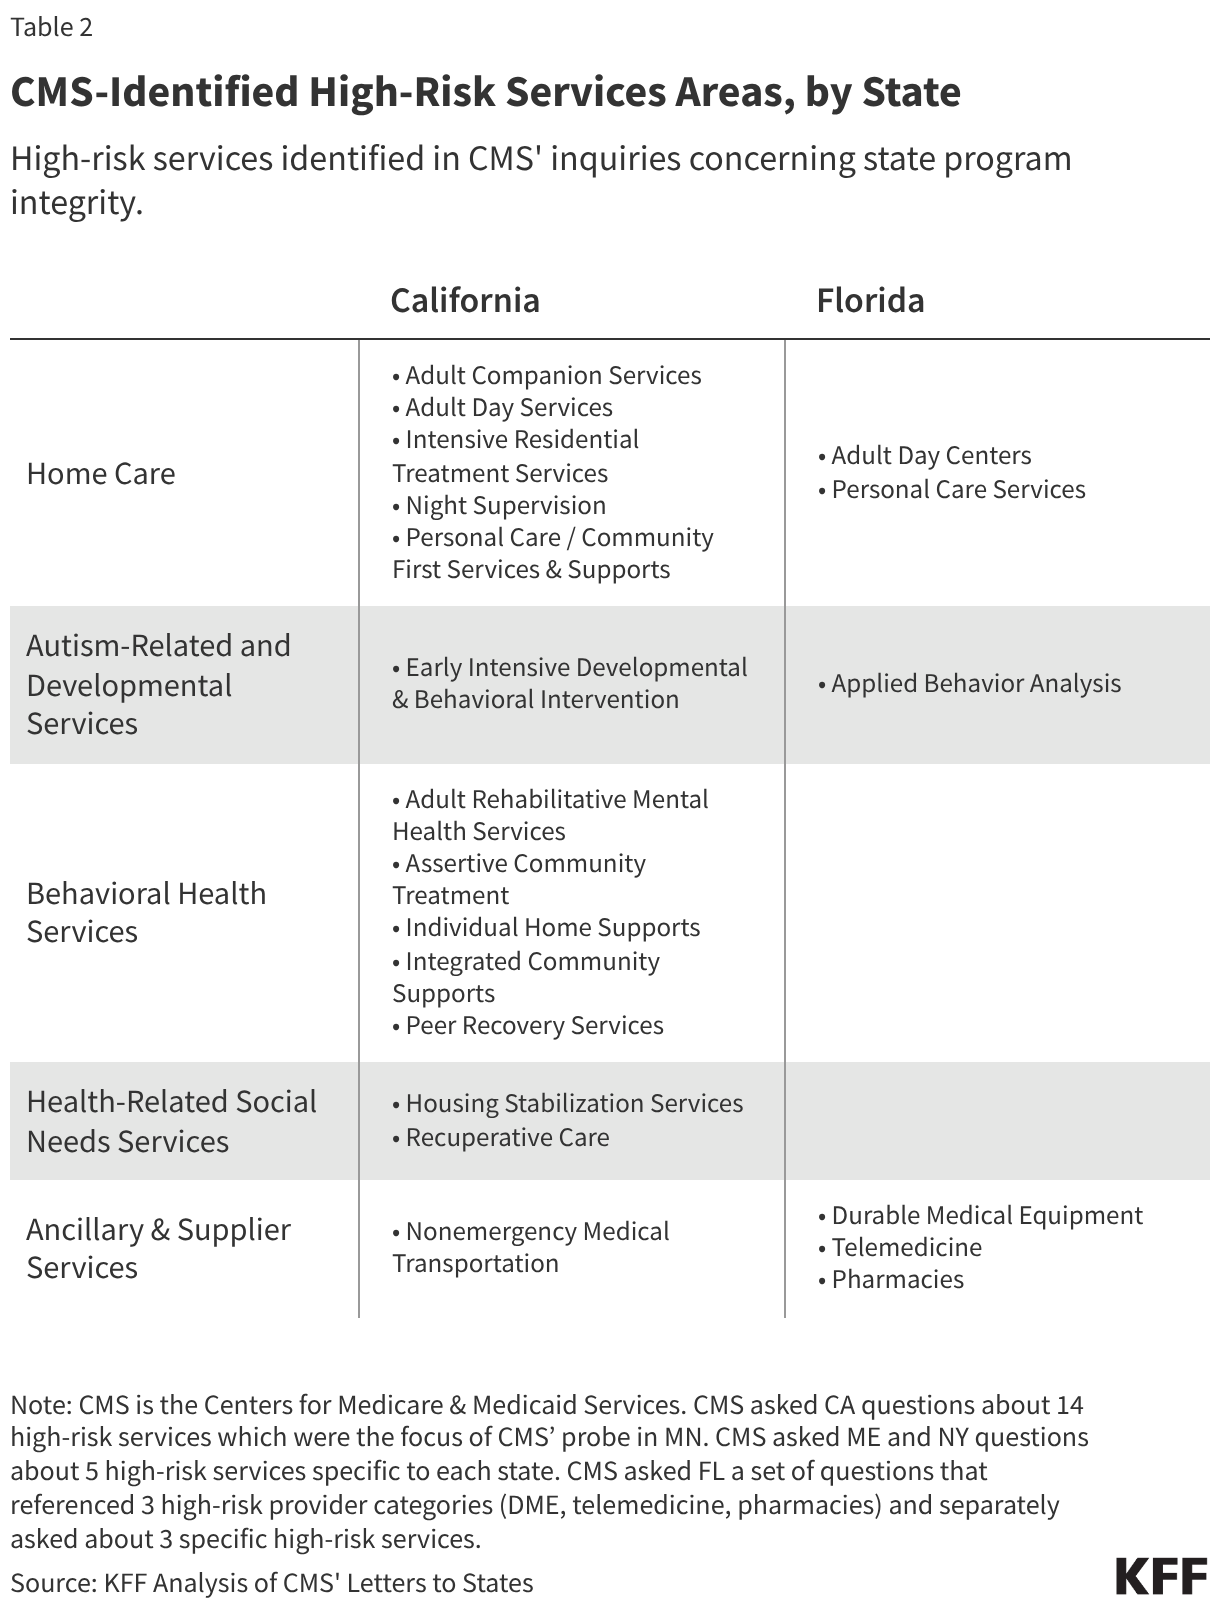
In addition to taking compliance action (MN) and issuing deferrals (CA, MN), CMS has sent letters seeking detailed information about Medicaid program integrity to four states (CA, FL, ME and NY) (Figure 2). In each letter, CMS posed a series of program integrity related questions (Table 1). States were asked to supply program integrity process and policy information as well as specific data. The inquiries could provide some insight into broader federal program integrity priorities, and/or could be part of a process that eventually leads to compliance action or payment deferrals. CMS laid out context for each inquiry including concerns stemming from recent fraud cases in the state and/or analyses of state claims showing growth in the use of certain “high-risk” services, although CMS publicly confirmed errors in analysis related to New York Medicaid data. The high-risk services cited by CMS are specific to each state, except for California (for which CMS cited the 14 high-risk services of focus in Minnesota) (Table 2). The high-risk services (e.g., behavioral health or certain autism-related services, home care, or non-emergency medical transport (NEMT) services) identified by CMS (across states) may have risk factors or vulnerabilities (e.g., new, complex, or hard-to-verify services, or services delivered outside traditional health care settings).
As of June 8, two state responses have been made public. California and Maine have made their responses to CMS’s inquiries publicly available. Both states:
- Provided detailed answers to CMS questions and additional context in response to the motivating factors described in the CMS letters.
- Emphasized that the trends reported by CMS do not necessarily indicate fraud, waste, or abuse, but instead are the result of policy and payment choices (approved and often encouraged by CMS) to increase enrollees’ access to and use of certain services (e.g., home care and behavioral health services).
- Characterized existing program integrity infrastructure and program integrity processes as robust, with multi-layered safeguards, reporting current practices often go beyond minimum federal requirements.
What new provider revalidation actions have been initiated by CMS?
On April 23, 2026, CMS sent a letter to all 50 Governors and issued a State Medicaid Director (SMD) letter asking states to “swiftly” re-validate “high-risk” Medicaid providers and to develop a comprehensive two-year provider revalidation strategy to submit to CMS. Providers must meet certain state and federal requirements to be eligible to participate in the Medicaid program. States3 must screen every provider that applies to participate in Medicaid before the provider initially enrolls in Medicaid and again at renewal of a provider’s enrollment. Screening requirements increase based on the risk category assigned to the provider (by the state, within federal parameters).4 Under minimum federal requirements, all providers undergo license verification and are checked against federal databases. In addition to these screening and verification steps, moderate- and high-risk providers must pass a site visit, and high-risk providers must pass fingerprint background checks. Under minimum federal rules, a provider is designated “high-risk” according to criteria, including based on provider type (e.g. newly enrolling home health agencies and durable medical equipment (DME) suppliers) or past program integrity issues (e.g., excluded by HHS-OIG or a state Medicaid agency or subject to a payment suspension (based on credible allegation of fraud) within the past 10 years). Screening and verification activities are performed again during renewal of the provider’s enrollment. States must renew every Medicaid provider’s enrollment validation no less frequently than every five years.
CMS requested that states confirm whether they will immediately revalidate “high-risk” Medicaid providers. CMS acknowledges that factors contributing to fraud are multi-faceted and require a comprehensive approach to address; however, CMS notes revalidating high-risk providers immediately may help deter criminal actors and allow federal/state governments to suspend or terminate them from the program. CMS notes classes of Medicaid providers with less rigorous enrollment and billing requirements (e.g., CMS cites providers without a National Provider Identifier (NPI) are most vulnerable to fraud. States have flexibility to designate which providers are “high-risk,” though CMS expects the definition to include any provider without an NPI (Box 2).
CMS requested that states notify them of their intent to carry out immediate revalidation of high-risk providers within 10 days of receipt of the letter, along with a proposed timetable for revalidation. CMS noted that failure to immediately revalidate high-risk providers would be “considered as we [CMS] evaluate the likelihood of fraud in each state moving forward.” Some states have publicly expressed their intent to conduct accelerated, off-cycle provider revalidation exercise, while others have emphasized compliance with CMS’s request as part of a broader, coordinated fraud prevention effort.
Box 2. An NPI is a unique ID number that identifies the provider who referred, ordered, or delivered services billed on health care claims.
NPIs were introduced in 19965 to improve efficiency and reduce errors in electronic health care claims. Federal law requires an NPI from all medical providers (e.g. physicians, dentists, or nurses) and organizations (e.g. hospitals, pharmacies, or physician practices) who participate in electronic health care claims. Non-medical providers may deliver certain Medicaid services, particularly home care services; these providers may not have an NPI due to federal rules describing who is required and permitted to obtain an NPI.
CMS also requested that states develop a broader strategy on provider revalidations. CMS requested states develop and submit a comprehensive two-year provider revalidation strategy within 30 days of receipt of the letter as well as the strategy’s results upon completion. CMS notes the provider revalidation strategy should be tailored to the unique landscape of the state and prioritize a comprehensive review and revalidation of the state’s enrolled Medicaid providers. CMS asks states to increase oversight of high-risk providers (including by adopting off-cycle or more frequent revalidation intervals than the minimum five-year requirement and potentially prioritize high-risk providers who have not been screened within the past 12 months for revalidation.) CMS notes that states should define the scope and priorities of their provider revalidation strategies, but asked that certain elements be included:
- Methodology and timeline for conducting off-cycle revalidation, with a focus on high-risk providers (including those without an NPI)
- Metrics to measure the revalidation strategy effectiveness
- Approach for confirming provider information is accurate and up to date, on an ongoing basis (across fee-for-service and managed care delivery systems) approach to coordinating with relevant law enforcement partners
How has HHS-OIG heightened scrutiny of state Medicaid fraud control units (MFCUs)?
On May 13, 2026, HHS Investigator General Bell sent a letter to every state Attorney General communicating a stance of “insistence on rigid MFCU compliance” with requirements and performance standards that will be enforced through “robust review” by the HHS-OIG. Each state must have a Medicaid Fraud Control Unit (MFCU) to investigate fraud and prosecute or refer to prosecution individuals or entities defrauding Medicaid. MFCUs are required to operate independently from state Medicaid agencies. MFCUs are usually a part of the State Attorney General’s office and are primarily funded by federal matching funds6 from HHS-OIG (not CMS). While MFCUs and state Medicaid agencies closely cooperate, each has distinct roles and responsibilities. MFCUs investigate potential Medicaid fraud/abuse. In 2025, MFCUs reported 1,185 convictions and $2 billion in recoveries (or $4.64 for every $1 spent). State Medicaid agencies implement a wide range of strategies to prevent and detect fraud, waste, and abuse. (For example, state Medicaid agencies screen and enroll providers, conduct data analytics and surveillance (e.g., to detect unusual billing patterns and outliers/anomalies), perform audits, and create fraud/abuse reporting channels for providers and enrollees.)
Federal requirements and performance standards serve as the basis for MFCU annual recertification by HHS-OIG (which oversees MFCUs). When a MFCU applies for annual recertification, the MFCU submits performance and budget data, including staffing, costs, case numbers and outcomes, and other information requested by HHS-OIG. HHS-OIG may conduct an onsite review of the MFCU. In the May 13 letter, the HHS-OIG communicated to states that “As your MFCU’s annual recertification deadline approaches, [HHS-OIG] will be reaching out … to review the effectiveness of your MFCU, as well as its compliance with program requirements,” further noting that “noncompliance with your MFCU obligations can take your State’s entire Medicaid program out of compliance.” While the letter from HHS-OIG does not communicate an upcoming policy change related to MFCU requirements, MFCUs may face increased scrutiny and pressure to produce enforcement outcomes that satisfy HHS-OIG. In June 2026, three weeks after 53 state/territory Medicaid Fraud Control Units (MFCUs) received notice that they would be under review, HHS announced that it is denying the Hawaii MFCU’s annual recertification, which discontinues federal funding for the Fraud Control Unit. A statement from the Governor confirmed the state’s Medicaid program remains in good standing.
What is the CRUSH Request for Information (RFI)?
On February 25, 2026, CMS issued a Request for Information (RFI) for the “Comprehensive Regulations to Uncover Suspicious Healthcare” (CRUSH) initiative. In this RFI, CMS requested information on how to strengthen program integrity efforts across CMS programs (e.g., Medicare, Medicaid, CHIP, and the Affordable Care Act Marketplace). RFI responses were due March 30, 2026. CMS requested information about specific topics, including:
- Potential expansions or modifications to existing program integrity laws/rules
- Enhanced provider enrollment and identity verification
- State-level program integrity oversight, particularly of high-risk services
Responses to the RFI include potential actions the federal government could take to improve program integrity, including recommendations for how CMS can support states. While an RFI is an official process that agencies commonly use to collect information from the public to inform a future rule, the RFI does not commit CMS to take any specific action, and future rulemaking does not always occur nor lead to regulation taking effect. CMS or its contractors are likely still conducting comprehensive reviews of stakeholder responses to the RFI, but more than 500 responses to the RFI are publicly available. A variety of organization types responded to the RFI including respondents from health care industries, trade associations, policy research organizations, and advocacy groups.
The Medicaid and CHIP Payment and Access Commission (MACPAC), a nonpartisan federal legislative branch agency that provides recommendations to Congress, built upon the body of existing MACPAC work in their response. Recommendations included:
- Comprehensively review existing federal requirements to reduce duplication and focus on requiring or supporting activities that deliver returns on investment
- Enhance payment transparency and data sharing
- Examine existing barriers to program integrity in managed care and promote successful state practices
What to watch in future program integrity-related developments?
Recent CMS action related to program integrity has been focused both on specific states as well as initiatives and requests that affect all states. Many open questions remain, including:
- Whether future compliance actions or deferrals will impact states beyond Minnesota and California,
- Whether state responses to CMS’s provider revalidation exercise will become public, including comprehensive details on how provider classes are categorized as “high-risk,”
- What are the implications of the focus on providers without NPIs (will more non-medical providers obtain NPIs, or will there be fewer providers for certain services?)
- Whether the OIG letter to state Attorneys General will lead to an increase in indictments, convictions, and fraud recoveries by state MFCUs,
- Whether CMS pursues rulemaking or sub-regulatory action following the RFI,
- Whether CMS and HHS-OIG have capacity to carry out recently announced activities,
- Whether Congress will enact legislation changing current Medicaid program integrity requirements, and,
- Whether increased oversight requires trade-offs with access to care or services.
- The FY 2025 MFCU Statistical Chart notes that “Recoveries are defined as the amount of money that defendants are required to pay as a result of a settlement, judgment, or prefiling settlement in criminal and civil cases and may not reflect actual collections. Recoveries may involve cases that include participation by other Federal and State agencies.” ↩︎
- On March 5, 2026, the House Committee on Energy and Commerce issued inquiries to 10 states requesting information about state Medicaid program integrity (Figure 2). ↩︎
- States are permitted to delegate provider screening responsibilities to managed care organizations but must maintain oversight of screening activities. ↩︎
- Federal law requires that states assign ‘limited,’ ‘moderate,’ or ‘high,’ risk categories to providers. States assign risk categories to providers based on several guidelines, including the Medicare risk category for that provider type, provider-specific risk factors (e.g., receiving a prior Medicaid overpayment), and audit findings assessing the fraud, waste, or abuse risk of a specific provider type. While federal rules establish minimum risk levels, states can choose to use higher risk levels across a provider type and can change a provider’s risk level based on new information (e.g., following credible allegations of fraud, waste, or abuse). ↩︎
- NPIs were introduced and mandated by the Health Insurance Portability and Accountability Act (HIPAA). ↩︎
- The federal government reimburses states for MFCU costs. States that have operated MFCUs for longer than 12 quarters receive reimbursement for 75% of allowable costs incurred operating a MFCU; states contribute the other 25% share. ↩︎